Embed Size (px)
Citation preview
Community Food
Projects
Indicators of Success
Fiscal Year 2010
Provided by the Community Food Security Coalition with funding from a Training and
Technical Assistance Community Food Project Grant through the National Institute for Food
and Agriculture
3830 SE Division Street • Portland, OR 97202 503-954-2970 • www.foodsecurity.org
Prepared by National Research Center, Inc.
3005 30th Street • Boulder, CO 80301 303-444-7863 • www.n-r-c.com

Community Food Projects Indicators of Success FY2010
Community Food Security Coalition
C o n t e n t s
Executive Summary .................................................................................................. 1
Introduction ............................................................................................................. 8
Community Food Security and the Community Food Project’s Competitive Grant Program.................................................................................................................... 8
Study Methods ........................................................................................................................ 10
Study Limitations ..................................................................................................................... 11
The Activities of Community Food Projects .......................................................... 12
Indicators of Success .............................................................................................. 15
Healthy People ........................................................................................................................ 15
Strong Communities ............................................................................................................... 21
Thriving Local Economies ...................................................................................................... 26
Vibrant Farms and Gardens ................................................................................................... 29
Sustainable Ecosystems ......................................................................................................... 32
Justice and Fairness ................................................................................................................ 35
Conclusion .............................................................................................................. 39
Appendix A: Methods ............................................................................................. 42
Appendix B: Unweighted IOS Results .................................................................. 44
Appendix C: Participant Impact Survey Results .................................................... 51
Appendix D: Definitions .......................................................................................... 57
Community Food Projects Indicators of Success FY2010
1 Community Food Security Coalition
E x e c u t i v e S u m m a r y
Introduction and Methods
The USDA-funded National Institute for Agriculture (NIFA) Community Food Projects (CFP) Competitive Grants Program (CFPCGP) was designed to meet the food needs of low-income people; to increase the self-reliance of communities in meeting their own food needs; and to promote comprehensive responses to local food, farm and nutrition issues. Since its inception in 1996, over 300 programs have been funded through CFPCGP. (CFPCGP was formerly administered through CSREES).
To assess the collective impacts of this program, the web-based Indicators of Success (IOS) was developed to track and monitor the important and common outputs and outcomes of the projects. The CFP IOS was based on the Common Output Tracking Form (COTF) originally developed in 2005 to track common activities and results among the diverse and dynamic Community Food Projects. The CFP IOS reflects a focus on outcomes (e.g., economic and social equity, healthy food access) of CFP grantees and includes a participant survey component, or the Participant Impact Survey (PS), which measures the knowledge, attitude and behavior changes of project participants.
The CFP IOS is one of two reporting vehicles requested of CFP grantees in addition to their annual required CRIS (Current Research Information Systems) report and financial documents. The CFP IOS is administered by the Community Food Security Coalition (CFSC) and is part of CFSC’s Training and Technical Assistance CFP grant. Together, the four reporting vehicles collect data that demonstrate the impact of Community Food Projects towards increasing community food security across the country.
Fiscal year 2010 marked the sixth year that grantees were asked to submit data on their program activities and outcomes. Of the 81 grantees funded for fiscal year 2010, 34 completed the IOS providing a response rate of 41%. Over the six-year reporting period, 334 grantees were funded through the CFPCGP. Of these, 225 Community Food Projects completed the form – providing annual response rates ranging from 37% to 79% and a response rate overall of 60%. (The response rate in fiscal year 2010 was lower due to an end of year launch date for the new CFP IOS tools.) These data were statistically weighted to represent the results of 100% of the active grantees operating between 2005 and 2010.
CFP Indicators of Success Report Structure
This report provides a summary of the 2010 grantee IOS reporting and PS survey results, as well as estimates for the entire six years data that have been collected on CFP activities. It is structured according to the fields of Whole Measures for Community Food Systems (WM CFS) (http://www.foodsecurity.org/pubs.html#wm). These fields include Healthy People, Strong Communities, Thriving Local Economies, Vibrant Farms and Gardens, Sustainable Ecosystems and Justice and Fairness. Together, these value based practices reflect a vision for whole communities seen through the lens of community food system development. Whole Measures CFS was developed with input from over one hundred Community Food Projects.
Community Food Projects Indicators of Success FY2010
2 Community Food Security Coalition
The Activities of Community Food Projects
Grantees were involved in myriad activities to support community food security the most common being food access and outreach, entrepreneurial food and agricultural activities and youth/school gardening and agricultural projects. Local food distribution, the promotion of local food purchases and provision of training and technical assistance were additional types of activities pursued by nearly one-half of the USDA sponsored food projects during the 2010 fiscal year. Youth/school projects, the promotion of local food purchases and community gardens have been the most common activities of CFPs since 2005.
HEALTHY PEOPLE
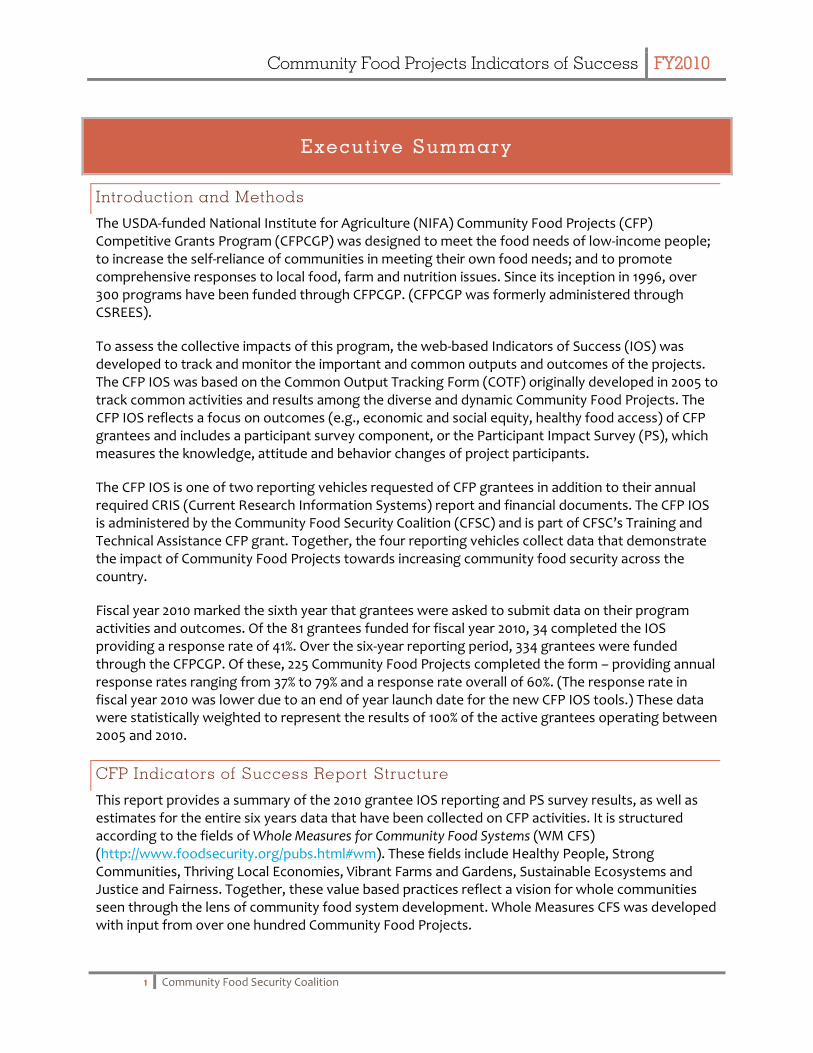
In a nation simultaneously challenged with hunger and obesity, the importance of healthy food for all is evident. In 2010, the active CFPs are estimated to have generated and handled more than 1.3 million pounds of food including fruits and vegetables, meats, dairy items, eggs and honey.
Figure 1: Methods Used to Generate and Handle Food (in Pounds), 2010
The number of people and organizations involved in and affected by these Community Food Projects during 2010 was significant. Nearly 164,000 Americans were provided food as a result of the programs and about 9,200 were K-12 students or youth attending summer programs. Customers and food recipients varied in age, race and ethnicity and most resided in low-income areas. Over 30,000 Americans receiving food from the CFPs were involved in USDA Food Assistance programs:
4,700 were Farmers’ Market Nutrition Program (FMNP) participants
11,100 were Supplemental Nutrition Assistance Program (SNAP, formerly food stamps) recipients
9,300 were elderly meal recipients
5,400 were Women, Infants, and Children (WIC) Program recipients
Nine of 10 CFP participants reported that they were healthier, provided healthier food for their families, and had increased their consumption of fruits and vegetables as a result of participating in
Produced 935,159
69%
Purchased or procured
418,284 31%
Collected or gleaned
862 0%
Total food generated: 1,354,306
Processed 83,842
6%
Donated 80,440
6% Distributed
176,306 13%
Sold 862,755
64%
Delivered 12,688
1%
Composted 68,650
5% Otherwise
handled 69,624
5%
Total food handled: 1,354,306
Community Food Projects Indicators of Success FY2010
3 Community Food Security Coalition
the project. Significant increases in participant knowledge and attitudes related to healthful eating and local food systems were also found.
STRONG COMMUNITIES
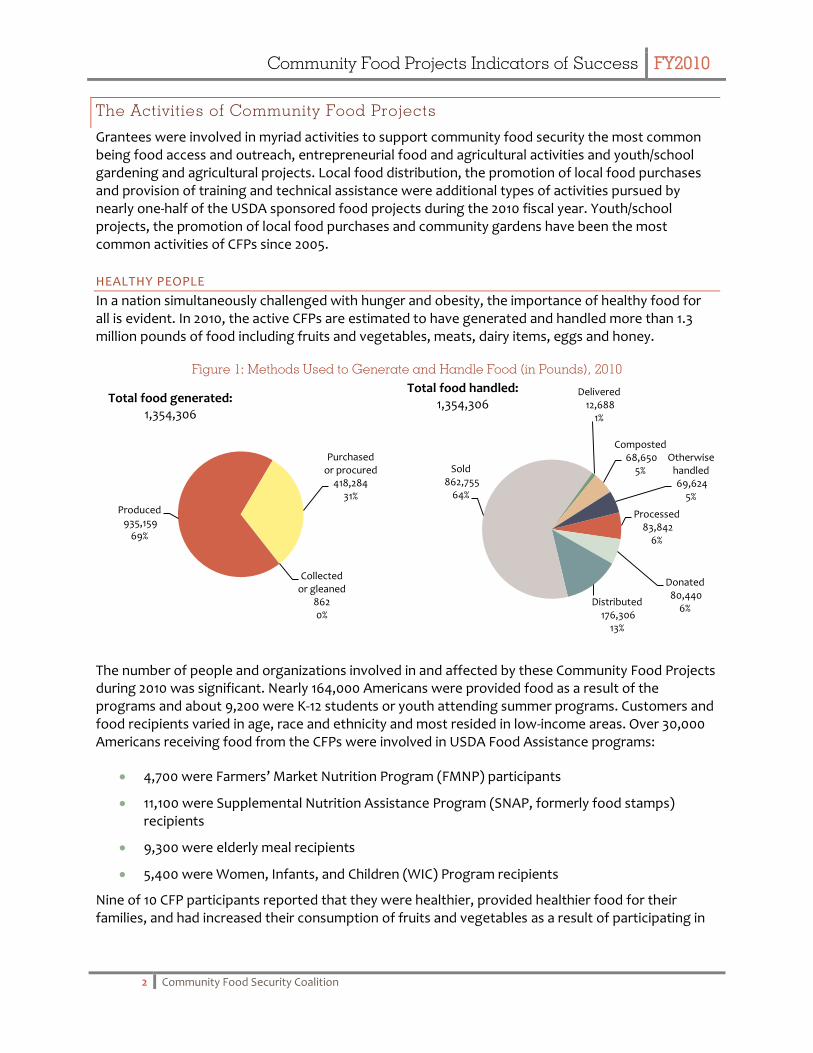
Creating self-reliant communities involves facilitating positive change for the existing local food system. During 2010, the USDA-funded CFPs organized about 2,100 people and partnered with 329 organizations to strengthen community infrastructure. The CFPs and their partners conducted more than 100 Community Food Assessments, formed 26 food policy councils and networks and implemented more than 57 policies aimed at increasing community food security across the nation. More than 5 million Americans lived in the communities where these system-level changes were made.
Figure 2: Food Policy Councils, Networks, Community Food Assessments and People, 2010
An important component to building strong communities includes building power for community members to have a voice and leadership in policies affecting their community. Many CFP participants felt a stronger connection to their local community. About 8 in 10 participants reported developing stronger leadership skills, while 7 in 10 took on greater leadership roles.
THRIVING LOCAL ECONOMIES
Increasing economic benefits to disadvantaged communities and residents through increased jobs, micro-businesses and extended customer bases for local foods are important components of community food security.
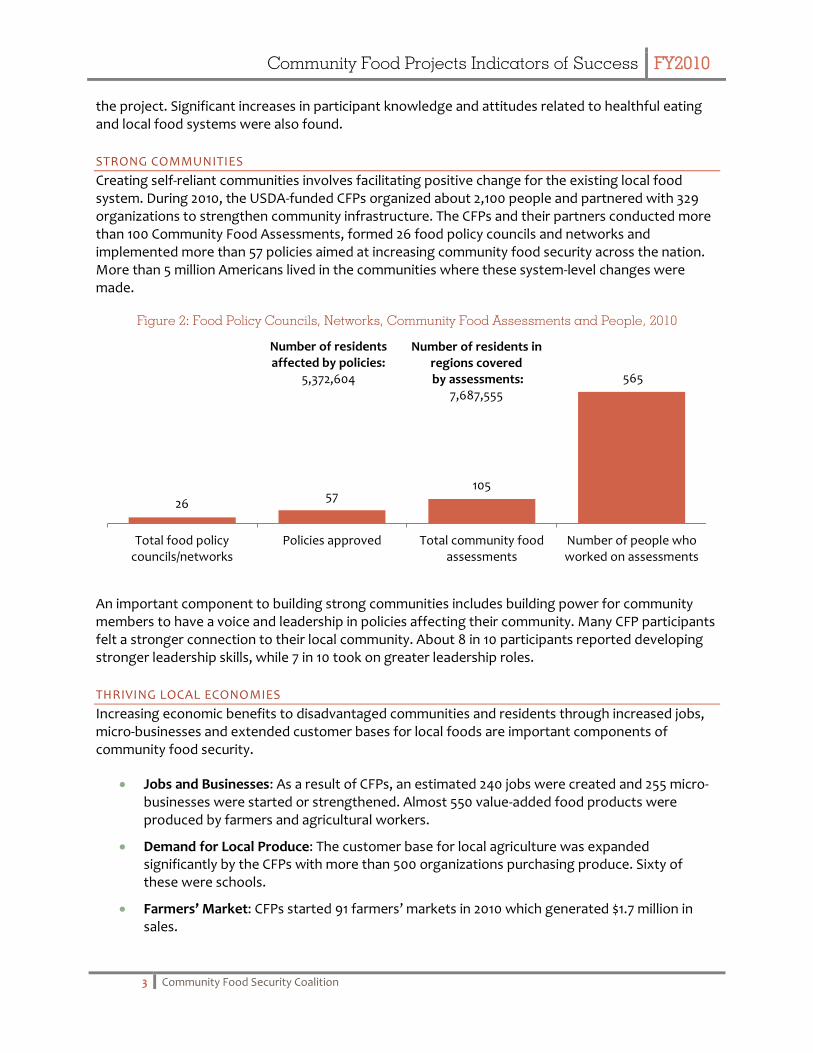
Jobs and Businesses: As a result of CFPs, an estimated 240 jobs were created and 255 micro-businesses were started or strengthened. Almost 550 value-added food products were produced by farmers and agricultural workers.
Demand for Local Produce: The customer base for local agriculture was expanded significantly by the CFPs with more than 500 organizations purchasing produce. Sixty of these were schools.
Farmers’ Market: CFPs started 91 farmers’ markets in 2010 which generated $1.7 million in sales.
26 57
105
565
Total food policycouncils/networks
Policies approved Total community foodassessments
Number of people whoworked on assessments
Number of residents affected by policies:
5,372,604
Number of residents in regions covered by assessments:
7,687,555
Community Food Projects Indicators of Success FY2010
4 Community Food Security Coalition
Figure 3: Jobs, Businesses and Sales 2010
VIBRANT FARMS AND GARDENS
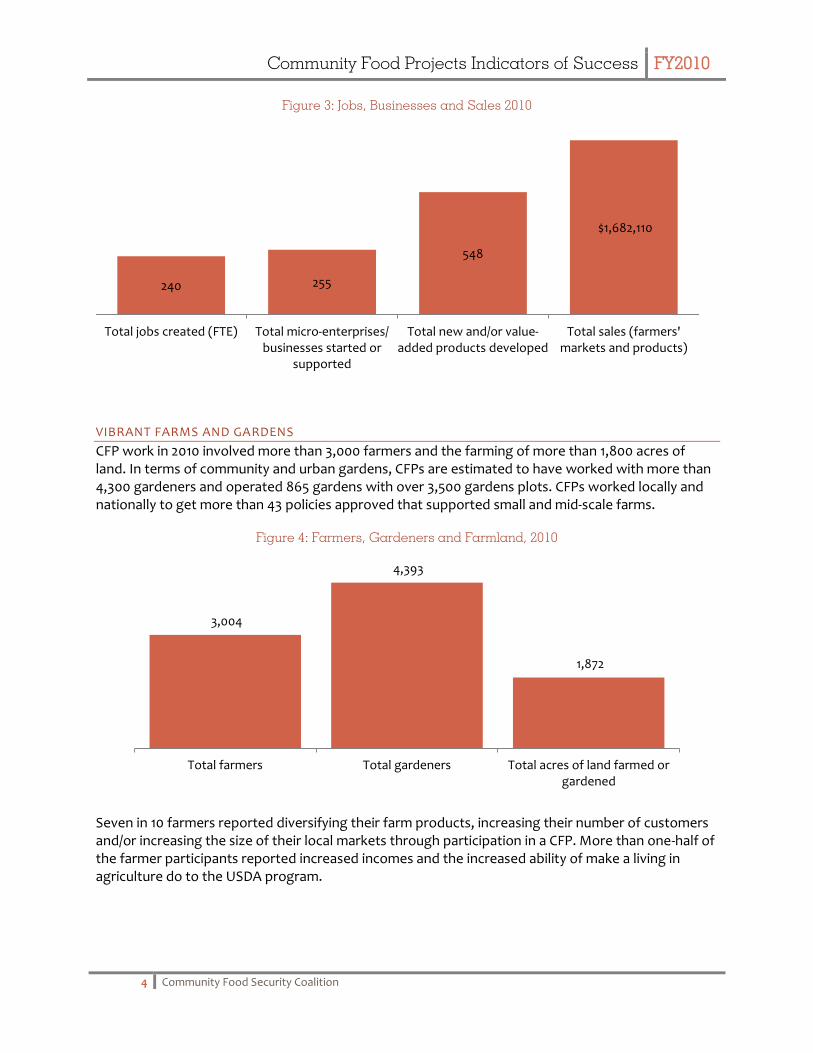
CFP work in 2010 involved more than 3,000 farmers and the farming of more than 1,800 acres of land. In terms of community and urban gardens, CFPs are estimated to have worked with more than 4,300 gardeners and operated 865 gardens with over 3,500 gardens plots. CFPs worked locally and nationally to get more than 43 policies approved that supported small and mid-scale farms.
Figure 4: Farmers, Gardeners and Farmland, 2010
Seven in 10 farmers reported diversifying their farm products, increasing their number of customers and/or increasing the size of their local markets through participation in a CFP. More than one-half of the farmer participants reported increased incomes and the increased ability of make a living in agriculture do to the USDA program.
240 255
548
$1,682,110
Total jobs created (FTE) Total micro-enterprises/businesses started or
supported
Total new and/or value-added products developed
Total sales (farmers'markets and products)
3,004
4,393
1,872
Total farmers Total gardeners Total acres of land farmed orgardened
Community Food Projects Indicators of Success FY2010
5 Community Food Security Coalition
SUSTAINABLE ECOSYSTEMS
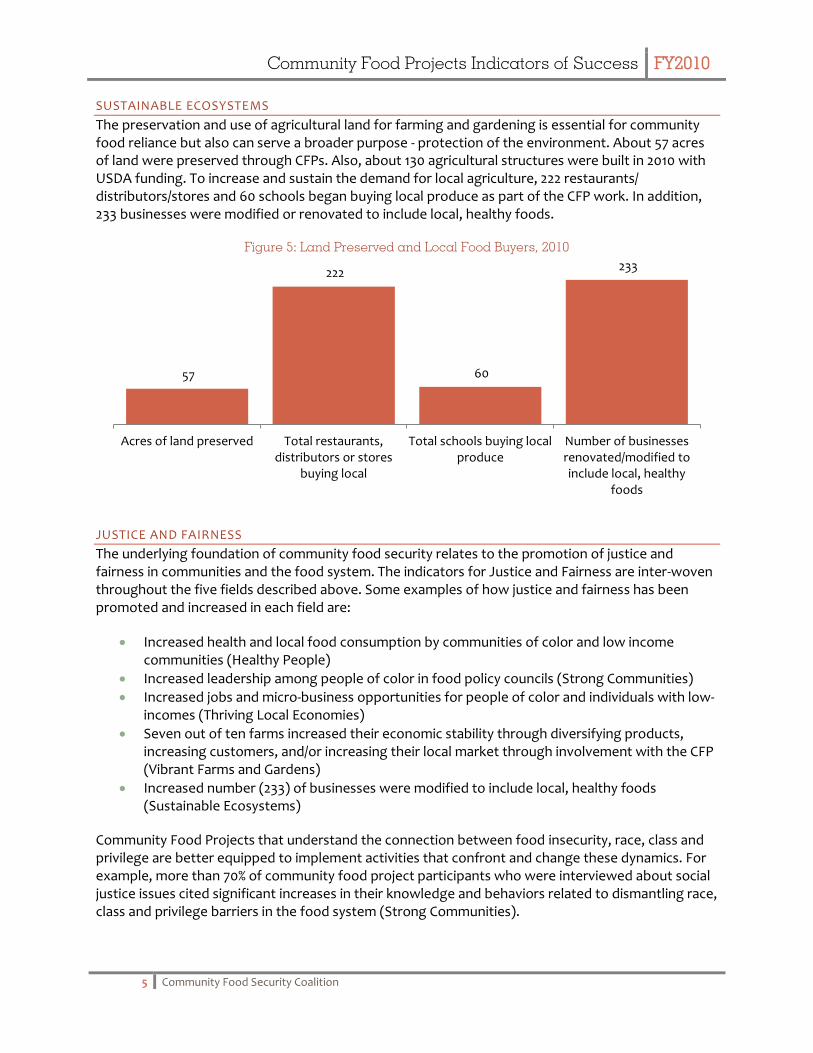
The preservation and use of agricultural land for farming and gardening is essential for community food reliance but also can serve a broader purpose - protection of the environment. About 57 acres of land were preserved through CFPs. Also, about 130 agricultural structures were built in 2010 with USDA funding. To increase and sustain the demand for local agriculture, 222 restaurants/ distributors/stores and 60 schools began buying local produce as part of the CFP work. In addition, 233 businesses were modified or renovated to include local, healthy foods.
Figure 5: Land Preserved and Local Food Buyers, 2010
JUSTICE AND FAIRNESS
The underlying foundation of community food security relates to the promotion of justice and fairness in communities and the food system. The indicators for Justice and Fairness are inter-woven throughout the five fields described above. Some examples of how justice and fairness has been promoted and increased in each field are:
Increased health and local food consumption by communities of color and low income communities (Healthy People)
Increased leadership among people of color in food policy councils (Strong Communities)
Increased jobs and micro-business opportunities for people of color and individuals with low-incomes (Thriving Local Economies)
Seven out of ten farms increased their economic stability through diversifying products, increasing customers, and/or increasing their local market through involvement with the CFP (Vibrant Farms and Gardens)
Increased number (233) of businesses were modified to include local, healthy foods (Sustainable Ecosystems)
Community Food Projects that understand the connection between food insecurity, race, class and privilege are better equipped to implement activities that confront and change these dynamics. For example, more than 70% of community food project participants who were interviewed about social justice issues cited significant increases in their knowledge and behaviors related to dismantling race, class and privilege barriers in the food system (Strong Communities).
57
222
60
233
Acres of land preserved Total restaurants,distributors or stores
buying local
Total schools buying localproduce
Number of businessesrenovated/modified toinclude local, healthy
foods

Community Food Projects Indicators of Success FY2010
6 Community Food Security Coalition
Conclusion
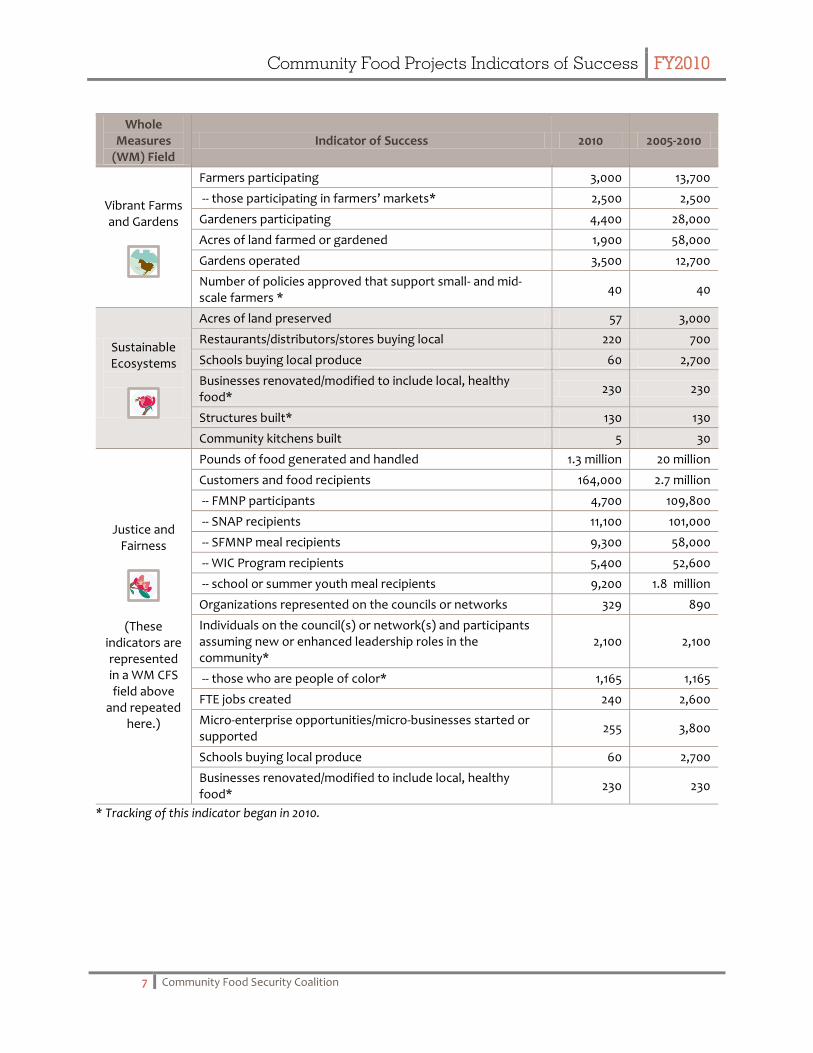
Although this report only captures a subset of the work completed by USDA funded food projects, the progress made across all grantees is substantial. People are learning about the food system and taking on new leadership roles, acres of new land are being farmed and protected, healthy food is being delivered to residents in underserved areas and in schools and jobs and micro-businesses are being created. Systems change also is occurring through advocacy and new policy initiatives (see Figure 6). These system-wide findings demonstrate the important and integral role of Community Food Projects toward creating food security in communities across America.
Figure 6: Community Food Security at a Glance
Whole Measures
(WM) Field Indicator of Success 2010 2005-2010
Healthy People
Pounds of food generated and handled 1.3 million 20 million
-- pounds produced 935,000 5 million
-- pounds donated 80,000 800,000
-- pounds sold 860,000 6 million
Customers and food recipients 164,000 2.7 million
-- FMNP participants 4,700 109,800
-- SNAP recipients 11,100 101,000
-- SFMNP meal recipients 9,300 58,000
-- WIC Program recipients 5,400 52,600
-- school or summer youth meal recipients 9,200 1.8 million
Strong Communities
Food policy councils/networks formed 26 65
Organizations represented on the councils or networks 329 890
Individuals on the council(s) or network(s) and participants assuming new or enhanced leadership roles in the community*
2,100 2,100
-- those who are people of color* 1,165 1,165
Approved policies 57 540
-- people affected by policies 5.3 million 39 million
Community food assessments completed 105 463
-- people affected by assessments 7.6 million 23 million
Thriving Local Economies
FTE jobs created 240 2,600
Micro-enterprise opportunities/micro-businesses started or supported
255 3,800
Farmers’ markets started* 90 90
-- sales of farmers’ markets* $1.7 million $1.7 million
New and/or value-added products developed 550 1,600
-- sales of products* $8,000 $8,000
Community Food Projects Indicators of Success FY2010
7 Community Food Security Coalition
Whole Measures
(WM) Field Indicator of Success 2010 2005-2010
Vibrant Farms and Gardens
Farmers participating 3,000 13,700
-- those participating in farmers’ markets* 2,500 2,500
Gardeners participating 4,400 28,000
Acres of land farmed or gardened 1,900 58,000
Gardens operated 3,500 12,700
Number of policies approved that support small- and mid-scale farmers *
40 40
Sustainable Ecosystems
Acres of land preserved 57 3,000
Restaurants/distributors/stores buying local 220 700
Schools buying local produce 60 2,700
Businesses renovated/modified to include local, healthy food*
230 230
Structures built* 130 130
Community kitchens built 5 30
Justice and Fairness
(These indicators are represented in a WM CFS field above
and repeated here.)
Pounds of food generated and handled 1.3 million 20 million
Customers and food recipients 164,000 2.7 million
-- FMNP participants 4,700 109,800
-- SNAP recipients 11,100 101,000
-- SFMNP meal recipients 9,300 58,000
-- WIC Program recipients 5,400 52,600
-- school or summer youth meal recipients 9,200 1.8 million
Organizations represented on the councils or networks 329 890
Individuals on the council(s) or network(s) and participants assuming new or enhanced leadership roles in the community*
2,100 2,100
-- those who are people of color* 1,165 1,165
FTE jobs created 240 2,600
Micro-enterprise opportunities/micro-businesses started or supported
255 3,800
Schools buying local produce 60 2,700
Businesses renovated/modified to include local, healthy food*
230 230
* Tracking of this indicator began in 2010.
Community Food Projects Indicators of Success FY2010
8 Community Food Security Coalition
I n t r o d u c t i o n
Community Food Security is a condition in which all community residents obtain a safe, culturally appropriate, nutritionally sound diet through an economically and environmentally sustainable food system that promotes community self-reliance and social justice.1
At a basic level, Community Food Security is about making healthy food accessible to all. It focuses on bringing fresh, local food into low-income communities through support of local growers and producers and changes to the local food system infrastructure.
Community Food Security and the Community Food Project’s Competitive
Grant Program
The Community Food Projects Competitive Grant Program (CFPCGP) has existed since 1996 as a program to fight food insecurity through developing community food projects that help promote the self-sufficiency of low-income communities. Community Food Projects (CFPs) are designed to increase food security in communities by bringing the whole food system together to assess strengths, establish linkages, and create systems that improve the self-reliance of community members over their food needs. Community Food Projects aim to:
Meet the needs of low-income people by increasing their access to fresher, more nutritious food supplies.
Increase the self-reliance of communities in providing for their own food needs.
Promote comprehensive responses to local food, farm, and nutrition issues.
Meet specific state, local, or neighborhood food and agricultural needs for infrastructure improvement and development.
Plan for long-term solutions.
Create innovative marketing activities that mutually benefit agricultural producers and low-income consumers.
Preferred projects also develop linkages between two or more sectors of the food system, support the development of entrepreneurial projects, develop innovative linkages between the for-profit and non-profit food sectors, and encourage long-term planning activities and multi-system. Linkages build long-term capacity of communities to address the food and agricultural problems of communities, such as food policy councils and food planning associations.
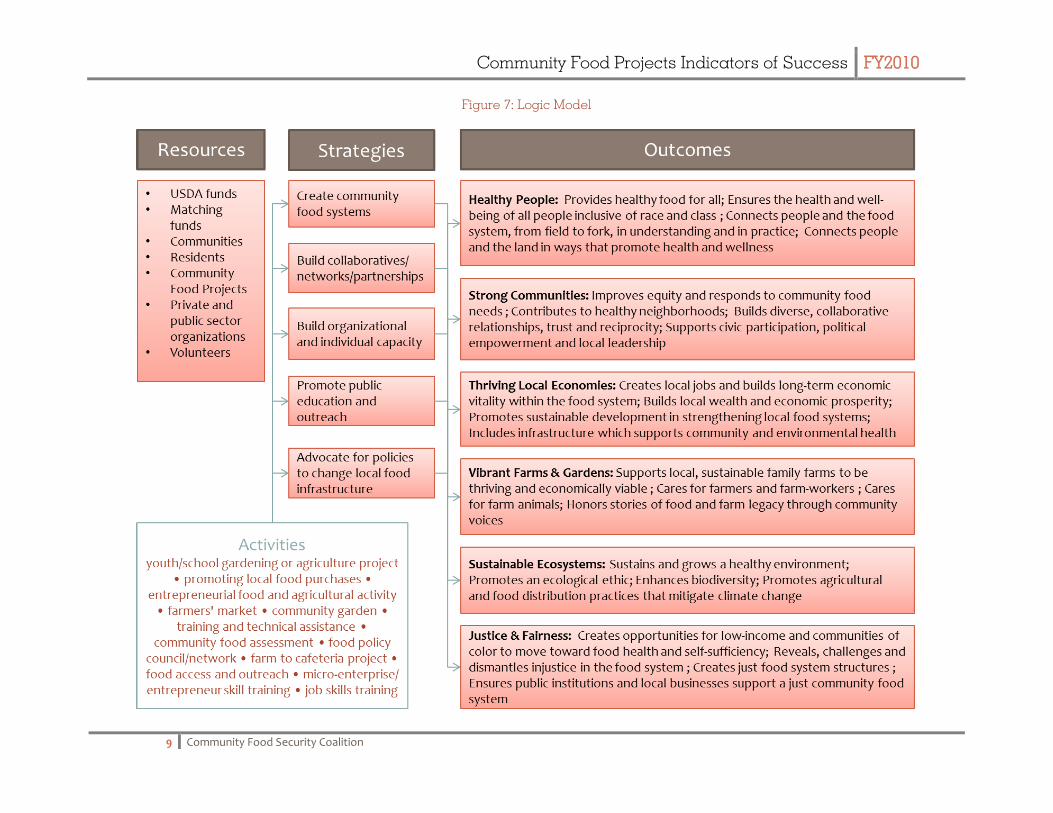
The following figure presents a logic model that demonstrates the flow of resources and strategies used to achieve the outcomes of the Community Food Project’s Competitive Grant Program.
1 Based on a definition by Mike Hamm and Anne Bellows
Community Food Projects Indicators of Success FY2010
9 Community Food Security Coalition
Figure 7: Logic Model

Community Food Projects Indicators of Success FY2010
10 Community Food Security Coalition
The CFP grants are intended to help eligible private non-profit entities that need a one-time infusion of federal assistance to establish and carry out multipurpose Community Food Projects. Projects are funded from $10,000-$300,000 and from one to three years. They are one-time grants that require a dollar-for-dollar match in resources. Approximately 18% of the submitted proposals have received awards during the history of this program. Funds have been authorized through the year 2012 at $5 million per year.
Study Methods
The CFP Indicators of Success (IOS) was created through the collaborative partnership of the Community Food Project Competitive Grants Program (CFPCGP), Community Food Security Coalition (CFSC), National Research Center, Inc. (NRC), and nearly 70 CFP grantee organizations. The CFP IOS reflects a focus on outcomes (e.g., economic and social equity, healthy food access) of CFP grantees and includes a participant survey component, or the Participant Impact Survey (PS). The CFP IOS was designed to report the actual or estimated total number of participants served or the outputs and outcomes achieved during the current fiscal year. The CFP PS measures the self-reported changes in community residents resulting from Community Food Projects. The CFP PS intends to measure the knowledge, attitude and behavior changes of project participants. The CFP IOS is based on the Common Output Tracking Form (COTF), originally developed in 2005, to capture the activities and outputs of CFP grantees.
At the foundation of the CFP IOS are six core fields of practice that reflect a vision for whole communities seen through the lens of community food system development. These fields include Healthy People, Strong Communities; Thriving Local Economies, Vibrant Farms and Gardens, Sustainable Ecosystems and Justice and Fairness. Developed with input from over one hundred Community Food Projects, these fields are described in Whole Measures for Community Food Systems (http://www.foodsecurity.org/pubs.html#wm).
The web-based CFP IOS and CFP PS were developed to understand the impacts across Community Food Projects by tracking their most common outputs and outcomes. While not meant to capture the full picture of all that CFP grantees accomplish, these results are intended to provide a shared reporting system for those outcomes that are most easily quantified and that demonstrate the overall productivity of the CFPCGP. The collective results can serve as an important resource for future advocacy and promotion of community food security.
Since fiscal year 2005, the Community Food Projects Staff at the United States Department of Agriculture/ National Institute for Food and Agriculture (USDA/NIFA, formerly CSREES) have requested that all grantees complete these tracking measures in addition to submitting their required annual narrative and financial reports. The CFSC has been funded through a Training and Technical Assistance grant to assist CFP grantees in completion of the form and to manage data collection and reporting. Fiscal year 2010 marks the sixth year the data have been collected on CFP grantee activities. Of the 81 grantees funded for fiscal year 2010, 34 completed the IOS providing a response rate of 41%. (The response rate in fiscal year 2010 was lower due to an end of year launch date for the new CFP IOS tools.) Over the six-year reporting period, a total of 334 grantees were funded through the CFPCGP. Of these, 225 Community Food Projects completed the form – providing annual response rates ranging from 37% to 79% and an overall response rate of 60%. As with IOS, administration of the PS was not mandatory. A total of 17 grantees administered PS to a total of 407 participants.
Community Food Projects Indicators of Success FY2010
11 Community Food Security Coalition
IOS data submitted by grantees were cleaned, synthesized and statistically weighted by NRC to reflect 100% participation. Data for PS surveys administered by the grantees remain unweighted.
Where the CFP IOS and the previous COTF aligned, the impacts of CFP grantees since 2005 are shown in sum. These summative figures contain the notation “2005-2010” while data for 2010 only are designated with “2010.”
Study Limitations
As with every study, there are a number of limitations the reader should keep in mind. The challenges to these data result from 1) non-response bias, 2) the nature of self-report, and 3) the difficulty that organizations working in multi-sectors often face in tracking participation:
1) Reporting for the CFP grantees was not mandated. Thus, about 40% of grantees over the six-year period opted out of completing the forms. To compensate for this non-response, the responses of the responding CFPs were statistically weighted to reflect the full percent of active, funded organizations during the fiscal time periods. For example, in 2010, 34 of the 81 grantees provided IOS data, thus the responses were multiplied by a factor of 2.38 (81÷34). The unweighted data provided by FY2010 grantees participating in the IOS are presented in Appendix B: Unweighted IOS Results. These data might be viewed as the minimum amount of activity and impact made by the USDA -funded CFPs during this reporting period.
2) Because of the nature of self-reported data and the fact that this type of reporting is relatively new to many grantees, recording and data entry errors are possible.
3) Many of the questions do not require that the grantee report unique numbers; therefore, a portion of the reported numbers could be redundant, suggesting a broader reach for what grantees accomplished. It is unknown if these repeated values represent an averaging of actual amounts across the grantees activities (since tracking the data per activity may not be feasible for the grantee) or if these are data entry errors.
Despite limitations delineated here, CFP IOS (and formerly the COTF) provides an efficient method to collect outputs from organizations and programs across the country. This report describes the reach, activities and outcomes of the grant recipients of the Community Food Projects Competitive Grant Program (CFPCGP for the fiscal years of 2005 through 2010). This current year plus six year data summary demonstrates the significant impact of Community Food Projects towards increasing community food security across the country.

Community Food Projects Indicators of Success FY2010
12 Community Food Security Coalition
T h e A c t i v i t i e s o f C o m m u n i t y F o o d P r o j e c t s
Community Food Projects participate in myriad activities, some common and others quite unique (see Appendix D: Definitions for complete descriptions). The activities shared by about half or more of grantees in 2010 included work in the areas of food access and outreach, entrepreneurial food and agricultural activity, youth/school gardening or agricultural projects, local food distribution, promoting local food purchases, and the provision of training and technical assistance. About one in three grantees participated in micro-enterprise/entrepreneur skill training, farmers' markets, job skills training and urban agriculture. About two in five grantees participated in community gardens and nutrition and health education activities.
Figure 8: Grantee Activities, 2010
Percent of grantees
Food access and outreach 62%
Entrepreneurial food and agricultural activity 50%
Youth/School gardening or agriculture project 50%
Local food distribution 47%
Promoting local food purchases 47%
Training and technical assistance 47%
Community garden 44%
Nutrition and health education 41%
Micro-enterprise/entrepreneur skill training 38%
Farmers' market 35%
Job skills training 29%
Urban agriculture 29%
Restoration of traditional foods/agriculture 18%
Community food assessment 15%
Food policy council/network 15%
Community Supported Agriculture (CSA) program 12%
Farm/Grower cooperative 12%
Community or incubator kitchen/value-added production/processing 9%
Farm to cafeteria project 9%
Immigrant/Migrant farm project 9%
Emergency food collection and distribution 6%
Planning grants 3%
Food-buying cooperative 0%
Other 21%
Note: Total may exceed 100% as respondents could select more than one option.
Community Food Projects Indicators of Success FY2010
13 Community Food Security Coalition
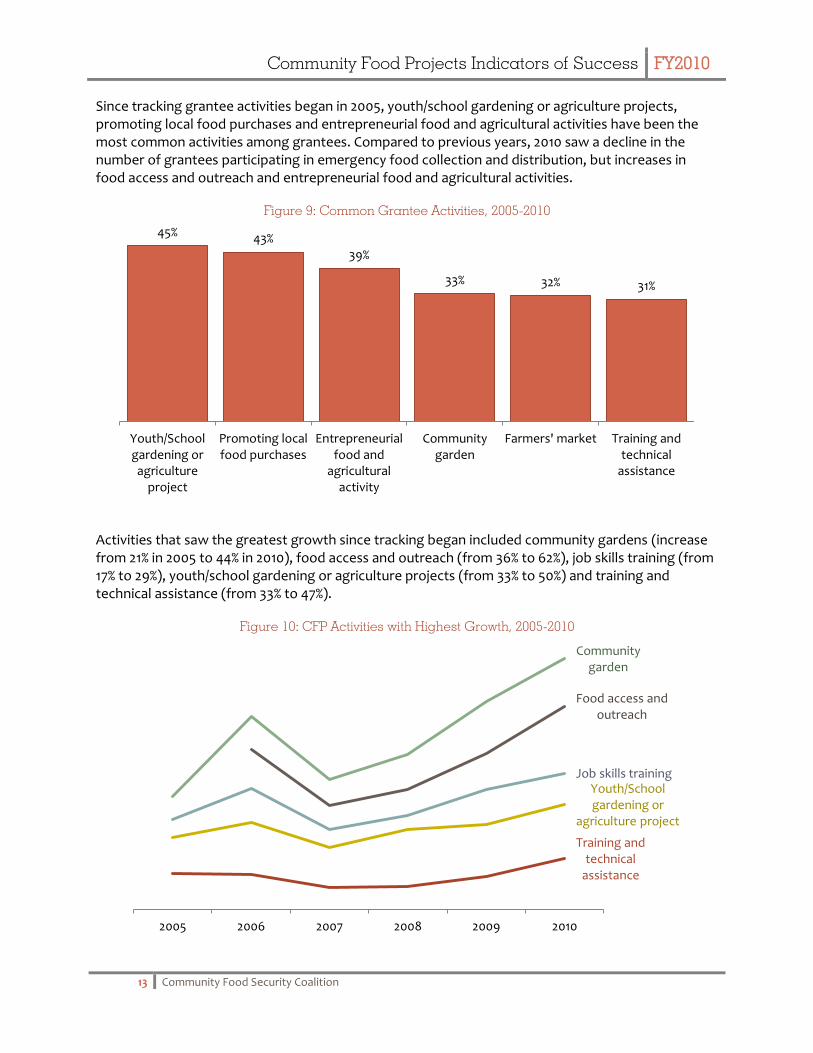
Since tracking grantee activities began in 2005, youth/school gardening or agriculture projects, promoting local food purchases and entrepreneurial food and agricultural activities have been the most common activities among grantees. Compared to previous years, 2010 saw a decline in the number of grantees participating in emergency food collection and distribution, but increases in food access and outreach and entrepreneurial food and agricultural activities.
Figure 9: Common Grantee Activities, 2005-2010
Activities that saw the greatest growth since tracking began included community gardens (increase from 21% in 2005 to 44% in 2010), food access and outreach (from 36% to 62%), job skills training (from 17% to 29%), youth/school gardening or agriculture projects (from 33% to 50%) and training and technical assistance (from 33% to 47%).
Figure 10: CFP Activities with Highest Growth, 2005-2010
45% 43% 39%
33% 32% 31%
Youth/Schoolgardening oragriculture
project
Promoting localfood purchases
Entrepreneurialfood and
agriculturalactivity
Communitygarden
Farmers' market Training andtechnical
assistance
Training and technical
assistance
Youth/School gardening or
agriculture project
Job skills training
Food access and outreach
Community garden
2005 2006 2007 2008 2009 2010

Community Food Projects Indicators of Success FY2010
14 Community Food Security Coalition
Figure 11: Grantee Activities, 2005-2010
2010 2009 2008 2007 2006 2005 Overall
Local food distribution 47% . . . . . 47%
Youth/School gardening or agriculture project 50% 48% 53% 37% 48% 33% 45%
Promoting local food purchases 47% 42% 32% 41% 50% 46% 43%
Nutrition and health education 41% . . . . . 41%
Entrepreneurial food and agricultural activity 50% 33% 32% 39% 34% 42% 39%
Food access and outreach 62% 33% 24% 22% 36% . 35%
Community garden 44% 48% 32% 24% 30% 21% 33%
Farmers' market 35% 30% 24% 30% 38% 33% 32%
Training and technical assistance 47% 30% 21% 20% 32% 33% 31%
Micro-enterprise/Entrepreneur skill training 38% 12% 16% 17% 32% 29% 25%
Urban agriculture 29% 21% . . . . 25%
Community food assessment 15% 21% 21% 24% 32% 33% 24%
Job skills training 29% 33% 13% 17% 32% 17% 23%
Food policy council/network 15% 21% 18% 17% 36% 33% 23%
Farm to cafeteria project 9% 15% 13% 20% 38% 25% 20%
Farm/Grower cooperative 12% 9% 24% 20% 26% 12% 17%
Community Supported Agriculture (CSA) program
12% 21% 11% 17% 28% 17% 17%
Community or incubator kitchen/value-added production/processing
9% 15% 16% 11% 20% 25% 16%
Restoration of traditional foods/agriculture 18% 15% 8% 4% 18% 21% 14%
Emergency food collection and distribution 6% 9% 16% 15% 26% . 14%
Planning grants 3% 9% 18% 15% . . 11%
Immigrant/Migrant farm project 9% 3% 8% 7% 14% 12% 9%
Food-buying cooperative 0% 3% 3% 7% 10% 8% 5%
Other 21% . . . . . 21%
Note: Total may exceed 100% as respondents could select more than one option. Cells containing “.” indicate the item was not available as a response option during that year’s data collection.

Community Food Projects Indicators of Success FY2010
15 Community Food Security Coalition
I n d i c a t o r s o f S u c c e s s
The CFP IOS framework is based on the fields of practice from Whole Measures for Community Food Systems: Values-Based Planning and Evaluation (Whole Measures CFS). The six fields include: Healthy People, Strong Communities, Thriving Local Economies, Vibrant Farms and Gardens, Sustainable Ecosystems and Justice and Fairness. Together, these fields of practice comprise a vision for a whole community food system as articulated with input from over a hundred Community Food Projects. The data collected from grantees has been organized into the field that most closely relates. A description of each outcome category as defined by Whole Measures CFS is presented at the head of each section to provide context for the data. As with all systems, however, their functions are overlapping and many data/impacts support more than one field of practice. Because Justice and Fairness is a foundational practice for creating a whole community food system, the indicators for this field are intertwined within the other five fields. Thus, for the purposes of this report, the indicators of Justice and Fairness are included throughout the other five fields and only highlighted under Justice and Fairness.
Healthy People
Community and individual health includes our physical, social, mental, emotional, and spiritual wellbeing. All of these dimensions are intrinsically connected to food and food systems. For example, engaging with community members at farmers’ markets promotes our social connectedness. Learning to prepare our own food contributes to our mental development and enhances our resiliency. Growing food helps develop our physical and spiritual awareness as we connect to larger natural systems. Whole communities need whole people and community food systems that increase access to healthy food while also cultivating broader dimensions of health. – Whole Measures for Community Food Systems: Values-based Planning and Evaluation
Food Generated and Handled
At the foundation of changes to the people, economy, land, and environment brought by these Community Food Projects, is the food itself. The grantees have grown, handled, and contributed vast quantities of fresh, locally grown produce by advocating for policies that change the local food infrastructure, promoting public education and outreach and building the capacity of organizations and individuals. Most in American society are blessed with an abundance of food, a condition so pervasive that even a discussion of food security often is met with quizzical looks. But the kind and quality of food grown and transported locally is unique to these kinds of community programs, so understanding the volume of the food generated and handled is essential to grasping the breadth of their success.

Community Food Projects Indicators of Success FY2010
16 Community Food Security Coalition
The CFPs active in 2010 are estimated to have generated and handled almost 1.4 million pounds of food. Of these 1.4 million pounds of food, grantees sold 860,000 pounds, distributed 12,700 pounds and composted 69,000 pounds. Since 2005, grantees have generated an estimated 20 million pounds of food, of which 6.1 million was sold and 4.6 was distributed.
Figure 12: Methods Used to Generate Food (in Pounds), 2010
Total Average
Total food generated 1,354,306 21,864
Produced 935,159 17,843
Purchased or procured 418,284 13,506
Collected or gleaned 862 181
Otherwise generated 0 0
Figure 13: Methods Used to Generate Food (in Pounds), 2005-2010
Figure 14: Methods Used to Handle Food (in Pounds), 2010
Total Average
Total food handled 1,354,306 21,864
Processed 83,842 4,399
Donated 80,440 1,876
Distributed 176,306 7,401
Sold 862,755 18,107
Delivered 12,688 1,775
Composted 68,650 2,217
Otherwise handled 69,624 4,871
Produced 5,957,995
30%
Purchased or procured 3,123,453
15%
Collected or gleaned 1,956,711
10%
Other 9,081,293
45%
Total food generated: 20,119,451

Community Food Projects Indicators of Success FY2010
17 Community Food Security Coalition
Figure 15: Methods Used to Handle Food (in Pounds), 2005-2010
People Fed by Community Food Projects
A significant number of people received local, fresh food from community food project work. Almost 164,000 people are estimated to have received healthy food as a result of the CFPCGP during 2010. Of the 164,000 customers or food recipients, 11,000 SNAP participants, 9,000 Senior Farmer’s Market Nutrition Program (SFMNP) participants and 4,700 Farmers' Market Nutrition Program (FMNP) participants received food. Additionally, about 9,000 youth received over 17,000 meals during 2010.
Grantees have served almost 3 million customers and food recipients since 2005, with youth being the majority of these customers (1.8 million). WIC, SNAP, SFMNP and FMNP participants comprised about 320,000 of the customers and food recipients served between 2005 and 2010.
Figure 16: Customer and Food Recipients, 2010
Total Average
Total number of customers or food recipients 163,570 2,746
a) Number of WIC recipients 5,417 207
b) Number of SNAP (food stamp) recipients 11,180 427
c) Number of Senior Farmers' Market Nutrition Program (SFMNP) recipients 9,303 488
d) Number of Farmers' Market Nutrition Program (FMNP) participants 4,719 248
e) Number of school or summer youth meal recipients 9,182 482
-- Number of meals served to students/youth 17,572 1,054
f) Number of other customers or food recipients 123,768 2,259
Number of schools buying local produce (new starts or those ongoing) 60 13
Processed 463,860
2%
Donated 806,521
4%
Distributed 4,585,921
23%
Sold 6,108,121
30%
Delivered 1,266,260
6%
Composted 5,603,907
28%
Otherwise handled
1,284,861 7%
Total food handled: 20,119,451

Community Food Projects Indicators of Success FY2010
18 Community Food Security Coalition
Figure 17: Customer and Food Recipients Overall, 2005-2010
Customers and food recipients varied in age, race and ethnicity, and most resided in low-income areas. In 2010, about 70% of projects served food stamp recipients, about 60% served WIC recipients and about 40% worked with underserved or socially disadvantaged farmers. Grantee work in 2010 focused on participants at least in their teens; fewer grantees reported working with children age 12 and younger than in previous years. The racial and ethnic compositions of the populations served have remained consistent since 2005.
Figure 18: Special Populations Served, 2005-2010
2010 2009 2008 2007 2006 2005 Overall
Indian nations, reservations 24% 29% 22% 26% 34% 32% 27%
Head Start 21% 32% 41% 36% 30% 52% 35%
Underserved or socially disadvantaged farmers 44% 48% 49% 52% 66% 68% 54%
WIC recipients 62% 71% 76% 64% 64% 0% 55%
SNAP (food stamp) recipients 71% 77% 80% 74% 72% 92% 78%
Low-income areas or neighborhoods 91% 90% 95% 95% 94% 16% 80%
Other 24% 97% 100% 98% 100% 92% 82%
Note: Totals may exceed 100% as respondents could select more than one option.
Figure 19: Age of Populations Served, 2005-2010
2010 2009 2008 2007 2006 2005 Overall
Infants (birth -- 2) 29% 29% 34% 38% 35% 24% 32%
Children (3-12) 59% 81% 78% 67% 67% 52% 66%
Teens (13-18) 82% 94% 85% 81% 75% 68% 80%
College age (19-22) 85% 90% 90% 86% 83% 80% 86%
Adults (20-54) 100% 97% 98% 98% 98% 96% 98%
Seniors (55+) 91% 90% 95% 90% 92% 84% 91%
Note: Total may exceed 100% as respondents could select more than one option.
WIC 52,632
2%
SNAP 100,756
4%
SFMNP 58,006
2% FMNP
109,786 4%
Youth 1,818,777
67%
Other 570,460
21%
Total customers and food recpients:
2,710,416
Community Food Projects Indicators of Success FY2010
19 Community Food Security Coalition
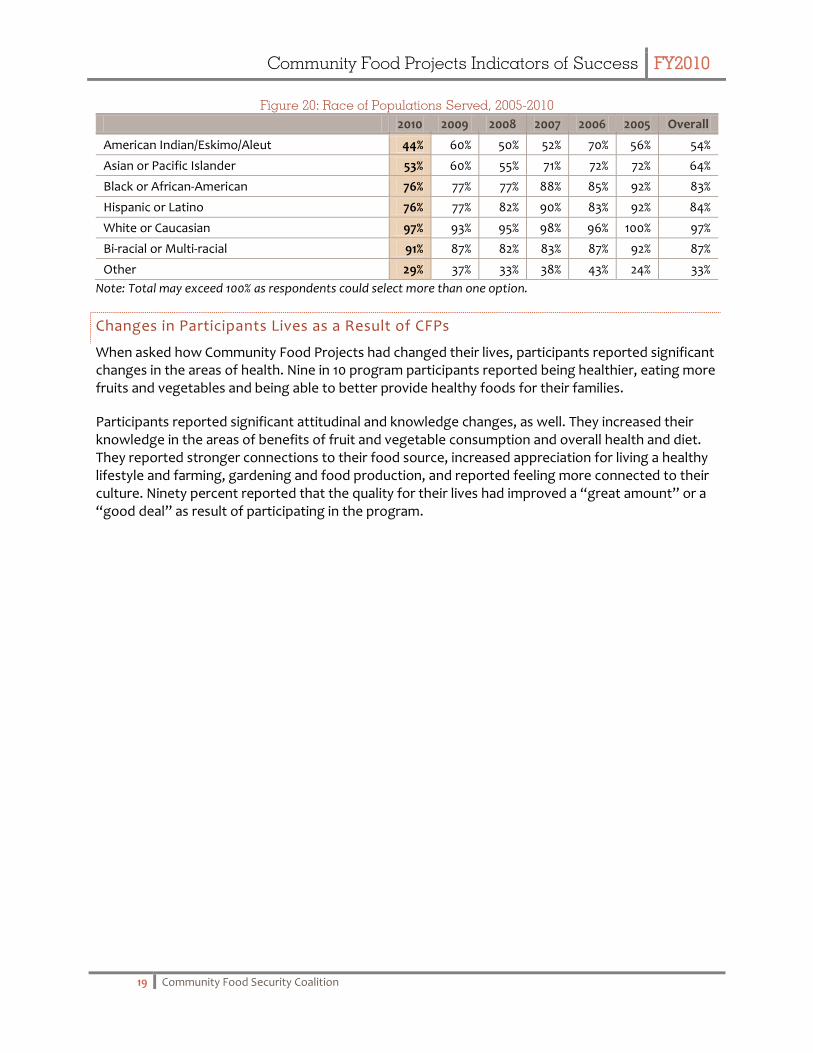
Figure 20: Race of Populations Served, 2005-2010
2010 2009 2008 2007 2006 2005 Overall
American Indian/Eskimo/Aleut 44% 60% 50% 52% 70% 56% 54%
Asian or Pacific Islander 53% 60% 55% 71% 72% 72% 64%
Black or African-American 76% 77% 77% 88% 85% 92% 83%
Hispanic or Latino 76% 77% 82% 90% 83% 92% 84%
White or Caucasian 97% 93% 95% 98% 96% 100% 97%
Bi-racial or Multi-racial 91% 87% 82% 83% 87% 92% 87%
Other 29% 37% 33% 38% 43% 24% 33%
Note: Total may exceed 100% as respondents could select more than one option.
Changes in Participants Lives as a Result of CFPs
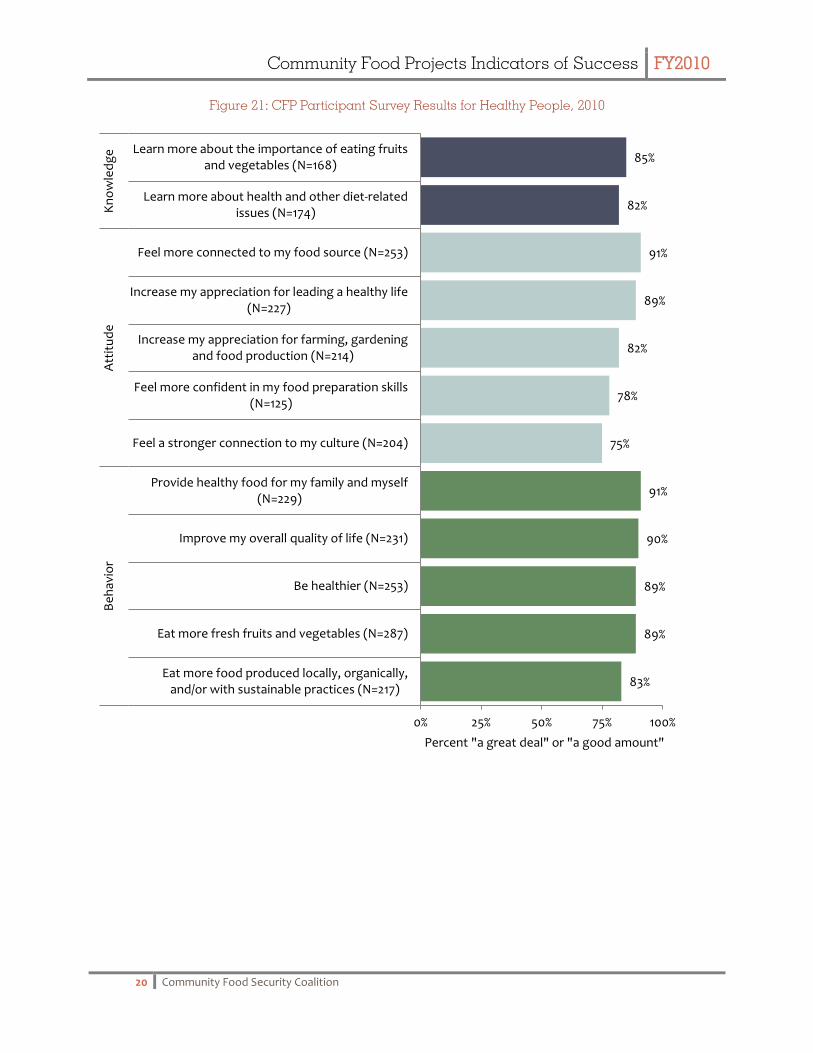
When asked how Community Food Projects had changed their lives, participants reported significant changes in the areas of health. Nine in 10 program participants reported being healthier, eating more fruits and vegetables and being able to better provide healthy foods for their families.
Participants reported significant attitudinal and knowledge changes, as well. They increased their knowledge in the areas of benefits of fruit and vegetable consumption and overall health and diet. They reported stronger connections to their food source, increased appreciation for living a healthy lifestyle and farming, gardening and food production, and reported feeling more connected to their culture. Ninety percent reported that the quality for their lives had improved a “great amount” or a “good deal” as result of participating in the program.
Community Food Projects Indicators of Success FY2010
20 Community Food Security Coalition
Figure 21: CFP Participant Survey Results for Healthy People, 2010
83%
89%
89%
90%
91%
75%
78%
82%
89%
91%
82%
85%
0% 25% 50% 75% 100%
Eat more food produced locally, organically,and/or with sustainable practices (N=217)
Eat more fresh fruits and vegetables (N=287)
Be healthier (N=253)
Improve my overall quality of life (N=231)
Provide healthy food for my family and myself(N=229)
Feel a stronger connection to my culture (N=204)
Feel more confident in my food preparation skills(N=125)
Increase my appreciation for farming, gardeningand food production (N=214)
Increase my appreciation for leading a healthy life(N=227)
Feel more connected to my food source (N=253)
Learn more about health and other diet-relatedissues (N=174)
Learn more about the importance of eating fruitsand vegetables (N=168)
Be
hav
ior
Att
itu
de
Kn
ow
led
ge
Percent "a great deal" or "a good amount"

Community Food Projects Indicators of Success FY2010
21 Community Food Security Coalition
Strong Communities
Food can be a common and unifying force socially, culturally, and spiritually. A strong food system builds strong communities across class, race, age, education, and other social categories. Cultivating leadership from within a community and forging relationships based on characteristics such as trust, respect, and transparency can strengthen resilience, build capacity and enhance engagement for change toward a shared vision of whole community.
An integral component of community food security is to empower and strengthen communities to increase the quality of life of their inhabitants. As a result, a strong community is also just and fair. While comprising separate fields in the Whole Measures for Community Food Systems, the changes in participants’ lives that relate to Justice and Fairness are reported within Strong Communities to demonstrate their inherent linkages and interconnectedness.
Food Policy Councils and Networks
Strategies often used by CFPs to strengthen communities focus on building collaboratives, policy advocacy and the creation of community food systems. Projects also seek to strengthen communities through capacity building (organizational and individual) and public education and outreach. CFPs were involved in many activities that worked towards creating systematic changes in the food system. Conducting needs assessments, forming community collaboratives to address shared community needs and policy advocacy are key activities chosen by CFPs to create systematic changes to local food systems.
Often, CFPs work to create empowered and competent communities through strategic partnership of community organizations and individuals. Whether large or small, well-endowed or under-funded, these food councils or networks work together to solve community food issues through collaborative problem solving, multi-sector cooperation, public education, and policy advocacy.
Often, CFPs conduct a Community Food Assessment (CFA) as a community-wide study to aid their effort. CFAs identify what is happening with food in a community, including both strengths and weaknesses. Often, a CFA will use a variety of data collection methods to compile general community characteristics, community food resources, food resource accessibility, food availability and affordability and community food production resources. Through such assessments, a diverse set of stakeholders work together to research their local food system and mobilize efforts to improve the system. Grantees completed a total of 463 CFAs since 2005, with 105 of these occurring in 2010. CFA work in 2010 involved 565 individuals and affected over 7 million residents. An estimated 23 million residents live in the areas covered by the CFAs conduction from 2005 to 2010.
Policy advocacy is an activity commonly undertaken by CFPs to create systematic change to community food systems. The principal aims of food policy advocacy are to develop, introduce, reform, and implement policies, and ensure that policies that are implemented allow communities to provide healthy food accessible to all residents.
Community Food Projects Indicators of Success FY2010
22 Community Food Security Coalition
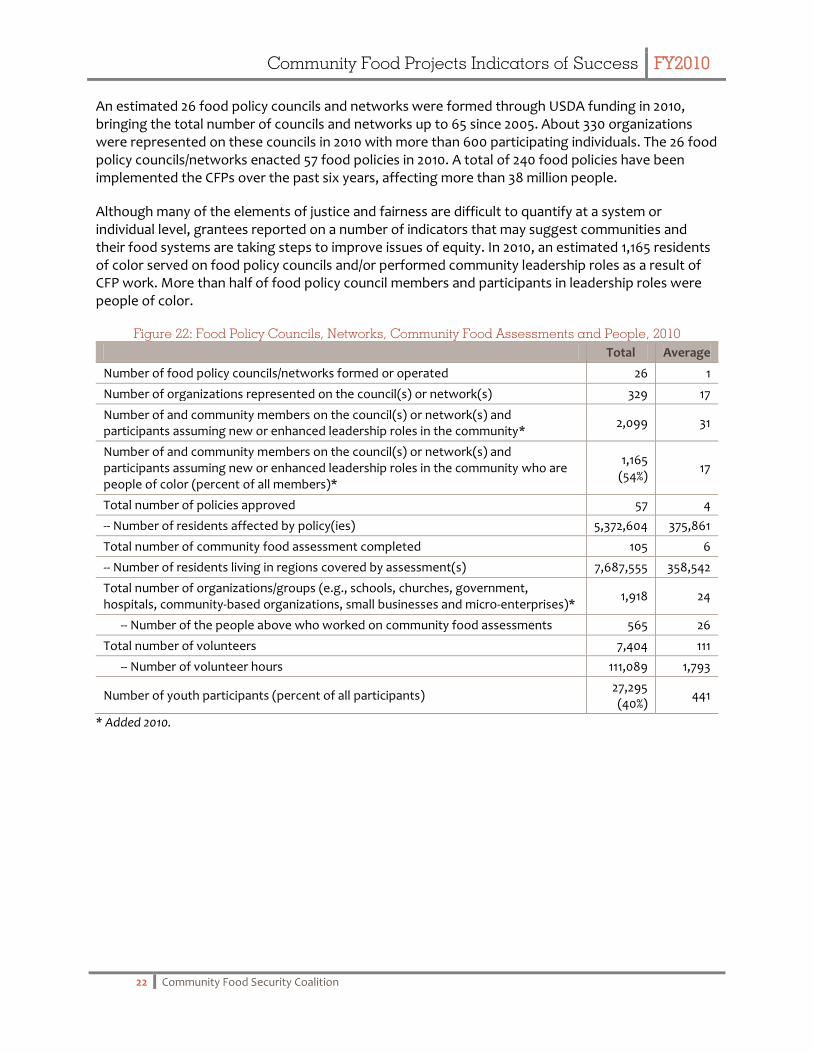
An estimated 26 food policy councils and networks were formed through USDA funding in 2010, bringing the total number of councils and networks up to 65 since 2005. About 330 organizations were represented on these councils in 2010 with more than 600 participating individuals. The 26 food policy councils/networks enacted 57 food policies in 2010. A total of 240 food policies have been implemented the CFPs over the past six years, affecting more than 38 million people.
Although many of the elements of justice and fairness are difficult to quantify at a system or individual level, grantees reported on a number of indicators that may suggest communities and their food systems are taking steps to improve issues of equity. In 2010, an estimated 1,165 residents of color served on food policy councils and/or performed community leadership roles as a result of CFP work. More than half of food policy council members and participants in leadership roles were people of color.
Figure 22: Food Policy Councils, Networks, Community Food Assessments and People, 2010
Total Average
Number of food policy councils/networks formed or operated 26 1
Number of organizations represented on the council(s) or network(s) 329 17
Number of and community members on the council(s) or network(s) and participants assuming new or enhanced leadership roles in the community*
2,099 31
Number of and community members on the council(s) or network(s) and participants assuming new or enhanced leadership roles in the community who are people of color (percent of all members)*
1,165 (54%)
17
Total number of policies approved 57 4
-- Number of residents affected by policy(ies) 5,372,604 375,861
Total number of community food assessment completed 105 6
-- Number of residents living in regions covered by assessment(s) 7,687,555 358,542
Total number of organizations/groups (e.g., schools, churches, government, hospitals, community-based organizations, small businesses and micro-enterprises)*
1,918 24
-- Number of the people above who worked on community food assessments 565 26
Total number of volunteers 7,404 111
-- Number of volunteer hours 111,089 1,793
Number of youth participants (percent of all participants) 27,295 (40%)
441
* Added 2010.
Community Food Projects Indicators of Success FY2010
23 Community Food Security Coalition
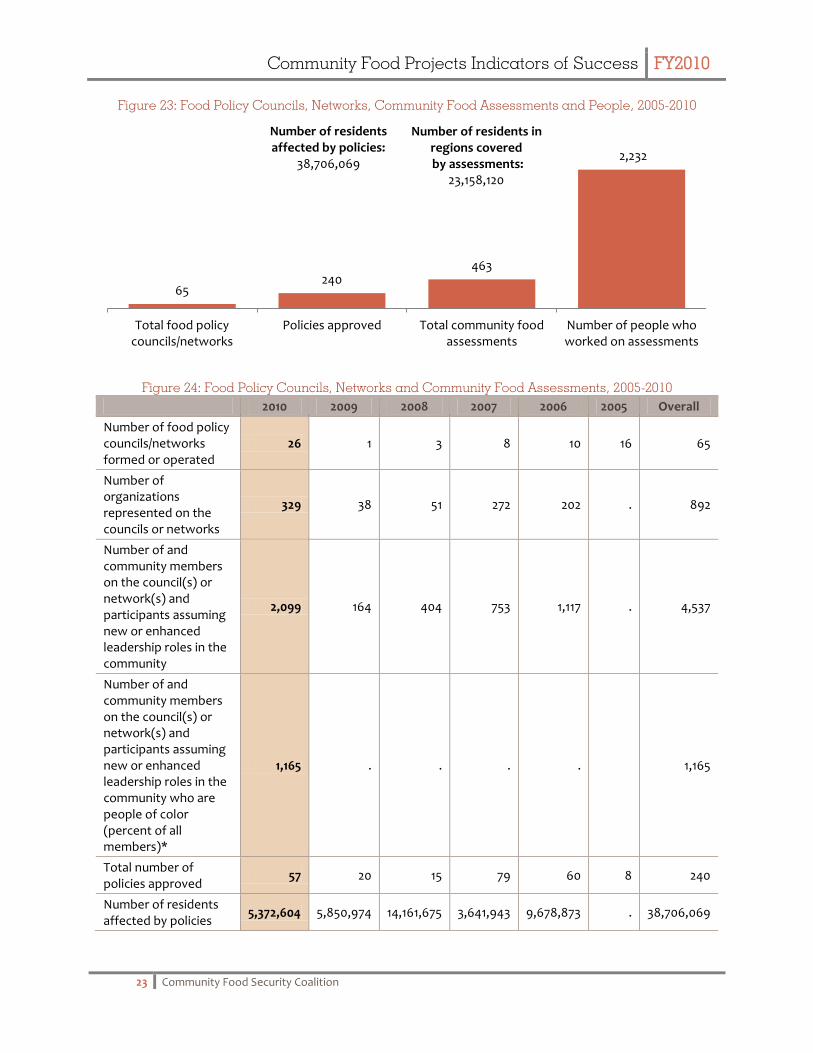
Figure 23: Food Policy Councils, Networks, Community Food Assessments and People, 2005-2010
Figure 24: Food Policy Councils, Networks and Community Food Assessments, 2005-2010
2010 2009 2008 2007 2006 2005 Overall
Number of food policy councils/networks formed or operated
26 1 3 8 10 16 65
Number of organizations represented on the councils or networks
329 38 51 272 202 . 892
Number of and community members on the council(s) or network(s) and participants assuming new or enhanced leadership roles in the community
2,099 164 404 753 1,117 . 4,537
Number of and community members on the council(s) or network(s) and participants assuming new or enhanced leadership roles in the community who are people of color (percent of all members)*
1,165 . . . . 1,165
Total number of policies approved
57 20 15 79 60 8 240
Number of residents affected by policies
5,372,604 5,850,974 14,161,675 3,641,943 9,678,873 . 38,706,069
65 240
463
2,232
Total food policycouncils/networks
Policies approved Total community foodassessments
Number of people whoworked on assessments
Number of residents affected by policies:
38,706,069
Number of residents in regions covered by assessments:
23,158,120

Community Food Projects Indicators of Success FY2010
24 Community Food Security Coalition
2010 2009 2008 2007 2006 2005 Overall
Total number of community food assessment completed
105 6 17 327 8 . 463
Number of residents living in regions covered by assessments
7,687,555 201,716 926,228 8,036,811 6,305,810 . 23,158,120
Total number of organizations/groups (e.g., schools, churches, government, hospitals, community-based organizations, small businesses and micro-enterprises)*
1,918 . . . . . 1,918
- Number of the people above who worked on community food assessments
565 113 335 347 872 . 2,232
Total number of volunteers
7,404 10,710 16,488 11,873 3,498 4,041 54,014
- Number of volunteer hours*
111,089 . . . . . 111,089
Total number of participants
68,359 107,337 254,706 186,299 107,073 13,636 737,410
-- Number of youth participants*
27,295 . . . . . 27,295
* Added in 2010.
Community Food Projects Indicators of Success FY2010
25 Community Food Security Coalition
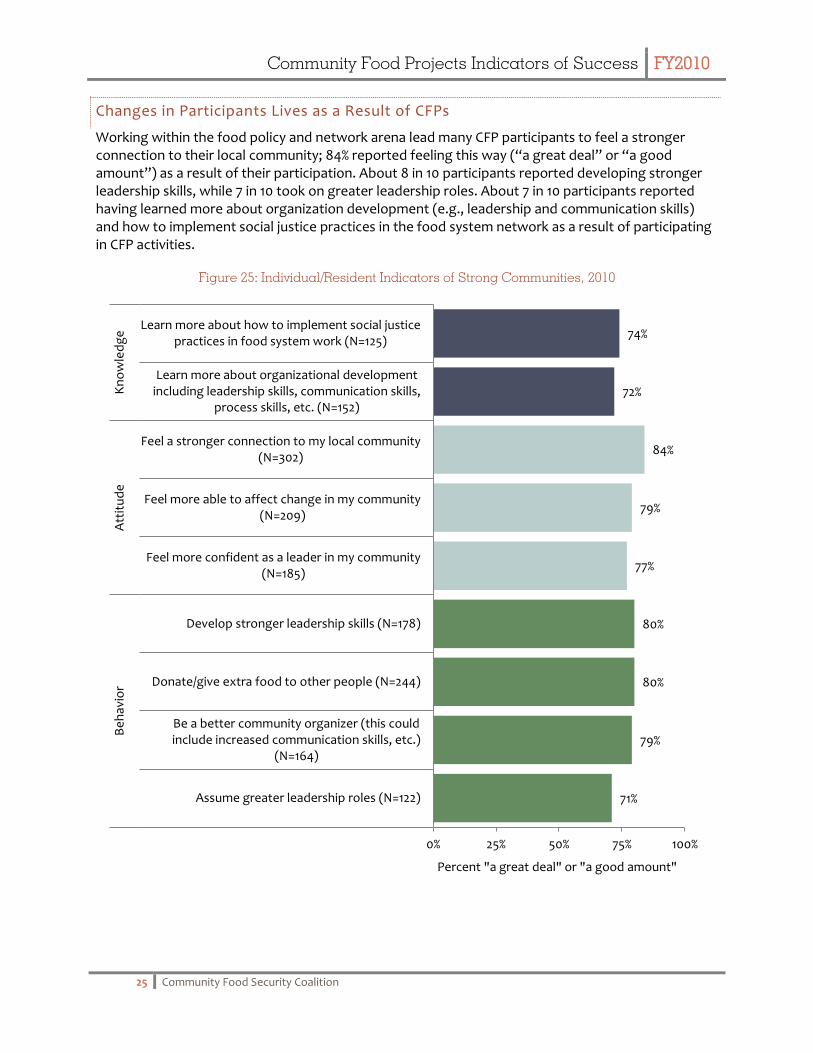
Changes in Participants Lives as a Result of CFPs
Working within the food policy and network arena lead many CFP participants to feel a stronger connection to their local community; 84% reported feeling this way (“a great deal” or “a good amount”) as a result of their participation. About 8 in 10 participants reported developing stronger leadership skills, while 7 in 10 took on greater leadership roles. About 7 in 10 participants reported having learned more about organization development (e.g., leadership and communication skills) and how to implement social justice practices in the food system network as a result of participating in CFP activities.
Figure 25: Individual/Resident Indicators of Strong Communities, 2010
71%
79%
80%
80%
77%
79%
84%
72%
74%
0% 25% 50% 75% 100%
Assume greater leadership roles (N=122)
Be a better community organizer (this couldinclude increased communication skills, etc.)
(N=164)
Donate/give extra food to other people (N=244)
Develop stronger leadership skills (N=178)
Feel more confident as a leader in my community(N=185)
Feel more able to affect change in my community(N=209)
Feel a stronger connection to my local community(N=302)
Learn more about organizational developmentincluding leadership skills, communication skills,
process skills, etc. (N=152)
Learn more about how to implement social justicepractices in food system work (N=125)
Be
hav
ior
Att
itu
de
Kn
ow
led
ge
Percent "a great deal" or "a good amount"

Community Food Projects Indicators of Success FY2010
26 Community Food Security Coalition
Thriving Local Economies
Thriving local economies depend upon the ecological integrity of the earth, its ecosystems, and species living within those ecosystems. Thriving local economies form decisions that ensure the wellbeing of future generations. They account for hidden costs in decision-making and work to build systems that regenerate output (wastes) into input (resources). Thriving local economies may utilize decentralized, participatory, and democratic processes designed to be informed by diverse community members and based upon a community’s assets. – Whole Measures for Community Food Systems: Values-based Planning and Evaluation
Economic Impact of CFPs
One of the defining elements of community food security work is its emphasis on facilitating community self-reliance. CFPs actively pursue and build collaboratives, networks and partnerships to grow a community’s capacity and reinforce the societal and economic connections that form a true and just community. Food security programs help to keep family farms in business and they keep farmers current with the latest information about efficient agriculture and the business of farming. Grantees create small businesses that rely on local suppliers and neighborhood consumers whose payrolls and purchases keep money in the community. The value of “buy local” is understood by everyday people across America, in no small part, because of the message spread by food projects.
Despite current economic woes, CFPs created 240 FTE jobs and started or supported 255 micro-enterprises/businesses during 2010. Also in the past year, CFPs operated 91 farmers’ markets, which made almost $1.7 million in sales. Grantees also developed almost 550 value-added products that generated about $8,000. Since 2005, CFPs have created over 2,500 jobs and started or supported over 3,800 micro-enterprises/businesses. Additionally, CFPs have introduced over 1,600 products to their communities.
Figure 26: Thriving Local Economies, 2010
Total Average
Number of jobs created (FTE) 240 7
Number of micro-enterprise opportunities/micro-businesses started or supported 255 8
Number of farmers' markets started or operated* 91 3
-- Total sales of local food (e.g., farmers' markets, CSAs, neighborhood stores, etc.)*
$1,682,110 $41,534
Number of new and/or value-added products developed 548 38
-- Total sales of new and/or value-added products* $8,005 $672
* Added in 2010.

Community Food Projects Indicators of Success FY2010
27 Community Food Security Coalition
Figure 27: Jobs, Businesses and Sales, 2005-2010
Figure 28: Thriving Local Economies, 2005-2010
2010 2009 2008 2007 2006 2005 Overall
Number of jobs created (FTE) 240 467 344 262 359 907 2,579
Number of micro-enterprise opportunities/micro-businesses started or supported
255 784 544 198 703 1,365 3,849
Number of farmers' markets started or operated*
91 . . . . . 91
- Total sales of local food (e.g., farmers' markets, CSAs, neighborhood stores, etc.)*
$1,682,110 . . . . . $1,682,110
Number of new and/or value-added products developed
548 206 65 190 316 314 1,639
- Total sales of new and/or value-added products*
$8,005 . . . . . $8,005
* Added in 2010.
2,579 3,849 1,639
$1,690,115
Total jobs created (FTE) Total micro-enterprises/businesses started or
supported
Total new and/or value-added products developed
Total sales (farmers'markets and products)*
* Added in 2010.

Community Food Projects Indicators of Success FY2010
28 Community Food Security Coalition
Changes in Participants Lives as a Result of CFPs
Participants in CFPs’ activities reported the gains in their knowledge about running a small business and increasing their customer base and market size. Additional gains for participants are reflected in the Vibrant Farms and Garden section found on page 31.
Figure 29: Individual/Resident Indicators of Thriving Economies, 2010
67%
71%
69%
0% 25% 50% 75% 100%
Increase the size of my local market (N=48)
Increase my number of customers (N=62)
Learn more about how to run a small food systembusiness (N=173)
Be
hav
ior
Kn
ow
led
ge
Percent "a great deal" or "a good amount"

Community Food Projects Indicators of Success FY2010
29 Community Food Security Coalition
Vibrant Farms and Gardens
Vibrant farms are central to the health and vitality of community-based food systems. While diverse in scale, methods, crops and markets, farms that contribute whole communities often embody practices that eliminate or minimize pesticides, support biodiversity, promote humane treatment of animals, and provide safe, just working conditions. Vibrant farms are often “local farms” that shorten the gap between farmer and consumer and actively contribute to sustaining and revitalizing regional food systems and economies. The continuation of traditional farms and practices, multigenerational family farms, and support for young farmers and immigrant farmers are essential to the future of farming, and food for all. – Whole Measures for Community Food Systems: Values-based Planning and Evaluation
Farms, Gardens and Land
Farmland is decreasing rapidly in its availability. The protection of these lands and their supporting agriculture provides food security, clean drinking water, flood mitigation, food and cover for wildlife, open space, jobs and economic stability. Community gardens also provide the benefit of community food security while increasing social connections, neighborhood beautification and safety and opportunities for healthy living for residents. These benefits are the result of CFPs advocating for policy changes that support the local food infrastructure and support the sustainable farming practices used in the community. Education and outreach are key components of this advocacy as the knowledge bestowed upon the community enables these changes.
About 1,900 acres of land were farmed or gardened by CFPs in 2010, with an estimated total of 58,000 acres farmed as part of the Community Food Project work since 2005. In 2010, grantees worked with 3,000 farmers, and the majority of these farmers (2,500) participated in farmers’ markets. An additional 4,400 gardeners worked 865 gardens as a part of CFPs activities. All told, CFPs have touched 13,700 farmers and 28,000 gardeners since 2005. Additionally, CFPs were able to enact 43 policies that supported small- and mid-scale farmers in the past year.
Figure 30: Vibrant Farms and Gardens, 2010 Total Average
Number of participants who are farmers (percent of all participants) 3,004 (23%) 66
-- Number of farmers participating in farmers' markets* 2,511 70
Number of participants who are gardeners (percent of all participants) 4,393 (33%) 84
Amount of land farmed or gardened by project (acres) 1,872 36
Number of gardens operated on land 865 18
-- Number of garden plots available within these gardens 3,502 123
Number of policies approved that support small- and mid-scale farmers (percent of all policies)*
43 (50%) 6
Number of policies approved to increase equitable employment practices for farm workers (percent of all policies)*
0 (0%) 0
Number of policies approved to increase the health and safety for food system workers (percent of policies)*
0 (0%)
0
* Added in 2010.

Community Food Projects Indicators of Success FY2010
30 Community Food Security Coalition
Figure 31: Farmers, Gardeners and Farmland, 2005-2010
Figure 32: Vibrant Farms and Gardens, 2005-2010
2010 2009 2008 2007 2006 2005 Overall
Number of participants who are farmers (percent of all participants)
3,004 (23%)
864 (2%)
1,411 (6%)
2,094 (11%)
3,180 (14%)
3,147 (45%)
13,700 (17%)
- Number of farmers participating in farmers' markets*
2,511 . . . . . 2,511
Number of participants who are gardeners (percent of all participants)
4,393 (33%)
6,045 (23%)
4,906 (11%)
3,059 (14%)
660 (67%)
3,272 (79%)
28,234 (35%)
Amount of land farmed or gardened by project (acres)
1,872 1,347 28,699 1,165 19,667 5,117 57,867
Number of gardens operated on land 865 1,086 693 350 229 119 3,341
Number of garden plots available within these gardens
3,502 2,380 2,335 2,161 1,197 1,108 12,683
Number of policies approved that support small- and mid-scale farmers (percent of all policies)*
43 (50%)
. . . . . 43
(50%)
Number of policies approved to increase equitable employment practices for farm workers (percent of all policies)*
0 (0%)
. . . . . 0
(0%)
Number of policies approved to increase the health and safety for food system workers (percent of policies)*
0 (0%)
. . . . . 0
(0%)
* Added in 2010.
13,700
28,234
57,867
Total farmers Total gardeners Total acres of land farmed orgardened

Community Food Projects Indicators of Success FY2010
31 Community Food Security Coalition
Changes in Participants Lives as a Result of CFPs
Participants in CFPs’ activities reported the greatest gains in their knowledge about working collaboratively and building diverse community participation; about four in five reported the CFP programs helped them a “great deal” or a “good amount.” About three-quarters reported feeling more confident they have the right skills to get a job. In terms of their behaviors, about 7 in 10 felt they were better equipped to diversify their farm products and increase their number of customers. About half felt they could make a living in agriculture or increase their incomes from farming or gardening.
Figure 33: Individual/Resident Indicators of Vibrant Farms and Gardens, 2010
52%
53%
73%
77%
81%
83%
0% 25% 50% 75% 100%
Increase my income from farming/gardening(N=145)
Make a living in agriculture (N=47)
Diversify my farm products (N=96)
Feel more confident that I have the right skills toget a job (N=146)
Learn more about how to build diversecommunity participation (N=145)
Learn more about how to work collaborativelywith others (organizations and individuals)
(N=221)
Be
hav
ior
Att
itu
de
Kn
ow
led
ge
Percent "a great deal" or "a good amount"

Community Food Projects Indicators of Success FY2010
32 Community Food Security Coalition
Sustainable Ecosystems
Sustainable, balanced ecosystems are built upon interdependent relationships, depend upon clean air and water and healthy soil, and provide the foundation for all life. Developing whole communities and strong and just food systems means honoring this interdependence and enhancing ecological integrity through our actions. A sustainable food system depends upon a sustainable ecosystem and produces, processes, and distributes food in a way that supports and enhances rather than destroys ecological systems. – Whole Measures For Community Food Systems: Values-based Planning and Evaluation
Local Produce
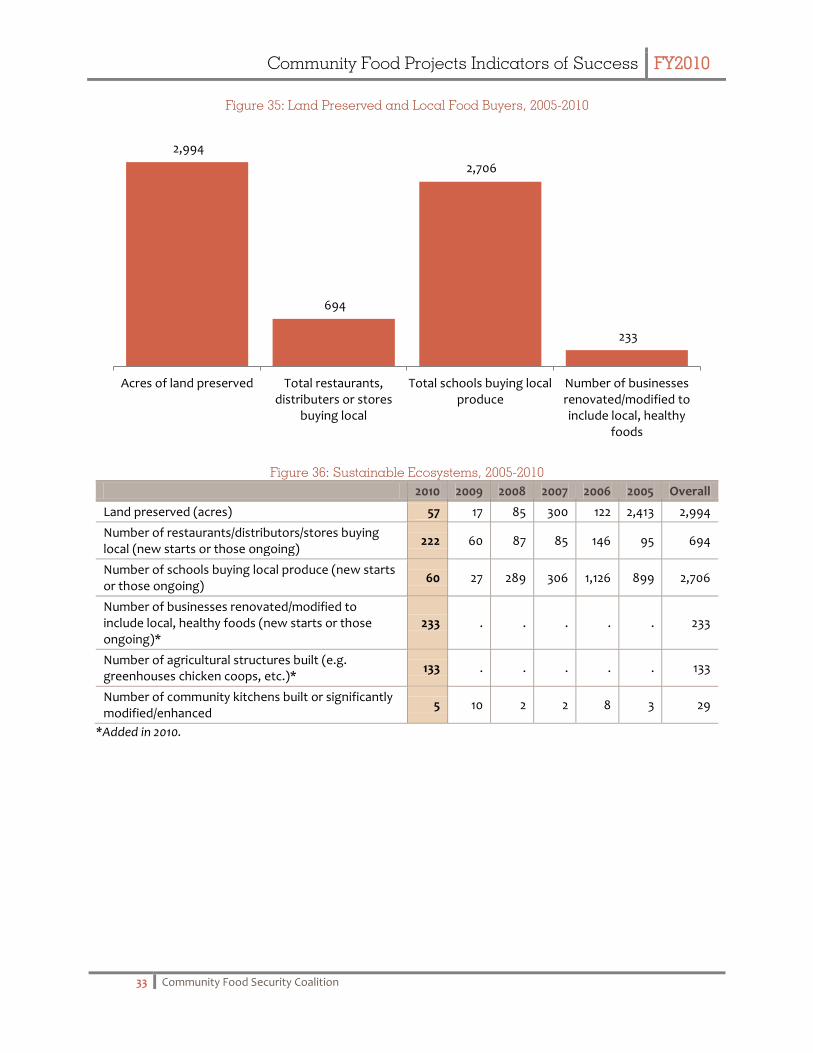
Using such strategies as promoting public education and outreach, building capacity and establishing collaborative and partnerships, CFPs preserved 57 acres of land in 2010. Since 2005, grantees have preserved almost 3,000 acres of land. Almost one-third (222) of the total 694 restaurants/ distributors/stores buying local food were acquired in 2010, and an additional 60 schools began buying local as well. In sum, 2,700 schools have bought food from CFPs. Also during 2010, grantees renovated or modified over 200 businesses to include local, healthy food and constructed over 100 agriculture structures (e.g., greenhouses and chicken coops).
Figure 34: Sustainable Ecosystems, 2010
Total Average
Land preserved (acres) 57 3
Number of restaurants/distributors/stores buying local (new starts or those ongoing)
222 6
Number of schools buying local produce (new starts or those ongoing) 60 13
Number of businesses renovated/modified to include local, healthy foods (new starts or those ongoing)*
233 11
Number of agricultural structures built (e.g., greenhouses, chicken coops, etc.)* 133 4
Number of community kitchens built or significantly modified/enhanced 5 1
* Added in 2010.
Community Food Projects Indicators of Success FY2010
33 Community Food Security Coalition
Figure 35: Land Preserved and Local Food Buyers, 2005-2010
Figure 36: Sustainable Ecosystems, 2005-2010
2010 2009 2008 2007 2006 2005 Overall
Land preserved (acres) 57 17 85 300 122 2,413 2,994
Number of restaurants/distributors/stores buying local (new starts or those ongoing)
222 60 87 85 146 95 694
Number of schools buying local produce (new starts or those ongoing)
60 27 289 306 1,126 899 2,706
Number of businesses renovated/modified to include local, healthy foods (new starts or those ongoing)*
233 . . . . . 233
Number of agricultural structures built (e.g. greenhouses chicken coops, etc.)*
133 . . . . . 133
Number of community kitchens built or significantly modified/enhanced
5 10 2 2 8 3 29
*Added in 2010.
2,994
694
2,706
233
Acres of land preserved Total restaurants,distributers or stores
buying local
Total schools buying localproduce
Number of businessesrenovated/modified toinclude local, healthy
foods

Community Food Projects Indicators of Success FY2010
34 Community Food Security Coalition
Changes in Participants Lives as a Result of CFPs
Four in five CFP program participants reported increased knowledge related to new farming and gardening skills. A similar proportion reported feeling more confident in their farming and gardening skills. About three-quarters of participants felt they could improve the distribution methods of their grown food and use more sustainable or organic farming or gardening practices.
Figure 37: Individual/Resident Indicators of Sustainable Ecosystems, 2010
73%
75%
73%
82%
71%
73%
80%
0% 25% 50% 75% 100%
Use more sustainable or organic farming orgardening practices (N=222)
Improve the way in which the food I grow isdistributed (N=110)
Feel a stronger connection to the naturalenvironment (N=197)
Feel more confident about my farming andgardening skills (N=237)
Learn more about the natural environment(N=207)
Learn more about sustainable agriculture,farming, and/or gardening practices (N=207)
Gain new farming and/or gardening skills (N=244)
Be
hav
ior
Att
itu
de
Kn
ow
led
ge
Percent "a great deal" or "a good amount"

Community Food Projects Indicators of Success FY2010
35 Community Food Security Coalition
Justice and Fairness
Just and fair food and farms come from food systems deliberately organized to promote social equity, justice, worker rights, and health through all activities. Achieving justice and fairness is an ongoing and evolving process involving many members of a community. It is a process that cultivates appropriate venues to recognize and dismantle unjust systems and that works to create alternative just systems. – Whole Measure for Community Food Systems: Values-based Planning and Evaluation
Pursuing Equitable Communities
The underlying foundation of community food security relates to the promotion of justice and fairness in communities and the food system. Although many of the elements of justice and fairness are difficult to quantify at a system or individual level, grantees reported on a number of indicators that may suggest communities and their food systems are taking steps to improve issues of equity. The indicators for Justice and Fairness are inter-woven throughout the five fields described above (with participant impacts highlighted in Strong Communities). Some examples of how justice and fairness has been promoted and increased in each field are:
Increased health and local food consumption by communities of color and participants in the Federal assistance programs; increased consumption of healthy and local foods through school meal purchases. (Healthy People)
Increased leadership among people of color in food policy councils; increased number of organizations represented on food policy councils. (Strong Communities)
Increased jobs and micro-business opportunities for people of color and individuals with low-incomes; Increased number of farmers’ markets in low-income communities and communities of color. (Thriving Local Economies)
Increased economic stability through diversifying products; increased customers; increased local market. (Vibrant Farms and Gardens)
Increased number of stores buying local produce; increased number of businesses modified -to include local, healthy foods; increased number of community kitchens; increased land preserved. (Sustainable Ecosystems)
Figure 38: Justice and Fairness, 2010
Total Average
Pounds of food generated and handled 1,354,306 21,864
Total number of customers or food recipients 163,570 2,746
-- FMNP participants 4,719 248
-- SNAP recipients 11,180 427
-- SFMNP meal recipients 9,303 488
-- WIC Program recipients 5,417 207
-- school or summer youth meal recipients 9,182 482
Organizations represented on the councils or networks 329 17
Individuals on the council(s) or network(s) and participants assuming new or enhanced leadership roles in the community*
2,099 31

Community Food Projects Indicators of Success FY2010
36 Community Food Security Coalition
Total Average
-- those who are people of color* 1,165 17
FTE jobs created 240 7
Number of micro-enterprise opportunities/micro-businesses started or supported 255 8
Number of schools buying local produce (new starts or those ongoing) 60 13
Number of businesses renovated/modified to include local, healthy foods (new starts or those ongoing)
233 11
*Added in 2010.
Figure 39: Indicators of Justice and Fairness, 2005-2010 2010 2009 2008 2007 2006 2005 Overall
Pounds of food generated and handled
1,354,306 821,012 1,419,028 3,261,855 6,798,331 6,464,919 20,119,451
Total number of customers or food recipients
163,570 100,444 1,139,770 821,383 481,235 4,014 2,710,416
-- FMNP participants 4,719 13,842 30,976 34,652 25,597 . 109,786
-- SNAP recipients 11,180 3,338 10,881 21,744 53,612 . 100,756
-- SFMNP meal recipients
9,303 13,516 595 624 33,968 . 58,006
-- WIC Program recipients
5,417 4,873 15,901 7,260 15,166 4,014 52,632
-- school or summer youth meal recipients
9,182 13,154 972,776 584,474 239,191 . 1,818,777
Organizations represented on the councils or networks
329 38 51 272 202 . 892
Individuals on the councils or networks and participants assuming new or enhanced leadership roles in the community*
2,099 164 404 753 1,117 . 4,537
-- those who are people of color*
1,165 0 0 0 0 . 1,165
FTE jobs created 240 467 344 262 359 907 2,579
Number of micro-enterprise opportunities/micro-businesses started or supported
255 784 544 198 703 1,365 3,849
Number of schools buying local produce
60 27 289 306 1,126 899 2,706
Number of businesses renovated/modified to include local, healthy foods
233 . . . . . 233
*Added in 2010.

Community Food Projects Indicators of Success FY2010
37 Community Food Security Coalition
Changes in Participants Lives as a Result of CFPs
Participation in Community Food Projects often resulted in increased learning and action in the areas of justice and fairness. Community Food Projects that understand the connection between food insecurity, race, class and privilege are better equipped to implement activities that confront and change these dynamics. Examples of changes in participants’ knowledge, attitude, and behavior that are described in the above fields include:
Increased knowledge about eating healthy foods and diet-related diseases; increased feelings of connection to food source; increased confidence in food preparation; increased connection to one’s culture; increased ability to provide food for self and family; Increased health. (Healthy People)
Increased knowledge of how to implement social justice practices; Increased leadership and organizational development skills; Increased connection to community; Increased confidence as a leader and with ability to affect change; Increased leadership roles; Increased knowledge and behaviors related to dismantling race, class and privilege barriers in the food system. (Strong Communities)
Increased knowledge for running a small business; Increased confidence in skills to get a job; Increased diversification of farm products; Increased customer and market size; Increased ability to make a living in agriculture. (Thriving Local Economies and Vibrant Farms and Gardens)
Increased knowledge of farming and gardening; increased confidence in farming/gardening skills; increased connection to nature; increased sustainable/organic practices. (Sustainable Ecosystems)
Increased knowledge of on how race, class and privilege affect community food systems; Increased action taken to help reduce the effects of race, class and privilege; Increased consumption of traditional and culturally relevant foods. (Justice and Fairness)
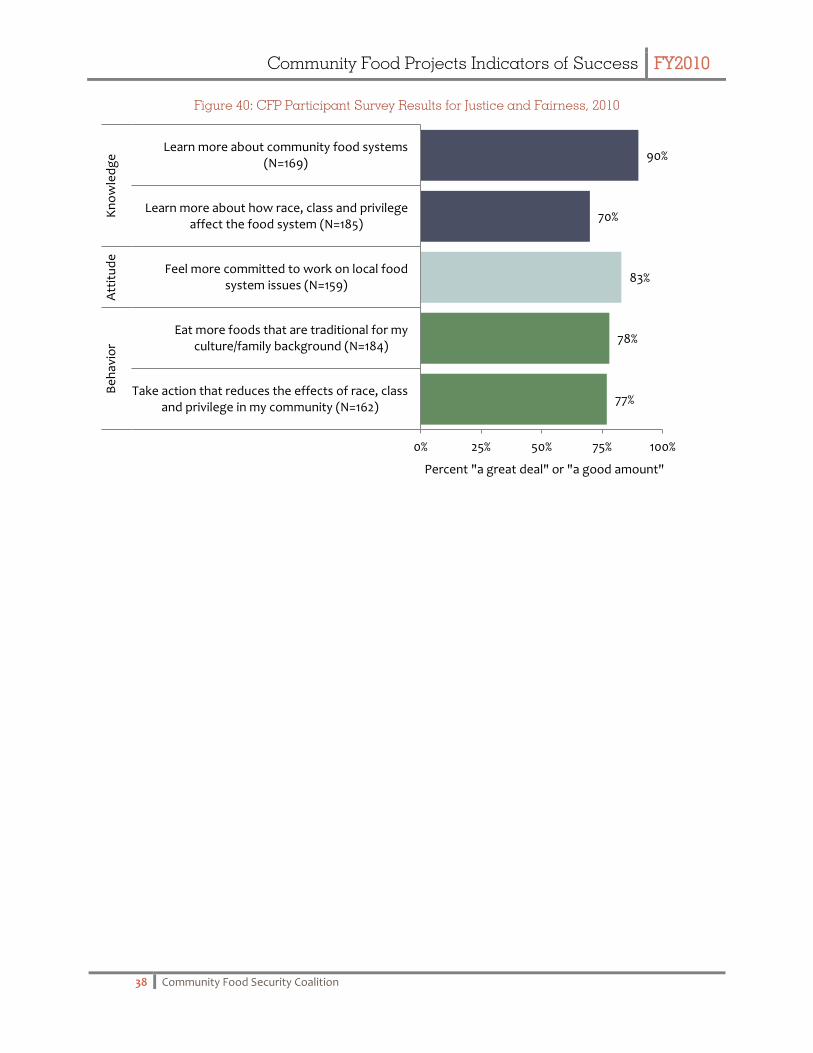
Participation in Community Food Projects often resulted in increased learning and action in the areas of justice and fairness. A strong majority of residents participating in CFPs with a focus on race and equity issues reported increased knowledge of community food systems (90%) and a stronger commitment to work on local food system issues (83%). More than 70% of participants reported increased knowledge on how race, class and privilege affect these systems and had taken action to help reduce these affects in their communities. Nearly three-fourths of participants surveyed reported eating foods more traditional to their culture/family background.
Community Food Projects Indicators of Success FY2010
38 Community Food Security Coalition
Figure 40: CFP Participant Survey Results for Justice and Fairness, 2010
77%
78%
83%
70%
90%
0% 25% 50% 75% 100%
Take action that reduces the effects of race, classand privilege in my community (N=162)
Eat more foods that are traditional for myculture/family background (N=184)
Feel more committed to work on local foodsystem issues (N=159)
Learn more about how race, class and privilegeaffect the food system (N=185)
Learn more about community food systems(N=169)
Be
hav
ior
Att
itu
de
Kn
ow
led
ge
Percent "a great deal" or "a good amount"

Community Food Projects Indicators of Success FY2010
39 Community Food Security Coalition
C o n c l u s i o n
The grantees of the Community Food Projects Competitive Grants Program showed their strength by providing education, skills, food and resources to a diverse group of residents and food insecure communities across the nation.
In 2010, 3,000 farmers - many disadvantaged - were trained on sustainable agriculture and business management. Hundreds of jobs and micro-businesses supporting the local food system were created, and customer bases for local agriculture were increased. Farm-to-cafeteria programs were created throughout the country providing markets for local farmers. Farmers participating in the program reported significant gains in knowledge of sustainable agriculture and business practices and more than one-half reported increased income as a result of the grant program.
More than 1.3 million pounds of local, healthy food was distributed to nearly 165,000 people in 2010. Most of these people lived low-income neighborhoods. With fast food available easily and cheaply for many Americans, the impact of providing healthy, fresh fruits and vegetables cannot be underestimated. Over 9,000 children and youth in schools or summer programs ate fresh fruits and vegetables because of farm-to-cafeteria programs. SNAP and WIC recipients purchased local produce at farmers markets, and elder food recipients received seasonal fruit and vegetable shipments from local CSAs. These healthy foods provide recipients with not only the nutrition to stay well, but also instill healthy eating habits that can last a lifetime. This becomes especially important for young children who may be at risk for obesity through the bad habits learned from a sedentary lifestyle. Food recipients and customers reported significant gains in their access and consumption of healthy food as well reported improvement to their overall health status.
The 2,000 acres of land farmed and preserved by CFPs in 2010 delayed farmland depletion and enhanced local food production. Youth and urban gardeners learned to grow and prepare their own food through more than 3,500 community gardens.
Community food system capacity and infrastructure was enhanced through community food assessments, the formation of food policy councils and networks and the implementation of new policies. More than 13 million residents lived in the communities where these community-wide changes were made. Residents participating in these assessments and collaboratives reported significant knowledge changes related to their local food systems, increased connection to their communities and increased motivation to become involved as leaders and community organizers to promote stronger communities.
The 2010 results from the Community Food Projects program continue to demonstrate the importance of these grants for improving the health, environment and economy of this country, where residents of almost every age are taught about healthy food supply and where residents have access to delicious, abundant locally produced fruits, vegetables and meat. The following table provides a summary view the work of the CFPs in 2010 as well as a summary of the outputs and outcomes from the years of 2005 through 2010.

Community Food Projects Indicators of Success FY2010
40 Community Food Security Coalition
Figure 41: Community Food Security at a Glance
Whole Measures (WM) Field
Indicator of Success 2010 2005-2010
Healthy People
Pounds of food generated and handled 1.3 million 20 million
-- pounds produced 935,000 5 million
-- pounds donated 80,000 800,000
-- pounds sold 860,000 6 million
Customers and food recipients 164,000 2.7 million
-- FMNP participants 4,700 109,800
-- SNAP recipients 11,100 101,000
-- SFMNP meal recipients 9,300 58,000
-- WIC Program recipients 5,400 52,600
-- school or summer youth meal recipients 9,200 1.8 million
Strong Communities
Food policy councils/networks formed 26 65
Organizations represented on the councils or networks 329 890
Individuals on the council(s) or network(s) and participants assuming new or enhanced leadership roles in the community*
2,100 2,100
-- those who are people of color* 1,165 1,165
Approved policies 57 540
-- people affected by policies 5.3 million 39 million
Community food assessments completed 105 463
-- people affected by assessments 7.6 million 23 million
Thriving Local Economies
FTE jobs created 240 2,600
Micro-enterprise opportunities/micro-businesses started or supported
255 3,800
Farmers’ markets started* 90 90
-- sales of farmers’ markets* $1.7 million $1.7 million
New and/or value-added products developed 550 1,600
-- sales of products* $8,000 $8,000
Vibrant Farms and Gardens
Farmers participating 3,000 13,700
-- those participating in farmers’ markets* 2,500 2,500
Gardeners participating 4,400 28,000
Acres of land farmed or gardened 1,900 58,000
Gardens operated 3,500 12,700
Number of policies approved that support small- and mid-scale farmers *
40 40
Sustainable Ecosystems
Acres of land preserved 57 3,000
Restaurants/distributors/stores buying local 220 700
Schools buying local produce 60 2,700
Businesses renovated/modified to include local, healthy food*
230 230
Structures built* 130 130
Community kitchens built 5 30

Community Food Projects Indicators of Success FY2010
41 Community Food Security Coalition
Whole Measures (WM) Field
Indicator of Success 2010 2005-2010
Justice and Fairness
(These indicators are represented in
a WM CFS field above and
repeated here.)
Pounds of food generated and handled 1.3 million 20 million
Customers and food recipients 164,000 2.7 million
-- FMNP participants 4,700 109,800
-- SNAP recipients 11,100 101,000
-- SFMNP meal recipients 9,300 58,000
-- WIC Program recipients 5,400 52,600
-- school or summer youth meal recipients 9,200 1.8 million
Organizations represented on the councils or networks 329 890
Individuals on the council(s) or network(s) and participants assuming new or enhanced leadership roles in the community*
2,100 2,100
-- those who are people of color* 1,165 1,165
FTE jobs created 240 2,600
Micro-enterprise opportunities/micro-businesses started or supported
255 3,800
Schools buying local produce 60 2,700
Businesses renovated/modified to include local, healthy food*
230 230
* Tracking of this indicator began in 2010.
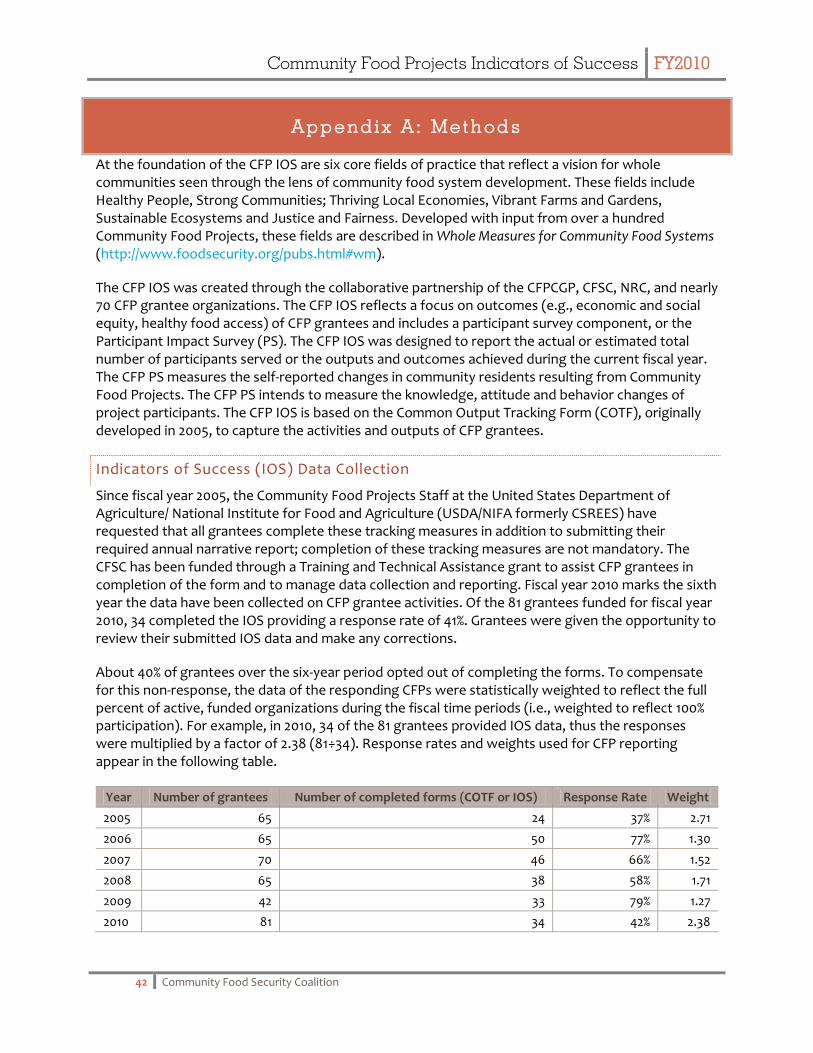
Community Food Projects Indicators of Success FY2010
42 Community Food Security Coalition
A p p e n d i x A : M e t h o d s
At the foundation of the CFP IOS are six core fields of practice that reflect a vision for whole communities seen through the lens of community food system development. These fields include Healthy People, Strong Communities; Thriving Local Economies, Vibrant Farms and Gardens, Sustainable Ecosystems and Justice and Fairness. Developed with input from over a hundred Community Food Projects, these fields are described in Whole Measures for Community Food Systems (http://www.foodsecurity.org/pubs.html#wm).
The CFP IOS was created through the collaborative partnership of the CFPCGP, CFSC, NRC, and nearly 70 CFP grantee organizations. The CFP IOS reflects a focus on outcomes (e.g., economic and social equity, healthy food access) of CFP grantees and includes a participant survey component, or the Participant Impact Survey (PS). The CFP IOS was designed to report the actual or estimated total number of participants served or the outputs and outcomes achieved during the current fiscal year. The CFP PS measures the self-reported changes in community residents resulting from Community Food Projects. The CFP PS intends to measure the knowledge, attitude and behavior changes of project participants. The CFP IOS is based on the Common Output Tracking Form (COTF), originally developed in 2005, to capture the activities and outputs of CFP grantees.
Indicators of Success (IOS) Data Collection
Since fiscal year 2005, the Community Food Projects Staff at the United States Department of Agriculture/ National Institute for Food and Agriculture (USDA/NIFA formerly CSREES) have requested that all grantees complete these tracking measures in addition to submitting their required annual narrative report; completion of these tracking measures are not mandatory. The CFSC has been funded through a Training and Technical Assistance grant to assist CFP grantees in completion of the form and to manage data collection and reporting. Fiscal year 2010 marks the sixth year the data have been collected on CFP grantee activities. Of the 81 grantees funded for fiscal year 2010, 34 completed the IOS providing a response rate of 41%. Grantees were given the opportunity to review their submitted IOS data and make any corrections.
About 40% of grantees over the six-year period opted out of completing the forms. To compensate for this non-response, the data of the responding CFPs were statistically weighted to reflect the full percent of active, funded organizations during the fiscal time periods (i.e., weighted to reflect 100% participation). For example, in 2010, 34 of the 81 grantees provided IOS data, thus the responses were multiplied by a factor of 2.38 (81÷34). Response rates and weights used for CFP reporting appear in the following table.
Year Number of grantees Number of completed forms (COTF or IOS) Response Rate Weight
2005 65 24 37% 2.71
2006 65 50 77% 1.30
2007 70 46 66% 1.52
2008 65 38 58% 1.71
2009 42 33 79% 1.27
2010 81 34 42% 2.38

Community Food Projects Indicators of Success FY2010
43 Community Food Security Coalition
Participant Impact Survey (PS) Data Administration and Data Collection
The Participant Impact Survey (PS) measures the self-reported changes in community residents resulting from Community Food Projects and is intended to measure the knowledge, attitude and behavior changes of project participants. Grantees were provided instructions for administering the PS to their participants. Administration included five basic steps and is detailed in the CFP PS Guide (available under separate cover):
Customizing the survey for program participants
Selecting the survey participants
Deciding when to survey
Selecting a survey administration mode and collecting data
Entering the data into the CFP IOS system
After administering survey to their participants, grantees entered the survey data into an online data collection form. NRC collected these data for integration into the IOS report. Grantees submitting PS data received aggregated results of their programs for use in program improvement, reporting and grant writing. As with IOS, administration of the PS was not mandatory. A total of 17 grantees administered PS to a total of 407 participants. Data for the CFP PS by the grantees remain unweighted.
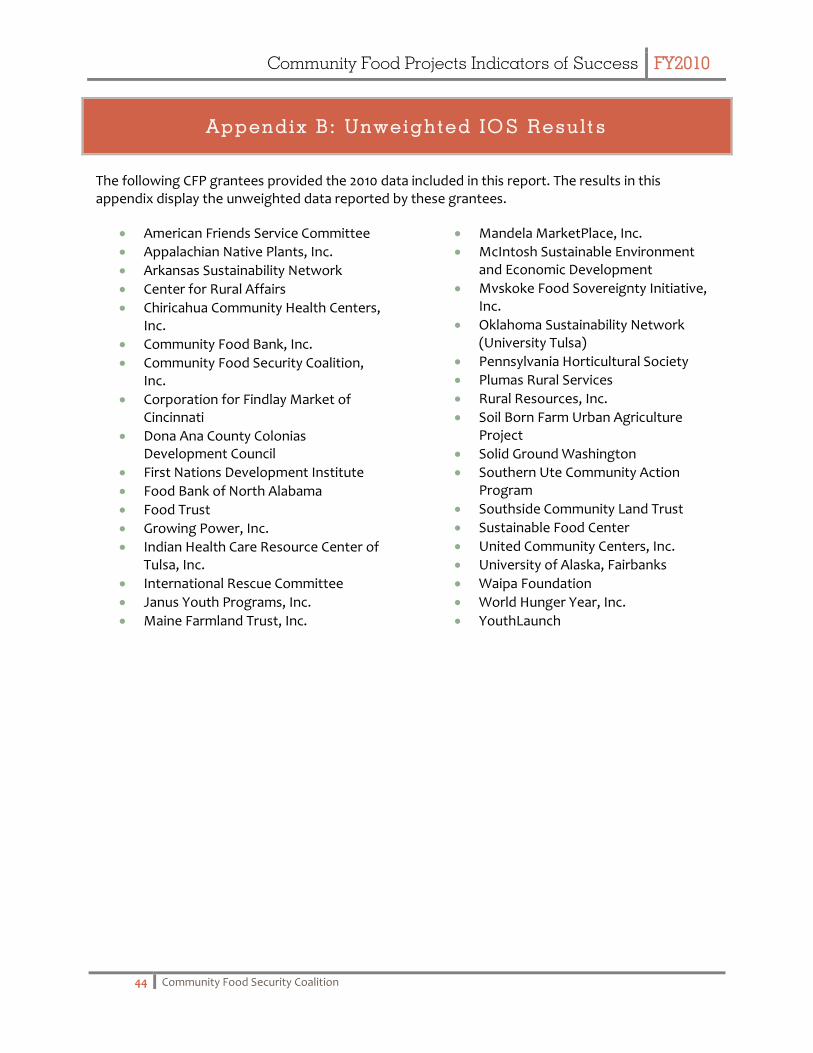
Community Food Projects Indicators of Success FY2010
44 Community Food Security Coalition
A p p e n d i x B : U n w e i g h t e d I O S R e s u l t s
The following CFP grantees provided the 2010 data included in this report. The results in this appendix display the unweighted data reported by these grantees.
American Friends Service Committee
Appalachian Native Plants, Inc.
Arkansas Sustainability Network
Center for Rural Affairs
Chiricahua Community Health Centers, Inc.
Community Food Bank, Inc.
Community Food Security Coalition, Inc.
Corporation for Findlay Market of Cincinnati
Dona Ana County Colonias Development Council
First Nations Development Institute
Food Bank of North Alabama
Food Trust
Growing Power, Inc.
Indian Health Care Resource Center of Tulsa, Inc.
International Rescue Committee
Janus Youth Programs, Inc.
Maine Farmland Trust, Inc.
Mandela MarketPlace, Inc.
McIntosh Sustainable Environment and Economic Development
Mvskoke Food Sovereignty Initiative, Inc.
Oklahoma Sustainability Network (University Tulsa)
Pennsylvania Horticultural Society
Plumas Rural Services
Rural Resources, Inc.
Soil Born Farm Urban Agriculture Project
Solid Ground Washington
Southern Ute Community Action Program
Southside Community Land Trust
Sustainable Food Center
United Community Centers, Inc.
University of Alaska, Fairbanks
Waipa Foundation
World Hunger Year, Inc.
YouthLaunch
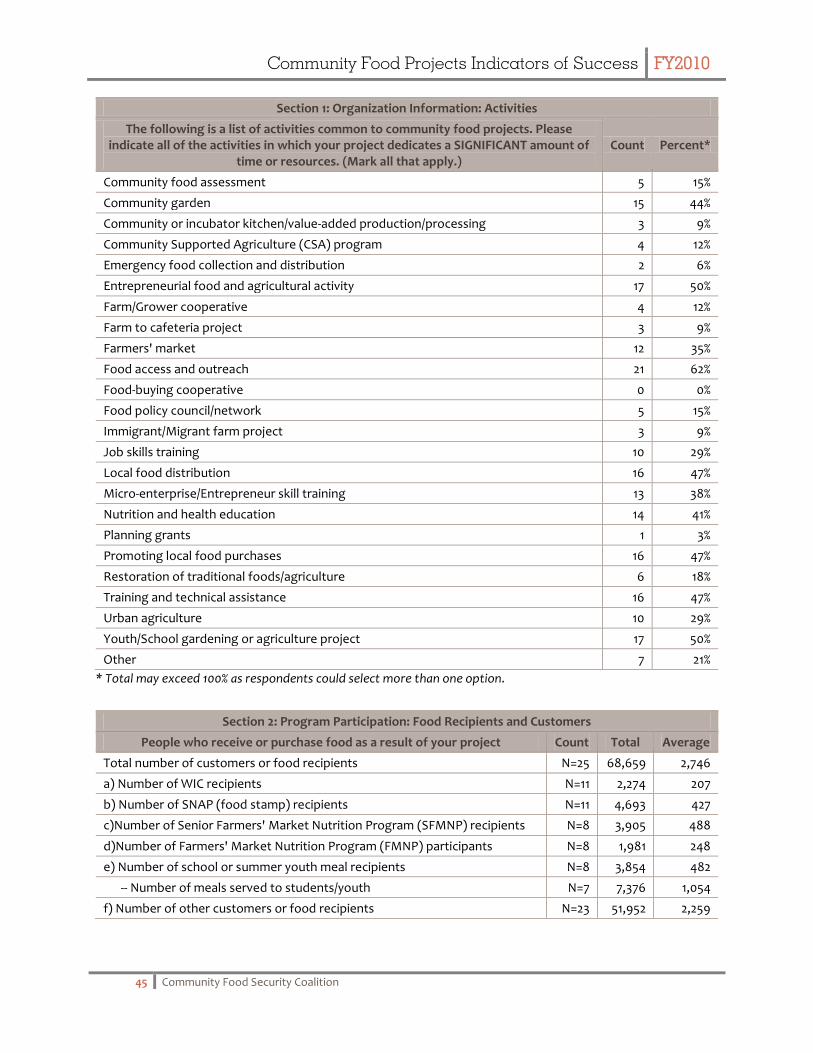
Community Food Projects Indicators of Success FY2010
45 Community Food Security Coalition
Section 1: Organization Information: Activities
The following is a list of activities common to community food projects. Please indicate all of the activities in which your project dedicates a SIGNIFICANT amount of
time or resources. (Mark all that apply.) Count Percent*
Community food assessment 5 15%
Community garden 15 44%
Community or incubator kitchen/value-added production/processing 3 9%
Community Supported Agriculture (CSA) program 4 12%
Emergency food collection and distribution 2 6%
Entrepreneurial food and agricultural activity 17 50%
Farm/Grower cooperative 4 12%
Farm to cafeteria project 3 9%
Farmers' market 12 35%
Food access and outreach 21 62%
Food-buying cooperative 0 0%
Food policy council/network 5 15%
Immigrant/Migrant farm project 3 9%
Job skills training 10 29%
Local food distribution 16 47%
Micro-enterprise/Entrepreneur skill training 13 38%
Nutrition and health education 14 41%
Planning grants 1 3%
Promoting local food purchases 16 47%
Restoration of traditional foods/agriculture 6 18%
Training and technical assistance 16 47%
Urban agriculture 10 29%
Youth/School gardening or agriculture project 17 50%
Other 7 21%
* Total may exceed 100% as respondents could select more than one option.
Section 2: Program Participation: Food Recipients and Customers
People who receive or purchase food as a result of your project Count Total Average
Total number of customers or food recipients N=25 68,659 2,746
a) Number of WIC recipients N=11 2,274 207
b) Number of SNAP (food stamp) recipients N=11 4,693 427
c)Number of Senior Farmers' Market Nutrition Program (SFMNP) recipients N=8 3,905 488
d)Number of Farmers' Market Nutrition Program (FMNP) participants N=8 1,981 248
e) Number of school or summer youth meal recipients N=8 3,854 482
-- Number of meals served to students/youth N=7 7,376 1,054
f) Number of other customers or food recipients N=23 51,952 2,259
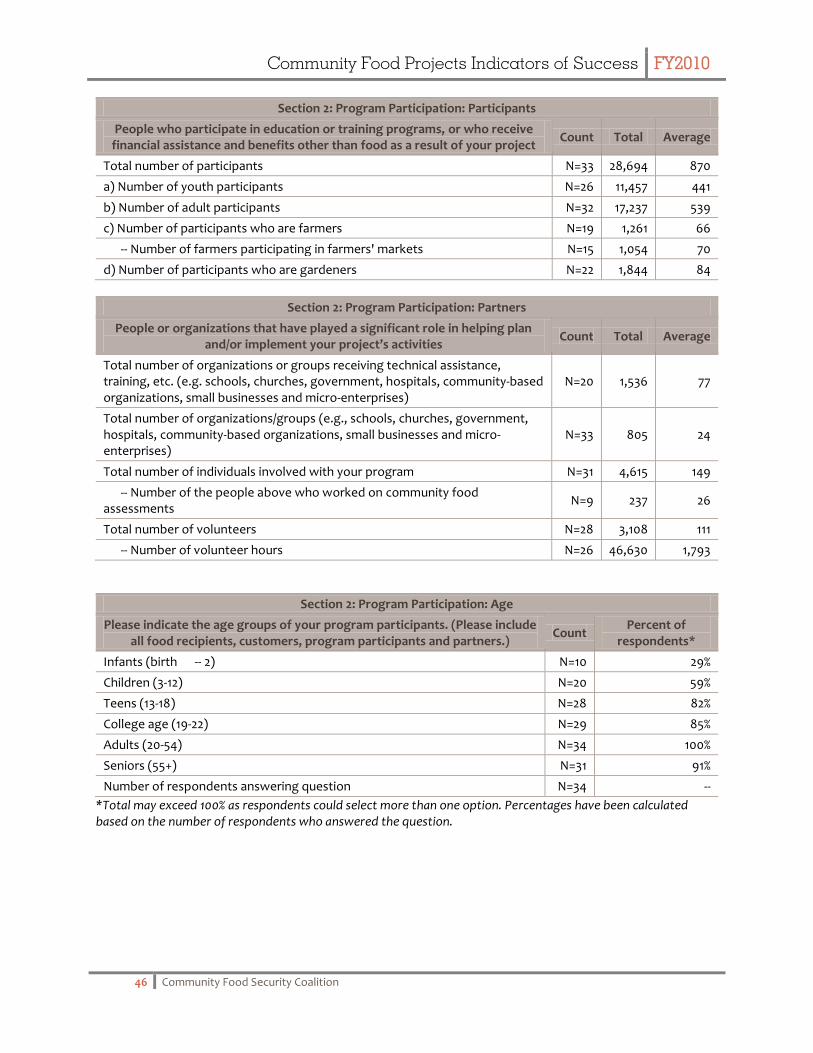
Community Food Projects Indicators of Success FY2010
46 Community Food Security Coalition
Section 2: Program Participation: Participants
People who participate in education or training programs, or who receive financial assistance and benefits other than food as a result of your project
Count Total Average
Total number of participants N=33 28,694 870
a) Number of youth participants N=26 11,457 441
b) Number of adult participants N=32 17,237 539
c) Number of participants who are farmers N=19 1,261 66
-- Number of farmers participating in farmers' markets N=15 1,054 70
d) Number of participants who are gardeners N=22 1,844 84
Section 2: Program Participation: Partners
People or organizations that have played a significant role in helping plan and/or implement your project’s activities
Count Total Average
Total number of organizations or groups receiving technical assistance, training, etc. (e.g. schools, churches, government, hospitals, community-based organizations, small businesses and micro-enterprises)
N=20 1,536 77
Total number of organizations/groups (e.g., schools, churches, government, hospitals, community-based organizations, small businesses and micro-enterprises)
N=33 805 24
Total number of individuals involved with your program N=31 4,615 149
-- Number of the people above who worked on community food assessments
N=9 237 26
Total number of volunteers N=28 3,108 111
-- Number of volunteer hours N=26 46,630 1,793
Section 2: Program Participation: Age
Please indicate the age groups of your program participants. (Please include all food recipients, customers, program participants and partners.)
Count Percent of
respondents*
Infants (birth -- 2) N=10 29%
Children (3-12) N=20 59%
Teens (13-18) N=28 82%
College age (19-22) N=29 85%
Adults (20-54) N=34 100%
Seniors (55+) N=31 91%
Number of respondents answering question N=34 --
*Total may exceed 100% as respondents could select more than one option. Percentages have been calculated based on the number of respondents who answered the question.
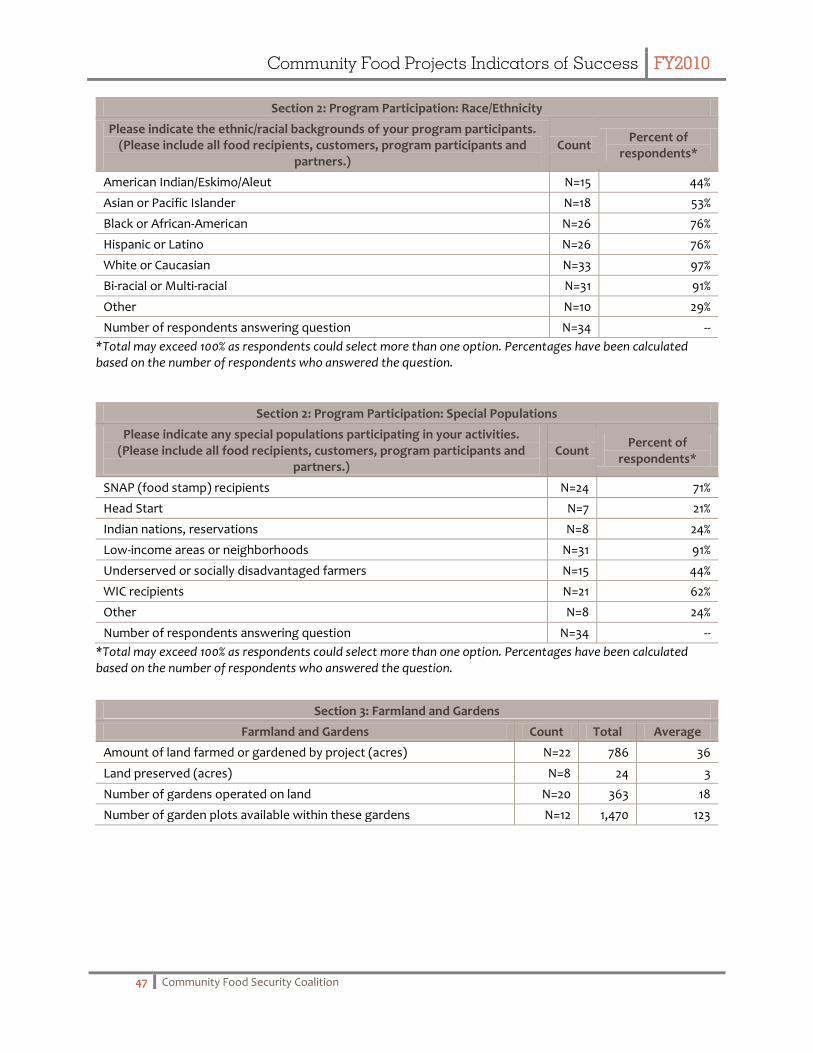
Community Food Projects Indicators of Success FY2010
47 Community Food Security Coalition
Section 2: Program Participation: Race/Ethnicity
Please indicate the ethnic/racial backgrounds of your program participants. (Please include all food recipients, customers, program participants and
partners.) Count
Percent of respondents*
American Indian/Eskimo/Aleut N=15 44%
Asian or Pacific Islander N=18 53%
Black or African-American N=26 76%
Hispanic or Latino N=26 76%
White or Caucasian N=33 97%
Bi-racial or Multi-racial N=31 91%
Other N=10 29%
Number of respondents answering question N=34 --
*Total may exceed 100% as respondents could select more than one option. Percentages have been calculated based on the number of respondents who answered the question.
Section 2: Program Participation: Special Populations
Please indicate any special populations participating in your activities. (Please include all food recipients, customers, program participants and
partners.) Count
Percent of respondents*
SNAP (food stamp) recipients N=24 71%
Head Start N=7 21%
Indian nations, reservations N=8 24%
Low-income areas or neighborhoods N=31 91%
Underserved or socially disadvantaged farmers N=15 44%
WIC recipients N=21 62%
Other N=8 24%
Number of respondents answering question N=34 --
*Total may exceed 100% as respondents could select more than one option. Percentages have been calculated based on the number of respondents who answered the question.
Section 3: Farmland and Gardens
Farmland and Gardens Count Total Average
Amount of land farmed or gardened by project (acres) N=22 786 36
Land preserved (acres) N=8 24 3
Number of gardens operated on land N=20 363 18
Number of garden plots available within these gardens N=12 1,470 123

Community Food Projects Indicators of Success FY2010
48 Community Food Security Coalition
Section 4: Food
Total pounds of food generated and handled: Count Total Average
Total pounds of food generated and handled N=26 568,474 21,864
Section 4: Food Generated
For the total food generated, please indicate the how many pounds of this food were generated using the following methods:
Count Total Average
Food produced N=22 392,536 17,843
Food purchased or procured N=13 175,576 13,506
Food collected or gleaned N=2 362 181
Food otherwise generated N=0 0 0
Section 4: Food Handled
For the total food handled, please indicate how many pounds of this food were handled using the following methods:
Count Total Average
Food processed N=8 35,193 4,399
Food donated N=18 33,765 1,876
Food distributed N=10 74,005 7,401
Food sold N=20 362,144 18,107
Food delivered N=3 5,326 1,775
Food composted N=13 28,816 2,217
Food otherwise handled N=6 29,225 4,871
Section 5: Economic Impact
Count Total Average
Number of jobs created (FTE) N=15 101 7
Number of micro-enterprise opportunities/micro-businesses started or supported
N=14 107 8
Number of restaurants/distributors/stores buying local (new starts or those ongoing)
N=16 93 6
Number of schools buying local produce (new starts or those ongoing) N=2 25 13
Number of businesses renovated/modified to include local, healthy foods (new starts or those ongoing)
N=9 98 11
Number of agricultural structures built (e.g. greenhouses chicken coops, etc.)
N=13 56 4
Number of community kitchens built or significantly modified/enhanced N=2 2 1
Number of farmers' markets started or operated N=14 38 3
-- Total sales of local food (e.g., farmers' markets, CSAs, neighborhood stores, etc.)
N=17 $706,071 $41,534
Number of new and/or value-added products developed N=6 230 38
-- Total sales of new and/or value-added products N=5 $3,360 $672
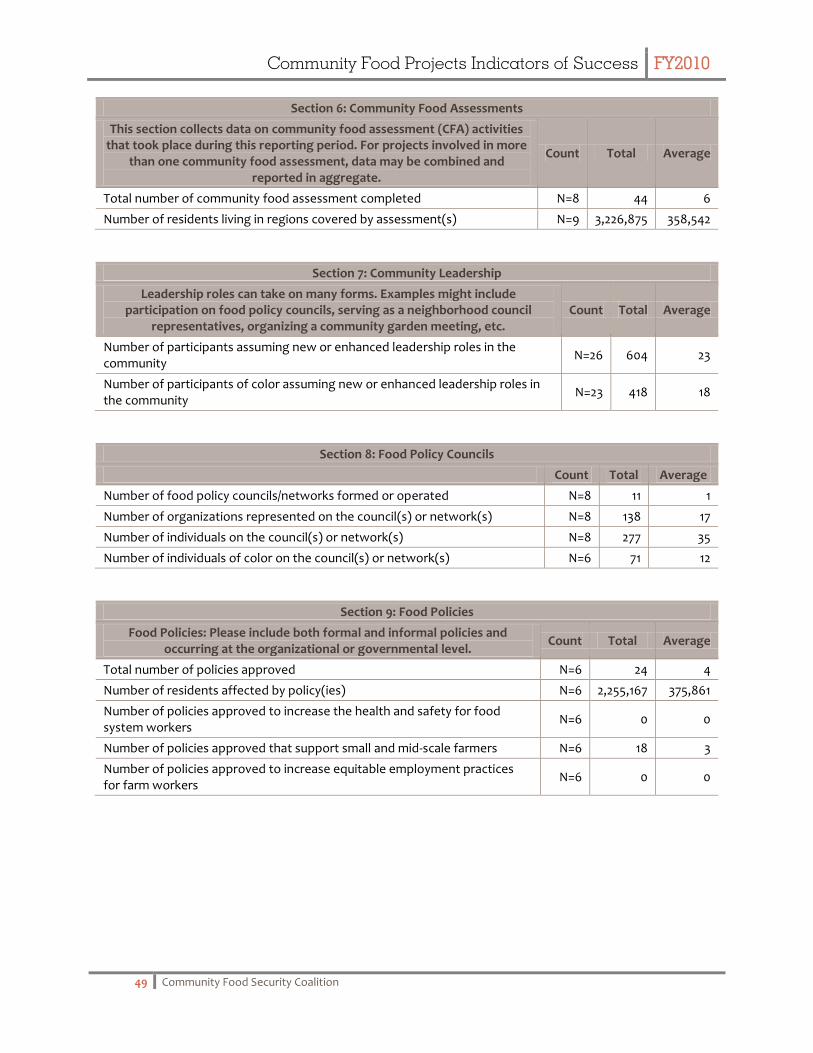
Community Food Projects Indicators of Success FY2010
49 Community Food Security Coalition
Section 6: Community Food Assessments
This section collects data on community food assessment (CFA) activities that took place during this reporting period. For projects involved in more
than one community food assessment, data may be combined and reported in aggregate.
Count Total Average
Total number of community food assessment completed N=8 44 6
Number of residents living in regions covered by assessment(s) N=9 3,226,875 358,542
Section 7: Community Leadership
Leadership roles can take on many forms. Examples might include participation on food policy councils, serving as a neighborhood council
representatives, organizing a community garden meeting, etc. Count Total Average
Number of participants assuming new or enhanced leadership roles in the community
N=26 604 23
Number of participants of color assuming new or enhanced leadership roles in the community
N=23 418 18
Section 8: Food Policy Councils
Count Total Average
Number of food policy councils/networks formed or operated N=8 11 1
Number of organizations represented on the council(s) or network(s) N=8 138 17
Number of individuals on the council(s) or network(s) N=8 277 35
Number of individuals of color on the council(s) or network(s) N=6 71 12
Section 9: Food Policies
Food Policies: Please include both formal and informal policies and occurring at the organizational or governmental level.
Count Total Average
Total number of policies approved N=6 24 4
Number of residents affected by policy(ies) N=6 2,255,167 375,861
Number of policies approved to increase the health and safety for food system workers
N=6 0 0
Number of policies approved that support small and mid-scale farmers N=6 18 3
Number of policies approved to increase equitable employment practices for farm workers
N=6 0 0
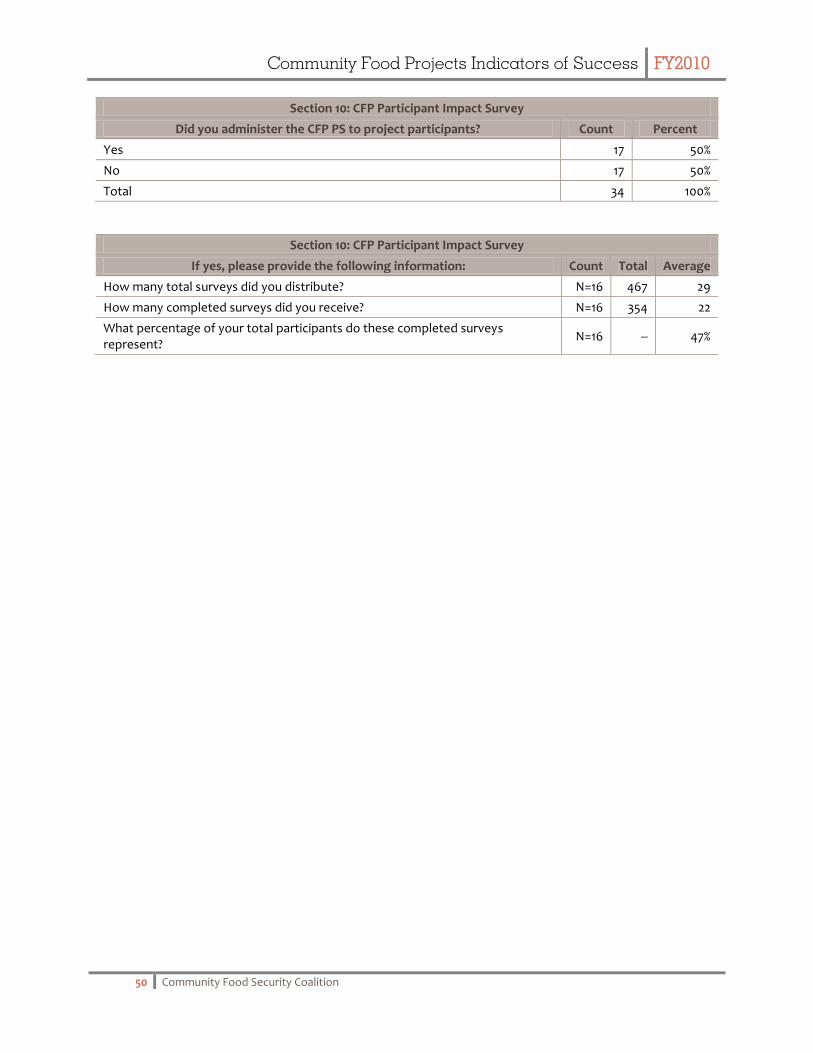
Community Food Projects Indicators of Success FY2010
50 Community Food Security Coalition
Section 10: CFP Participant Impact Survey
Did you administer the CFP PS to project participants? Count Percent
Yes 17 50%
No 17 50%
Total 34 100%
Section 10: CFP Participant Impact Survey
If yes, please provide the following information: Count Total Average
How many total surveys did you distribute? N=16 467 29
How many completed surveys did you receive? N=16 354 22
What percentage of your total participants do these completed surveys represent?
N=16 -- 47%
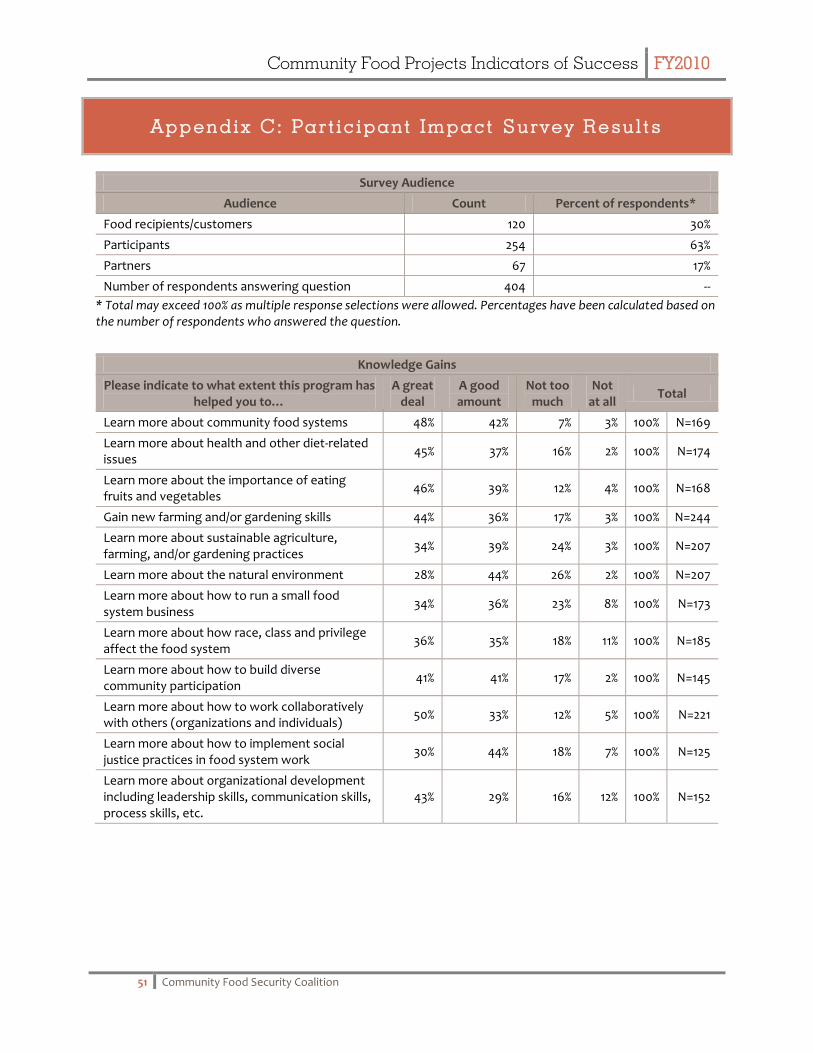
Community Food Projects Indicators of Success FY2010
51 Community Food Security Coalition
A p p e n d i x C : P a r t i c i p a n t I m p a c t S u r v e y R e s u l t s
Survey Audience
Audience Count Percent of respondents*
Food recipients/customers 120 30%
Participants 254 63%
Partners 67 17%
Number of respondents answering question 404 --
* Total may exceed 100% as multiple response selections were allowed. Percentages have been calculated based on the number of respondents who answered the question.
Knowledge Gains
Please indicate to what extent this program has helped you to…
A great deal
A good amount
Not too much
Not at all
Total
Learn more about community food systems 48% 42% 7% 3% 100% N=169
Learn more about health and other diet-related issues
45% 37% 16% 2% 100% N=174
Learn more about the importance of eating fruits and vegetables
46% 39% 12% 4% 100% N=168
Gain new farming and/or gardening skills 44% 36% 17% 3% 100% N=244
Learn more about sustainable agriculture, farming, and/or gardening practices
34% 39% 24% 3% 100% N=207
Learn more about the natural environment 28% 44% 26% 2% 100% N=207
Learn more about how to run a small food system business
34% 36% 23% 8% 100% N=173
Learn more about how race, class and privilege affect the food system
36% 35% 18% 11% 100% N=185
Learn more about how to build diverse community participation
41% 41% 17% 2% 100% N=145
Learn more about how to work collaboratively with others (organizations and individuals)
50% 33% 12% 5% 100% N=221
Learn more about how to implement social justice practices in food system work
30% 44% 18% 7% 100% N=125
Learn more about organizational development including leadership skills, communication skills, process skills, etc.
43% 29% 16% 12% 100% N=152

Community Food Projects Indicators of Success FY2010
52 Community Food Security Coalition
Attitude Changes
Please indicate to what extent this program has helped you to…
A great deal
A good amount
Not too much
Not at all
Total
Feel more connected to my food source 49% 42% 8% 2% 100% N=253
Increase my appreciation for leading a healthy life
47% 41% 10% 1% 100% N=227
Feel more confident in my food preparation skills
47% 31% 14% 7% 100% N=125
Feel a stronger connection to my culture 32% 43% 19% 5% 100% N=204
Increase my appreciation for farming, gardening and food production
41% 41% 15% 2% 100% N=214
Feel more confident about my farming and gardening skills
41% 41% 16% 2% 100% N=237
Feel a stronger connection to the natural environment
31% 41% 25% 2% 100% N=197
Feel a stronger connection to my local community
43% 41% 13% 2% 100% N=302
Feel more confident that I have the right skills to get a job
51% 26% 16% 6% 100% N=146
Feel more confident as a leader in my community
38% 39% 20% 3% 100% N=185
Feel more able to affect change in my community
41% 38% 19% 2% 100% N=209
Increase my commitment to social justice issues
32% 40% 22% 5% 100% N=147
Feel more committed to work on local food system issues
43% 40% 14% 3% 100% N=159

Community Food Projects Indicators of Success FY2010
53 Community Food Security Coalition
Behavior Changes
Please indicate to what extent this program has helped you to…
A great deal
A good amount
Not too much
Not at all
Total
Eat more fresh fruits and vegetables 54% 35% 6% 5% 100% N=287
Eat more food produced locally, organically, and/or with sustainable practices
41% 42% 10% 7% 100% N=217
Eat more foods that are traditional for my culture/family background
49% 28% 17% 5% 100% N=184
Provide healthy food for my family and myself 55% 36% 8% 0% 100% N=229
Be healthier 50% 39% 9% 1% 100% N=253
Use more sustainable or organic farming or gardening practices
42% 31% 25% 1% 100% N=222
Improve the way in which the food I grow is distributed
40% 35% 18% 6% 100% N=110
Diversify my farm products 40% 33% 19% 8% 100% N=96
Increase my income from farming/gardening 31% 21% 29% 19% 100% N=145
Make a living in agriculture 34% 19% 32% 15% 100% N=47
Increase my number of customers 40% 31% 19% 10% 100% N=62
Increase the size of my local market 38% 29% 23% 10% 100% N=48
Donate/give extra food to other people 45% 34% 15% 6% 100% N=244
Develop stronger leadership skills 44% 35% 17% 3% 100% N=178
Assume greater leadership roles 36% 35% 26% 2% 100% N=122
Take action that reduces the effects of race, class and privilege in my community
37% 40% 17% 6% 100% N=162
Make a greater difference in my community 39% 39% 20% 2% 100% N=227
Be a better community organizer (this could include increased communication skills, etc.)
35% 43% 19% 2% 100% N=164
Improve my overall quality of life 33% 56% 9% 2% 100% N=231

Community Food Projects Indicators of Success FY2010
54 Community Food Security Coalition
Length of Participation
How long have you been participating in this program? Percent of respondents Count
Less than 3 months 10% 30
3 months to less than 6 months 11% 33
6 months to less than 1 year 30% 93
1 year to less than 2 years 22% 67
2 years or longer 27% 84
Total 100% 307
Average length of participation (in months) 15.6 307
Overall Experience
How would you rate your overall experience participating in this program?
Percent of respondents Count
Excellent 59% 174
Good 34% 101
Fair 6% 17
Poor 0% 1
Total 100% 293
Food Security
The following are statements people have made about the food in their household. Please tell us how often this statement has been true for your
household in the past 30 days.
Always Often Sometimes Never Total
We were not able to afford enough food to eat 4% 9% 27% 60% 100% N=211
We were not able to afford enough of the kinds of food we wanted to eat
9% 18% 32% 41% 100% N=210
We were not able to afford to eat at all 3% 5% 6% 87% 100% N=197
Respondent Gender
What is your gender? Percent of respondents Count
Female 62% 187
Male 38% 116
Total 100% 303

Community Food Projects Indicators of Success FY2010
55 Community Food Security Coalition
Respondent Age
Which of the following includes your age? Percent of respondents Count
17 or younger 6% 18
18 – 24 12% 33
25 – 34 15% 43
35 – 44 20% 56
45 – 54 21% 59
55 – 64 18% 50
65 years or older 8% 24
Total 100% 283
Respondent Ethnicity
Are you Spanish, Hispanic or Latino? Percent of respondents Count
No, not Spanish, Hispanic or Latino 19% 74
Yes, I consider myself to be Spanish, Hispanic or Latino 81% 310
Total 100% 384
Respondent Race
What is your race? (Mark one or more races to indicate what race you consider yourself to be)
Percent of respondents* Count
American Indian or Alaskan Native 4% 13
Asian, Asian Indian or Pacific Islander 16% 59
Black or African American 24% 90
White 40% 149
Other 18% 65
Number of respondents answering question -- 371
*Total may exceed 100% as respondents could select more than one option. Percentages have been calculated based on the number of respondents who answered the question.
Respondent Education
What is the highest degree or level of school you have completed? (mark one box)
Percent of respondents Count
12th Grade or less, no diploma 45% 125
High school diploma 12% 32
Some college, no degree 12% 34
Associate's degree (e.g. AA, AS) 4% 11
Bachelor's degree (e.g. BA, AB, BS) 12% 33
Graduate degree or professional degree 15% 43
Total 100% 278
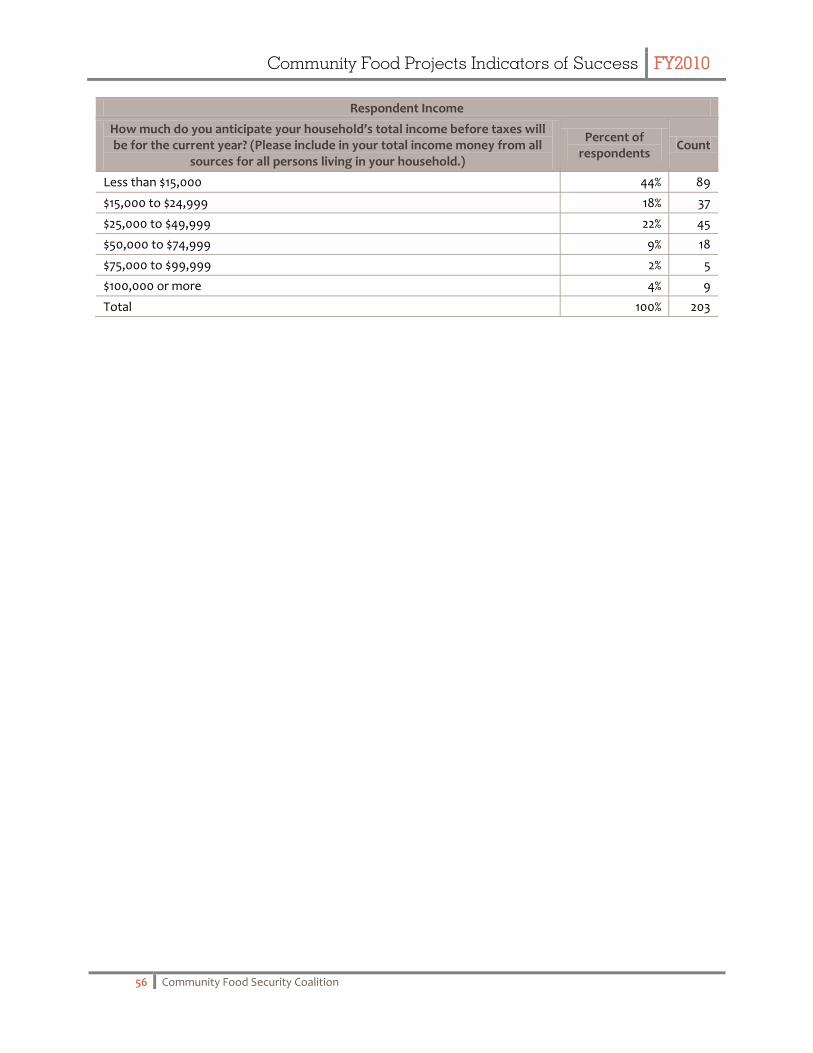
Community Food Projects Indicators of Success FY2010
56 Community Food Security Coalition
Respondent Income
How much do you anticipate your household’s total income before taxes will be for the current year? (Please include in your total income money from all
sources for all persons living in your household.)
Percent of respondents
Count
Less than $15,000 44% 89
$15,000 to $24,999 18% 37
$25,000 to $49,999 22% 45
$50,000 to $74,999 9% 18
$75,000 to $99,999 2% 5
$100,000 or more 4% 9
Total 100% 203

Community Food Projects Indicators of Success FY2010
57 Community Food Security Coalition
A p p e n d i x D : D e f i n i t i o n s
Community Food Assessment. A Community Food Assessment is a collaborative and participatory process to systematically examine a broad range of community food assets and resources, so as to inform on local issues that need attention and change actions to make the community more food secure.
Community Garden. A community garden is a garden where people share basic resources—land, water, and sunlight. Community gardens are the sites of a unique combination of activities such as food production, recreation, social and cultural exchange, and the development of open space, community spirit, skills, and competence.
Community or Incubator Kitchen/ Value-Added Production / Processing. A community kitchen is a shared use facility that enables growers and small business people to process their own agricultural or food products to add value prior to sale.
Community Supported Agriculture (CSA) Program. CSA is a mutual commitment between a nearby farmer and the people who eat the food that the farmer produces. The farm feeds the CSA members; the members support the farm and share the inherent risks and potential bounty.
Emergency Food Collection and Distribution. Collection and procurement of edible foods that are then distributed through food banks, food pantries, and congregate feeding programs. Including but not limited to, gleaning, farmer/grower donations, food drives, and institutional donations of prepared and perishable foods.
Entrepreneurial Food and Agricultural Activity. Any activity related to the marketing of food products. Examples of these could include a single farm stand (as opposed to a farmers' market) and a value-added food product cottage industry.
Farm/ Grower Cooperative. A group of farmers who are working together to market their products. This group may or may not have articles of incorporation or other agreed upon guidelines or rules.
Farm to Cafeteria Project. Included in this category are Farm to School, Farm to College and Farm to Institution projects. Farm to Cafeteria projects link local farmers with nearby schools or institutions to increase consumption of fresh, nutritious fruits and vegetables. Students and/or other community members learn about the origin of their food, while small and medium-sized farmers are able to avail themselves of a local market to supplement their income. One project may include single or multiple schools, school districts, or institutions depending on the structure of project activities.
Farmers’ Market. Organization that provides resources and a gathering place for farmers and consumers to exchange products.
Food Access and Outreach. Informational and educational activities and campaigns to inform low-income people of their potential eligibility for and benefits available from government nutrition assistance programs, including but not limited to, SNAP (food stamps), school lunch and breakfast, WIC, summer food, elderly meals, and farmers’ market nutrition programs.

Community Food Projects Indicators of Success FY2010
58 Community Food Security Coalition
Food-buying Cooperative. A group of people or organizations that purchases food together in bulk to receive discounted prices or increased access.
Food Policy Council/ Network. A Food Policy Council (FPC) is comprised of stakeholders from various segments of a state or local food system. Councils can be officially sanctioned through a government action (such as legislation or an Executive Order) or can be a grassroots effort. While this category is not limited to policy initiatives, many FPCs’ primary goal is to examine the operation of the local food system and provide ideas or recommendations for how it can be improved.
Immigrant/ Migrant Farm Project. A project that works with immigrant or migrant farm workers to support their ability to make a living in agriculture through providing additional social services or employment development support.
Job Skills Training. Training to support someone in developing the necessary skills to obtain and keep a job.
Micro-enterprise/ Entrepreneur Skill Training. Training to support someone in starting and maintaining a small-scale, food-related business venture. These projects are typically capitalized at under $35,000 with three or fewer employees initially.
Planning Grants. Many community food project activities include some degree of project planning. This activity is for proposals specified as planning grants. These activities often include some form of community assessment, business planning, and/or building collaborations and partnerships.
Promoting Local Food Purchases. An education, outreach, or public relations campaign that highlights the benefits of purchasing raw and value-added local foods and food products. This may encompass support for activities such as buy-local campaigns, community supported agriculture, farm-to-cafeteria efforts, and farmers’ markets.
Restoration of Traditional Foods/ Agriculture. Activities (other than immigrant farmer projects) that focus on supporting the use of traditional food and agriculture and rely on agricultural knowledge bases held by indigenous people.
Training and Technical Assistance. Includes services to support a wide variety of projects and initiatives, through trainings and workshops, practical publications, mentoring, and other individualized assistance.
Urban Agriculture. Promoting or growing of agricultural products within an urban environment. While many of the other project activities (community gardening, youth agricultural project, immigrant/migrant farm project) may also include growing food in urban areas, this activity is aimed specifically at utilizing urban lands for the production of agricultural crops.
Youth/ School Gardening or Agriculture Project. Includes all youth activities related to community food systems, other than farm to school projects. These activities could include composting and vermiculture.