1
A Abstract While the North Atlantic Oscillation (NAO) has fluctuated between positive and negative wintertime values in recent years, the mean NAO index of the past decade is negative, punctuated by an extreme NAO- winter in 2010. This contrasts sharply with the persistent NAO+ forcing of the 1980s and early 1990s, which has been linked to an anomalously warm subpolar gyre (SPG) in the mid to late 1990s as a result of a strengthened overturning circulation 1,2 . We present evidence of a sharp reduction in North Atlantic Deep Water (NADW) formation since the mid-1990s, associated with the more neutral-to-negative NAO conditions of recent years, and of an associated slow-down of the buoyancy-driven circulation at high latitudes. Coupled decadal prediction ensembles using the Community Earth System Model (CESM) exhibit considerable decadal prediction skill in the high latitude North Atlantic; the skill derives from the persistence and equatorward propagation of NADW thickness anomalies. In particular, the recently observed cooling of the SPG and associated growth of North Atlantic sea ice extent was the predictable consequence of sharply reduced NADW formation rates. We predict the SPG cooling trend to taper off in the coming decade, due to a return to more climatological rates of NADW formation in the subpolar seas. Community Earth System Model (CESM) projections of AMOC in the coming decade: mechanisms and impacts Stephen Yeager, Haiyan Teng, Gokhan Danabasoglu, Alicia Karspeck National Center for Atmospheric Research, Boulder, CO 1. Yeager, S., A. Karspeck, G. Danabasoglu, J. Tribbia, and H. Teng , 2012: A decadal prediction case study: late twentieth century North Atlantic Ocean heat content. J. Climate, 25, 5173-5189, doi:10.1175/JCLI-D-11-00595.1. 2. Robson, J., R. Sutton, K. Lohmann, D. Smith, and M. D. Palmer, 2012: Causes of the rapid warming of the North Atlantic Ocean in the mid-1990s. J. Climate, 25, 4116-4134, doi:10.1175/JCLI-D-11-00443.1. 3. Griffies, S.M., Winton, M., Samuels, B., Danabasoglu, G., Yeager, S., Marsland, S., Drange, H., Bentsen, M., 2012. Datasets and protocol for the CLIVAR WGOMD Coordinated Ocean sea-ice Reference Experiments (COREs). WCRP, Report No. 21/2012. 4. Hurrell, J. W., J. J. Hack, D. Shea, J. M. Caron, and J. Rosinski, 2008: A new sea surface temperature and sea ice boundary dataset for the Community Atmosphere Model, J. Climate, 21, 5145-5153. 5. Comiso, J. C., 2000 (updated 2014): Bootstrap Sea Ice Concentrations from Nimbus-7 SMMR and DMSP SSM/I-SSMIS. Version 2. Boulder, Colorado, USA: NASA DAAC at the National Snow and Ice Data Center. 6. Large, W., and S. Yeager, 2009: The global climatology of an interannually varying air-sea flux data set. Clim. Dyn., 33, 341-364, doi:10.1007/s00382-008-0441-3. 7. Antonov J. I., D. Seidov, T. P. Boyer, R. A. Locarnini, A. V. Mishonov, H. E. Garcia, O. K. Baranova, M. M. Zweng, and D. R. Johnson, 2010: World Ocean Atlas 2009, Volume 2: Salinity. S. Levitus, Ed. NOAA Atlas NESDIS 69, U. S. Government Printing Office, Washington, D. C., 184 pp. 8. Large, W. G. and G. Nurser, 2001: Chapter 5.1 ocean surface water mass transformation. Ocean Circulation and Climate – Observing and Modelling the Global Ocean, Academic Press, International Geophysics, Vol. 77, 317–336, doi: 10.1016/S0074-6142(01)80126-1. 9. Yeager, S., and G. Danabasoglu, 2014: The origins of late-twentieth-century variations in the large-scale North Atlantic circulation. J. Climate, 27, 3222-3247, doi:10.1175/JCLI-D-13-00125.1. Evidence of reduced formation of NADW in recent decades Predicting Atlantic Circulation Changes Historical atmospheric state fields (CORE-II data 3 ) spanning 1948-2013 are paired with monthly observed sea surface temperature (SST 4 ) and daily observed sea ice fraction 5 to generate an historical air-sea flux data set 6 . Using monthly climatological sea surface salinity (SSS 7 ), estimates of historical high latitude North Atlantic surface density flux (D as ) are computed from net air-sea heat (Q as ) and freshwater (F as ) fluxes as follows 8 : Acknowledgements: This work is made possible by: the NOAA Climate Program Office under Climate Variability and Predictability Program grants NAO9OAR4310163 and NA13OAR4310138, the National Science Foundation (NSF) Collaborative Research EaSM2 grant OCE-1243015, the Regional and Global Climate Modeling Program (RGCM) of the U.S. Department of Energy's Office of Biological & Environmental Research (BER) Cooperative Agreement # DE-FC02-97ER6240, and the NSF through its sponsorship of the National Center for Atmospheric Research. ! F1: Regions used in the water mass formation analysis (black), overlayed on ocean bathymetry (km). White boxes are regions used for upper 1041m density analysis. D as = α Q as C p βF as SSS 1 SSS α = 1 ρ ρ T p,S β = 1 ρ ρ S p,T Monthly water mass transformation (WMT) rates (Sv) are computed as spatial integrals of D as over isopycnal outcrop areas in each of four North Atlantic regions (F1). Corresponding water mass formation (WMF) rates are given by the density convergence of WMT: WMT(ρ) = 1 Δρ D as outcrop dA Δρ = 0.1 kg m 3 WMF(ρ) = (WMT) ρ " F2: Climatological (1958-2007) annual WMF rates by density bin for each N. Atlantic region, and for the sum over all regions. Red lines show the interannual standard deviation, and the numbers (in Sv) give the net climatological formation of NADW (sum of black bars). ! F3: Annual anomaly time series from 1948 to 2013 of net positive WMF (black curve, left axis) binned over the density range corresponding to NADW (σ >27.6 kg/m 3 ) for various N. Atlantic regions. The observed winter (DJFM) NAO index is also shown (red curve, right axis). In the adiabatic limit, the surface WMF over the high latitude North Atlantic suggests a mean subduction rate of NADW of ~19 Sv (F2). Interannual variations in formation of NADW correlate highly with the winter NAO index (F3). The extreme NAO- of 1996 ushered in a 15-year period of normal-to-weak NADW formation, in sharp contrast to the 1980-1995 period. The extreme NAO- of 2010 was associated with very weak NADW production, but it has since recovered to normal levels. Temporal variations in the surface formation of NADW explain most of the large decadal AMOC changes in a COREII-forced ocean-ice simulation of the 1948-2013 period 9 . The large increase in AMOC strength between 1970-1995 and decrease since 1995 (F4, panel a) is in line with “observed” WMF variability (F3). Now consider a suite of CMIP5 fully-coupled decadal prediction (DP) experiments (10 member ensembles) initialized from the COREII ocean-ice state every January between 1955-2014. There is little skill in predicting the WMF which sets Labrador Sea density anomalies (F5, left). However, there is high skill at predicting the southward propagation of pre-formed water mass anomalies into the Grand Banks Shelf region (F5, right). F4: Annual AMOC strength (defined as 500-1500m average) anomaly as a function of latitude and year from (a) COREII ocean-ice state estimation, and CESM DP ensembles averaged over (b) lags 1-3, (c) lags 3-5. ! F5: Annual anomaly of upper 1041m density (σ 0 in kg m -3 ) averaged over a Labrador Sea box (left) and a Grand Banks shelf region (right) from the COREII ocean-ice simulation (3-yr running average) and DP ensembles (averaged over lags indicated). Regions are shown in F1. High skill in predicting the propagation of pre-formed water mass anomalies results in moderate skill in predicting decadal AMOC anomalies at lower latitudes (F4; F6, right), and excellent skill at predicting barotropic streamfunction (BSF) variations in the vicinity of Grand Banks (F6, left). F7: Annual anomaly of (top left) SST averaged over the SPG region (see F1) and (bottom left) sea ice area averaged over the entire North Atlantic sector (70 o W-30 o E, 40-80 o N). Five-year trends for these fields are shown in the right panels. Impacts on North Atlantic surface temperature and sea ice extent The current suite of CESM DP experiments includes many more start years than previously analyzed 1 , and confirms that there is high skill in predicting SPG SST anomalies not just through persistence, but as a result of skillful prediction of multi-year trends driven by ocean circulation change (F7, top panels). The pronounced cooling of SPG SST’s which has been observed in recent years, associated with the post-1995 reduction in NADW formation and subsequent spin-down of AMOC & gyre flow, is predicted to end in coming years (F7, top right). The more neutral SST trends are associated with the return of “normal” formation rates of NADW in recent years. There are indications that anomalies and near-term trends of North Atlantic sea ice extent are predictable well in advance. F6: Annual BSF anomaly in the Grand Banks shelf region (left; see F1) and AMOC anomaly averaged over 20 o -40 o N from the COREII ocean-ice simulation (3-yr running average) and DP ensembles (averaged over lags indicated). Summary Historical changes in the rate of NADW formation explain the large, buoyancy-driven decadal variations in AMOC and gyre circulation in the COREII ocean-ice state estimation used to initialize fully-coupled CESM decadal prediction ensembles. The recently observed SPG cooling resulted from much reduced NADW formation compared to pre-1995 levels, and a concomitant weakening of the large-scale Atlantic circulation. DP ensembles can skillfully predict the dynamical consequences of pre-formed NADW anomalies, but not the actual formation processes. The return of normal NADW formation rates suggests that SPG cooling trends will weaken.

Community Earth System Model (CESM) Predicting Atlantic ... · region (see F1) and (bottom left) sea ice area averaged over the entire North Atlantic sector (70 oW-30E, 40-80oN)

  • Upload
    vuliem

  • View
    213

  • Download
    0

Embed Size (px)

Citation preview

A

Abstract While the North Atlantic Oscillation (NAO) has fluctuated between positive and negative wintertime values in recent years, the mean NAO index of the past decade is negative, punctuated by an extreme NAO- winter in 2010. This contrasts sharply with the persistent NAO+ forcing of the 1980s and early 1990s, which has been linked to an anomalously warm subpolar gyre (SPG) in the mid to late 1990s as a result of a strengthened overturning circulation1,2. We present evidence of a sharp reduction in North Atlantic Deep Water (NADW) formation since the mid-1990s, associated with the more neutral-to-negative NAO conditions of recent years, and of an associated slow-down of the buoyancy-driven circulation at high latitudes. Coupled decadal prediction ensembles using the Community Earth System Model (CESM) exhibit considerable decadal prediction skill in the high latitude North Atlantic; the skill derives from the persistence and equatorward propagation of NADW thickness anomalies. In particular, the recently observed cooling of the SPG and associated growth of North Atlantic sea ice extent was the predictable consequence of sharply reduced NADW formation rates. We predict the SPG cooling trend to taper off in the coming decade, due to a return to more climatological rates of NADW formation in the subpolar seas.

Community Earth System Model (CESM) projections of AMOC in the coming decade: mechanisms and impacts

Stephen Yeager, Haiyan Teng, Gokhan Danabasoglu, Alicia Karspeck

National Center for Atmospheric Research, Boulder, CO

1.  Yeager, S., A. Karspeck, G. Danabasoglu, J. Tribbia, and H. Teng , 2012: A decadal prediction case study: late twentieth century North Atlantic Ocean heat content. J. Climate, 25, 5173-5189, doi:10.1175/JCLI-D-11-00595.1. 2.  Robson, J., R. Sutton, K. Lohmann, D. Smith, and M. D. Palmer, 2012: Causes of the rapid warming of the North Atlantic Ocean in the mid-1990s. J. Climate, 25, 4116-4134, doi:10.1175/JCLI-D-11-00443.1. 3.  Griffies, S.M., Winton, M., Samuels, B., Danabasoglu, G., Yeager, S., Marsland, S., Drange, H., Bentsen, M., 2012. Datasets and protocol for the CLIVAR WGOMD Coordinated Ocean sea-ice Reference Experiments (COREs). WCRP,

Report No. 21/2012. 4.  Hurrell, J. W., J. J. Hack, D. Shea, J. M. Caron, and J. Rosinski, 2008: A new sea surface temperature and sea ice boundary dataset for the Community Atmosphere Model, J. Climate, 21, 5145-5153. 5.  Comiso, J. C., 2000 (updated 2014): Bootstrap Sea Ice Concentrations from Nimbus-7 SMMR and DMSP SSM/I-SSMIS. Version 2. Boulder, Colorado, USA: NASA DAAC at the National Snow and Ice Data Center. 6.  Large, W., and S. Yeager, 2009: The global climatology of an interannually varying air-sea flux data set. Clim. Dyn., 33, 341-364, doi:10.1007/s00382-008-0441-3. 7.  Antonov J. I., D. Seidov, T. P. Boyer, R. A. Locarnini, A. V. Mishonov, H. E. Garcia, O. K. Baranova, M. M. Zweng, and D. R. Johnson, 2010: World Ocean Atlas 2009, Volume 2: Salinity. S. Levitus, Ed. NOAA Atlas NESDIS 69, U. S.

Government Printing Office, Washington, D. C., 184 pp. 8.  Large, W. G. and G. Nurser, 2001: Chapter 5.1 ocean surface water mass transformation. Ocean Circulation and Climate – Observing and Modelling the Global Ocean, Academic Press, International Geophysics, Vol. 77, 317–336, doi:

10.1016/S0074-6142(01)80126-1. 9.  Yeager, S., and G. Danabasoglu, 2014: The origins of late-twentieth-century variations in the large-scale North Atlantic circulation. J. Climate, 27, 3222-3247, doi:10.1175/JCLI-D-13-00125.1.

Evidence of reduced formation of NADW in recent decades

Predicting Atlantic Circulation Changes

•  Historical atmospheric state fields (CORE-II data3) spanning 1948-2013 are paired with monthly observed sea surface temperature (SST4) and daily observed sea ice fraction5 to generate an historical air-sea flux data set6.

•  Using monthly climatological sea surface salinity (SSS7), estimates of historical high latitude North Atlantic surface density flux (Das) are computed from net air-sea heat (Qas) and freshwater (Fas) fluxes as follows8 :

Acknowledgements: This work is made possible by: the NOAA Climate Program Office under Climate Variability and Predictability Program grants NAO9OAR4310163 and NA13OAR4310138, the National Science Foundation (NSF) Collaborative Research EaSM2 grant OCE-1243015, the Regional and Global Climate Modeling Program (RGCM) of the U.S. Department of Energy's Office of Biological & Environmental Research (BER) Cooperative Agreement # DE-FC02-97ER6240, and the NSF through its sponsorship of the National Center for Atmospheric Research.

! F1: Regions used in the water mass formation analysis (black), overlayed on ocean bathymetry (km). White boxes are regions used for upper 1041m density analysis.

Das = −α Qas

Cp

− βFasSSS1− SSS

α = − 1ρ∂ρ∂T p,S

β = 1ρ∂ρ∂S p,T

•  Monthly water mass transformation (WMT) rates (Sv) are computed as spatial integrals of Das over isopycnal outcrop areas in each of four North Atlantic regions (F1). Corresponding water mass formation (WMF) rates are given by the density convergence of WMT:

WMT(ρ) = 1Δρ

Dasoutcrop∫ dA Δρ = 0.1 kg

m3 WMF(ρ) = − ∂(WMT)∂ρ

" F2: Climatological (1958-2007) annual WMF rates by density bin for each N. Atlantic region, and for the sum over all regions. Red lines show the interannual standard deviation, and the numbers (in Sv) give the net climatological formation of NADW (sum of black bars).

! F3: Annual anomaly time series from 1948 to 2013 of net positive WMF (black curve, left axis) binned over the density range corresponding to NADW (σ >27.6 kg/m3) for various N. Atlantic regions. The observed winter (DJFM) NAO index is also shown (red curve, right axis).

•  In the adiabatic limit, the surface WMF over the high latitude North Atlantic suggests a mean subduction rate of NADW of ~19 Sv (F2).

•  Interannual variations in formation of NADW correlate highly with the winter NAO index (F3). The extreme NAO- of 1996 ushered in a 15-year period of normal-to-weak NADW formation, in sharp contrast to the 1980-1995 period. The extreme NAO- of 2010 was associated with very weak NADW production, but it has since recovered to normal levels.

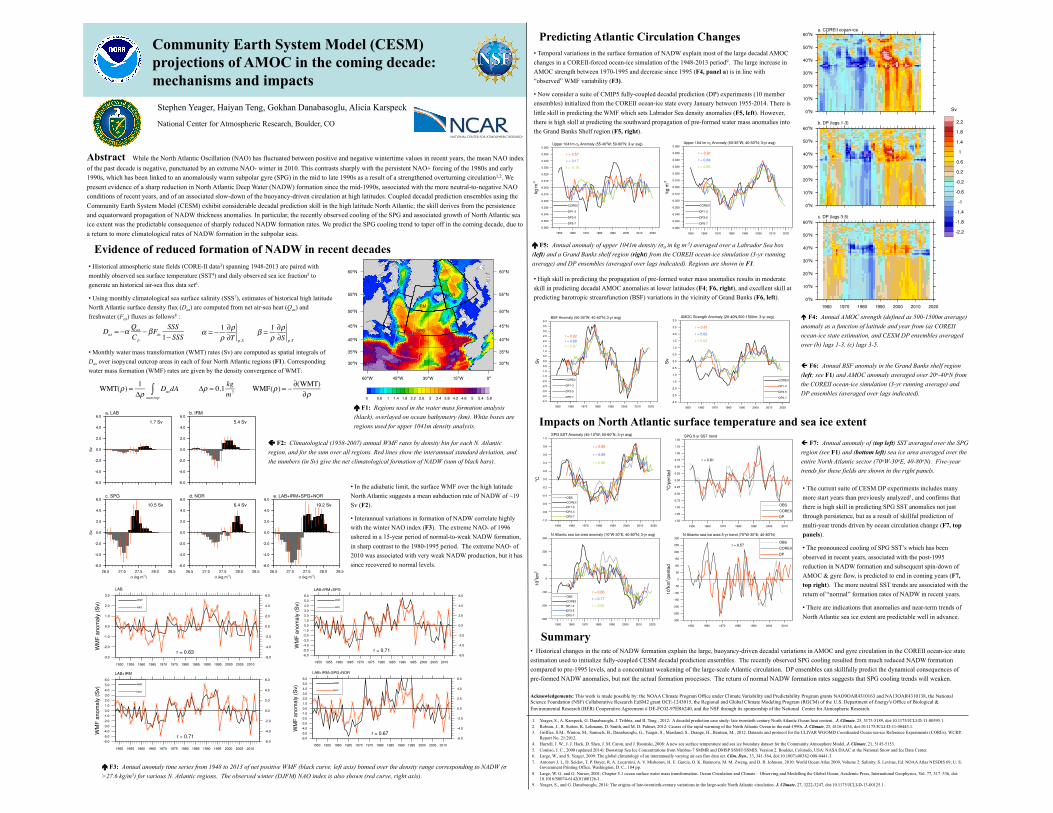
•  Temporal variations in the surface formation of NADW explain most of the large decadal AMOC changes in a COREII-forced ocean-ice simulation of the 1948-2013 period9. The large increase in AMOC strength between 1970-1995 and decrease since 1995 (F4, panel a) is in line with “observed” WMF variability (F3).

•  Now consider a suite of CMIP5 fully-coupled decadal prediction (DP) experiments (10 member ensembles) initialized from the COREII ocean-ice state every January between 1955-2014. There is little skill in predicting the WMF which sets Labrador Sea density anomalies (F5, left). However, there is high skill at predicting the southward propagation of pre-formed water mass anomalies into the Grand Banks Shelf region (F5, right).

é F4: Annual AMOC strength (defined as 500-1500m average) anomaly as a function of latitude and year from (a) COREII ocean-ice state estimation, and CESM DP ensembles averaged over (b) lags 1-3, (c) lags 3-5.

! F5: Annual anomaly of upper 1041m density (σ0 in kg m-3) averaged over a Labrador Sea box (left) and a Grand Banks shelf region (right) from the COREII ocean-ice simulation (3-yr running average) and DP ensembles (averaged over lags indicated). Regions are shown in F1.

•  High skill in predicting the propagation of pre-formed water mass anomalies results in moderate skill in predicting decadal AMOC anomalies at lower latitudes (F4; F6, right), and excellent skill at predicting barotropic streamfunction (BSF) variations in the vicinity of Grand Banks (F6, left).

ç F7: Annual anomaly of (top left) SST averaged over the SPG region (see F1) and (bottom left) sea ice area averaged over the entire North Atlantic sector (70oW-30oE, 40-80oN). Five-year trends for these fields are shown in the right panels.

Impacts on North Atlantic surface temperature and sea ice extent

•  The current suite of CESM DP experiments includes many more start years than previously analyzed1, and confirms that there is high skill in predicting SPG SST anomalies not just through persistence, but as a result of skillful prediction of multi-year trends driven by ocean circulation change (F7, top panels).

•  The pronounced cooling of SPG SST’s which has been observed in recent years, associated with the post-1995 reduction in NADW formation and subsequent spin-down of AMOC & gyre flow, is predicted to end in coming years (F7, top right). The more neutral SST trends are associated with the return of “normal” formation rates of NADW in recent years.

•  There are indications that anomalies and near-term trends of North Atlantic sea ice extent are predictable well in advance.

ç F6: Annual BSF anomaly in the Grand Banks shelf region (left; see F1) and AMOC anomaly averaged over 20o-40oN from the COREII ocean-ice simulation (3-yr running average) and DP ensembles (averaged over lags indicated).

Summary •  Historical changes in the rate of NADW formation explain the large, buoyancy-driven decadal variations in AMOC and gyre circulation in the COREII ocean-ice state estimation used to initialize fully-coupled CESM decadal prediction ensembles. The recently observed SPG cooling resulted from much reduced NADW formation compared to pre-1995 levels, and a concomitant weakening of the large-scale Atlantic circulation. DP ensembles can skillfully predict the dynamical consequences of pre-formed NADW anomalies, but not the actual formation processes. The return of normal NADW formation rates suggests that SPG cooling trends will weaken.