Embed Size (px)
Citation preview
Community Detection and Characteristics Analysis of Academic Network
Qi Zeng, Yao Xiao, Shanshan Xu, Zhefei Yu(Dated: December 9, 2014)
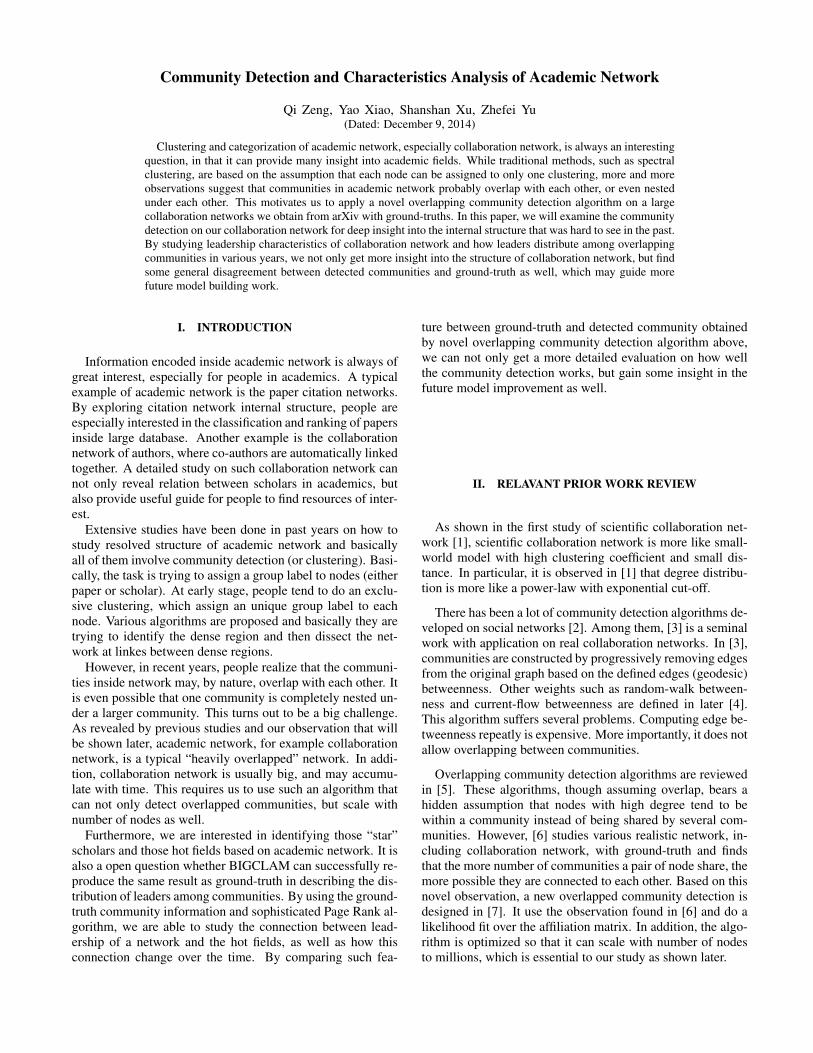
Clustering and categorization of academic network, especially collaboration network, is always an interestingquestion, in that it can provide many insight into academic fields. While traditional methods, such as spectralclustering, are based on the assumption that each node can be assigned to only one clustering, more and moreobservations suggest that communities in academic network probably overlap with each other, or even nestedunder each other. This motivates us to apply a novel overlapping community detection algorithm on a largecollaboration networks we obtain from arXiv with ground-truths. In this paper, we will examine the communitydetection on our collaboration network for deep insight into the internal structure that was hard to see in the past.By studying leadership characteristics of collaboration network and how leaders distribute among overlappingcommunities in various years, we not only get more insight into the structure of collaboration network, but findsome general disagreement between detected communities and ground-truth as well, which may guide morefuture model building work.
I. INTRODUCTION
Information encoded inside academic network is always ofgreat interest, especially for people in academics. A typicalexample of academic network is the paper citation networks.By exploring citation network internal structure, people areespecially interested in the classification and ranking of papersinside large database. Another example is the collaborationnetwork of authors, where co-authors are automatically linkedtogether. A detailed study on such collaboration network cannot only reveal relation between scholars in academics, butalso provide useful guide for people to find resources of inter-est.
Extensive studies have been done in past years on how tostudy resolved structure of academic network and basicallyall of them involve community detection (or clustering). Basi-cally, the task is trying to assign a group label to nodes (eitherpaper or scholar). At early stage, people tend to do an exclu-sive clustering, which assign an unique group label to eachnode. Various algorithms are proposed and basically they aretrying to identify the dense region and then dissect the net-work at linkes between dense regions.
However, in recent years, people realize that the communi-ties inside network may, by nature, overlap with each other. Itis even possible that one community is completely nested un-der a larger community. This turns out to be a big challenge.As revealed by previous studies and our observation that willbe shown later, academic network, for example collaborationnetwork, is a typical “heavily overlapped” network. In addi-tion, collaboration network is usually big, and may accumu-late with time. This requires us to use such an algorithm thatcan not only detect overlapped communities, but scale withnumber of nodes as well.
Furthermore, we are interested in identifying those “star”scholars and those hot fields based on academic network. It isalso a open question whether BIGCLAM can successfully re-produce the same result as ground-truth in describing the dis-tribution of leaders among communities. By using the ground-truth community information and sophisticated Page Rank al-gorithm, we are able to study the connection between lead-ership of a network and the hot fields, as well as how thisconnection change over the time. By comparing such fea-
ture between ground-truth and detected community obtainedby novel overlapping community detection algorithm above,we can not only get a more detailed evaluation on how wellthe community detection works, but gain some insight in thefuture model improvement as well.
II. RELAVANT PRIOR WORK REVIEW
As shown in the first study of scientific collaboration net-work [1], scientific collaboration network is more like small-world model with high clustering coefficient and small dis-tance. In particular, it is observed in [1] that degree distribu-tion is more like a power-law with exponential cut-off.
There has been a lot of community detection algorithms de-veloped on social networks [2]. Among them, [3] is a seminalwork with application on real collaboration networks. In [3],communities are constructed by progressively removing edgesfrom the original graph based on the defined edges (geodesic)betweenness. Other weights such as random-walk between-ness and current-flow betweenness are defined in later [4].This algorithm suffers several problems. Computing edge be-tweenness repeatly is expensive. More importantly, it does notallow overlapping between communities.
Overlapping community detection algorithms are reviewedin [5]. These algorithms, though assuming overlap, bears ahidden assumption that nodes with high degree tend to bewithin a community instead of being shared by several com-munities. However, [6] studies various realistic network, in-cluding collaboration network, with ground-truth and findsthat the more number of communities a pair of node share, themore possible they are connected to each other. Based on thisnovel observation, a new overlapped community detection isdesigned in [7]. It use the observation found in [6] and do alikelihood fit over the affiliation matrix. In addition, the algo-rithm is optimized so that it can scale with number of nodesto millions, which is essential to our study as shown later.
2
III. MODELS AND ALGORITHMS
The main algorithm we used for the overlapping commu-nity detection is BIGCLAM (Cluster Affiliation Model forBig Networks) developed in [7].
This algorithm assumes the existence of a latent interactionof non-negative strength X(c)
uv between nodes u, v that are inthe same community c. Then the total amount of interactionXuv between nodes u, v is the summation of X(c)
uv from allcommunities. Further, for each community c,X(c)
uv is assumedto be an independent Poisson distribution with mean FucFvc,where Fuc is the measure of the connection strength betweenthe node u and the community c. As a result, Xuv is also aPoisson distribution with mean
∑c FucFvc ≡ Fu · FT
v .Now for the observed network, there is an edge between a
pair of nodes u and v if Xuv > 0. Therefore, for the observednetwork, edge creation between node u and v has probability
p(u, v) = p(Xuv > 0) = 1− P (Xuv = 0) = 1− eFu·FTv .(1)
The overlapping community detection problem has twosteps:• Given the observed network G, we learn the parameter F
by maximizing the log-likelihood:
F = arg maxF≥0
l(F ) , (2)
where the log-likelihood l(F ) is
l(F ) = logP (G|F ) =∑
(u,v)∈E
log(1−eFu·FTv )−
∑(u,v) 6∈E
Fu·FTv .
(3)The optimization problem of (2) can be solved by a block
coordinate gradient ascent algorithm, where Fu is updated foreach u with other Fv fixed. The subproblem
arg maxFuc≥0
∑v∈N (u)
log(1− eFu·FTv )−
∑v 6∈N (u)
Fu · FTv
(4)
is a convex optimization problem and can be solved by pro-jected gradient ascent method.
To make comparison, with the performance of the BIG-CLAM, we also used the CPM (clique percolation ) as thebaseline• After we learn F , each node u is classified into the com-
munity c if Fuc is larger than some threshold δ.To evaluate the performance of BIGCLAM, we also run
CPM (Clique Percolation Method) [8], another algorithm foroverlapping community detection, as the baseline. In this al-gorithm, a (k-clique-)community is defined as a a union of allk-cliques (complete subgraphs of size k) that can be reachedfrom each other through a series of adjacent k-cliques (whereadjacency means sharing k-1 nodes). The algorithm has threesteps:• Find maximal cliques (cliques that can’t be extended) by
BronKerbosch algorithm.
• Create clique overlap matrix. Each row (and column) rep-resents a clique and the matrix elements are equal to the num-ber of common nodes between the corresponding two cliques.• Threshold the matrix at value k−1. Communities are the
connected components of the thresholded matrix.We expect that BIGCLAM has better performance than
CPM since CPM fails to detect dense overlaps.
IV. DATA COLLECTION
Our data is taken from arXiv, through arXiv Bulk Data Ac-cess. Each item in data is metadata of each paper, includingpaper ID, author names, categories(an internal label in arXivrepresenting various disciplines), dates, and abstract. Thesemetadata are downloaded through Open Archives Initiative(OAI). Then, since we are mostly interested in collaborationnetwork between authors, we build an edge between two au-thors if they ever co-author a paper.
On the ground-truth side, for each author, we count howmany papers he has under each category. Then for each cate-gory, we get a weight by dividing such count by total numberof papers he ever has:
wi =Nfield−i
Ntotal(5)
Note that papers might have several category tag so the sum ofthis weight over all categories is not necessarily unity. Thenwe define a truth-level threshold “truth-threshold”, that the au-thor belongs to this category if its weight in this category islarger than “truth-threshold”. If the threshold is low (like 0),the categories an author belongs to might be too many sinceeven some occasional submission in a non-related field for funwill also count. But we also do not want to set the thresholdtoo tight, otherwise there will be too little overlap. Eventuallywe set the threshold to be 0.1
We obtain in total three massive samples in addition to asmall sample. The three massive samples are respectivelytaken from “condensed matter physics”, “astrophysics” and“computer science” three large categories. They are chosensince arXiv support further detailed categories under the par-ent discipline so that our ground-truth is meaningful. All dataare taken between 2007-01-01 and 2014-01-01. Note that,though each dataset is taken under a parent discipline (like“condensed matter physics”), the categories are not limitedwithin sub-field of condensed matter physics due to the na-ture of inter-discipline of some papers. As a matter of fact,there are in total 161 different categories for all data taken un-der “condensed matter physics”, varying from tags in physics,math to tags in computer science.
In all study below, we only use “condensed matter physics”sample since it is more easy to interpret the result based on ourbackground. However, readers may take our other samplesin “astrophysics” and “computer science” for further study.There is an additional small sample, which is taken from “con-densed matter physics” between 2013-05-01 and 2013-06-01.This sample is small (with only thousands of nodes) so it isonly used for testing and debugging.

3
A visualization by Gephi on small sample can be found inFigure 1
FIG. 1: Visualization by Gephi. The Clustering in Visualization isdone by Gephi.
V. RESULTS AND FINDINGS
We organize our results and findings in the following way.An overview of general features of our data will be examined.After checking whether our data is consistent with the under-lying assumption made by BIGCLAM algorithm, we begin toapply BIGCLAM algorithm, as well as baseline Clique Perco-lation Method on our data. Then, we will first evaluate perfor-mance of these two methods by using conventional metrics,such as average F1 score etc.
After the algorithm and its performance is established, webegin to study the leadership property in our network. Af-ter we define properly the “leader” of a network, we willstudy how they distribute by using ground truth information,as well as how it evolves since 2007 to 2014 year by year.Later, a similar study, but using detected community, will beshown and tested if they are consistent with our observationfrom ground-truth. As we will show, such comparison even-tually reveal some general disagreement between models be-hind BIGCLAM algorithm and ground-truth.
A. Network Overview
The sample we use for this part is a combination of all “con-densed matter physics” network from 2007-01-01 to 2014-01-01. This collaboration network has 140685 nodes and 744750edges. There are 2173 nodes with 0 degrees, which are thrownaway since they are completely isolated points. We then uselargest connected component instead of the whole network
as our network. For largest connected component, there are125827 nodes and 724881 edges.
Figure 2 shows the degree distribution of our network. Itcan be fit using the power-law. This plot has a nice power-law, but only after some point around 7. By that point, theslope is even positive. The tail of distribution is more like apower-law, instead of an exponential cut-off as observed in [1]
FIG. 2: Degree Distribution
Figure 3 shows the hub and authority score distribution forthe network.(figure HubHist.png). Hub and authority scoresare usually used for evaluating webpages. For our case, weuse this score to evaluate the position of the author in the col-laboration network. This will make more sense if we add ad-ditional author information like their profiles. However, onlybased on the property of the network, we can see that the twoscores are similar to each other.
FIG. 3: Hub (left) and Authority (right) Score
Figure 4 (left) shows the distribution of clustering coeffi-cient of the network. The distribution is rather flat, which is asurprising for us.
Figure 4 (right) shows the distribution of number of cat-egories of each author. The familiar power-law distributionsuggests that a lot of authors are only in a few categories andonly a few of them have published papers in lots of categories.
One should be aware that, for 161 categories we observeunder “condensed matter physics”, only 9 of them are reallythe sub-field of “condensed matter physics” with all other cat-egories being “by-product”. Part of statistics of categories can

4
FIG. 4: Clustering Coefficient Distribution and Shared MembershipDistribution
be found in Table I. From this table we can see that most itemsconcentrate on a few categories.
category counts“cond-mat.mtrl-sci” 53790“cond-mat.mes-hall” 38489
“cond-mat.str-el” 32224“cond-mat.stat-mech” 27665“cond-mat.supr-con” 26123
“cond-mat.other” 18719“cond-mat.soft” 18369
“cond-mat” 14622“quant-ph” 13231
“cond-mat.dis-nn” 12929“cond-mat.quant-gas” 7163
“hep-th” 5258... ...
“astro-ph” 851... ...
“cs.DS” 146... ...
TABLE I: Number of authors in each Categories
Next, we test one of the most important features – edgeprobability as function of number of shared communities be-tween any pair of the network. This plot will demonstratewhether our data is consistent with the underlying assumptionbehind BIGCLAM algorithm. In this plot, we ask what is theprobability there is an edge between any two nodes given acertain number of common communities they share.
The plots can be found in Figure 5. We overlay curves withthree different truth threshold value. All plots are consistentwith underlying assumption that the more membership a pairof nodes share, the more possible they will connect with eachother.
Another important feature is how edge probability changewith truth threshold: as “truth-threshold” increases, the curvewill rise faster. Intuitively, as “truth-threshold” goes up, eachauthor will only keep those categories that they mainly workin. As a result, if two authors have more overlap in their maincontribution area, the probability of they co-author will in-crease.
Number of Shared Communities0 2 4 6 8 10
Edg
e P
roba
bilit
y
5−10
4−10
3−10
2−10
1−10
1
10Truth Threshold of 0.0
Truth Threshold of 0.5
Truth Threshold of 0.1
FIG. 5: Edge Probability for Various Truth Threshold
B. Experiment on Collected Data
Having checked edge probability distribution, we can nowapply BIGCLAM algorithm on our sample. The implementa-tion is already done in SNAP. The sample we run is full sam-ple combining from 2007 to 2014, as well as sample of eachyear respectively. In general, the BIGCLAM is very fast (atmost 2.5 minutes for largest sample containing all years data),if the number of communities is given. However, if we letSNAP implementation to automatically determine number ofcommunities, it will take forever to run. Therefore, we even-tually decide to set the number of communities as in ground-truth as input.
At the same time, we run baseline algorithm, CPM, forcomparison. Though CPM is much slower than BIGCLAM,it can still process year-by-year data in reasonable time. TheCPM is not applied on combined data since it will take toomuch time. The CPM implementation in SNAP has one pa-rameter “k”. We scan the value “k” from 2 to 20 and choosethe one with number of communities closest to ground-truthvalue. A comparison of performance will be shown in nextpart.
To see if using number of ground-truth community is a rea-sonable choice, we run BIGCLAM on a rather small sam-ple (some random month data), in which BIGCLAM can au-tomatically configure optimal number of communities. Thecurve of optimization of K can be found in Figure 6 and theoptimal value is K = 130, which is more than ground-truthvalue 84 for this sample
C. Conventional Performance Evaluation Metrics
Three conventional performance evaluation metrics areadopted here:

5
-65000
-60000
-55000
-50000
-45000
-40000
-35000
-30000
-25000
-20000
-15000
0 50 100 150 200 250 300
likel
ihoo
d
communities
hold-out likelihood
FIG. 6: Likelihood as function of number of communities
• Average F1 Score evaluation, which is defined as
1
2
(1
|C?|∑
Ci∈C?
F1(Ci, Cg(i)) +1
|C|
∑Ci∈C
F1(Cg′(i), Ci)
)(6)
where C? is truth partition and C is detected par-tition. g(i) = argmaxjF1(Ci, Cj) and g′(i) =
argmaxjF1(Cj , Ci).
• Omega Index, which is used to test accuracy on esti-mating number of communities that each pair of nodesshares:
1
|V |2∑
u,v∈V1|Cuv| = |Cuv| (7)
• Normalized Mutual Information (NMI), which uses in-formation theory to compare detected communities andground-truth information. For two partitions Ω and C,NMI is defined as
NMI =I(Ω;C)
[H(Ω +H(C)]/2(8)
where H is entropy defined as
H(Ω) = −∑k
|ωk|N
log|ωk|N
(9)
and I is mutual information defined as
I(Ω;C) =∑k
∑j
|ωk ∩ cj |N
logN |ωk ∩ cj ||ωk||cj |
(10)
Table II is the tabular showing score of each metric for datafrom 2007 to 2014 year by year, as well as the comparisonwith result out of CMP (in bracket). For all tested data, re-sult from BIGCLAM is much better than CPM in average F1score and NMI metrics. In Omega Index, two algorithm givesimilar score. These show that BIGCLAM can better detectcommunity in collaboration network than CPM.
year average F1 score Omega Index NMI2007 0.05598 (0.01008) 0.64960 (0.65006) 0.24323 (0.05494)2008 0.11338 (0.02299) 0.63526 (0.63429) 0.41711 (0.16523)2009 0.04920 0.63967 0.248062010 0.08555 (0.02380) 0.61531 (0.61428) 0.30048 (0.13015)2011 0.07803 (0.03517) 0.61518 (0.61476) 0.28038 (0.11235)2012 0.09387 (0.04927) 0.59354 (0.59253) 0.29931 (0.09679)2013 0.07003 (0.01980) 0.60078 (0.59975) 0.26491 (0.08859)
2007-2014 0.04474 0.61689 0.22933
TABLE II: Score of Metrics
D. Leadership in Collaboration Network
After community detection, the next thing we want to ex-plore is how leadership distribute inside collaboration net-work, as well as how it is connected with overlapping com-munities, which will be studied in this and next part. Fromacademic point of view, the leadership in a collaboration net-work can indicate people who are active as well as sub-fieldsthat are active.
We define the leadership through Page Rank of each node.Figure 7 show the Page Rank of each node in descendant or-der. Notice that Y-axis is in log scale. This plot shows onlya few people have a very high page rank value, while mostpeople are on the “plateau”. Therefore, a practical way to de-fine “leader” would be those nodes with page rank between[MaxPageRank/2,MaxPageRank]. It turns out the num-ber of leaders defined in this way is always around 50 so thatthey are tractable. Also, the exact order of Page Rank amongleaders should not be taken too seriously, since, as shown inthe Page Rank plot, what really matters is the log-scale value.
order index0 10000 20000 30000 40000 50000 60000 70000
page
ran
k
6−10
5−10
4−10
3−10
FIG. 7: Page Rank Distribution for some arbitrary year
A distribution of Page Rank from 2007 to 2014 year byyear is shown in 8. We find that shape of Page Rank curveis roughly the same over years, though the normalization isdifferent, which strongly depends on the total size of nodes.Generally, the more number of nodes, the lower average PageRank it has. It also turns out the total number of authors innetwork is random, except a special year 2009-2010, whennetwork size is significantly larger than other years.

6
Node Ordered Index0 10000 20000 30000 40000 50000 60000
Pag
e R
ank
5−10
4−10
3−10 2007~2008
2008~2009
2009~2010
2010~2011
2011~2012
2012~2013
2013~2014
FIG. 8: Page Rank Distribution from 2007 to 2014 Year by Year
E. Leadership Distribution among Communities and How ItChanges over Time
As suggested in Table I, the number of nodes per category ishighly polarized in ground-truth. Figure 9 shows the numberof nodes for each community in descendant order (X-axis iscommunity order index, Y-axis is number of nodes).
Notice that the Y-axis is in log-scale, suggesting the num-ber of papers in each cluster is highly polarized – peopletend to aggregate in the hot fields, which are usually de-fined as the fields with most people involved. Also fromTable I, we know that the top 9 categories are actually thereal sub-field of “condensed matter physics”, while other sub-fields that intersect with condensed matter physics locate atthe tail. In general, the non-condensed-matter fields that in-tersect mostly with condensed matter physics is high energytheoretical physics (“hep-th”), which is not surprising becausethese two fields sometimes are actually studying the samething. Astrophysics also have a lot of intersection (actuallyit can rank top 20 among 100!) with condensed matterphysics, which is a bit surprising to me. Another field thathas a lot of intersection with condensed matter physics is the“cs.DS”(Computer Science – Data Structure and Algorithm)– considering many physicists who make contribution to net-work study actually come from condensed matter physics (forexampe, Mark Newman), this is not that surprising.
In the ground-truth plot, we see that as year grows, thenumber of size in each community is growing as well, whichshows more people are contributing to each fields.
Now we focus on the same plot but using detected com-munities by BIGCLAM (right plot). The trend as functionof time is successfully reproduced by BIGCLAM algorithm.However, the shape is very different from ground-truth – de-tected communities are much less polarized than ground-truth.This implies that BIGCLAM tends to make each communitiesequally large, which is not true in the ground-truth.
The discussion above is on all nodes in network. Nowwe only focus on the leaders as defined before. Figure 10shows the ordered number of leaders in each community fromground-truth. All curves show a very common feature, that
FIG. 9: Ordered Number of Nodes per Community for Ground-truth(left) and Detected Community (right) over years
is there exists four categories which contains most of lead-ers. Apart from these four categories, other categories canonly get very few leaders. This is again, very surprising sincewe know there are actually in total 9 real sub-fields in con-densed matter physics. Furthermore, by looking at ground-truth, these four categories are actually the same in each yearfrom 2007 to 2014: “cond-mat.str-el” (Strongly CorrelatedElectrons), “cond-mat.mes-hall” (Mesoscale and NanoscalePhysics), “cond-mat.mtrl-sci” (Materials Science) and “cond-mat.supr-con” (Superconductivity). This is consistent withour knowledge in condensed matter physics that these are in-deed the four hottest fields.
Community Index
0 5 10 15 20
Num
ber
of L
eade
rs
0
10
20
30
40
502007~2008
2008~2009
2009~2010
2010~2011
2011~2012
2012~2013
2013~2014
FIG. 10: Ordered Number of Leaders per Community in Ground-truth over Years
However, such sharp feature observed in ground-truth isnot reproduced in detected communities, as shown in figure11. Unlike ground-truth, leaders are more evenly spread outamong all communities: most communities can get at leastone leader (in ground-truth, only 20 communities can); Al-though the distribution is still polarized, the drop is not asrapid as ground-truth. Therefore, BIGCLAM algorithm notonly tends to “spread out” all members of network amongcommunities, but “spread out” the leaders as well.
Another way to see how leaders distribute among commu-nities is counting number of communities each leader belongsto. Figure 12 shows the ordered number of communities eachleader belongs to.
The curves for various years are random and no obviouspattern is observed. Notice that the shape strongly depends on

7
Community Index
0 20 40 60 80 100
Num
ber
of L
eade
rs
024
68
101214
16182022
2007~2008
2008~2009
2009~2010
2010~2011
2011~2012
2012~2013
2013~2014
FIG. 11: Ordered Number of Leaders per Community in DetectedCommunities over Years
Leader Index
0 10 20 30 40 50 60 70 80
Num
ber
of C
omm
uniti
es
1
2
3
4
5
6
7
8
9
102007~2008
2008~2009
2009~2010
2010~2011
2011~2012
2012~2013
2013~2014
FIG. 12: Ordered Number of Communities per Leader in Ground-truth over Years
number of leaders – after re-scaling X-axis, curves among allyears are more or less the same. It turns out there is also a lotof polarization among leaders – only very few leaders belongto more than 5 categories, while most leaders only contributeto one or two fields. More specifically, taking 2007-2008 yearrange as example, 15% leaders have at least 5 categories (halfof maximum), while 61.25% leaders only have at most 3 cat-egories (one third of maximum). This gives us such a picturethat there are one or two leaders in the network who have vastconnection with many people in other fields, while those peo-ple (some of them are leaders as well) only focus on their ownfields.
In the detected communities by BIGCLAM, as shown inFigure 13, such polarization is also reproduced to some ex-tend. Since the leaders are defined by Page Rank, which isindependent of community detection, we are able to do di-rect comparison year by year. It turns out leaders are dis-tributed among communities in a much less spread out waythan ground-truth. Taking 2007-2008 year as example again,there are 17.5% leaders with at least 9 communities (half ofmaximal value), and 75% leaders with at most 5 communities
(one third of maximal value).
Leader Index
0 10 20 30 40 50 60 70 80
Num
ber
of C
omm
uniti
es
024
68
101214
16182022
2007~2008
2008~2009
2009~2010
2010~2011
2011~2012
2012~2013
2013~2014
FIG. 13: Ordered Number of Communities per Leader in DetectedCommunities over Years
So far we have seen how leaders distribute in communi-ties and there is a general disagreement between ground-truthand BIGCLAM algorithm, that ground-truth is more polar-ized than BIGCLAM. This could come from the assumptionbehind BIGCLAM: those nodes with high degree tends to beat the overlapping region among all communities. Followingthis assumption, leaders at the boundary between communi-ties will all tend to have a high number of associated com-munities. Similarly, if there is a lot of overlapping betweencommunities, most communities will tend to have many lead-ers.
But ground-truth tells us a slightly different story: Assump-tion behind BIGCLAM is still correct, but not every nodewith high degree is the same. Only a few high-degree nodeis shared by huge amount of communities, while most otherhigh-degree nodes are only shared by 2 or 3 communities.Such observation might be helpful in future improvement ofBIGCLAM algorithm.
The last thing about our collaboration network is how theleaders change over year by year. Apparently, from 2007 to2014, the leadership list will change year by year. In particu-lar, we are interested in two things: 1) People who are alwaysin the leadership from 2007 to 2014; 2) Categories that arealways owned by leaders.
For the first question, the answer strongly depends on yearrange specified by users. For example from 2007 to 2014,there are four authors who are always in the leadership: H.Eisaki, S. Das Sarma, F.M. Peeters and P.C. Canfield. Frombackground knowledge in condensed matter physics, this re-sult makes sense to us. For example, Professor S. Das Sarmais one of the top scholar in theoretical condensed matterphysics. Furthermore, by observing the name, there are alsomany very famous physicists (for example, Professor Shou-cheng Zhang of Stanford) appearing at some year but disap-pearing in next year. Therefore, it might be of more interest tostudy the variation on a year-by-year base.
For the second question, there are in total 8 categoriesowned by leaders from 2007 to 2014. These 8 categories span

8
all different sub-fields of condensed matter physics, whichmakes sense to us. Similarly, in each year, there will be manynon-condense-matter-physics field in this list but usually theywill disappear in the next year. A study on such variation on ayear-by-year base might be more interesting
VI. CONCLUSION
In this paper, we collect and build collaboration networkin condensed matter physics in arXiv from 2007 to 2014.Then we apply BIGCLAM community detection algorithmon our data on a year-by-year base. Then, by studying howleadership distributes between communities, we not only gainmore insight into structure of collaboration network, but ob-serve some general disagreement between ground-truth anddetected community, which reveals some shortcome of BIG-CLAM algorithm:
• The underlying assumption of BIGCLAM, that the
more number of communities a pair of node shares, themore possible they will connect with each other, is stillsound in our data
• This assumption implies that high-degree node tends tobe at the overlapping region between communities
• However, not all high-degree node is as important aseach other. Observation from ground-truth suggeststhese high-degree nodes could also be highly polarized.Only very few of them is at the boundary of huge num-ber of communities, while most of leaders have only 2or 3 communities
• The picture is: very few leaders are connecting over allmain communities, while other leaders are only con-necting a few closeby communities.
• No obvious pattern is observed in terms of how leadersdistribute between communities change over years.
[1] M. E. J. Newman, The structure of scientific collaboration net-works, PNAS, vol. 98 no. 2 404-409, 2001.
[2] S. Fortunato, Community detection in graphs, Physics Reports486 (3), 75-174, 2010.
[3] M. Girvan and M.E.J. Newman. Community structure in socialand biological networks. Proc. Natl. Acad. Sci. 99, 8271-8276,2002.
[4] M. E. J. Newman, and M. Girvan, Finding and evaluating com-munity structure in networks, Phys. Rev. E 69, 026113, 2004.
[5] Xie, Jierui, Stephen Kelley, and Boleslaw K. Szymanski. ”Over-lapping community detection in networks: The state-of-the-artand comparative study.” ACM Computing Surveys (CSUR) 45.4
(2013): 43.[6] Yang, Jaewon, and Jure Leskovec. ”Structure and overlaps
of communities in networks.” arXiv preprint arXiv:1205.6228(2012).
[7] Yang, Jaewon, and Jure Leskovec. ”Overlapping community de-tection at scale: a nonnegative matrix factorization approach.”Proceedings of the sixth ACM international conference on Websearch and data mining. ACM, 2013.
[8] Palla, Gergely, et al. ”Uncovering the overlapping communitystructure of complex networks in nature and society.” Nature435.7043 (2005): 814-818.