Embed Size (px)
Citation preview

Quantifying Community Characteristics of Maternal MortalityUsing Social Media
Rediet Abebe∗[email protected]
Harvard University
Salvatore Giorgi∗[email protected]
University of Pennsylvania
Anna [email protected] University
Anneke [email protected] of Pennsylvania
H. Andrew [email protected] Brook University
ABSTRACTWhile most mortality rates have decreased in the US, maternal mor-tality has increased and is among the highest of any OECD nation.Extensive public health research is ongoing to better understand thecharacteristics of communities with relatively high or low rates. Inthis work, we explore the role that social media language can playin providing insights into such community characteristics. Analyz-ing pregnancy-related tweets generated in US counties, we reveala diverse set of latent topics including Morning Sickness, CelebrityPregnancies, and Abortion Rights. We find that rates of mention-ing these topics on Twitter predicts maternal mortality rates withhigher accuracy than standard socioeconomic and risk variablessuch as income, race, and access to health-care, holding even afterreducing the analysis to six topics chosen for their interpretabilityand connections to known risk factors. We then investigate psy-chological dimensions of community language, finding the use ofless trustful, more stressed, and more negative affective language issignificantly associated with higher mortality rates, while trust andnegative affect also explain a significant portion of racial disparitiesin maternal mortality. We discuss the potential for these insightsto inform actionable health interventions at the community-level.
KEYWORDSmaternal mortality, health disparities, language, topic modeling,community characteristics
ACM Reference Format:Rediet Abebe, Salvatore Giorgi, Anna Tedijanto, Anneke Buffone, and H.Andrew Schwartz. 2020. Quantifying Community Characteristics of Mater-nal Mortality Using Social Media. In Proceedings of The Web Conference 2020(WWW ’20), April 20–24, 2020, Taipei, Taiwan. ACM, New York, NY, USA,12 pages. https://doi.org/10.1145/3366423.3380066
1 INTRODUCTIONThe United States has one of the highest maternal mortality ratesof any country in the Organization for Economic Cooperation and
∗Both authors contributed equally to this research.
This paper is published under the Creative Commons Attribution 4.0 International(CC-BY 4.0) license. Authors reserve their rights to disseminate the work on theirpersonal and corporate Web sites with the appropriate attribution.WWW ’20, April 20–24, 2020, Taipei, Taiwan© 2020 IW3C2 (International World Wide Web Conference Committee), publishedunder Creative Commons CC-BY 4.0 License.ACM ISBN 978-1-4503-7023-3/20/04.https://doi.org/10.1145/3366423.3380066
Development group [11, 23]. Approximately 700 individuals diefrom pregnancy-related causes [3, 15, 68] and an estimated 60% ofthese deaths are suspected to be preventable [68]. While the inter-national trend has seen a reduction in maternal mortality, despiteincreased budgets, rates in the US have more than doubled in thepast 25 years [3].1 Black and Latina mothers bear a disproportionatebrunt of this burden: Black women are three to four times morelikely to die during childbirth, even after controlling for numeroussocioeconomic and risk factors [68]. These rates vary by geography:e.g., in New York City, Black women are 12 times more likely to dieduring childbirth than white women [64, 73].2
Public health research has examined potential causes for mater-nal mortality and disparities, pointing to issues such as access toinsurance, bias in health-care, segregated hospitals, and inadequatepost-delivery care [8, 27, 49, 50, 54]. While it is understood thateach of community, health facility and system, patient, and providerall play a part, there is an overall pervasive concern that the specificcauses and mechanisms for maternal mortality and disparities arenot adequately understood [68]. The WHO cites a “general lack ofgood data – and related analysis – on maternal health outcomes"as a bottleneck for gaining insights into this issue [3].
In this work, we seek to partially address this gap, focusingon community-level factors that characterize maternal mortalityas revealed through social media language. We examine whethercommunity variables derived from social media language data canpredict community maternal mortality rates and its racial disparity.While emotions and language analyzed using social media dataare shown to have high-efficacy in tasks ranging from predictingallergies or life satisfaction to depression or heart disease mortal-ity [26, 30, 33, 66, 76], the potential of social media has yet to beexamined in this manner to help shed understanding on maternalmortality at the community level.
Our contributions in this work are in three-folds:
• We show that there is a diverse set of pregnancy-relatedtopics ranging from Morning Sickness, to Abortion Rights, toMaternal Studies. We demonstrate that these topics predictmaternal mortality rates with higher accuracy than standardsocioeconomic (SES), risk factors, and race.
1Note, on the other hand, US infant mortality is at a historic low [13].2This issue has garnered increases attention in part due to concentrated efforts
by policy-makers, advocacy groups, and celebrities, in addition to long-standing workby community organizations [35, 36, 40, 59, 81]. e.g., see collaborations between theAtlanta-based Black Mamas Matter Alliance and the Black Maternal Health Caucus.
arX
iv:2
004.
0630
3v1
[cs
.CL
] 1
4 A
pr 2
020

WWW ’20, April 20–24, 2020, Taipei, Taiwan Abebe and Giorgi, et al.
• We show that a select set of six topics, chosen for their inter-pretability and relations to known maternal health factors,hold as much predictive power as all pregnancy-related top-ics. Specifically, four of these topics – Maternal Studies, TeenPregnancy, Abortion Rights, and Congratulatory Remarks –have negative associations with mortality rates.
• We examine variables associated with racial disparities inmaternal mortality (i.e. the difference between rates for Blackwomen and other races), finding that language-based scoresfor trust and affect hold explanatory power for the county-level relationship between race and maternal mortality, evenafter controlling for standard SES and risk-factors.
2 BACKGROUND AND RELATEDWORKMaternalMortalityBackground. Public health research has soughtbetter measurements of maternal mortality rates and their causesand consequences [3, 23, 68]. There is a long line of work exploringwhat community, patient, hospital, provider, or systemic-level fac-tors may contribute to high rates of mortality and disparities in theUS [34, 48, 56, 57]. At the patient-level, cardiovascular conditions,which are related to stress, cause about one third of all pregnancy-related deaths [68]. At the community and systemic-level, studieshave shown that delivery site, segregation, and discrimination inmaternity care during visits all play a role [8, 27, 49, 50]. At thesystemic-level, sociological and economic research have shownracial disparities in mortality and life-expectancy [18, 55]. In linewith such studies, there are numerous calls to use a data-drivenapproach to better grasp the role and causes of maternal mortalityrelated to each of the above main categories [68].
Social Media Data for Health. Twitter data and more gener-ally social media data has been a popular source for exploringcommunity-level health measurements [67]. Examples include ex-cessive alcohol consumption [26], depression [29, 62], heart dis-ease, [33], and more generally population health and well-being[25, 38, 76]. In addition to measuring community-level insights,these data sources have been used to study health information seek-ing and sharing [31] and individual-level predictions [30]. In recentyears, there has also been interest in understanding the societal andethical implications and limitations around the use of social mediadata for health studies and roles for computing as a diagnostic ofsocial problems [1, 4, 16, 17, 20].
Maternal Health. An emerging topic of interest has been the useof language-driven analysis to understand pregnancy and maternalexperiences. For instance, De Choudhury et al. [28] studied Twitterposts to understand changes in emotions formothers; Antoniak et al.[5] looked at narrative paths in individuals sharing childbirth storieson an online forum. Focusing on support, Costa Figueiredo et al.[22], Gui et al. [42], Vydiswaran et al. [80] looked at how online peersupport and information exchange for pregnant individuals, theircaregivers, and individuals experiencing fertility issues. Abebe et al.[2] looked at information seeking for pregnancy and breastfeedingrelated to HIV. To our knowledge, ours is the first work to employa language-driven study to understand maternal mortality in theUS.
3 DATAWe used three sets of data sets for this study, described below:
3.1 Twitter Data and Seed-WordsTo generate our pregnancy data set, we started with a random10% sample of the entire Twitter stream collected between 2009and 2015 [70]. We then used this data set to build two subsets: (1)pregnancy-related tweets and (2) tweets geo-located to US counties.Pregnancy-Related Tweets. The first data set consisted of tweetsrelated to pregnancy and birth. Tweets were pulled from the maindata set if they contained the following seed-words: pregnancy,pregnant, infant, fetus, miscarriage, prenatal, trimester, complications,pregnant, birth, childbirth, pregnancies, baby, children, pregnancy,mother, newborn, child, as well as their plural form, hashtags suchas #pregnancy, and capitalizations such as Pregnancy. These seed-wordswere selected by examining nearest neighbors fromword2vecfor words related to ‘pregnancy’ and ‘pregnant.’
We then manually examined a random sample of 1,000 tweetsfrom the data set to test for relevance to pregnancy. Tweets thatwere deemed off-topic, such as those containing phrases like “mis-carriage of justice" were used to generate phrases for further datacleaning. We also randomly sampled tweets for specific seed-wordsand if a substantial (i.e., more than 20%) of the tweets were un-related to pregnancy, all tweets were removed from the data set,reducing the seed-set. After these cleaning steps, we kept 74.40% ofthe data set, and validated in fresh sample of 1,000 tweets that over95% of them are related to pregnancy.U.S. County Tweets. The second data set consisted of tweets geo-located to U.S. counties. For this we used the County Tweet LexicalBank [39]. This data set was geo-located using self-reported locationinformation (from the user description field) and latitude / longitudecoordinates [76]. The data were then filtered to contain only Englishtweets [58]. We then limited our data set to Twitter users with atleast 30 posts and U.S. counties with at least 100 such users. Thefinal Twitter data set consisted of 2,041 U.S. counties.
3.2 Mortality RatesThe World Health Organization (WHO) defines maternal mortal-ity as “the death of a woman while pregnant or within 42 daysof termination of pregnancy, irrespective of the duration and siteof the pregnancy, from any cause related to or aggravated by thepregnancy or its management but not from accidental or incidentalcauses" with the Centers for Disease Control and Prevention (CDC)expanding this time period to 1 year [24, 82]. Data for maternal mor-tality was collected from the CDC WONDER online database [14].We collected rates from 2009-2017, so as to match the time-spanof our Twitter sample in addition to more recent years (2016 and2017) since these rates are on the rise [68]. Mortality rates are listedunder the following International Classification of Diseases, TenthRevision (ICD-10) categories: O00-O07 (pregnancy with abortiveoutcome) and O10-O99 (other complications of pregnancy, child-birth and the puerperium). The CDC suppresses data if a countyexperiences less than 10 deaths in a given time period for privacyreasons. Of the 2,041 counties in our Twitter set only 197 also hadmortality rates (i.e., counties experiencing 10 or more deaths).

Quantifying Community Characteristics of Maternal Mortality Using Social Media WWW ’20, April 20–24, 2020, Taipei, Taiwan
Since the CDC does not report age-adjusted rates for countieswith low mortality numbers, we took the crude rate as reported andcreated our own age-adjusted rate. To do this, we built a model usingmedian age of females (American Community Survey, 2014; 5-yearestimates) and predicted maternal mortality, taking the residuals asour new “age-adjusted maternal mortality rate.” This age-adjustedvalue is used throughout the paper.
3.3 Socioeconomic Measures and Risk FactorsIn addition to mortality, we collected additional county-level vari-ables on socioeconomics, risk factors, and race. Socioeconomics in-cluded unemployment rate, median income, and education (percent-age of people with Bachelor’s degrees and High School graduatepercentage). For risk factors, we included insurance rates and ac-cess to health-care (the ratio of population to number primary careproviders). Finally, we also explored the relationship between lan-guage and maternal mortality with respect to percentage of Blackindividuals in each county. As discussed previously, the disparity inmortality rates for Black women is large and providing evidence to-ward the factors at play for such a disparity is a key application forour analyses. Additionally, to account for overall rates of birth, allanalysis included a birth rate covariate (the rate per 1,000 women,aged 15-50, with births in the past 12 months).
The birth rate, race, SES variables, and insurance rates werecollected from the 2014 American Community Survey (5 year esti-mates), whereas the primary care providers was collected from the2017 County Health Rankings (as reported by the Area Health Re-source File/American Medical Association, 2014). We were able toobtain these values for each of the counties which met the Twitterand mortality inclusion criteria above.
Overall, we obtained data for 197 U.S. counties and county equiv-alents that met each of the data requirements above and conductedour study on these counties. The full list of these counties is in-cluded in the project page.5
4 TOPICS AND THEORETICAL LINGUISTICFEATURES
We used three sets of features that will characterize maternal mor-tality through language. First, we created a set of automatically-derived topics built over the pregnancy-related tweets. These topicsreveal a diversity of themes in discussions around pregnancy onthe platform. Next, we used a small set of theoretically-driven lan-guage features – (affect, depression, stress, and trust) – in order toaccess psychological traits of a community and their relations tomaternal mortality. Finally, we use a large, general set of topics(non-pregnancy related) to identify broader language patterns.
4.1 Pregnancy-Related TopicsWe start with our data set of over 5 million pregnancy-relatedtweets described in Section 3. We automatically extracted topicsusing Latent Dirichlet Allocation (LDA) [12]. LDA is a generativestatistical model which assumes that each document (in our casetweet) contains a distribution of topics, which in turn, are a distri-bution of words. We use the Mallet software package [60], whichestimates the latent variable of the topics using Gibbs sampling [37].All default Mallet settings were used, except α , which is a prior on
the expected topics per document. We set α = 2 since tweets areshorter than the typical length of documents. The number of topicsis a free parameter and we chose 50 topics.3
Topic Label Top Weighted WordsTeenPregnancy(1.34%)
teen, rate, rates, teenage, highest, mortality, low,states, teens, higher, number, 20, country, amer-ican, united, education, lowest, population
MorningSickness(0.54%)
morning, sickness, purpose, symptoms, lives,wanted, williamson, tv, experience, cure, bra,marianne, thinking, signs, oral, teenagers, simon
CelebrityPregnancies(1.42%)
kim, kardashian, kayne, amber, rose, beyonce,years, west, harry, finish, swear, north, who’s,kayne’s, taylor, sets, louis, wiz
AbortionRights (2.15%)
women, abortion, care, health, abortions, bill,mortality, #prolife, rights, law, gift, support, cir-cumstances, crisis, irrelevant, #prochoice, forced
MaternalStudies(2.56%)
risk, defects, study, health, weight, linked, flu,cancer, early, diet, drinking, smoking, blood, safe,alcohol, diabetes, autism, acid, disease, drug
CongratulatoryRemarks(3.06%)
congrats, congratulations, :), boy, happy, love,daughter, son, <3, wait, sister, late, healthy,cousin, xx, amazing, :d, meet, proud
Table 1: Sample pregnancy topics with representative words
We find that our data reveals a rich set of themes related topregnancy and birth. In Table 5, we show a sample of six topics,which are hand-selected to demonstrate the breadth of topics inthe data set.5 The first column provides the topic label, which werehand-generated by the authors, and the frequency with which thetopic occurs in the data set.4 The last column corresponds to thetop 10 most representative words for the topic.
These above topics show that pregnancy-related discussionson Twitter can range from personal-health disclosure such as inMorning Sickness, to political conversations related to AbortionRights, and light topics such as Congratulatory Remarks. Topics thatwere not included in manuscript due to length constraints includeRoyal Baby, Food Cravings, and Pregnancy Timeline. Each of thesetopics shows varying levels of popularity across the counties.
4.2 Theoretical FeaturesWe also explore a set of theoretically-driven language features:affect, depression, trust, and stress. We downloaded pre-existingmodels to derive county-level language features including:
• affect – positive and negative emotional valence trainedover Facebook posts [71].
• depression – degree of depressive personality (a facet ofthe big five personality test) fit over social media users’ lan-guage [75].
3Before running the rest of our analysis, we ran LDA using 10, 20, 50, 100, and200 topics. We selected 50 topics based on manual inspection of coherence and inter-pretability of the topics.
4Note, since there are 50 topics, the average value is 2%. Furthermore, sincesome themes, such as celebrity pregnancy, occur in more than one topic, the overallfrequency of this theme in the data set is higher than the corresponding value in thistable.

WWW ’20, April 20–24, 2020, Taipei, Taiwan Abebe and Giorgi, et al.
• trust – degree of trustfulness (how much one tends to trustpersons or entities that they do not personally know) fit oversocial media users’ language [83].
• stress – amount of stress fit over social media users’ lan-guage and Cohen’s Stress scale [19, 43].
4.3 General TopicsFinally, we use a larger set of LDA topics built over a more generaldata set. By doing this in tandem with the pregnancy-related topics,we can zoom in on pregnancy-related themes while also exploring alarger set of language correlates, which might help in characterizingcommunities suffering from higher or lower rates of mortality. Tothis end, we downloaded a set of 2,000 topic posteriors that wereautomatically-derived over the MyPersonality data set [77]. Thesetopics have been used over a large class of problems and have beenfound to be robust both in terms of interpretability and predictivepower [33, 51, 65, 69], so they form a point of comparison for ourdomain-specific topics.
5 METHODSTo understand the relationship between community level languageand maternal mortality, we perform three types of statistical analy-ses: (1) prediction — can language be used to predict mortality ratesin a cross-sectional cross validation setup? (2) differential languageanalysis – can we gain insights into communities which suffer fromhigher or lower maternal mortality through language? and (3) me-diating language analysis — can language be used to understandthe mechanisms through which Black communities experience in-creased rates of maternal mortality? All data processing, featureextraction and statistical analysis are performed using the opensource Python package DLATK [78].
5.1 PredictionWe use two types of predictive models, depending on the type ofindependent variables. All non-language variables (i.e., SES andrisk factors) are modeled with an ordinary least squares (OLS)regression, whereas language features use an ℓ2 regularized (Ridge)regression [47]. In addition to regularization, we also use a featureselection pipeline in all language based models, since the numberof features can be larger than the number of observations (N=197counties). The pipeline first removes all low variance features andthen features that were not correlated with our outcome. Finally,we applied Principal Component Analysis (PCA) to further reducethe number of features. All models are evaluated in a 10-fold crossvalidation setup, with the Ridge regularization parameter α tunedon the training set within each fold. Predictive accuracy is measuredin terms of a single Pearson correlation between the actual valuesand the predicted values, whereas standard errors are calculatedacross all 10 folds.
5.2 Differential Language AnalysisDifferential Language Analysis (DLA) is used to identify languagecharacterizing maternal mortality [52, 77]. Here we individuallyregress each of our language variables (i.e., pregnancy related top-ics and theoretical features) using an OLS regression, adding inaccess to health-care, birth rates, socioeconomics and risk factors
as covariates. We adjust for multiple comparisons by applying aBenjamini—Hochberg false discovery rate correction to the signifi-cance threshold (p < .05) [10]. For LDA topics we visualize topicssignificant correlations as word clouds. The word clouds displaythe top 15 most prevalent words within a topic sized according totheir posterior likelihood.
5.3 Mediating Language AnalysisWe explore the relationship betweenmaternal mortality and the per-centage of Black individuals within a county, as expressed throughthe county’s language. Language based mediation analysis has beenused in the past to explore the relationship between socioeconomicsand excessive drinking [26]. For this analysis, we residualize thecrude maternal mortality rate, as reported by the CDC, on medianage of female, birth rates, all socioeconomic variables (income, edu-cation and unemployment), insurance rates and rates of primarycare providers.
For each language variable, both the pregnancy related LDAtopics and theoretical language features, we consider the mediat-ing relationship between the topic (mediator), percentage Black(independent variable) and residualized maternal mortality rates(dependent variable). We follow the standard three-step, Baron andKenny approach [9]. Step 1: we regress our independent (x) anddependent variables (y; path c) in a standard OLS regression. Step 2:we regress the independent variable (x) and mediator (m; path α ).Finally, in Step 3 we create a multi-variate model and regress boththe mediator (m; topic) and independent variable (x ; percentageBlack) with maternal mortality (y; path c ′). The three models areas follows:
y = cx + β1 + ϵ1, (1)m = αx + β2 + ϵ2, (2)
y = c ′x + +βm + β3 + ϵ3. (3)The mediation effect size (c − c ′) is taken as the reduction in theeffect size between the direct relationship (i.e., percentage Blackand maternal mortality) and the mediated relationship. To test forsignificance, we use a Sobel p [79] and correct all p values for falsediscoveries via a Benjamini—Hochberg procedure.
6 RESULTSWe begin by looking at correlations between maternal mortalityand various socioeconomics and risk factors. Table 2 shows the setof correlation coefficients. These results state that the percentageof the population that is Black and unemployment rate were posi-tively correlated with maternal mortality rate and insurance access,income, and education were negatively correlated with maternalmortality rate. Additionally, birth rates were not significantly cor-related with maternal mortality. Note that, in this paper, we onlyconsider 197 counties in the US due to constraints around Twitterand county-mapped data as discussed in Section 3. While the corre-lation values do not exactly match correlations for all US counties,the general direction of relationship between maternal mortalityrates and these SES and risk-factors was the same, with those thestrongest associations – such as percent Black – also matching.
We next look at the predictive accuracy of our 50 topics, the2000 general topics, and the above SES and risk-factors as well aspercent Black values. For this, note that we used linear regression

Quantifying Community Characteristics of Maternal Mortality Using Social Media WWW ’20, April 20–24, 2020, Taipei, Taiwan
CorrelationBirth RatesRate per 1,000 women .10 [-.04,.24]
RaceBlack (percent) .49 [.36,.61]***
Risk FactorsPrimary Care Providers -.23 [-.38,-.09]**Uninsured (percent) .27 [.12,.41]***
SocioeconomicsIncome (log median) -.42 [-.55,-.29]***High School or more (percent) -.14 [-.28,.01]Bachelor’s Degree (percent) -.38 [-.52,-.23]***Unemployment (percent) .26 [.12,.39]***
Table 2: Correlations with risk factors, socioeconomics, andrace. All non-birth rate correlations controlled for birthrates. Reported standardized β with 95% confidence intervalsin square brackets; ***p < 0.001, **p < 0.01, *p < .05, afterBenjamini—Hochberg correction
.00 .20 .40 .60 .80Pearson r
Risk Factors
Socio-economics
Race
SES + Risk Factors + Race
6 Pregnancy Topics
50 Pregnancy Topics
2000 General Topics
Figure 1: Prediction accuracy for non-language variables(red), pregnancy related LDA topics (purple) and general setof LDA topics (blue). Reported Pearson r from 10-fold crossvalidation, errors bars are 95% CI.
with maternal mortality values as the outcome variable and theaforementioned language variables as the explanatory variables.Figure 1 shows that the 2000 general Facebook topics had the high-est predictive power with a Pearson r = .72 [.65, .79]*** while riskfactors (PCP access and insurance rate) were the lowest with a Pear-son r = .21 [.05, .38]**. Overall SES factors, risk factors, and race,had significantly less predictive accuracy (using a paired t-test) thanthe 50 pregnancy-related topics from the Twitter data (t = −4.63,p < .001) and the 2000 general topics (t = −4.74, p < .001).
For the Differential Language Analysis (DLA), we selected the6 topics of interest. We ran a multi-linear regression, treating thematernal mortality rate as an outcome variable and the prevalenceof these topics in the counties as the explanatory variable withbirth rates, race, risk factors and socioeconomics as covariates. Wefound that five of the 6 topics, shown in Figure 2 had significantassociations with maternal mortality rates. Maternal studies had
the most negative association – i.e., counties where there are rela-tively more tweets related to this topic had lower rates of mortality.Note that each of the four topics in the figure – Maternal Studies,Teen Pregnancies, Congratulatory Remarks, and Abortion Rights – allshow negative associations with maternal mortality rates. CelebrityPregnancies, not shown, is positively associated (.20 [.07, .33]∗) withhigher mortality.
-.38 [-.49,-.25]*** -.35 [-.47,-.22]***
-.28 [-.40,-.14]*** -.19 [-.32,-.05]*
Figure 2: Differential Language Analysis using 6 pregnancyrelated LDA topics, controlled for race, risk factors and so-cioeconomics. Reported standardized β with 95% confidenceintervals in square brackets;***p < 0.001, **p < 0.01, *p < .05,after Benjamini—Hochberg correction.
We also used 4 theoretical features within the DLA framework:affect, depression, stress and trust. Results are presented in Table 3.We see higher rates of maternal mortality associated with higherdistrust, higher stress, higher depression, and with less affect.
CorrelationAffect -.30 [-.43,-.17]***Depression .23 [.10,.36]**Stress .24 [.10,.37]**Trust -.38 [-.49,-.25]***
Table 3: Differential Language Analysis of theoretically rele-vant features. Reported standardized β with 95% confidenceintervals in square brackets;***p < 0.001, **p < 0.01, *p < .05,after Benjamini—Hochberg correction.
Finally, we explore disparities by race at the population level.The county-level health disparity itself can be seen simply from thestrong correlation between the two variables: communities that aremore Black, have greater maternal mortality. We turn to Twitter-based community characteristics as mediators (i.e. explainers) ofthis race-mortality relationship. The idea behindmediation analysis,is that if included a 3rd variable (i.e. a Twitter measurement) in thelinear analysis reduces the relationship of the first 2 (i.e. race and
WWW ’20, April 20–24, 2020, Taipei, Taiwan Abebe and Giorgi, et al.
c − c ′ α β
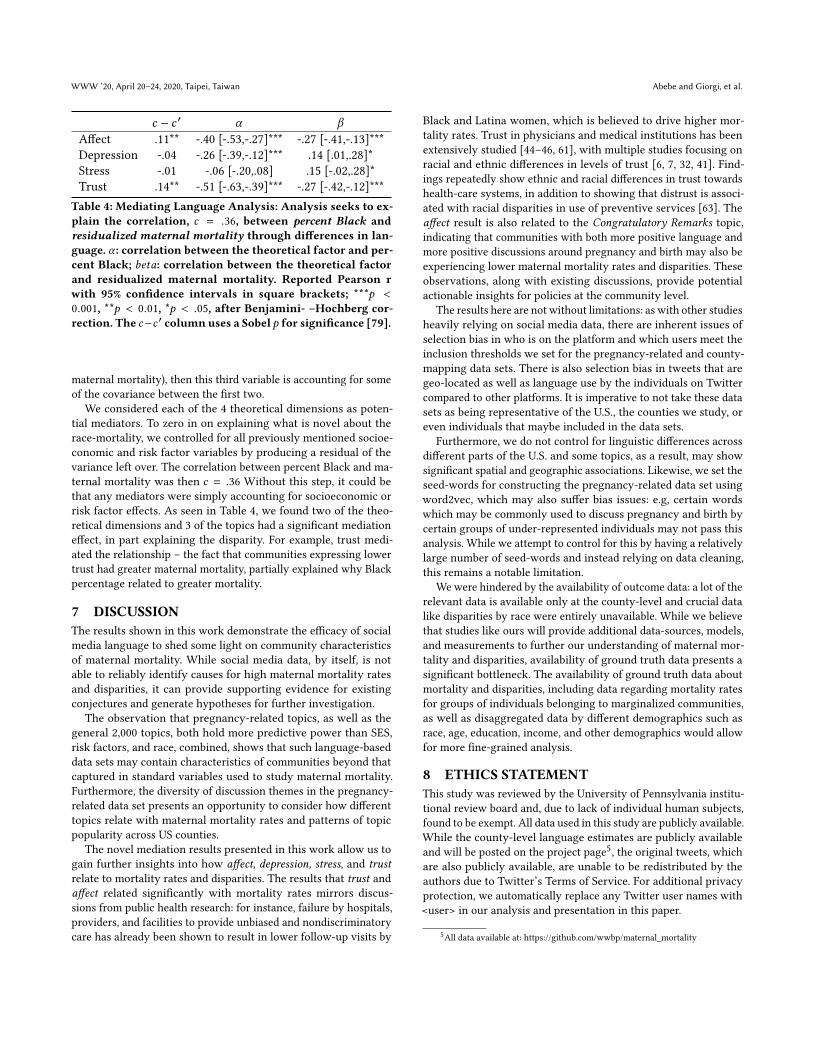
Affect .11** -.40 [-.53,-.27]*** -.27 [-.41,-.13]***Depression -.04 -.26 [-.39,-.12]*** .14 [.01,.28]*Stress -.01 -.06 [-.20,.08] .15 [-.02,.28]*Trust .14** -.51 [-.63,-.39]*** -.27 [-.42,-.12]***
Table 4: Mediating Language Analysis: Analysis seeks to ex-plain the correlation, c = .36, between percent Black andresidualized maternal mortality through differences in lan-guage. α : correlation between the theoretical factor and per-cent Black; beta: correlation between the theoretical factorand residualized maternal mortality. Reported Pearson rwith 95% confidence intervals in square brackets; ***p <0.001, **p < 0.01, *p < .05, after Benjamini- –Hochberg cor-rection. The c−c ′ column uses a Sobel p for significance [79].
maternal mortality), then this third variable is accounting for someof the covariance between the first two.
We considered each of the 4 theoretical dimensions as poten-tial mediators. To zero in on explaining what is novel about therace-mortality, we controlled for all previously mentioned socioe-conomic and risk factor variables by producing a residual of thevariance left over. The correlation between percent Black and ma-ternal mortality was then c = .36 Without this step, it could bethat any mediators were simply accounting for socioeconomic orrisk factor effects. As seen in Table 4, we found two of the theo-retical dimensions and 3 of the topics had a significant mediationeffect, in part explaining the disparity. For example, trust medi-ated the relationship – the fact that communities expressing lowertrust had greater maternal mortality, partially explained why Blackpercentage related to greater mortality.
7 DISCUSSIONThe results shown in this work demonstrate the efficacy of socialmedia language to shed some light on community characteristicsof maternal mortality. While social media data, by itself, is notable to reliably identify causes for high maternal mortality ratesand disparities, it can provide supporting evidence for existingconjectures and generate hypotheses for further investigation.
The observation that pregnancy-related topics, as well as thegeneral 2,000 topics, both hold more predictive power than SES,risk factors, and race, combined, shows that such language-baseddata sets may contain characteristics of communities beyond thatcaptured in standard variables used to study maternal mortality.Furthermore, the diversity of discussion themes in the pregnancy-related data set presents an opportunity to consider how differenttopics relate with maternal mortality rates and patterns of topicpopularity across US counties.
The novel mediation results presented in this work allow us togain further insights into how affect, depression, stress, and trustrelate to mortality rates and disparities. The results that trust andaffect related significantly with mortality rates mirrors discus-sions from public health research: for instance, failure by hospitals,providers, and facilities to provide unbiased and nondiscriminatorycare has already been shown to result in lower follow-up visits by
Black and Latina women, which is believed to drive higher mor-tality rates. Trust in physicians and medical institutions has beenextensively studied [44–46, 61], with multiple studies focusing onracial and ethnic differences in levels of trust [6, 7, 32, 41]. Find-ings repeatedly show ethnic and racial differences in trust towardshealth-care systems, in addition to showing that distrust is associ-ated with racial disparities in use of preventive services [63]. Theaffect result is also related to the Congratulatory Remarks topic,indicating that communities with both more positive language andmore positive discussions around pregnancy and birth may also beexperiencing lower maternal mortality rates and disparities. Theseobservations, along with existing discussions, provide potentialactionable insights for policies at the community level.
The results here are not without limitations: as with other studiesheavily relying on social media data, there are inherent issues ofselection bias in who is on the platform and which users meet theinclusion thresholds we set for the pregnancy-related and county-mapping data sets. There is also selection bias in tweets that aregeo-located as well as language use by the individuals on Twittercompared to other platforms. It is imperative to not take these datasets as being representative of the U.S., the counties we study, oreven individuals that maybe included in the data sets.
Furthermore, we do not control for linguistic differences acrossdifferent parts of the U.S. and some topics, as a result, may showsignificant spatial and geographic associations. Likewise, we set theseed-words for constructing the pregnancy-related data set usingword2vec, which may also suffer bias issues: e.g, certain wordswhich may be commonly used to discuss pregnancy and birth bycertain groups of under-represented individuals may not pass thisanalysis. While we attempt to control for this by having a relativelylarge number of seed-words and instead relying on data cleaning,this remains a notable limitation.
We were hindered by the availability of outcome data: a lot of therelevant data is available only at the county-level and crucial datalike disparities by race were entirely unavailable. While we believethat studies like ours will provide additional data-sources, models,and measurements to further our understanding of maternal mor-tality and disparities, availability of ground truth data presents asignificant bottleneck. The availability of ground truth data aboutmortality and disparities, including data regarding mortality ratesfor groups of individuals belonging to marginalized communities,as well as disaggregated data by different demographics such asrace, age, education, income, and other demographics would allowfor more fine-grained analysis.
8 ETHICS STATEMENTThis study was reviewed by the University of Pennsylvania institu-tional review board and, due to lack of individual human subjects,found to be exempt. All data used in this study are publicly available.While the county-level language estimates are publicly availableand will be posted on the project page5, the original tweets, whichare also publicly available, are unable to be redistributed by theauthors due to Twitter’s Terms of Service. For additional privacyprotection, we automatically replace any Twitter user names with<user> in our analysis and presentation in this paper.
5All data available at: https://github.com/wwbp/maternal_mortality

Quantifying Community Characteristics of Maternal Mortality Using Social Media WWW ’20, April 20–24, 2020, Taipei, Taiwan
REFERENCES[1] Rediet Abebe, Solon Barocas, Jon Kleinberg, Karen Levy, Manish Raghavan, and
David G Robinson. 2020. Roles for computing in social change. In Proceedings ofthe 2020 Conference on Fairness, Accountability, and Transparency. 252–260.
[2] Rediet Abebe, Shawndra Hill, Jennifer Wortman Vaughan, Peter M Small, andHAndrew Schwartz. 2019. Using search queries to understand health informationneeds in africa. In Proceedings of the International AAAI Conference on Web andSocial Media, Vol. 13. 3–14.
[3] Priya Agrawal. 2015. Maternal mortality and morbidity in the United States ofAmerica.
[4] Tim Althoff. 2017. Population-scale pervasive health. IEEE pervasive computing16, 4 (2017), 75–79.
[5] Maria Antoniak, David Mimno, and Karen Levy. 2019. Narrative Paths andNegotiation of Power in Birth Stories. In Proc. ACM Human Computer Interaction.CSCW.
[6] Katrina Armstrong, Mary Putt, Chanita Hughes Halbert, David Grande, J SanfordSchwartz, Kaijun Liao, Noora Marcus, Mirar Bristol Demeter, and Judy A Shea.2013. Prior experiences of racial discrimination and racial differences in healthcare system distrust. Medical Care 51, 2 (2013), 144.
[7] Katrina Armstrong, Karima L Ravenell, Suzanne McMurphy, and Mary Putt. 2007.Racial/ethnic differences in physician distrust in the United States. Americanjournal of public health 97, 7 (2007), 1283–1289.
[8] Laura Attanasio and Katy B Kozhimannil. 2017. Health care engagement andfollow-up after perceived discrimination in maternity care. Medical care 55, 9(2017), 830–833.
[9] Reuben M Baron and David A Kenny. 1986. The moderator–mediator variabledistinction in social psychological research: Conceptual, strategic, and statisticalconsiderations. Journal of personality and social psychology 51, 6 (1986), 1173.
[10] Yoav Benjamini and Yosef Hochberg. 1995. Controlling the false discovery rate: apractical and powerful approach to multiple testing. Journal of the Royal statisticalsociety: series B (Methodological) 57, 1 (1995), 289–300.
[11] Cynthia J Berg, William M Callaghan, Carla Syverson, and Zsakeba Henderson.2010. Pregnancy-related mortality in the United States, 1998 to 2005. Obstetrics& Gynecology 116, 6 (2010), 1302–1309.
[12] DavidMBlei, Andrew YNg, andMichael I Jordan. 2003. Latent dirichlet allocation.Journal of machine Learning research 3, Jan (2003), 993–1022.
[13] CDC. 2019. Center for Disease Control and Prevention. https://www.cdc.gov/nchs/data/databriefs/db229.
[14] CDC. 2019. Center for Disease Control and Prevention: CDC Wonder. https://wonder.cdc.gov/.
[15] CDC. 2019. Center for Disease Control and Prevention: PregnancyMortality Surveillance System. https://www.cdc.gov/reproductivehealth/maternalinfanthealth/pregnancy-mortality-surveillance-system.htm.
[16] Stevie Chancellor, Michael L Birnbaum, Eric D Caine, Vincent Silenzio, andMunmun De Choudhury. 2019. A taxonomy of ethical tensions in inferringmental health states from social media. In Proceedings of the Conference on Fairness,Accountability, and Transparency. ACM, 79–88.
[17] Irene Y Chen, Peter Szolovits, and Marzyeh Ghassemi. 2019. Can AI help reducedisparities in general medical and mental health care? AMA journal of ethics 21,2 (2019), 167–179.
[18] Raj Chetty, Michael Stepner, Sarah Abraham, Shelby Lin, Benjamin Scuderi,Nicholas Turner, Augustin Bergeron, and David Cutler. 2016. The associationbetween income and life expectancy in the United States, 2001-2014. Jama 315,16 (2016), 1750–1766.
[19] Sheldon Cohen, Ronald C Kessler, and Lynn Underwood Gordon. 1997. Measuringstress: A guide for health and social scientists. Oxford University Press on Demand.
[20] Mike Conway and Daniel O’Connor. 2016. Social media, big data, and mentalhealth: current advances and ethical implications. Current opinion in psychology9 (2016), 77–82.
[21] Paul T Costa and Robert R McCrae. 1992. Normal personality assessment inclinical practice: The NEO Personality Inventory. Psychological assessment 4, 1(1992), 5.
[22] Mayara Costa Figueiredo, Clara Caldeira, Tera L Reynolds, Sean Victory, KaiZheng, and Yunan Chen. 2017. Self-tracking for fertility care: collaborativesupport for a highly personalized problem. Proceedings of the ACM on Human-Computer Interaction 1, CSCW (2017), 36.
[23] Andreea A Creanga and William M Callaghan. 2017. Recent increases in the USmaternal mortality rate: disentangling trends frommeasurement issues. Obstetrics& Gynecology 129, 1 (2017), 206–207.
[24] Andreea A Creanga, Carla Syverson, Kristi Seed, and William M Callaghan. 2017.Pregnancy-related mortality in the United States, 2011–2013. Obstetrics andgynecology 130, 2 (2017), 366.
[25] Aron Culotta. 2014. Estimating county health statistics with twitter. In Proceedingsof the 32nd annual ACM conference on Human factors in computing systems. ACM,1335–1344.
[26] Brenda Curtis, Salvatore Giorgi, Anneke EK Buffone, Lyle H Ungar, Robert D Ash-ford, Jessie Hemmons, Dan Summers, Casey Hamilton, and H Andrew Schwartz.
2018. Can Twitter be used to predict county excessive alcohol consumptionrates? PloS one 13, 4 (2018), e0194290.
[27] Heike Thiel de Bocanegra, Monica Braughton, Mary Bradsberry, Mike Howell,Julia Logan, and Eleanor Bimla Schwarz. 2017. Racial and ethnic disparitiesin postpartum care and contraception in CaliforniaâĂŹs Medicaid program.American journal of obstetrics and gynecology 217, 1 (2017), 47–e1.
[28] Munmun De Choudhury, Scott Counts, and Eric Horvitz. 2013. Major life changesand behavioral markers in social media: case of childbirth. In Proceedings of the2013 conference on Computer supported cooperative work. ACM, 1431–1442.
[29] Munmun De Choudhury, Scott Counts, and Eric Horvitz. 2013. Social media as ameasurement tool of depression in populations. In Proceedings of the 5th AnnualACM Web Science Conference. ACM, 47–56.
[30] Munmun De Choudhury, Michael Gamon, Scott Counts, and Eric Horvitz. 2013.Predicting depression via social media. In Seventh international AAAI conferenceon weblogs and social media.
[31] Munmun De Choudhury, Meredith Ringel Morris, and Ryen W White. 2014.Seeking and sharing health information online: comparing search engines andsocial media. In Proceedings of the 32nd annual ACM conference on Human factorsin computing systems. ACM, 1365–1376.
[32] Mark P Doescher, Barry G Saver, Peter Franks, and Kevin Fiscella. 2000. Racialand ethnic disparities in perceptions of physician style and trust. (2000).
[33] Johannes C Eichstaedt, H Andrew Schwartz, Margaret L Kern, Gregory Park,Darwin R Labarthe, Raina M Merchant, Sneha Jha, Megha Agrawal, Lukasz ADziurzynski, Maarten Sap, Christopher Weeg, Emily E Larson, Lyle H Ungar, andMartin EP Seligman. 2015. Psychological language on Twitter predicts county-level heart disease mortality. Psychological Science 26 (2015), 159–169. Issue2.
[34] Centers for Disease Control, Prevention, et al. 2019. Building US capacity toreview and prevent maternal deaths. Report from nine maternal mortality reviewcommittees.
[35] Kirsten Gillibrand: United States Senator for New York. [n.d.]. With MaternalMortality Rates On The Rise In The United States, Gillibrand Announces NewLegislation To Help Reduce Maternal Deaths, Help Hospitals Implement BestPractices To Prevent Women From Dying Before, During And After Child-birth. https://www.gillibrand.senate.gov/news/press/release/with-maternal-mortality-rates-on-the-rise-in-the-united-states-gillibrand-announces-new-legislation-to-help-reduce-maternal-deaths-help-hospitals-implement-best-practices-to-prevent-women-from-dying-before-during-and-after-childbirth.
[36] Abby Gardner. [n.d.]. Black Women Are Dying During Childbirth. Sen. KamalaHarris Is Working to Change That. https://www.glamour.com/story/senator-kamala-harris-bill-maternal-mortality-crisis.
[37] Alan E Gelfand and Adrian FM Smith. 1990. Sampling-based approaches tocalculating marginal densities. Journal of the American statistical association 85,410 (1990), 398–409.
[38] Joseph Gibbons, Robert Malouf, Brian Spitzberg, Lourdes Martinez, Bruce Apple-yard, Caroline Thompson, Atsushi Nara, and Ming-Hsiang Tsou. 2019. Twitter-basedmeasures of neighborhood sentiment as predictors of residential populationhealth. PloS one 14, 7 (2019), e0219550.
[39] Salvatore Giorgi, Daniel Preotiuc-Pietro, Anneke Buffone, Daniel Rieman, Lyle H.Ungar, and H. Andrew Schwartz. 2018. The Remarkable Benefit of User-LevelAggregation for Lexical-based Population-Level Predictions. In Proceedings of the2018 Conference on Empirical Methods in Natural Language Processing.
[40] Amanda Michelle Gomez. [n.d.]. There’s finally a group of lawmak-ers focused on one of the widest racial disparities in health care.https://thinkprogress.org/house-forms-first-ever-black-maternal-health-caucus-alma-adams-lauren-underwood-32791417ffd7/.
[41] Howard S Gordon, Richard L Street Jr, Barbara F Sharf, P Adam Kelly, and JulianneSouchek. 2006. Racial differences in trust and lung cancer patients’ perceptionsof physician communication. Journal of clinical oncology 24, 6 (2006), 904–909.
[42] Xinning Gui, Yu Chen, Yubo Kou, Katie Pine, and Yunan Chen. 2017. Investigat-ing Support Seeking from Peers for Pregnancy in Online Health Communities.Proceedings of the ACM on Human-Computer Interaction 1, CSCW (2017), 50.
[43] Sharath Chandra Guntuku, Anneke Buffone, Kokil Jaidka, Johannes C Eichstaedt,and Lyle H Ungar. 2019. Understanding and measuring psychological stress usingsocial media. In Proceedings of the International AAAI Conference on Web andSocial Media, Vol. 13. 214–225.
[44] Mark A Hall, Fabian Camacho, Elizabeth Dugan, and Rajesh Balkrishnan. 2002.Trust in the medical profession: conceptual and measurement issues. Healthservices research 37, 5 (2002), 1419–1439.
[45] Mark A Hall, Elizabeth Dugan, Beiyao Zheng, and Aneil K Mishra. 2001. Trustin physicians and medical institutions: what is it, can it be measured, and does itmatter? The milbank quarterly 79, 4 (2001), 613–639.
[46] Mark A Hall, Beiyao Zheng, Elizabeth Dugan, Fabian Camacho, Kristin E Kidd,Aneil Mishra, and Rajesh Balkrishnan. 2002. Measuring patientsâĂŹ trust in theirprimary care providers. Medical care research and review 59, 3 (2002), 293–318.
[47] Arthur E Hoerl and Robert W Kennard. 1970. Ridge regression: Biased estimationfor nonorthogonal problems. Technometrics 12, 1 (1970), 55–67.

WWW ’20, April 20–24, 2020, Taipei, Taiwan Abebe and Giorgi, et al.
[48] Elizabeth A Howell. 2018. Reducing Disparities in Severe Maternal Morbidityand Mortality. Clinical obstetrics and gynecology 61, 2 (2018), 387–399.
[49] Elizabeth A Howell, Natalia Egorova, Amy Balbierz, Jennifer Zeitlin, and Paul LHebert. 2016. Black-white differences in severe maternal morbidity and site ofcare. American journal of obstetrics and gynecology 214, 1 (2016), 122–e1.
[50] Elizabeth A Howell, Natalia N Egorova, Amy Balbierz, Jennifer Zeitlin, andPaul L Hebert. 2016. Site of delivery contribution to black-white severe maternalmorbidity disparity. American journal of obstetrics and gynecology 215, 2 (2016),143–152.
[51] Kokil Jaidka, Sharath Chandra Guntuku, Anneke Buffone, H. Andrew Schwartz,and Lyle Ungar. 2018. Facebook versus Twitter: Cross-Platform Differences inSelf-Disclosure and Trait Prediction. In Proceedings of the International AAAIConference on Web and Social Media.
[52] Margaret L Kern, Gregory Park, Johannes C Eichstaedt, H Andrew Schwartz,Maarten Sap, Laura K Smith, and Lyle H Ungar. 2016. Gaining insights fromsocial media language: Methodologies and challenges. Psychological methods 21,4 (2016), 507.
[53] Michal Kosinski, Sandra C Matz, Samuel D Gosling, Vesselin Popov, and DavidStillwell. 2015. Facebook as a research tool for the social sciences: Opportunities,challenges, ethical considerations, and practical guidelines. American Psychologist70, 6 (2015), 543.
[54] Katy Backes Kozhimannil, Connie Mah Trinacty, Alisa B Busch, Haiden AHuskamp, and Alyce S Adams. 2011. Racial and ethnic disparities in postpartumdepression care among low-income women. Psychiatric Services 62, 6 (2011),619–625.
[55] Robert S Levine, James E Foster, Robert E Fullilove, Mindy T Fullilove, Nathaniel CBriggs, Pamela C Hull, Baqar A Husaini, and Charles H Hennekens. 2016. Black-white inequalities in mortality and life expectancy, 1933–1999: implications forhealthy people 2010. Public health reports (2016).
[56] Judette M Louis, M Kathryn Menard, and Rebekah E Gee. 2015. Racial and ethnicdisparities in maternal morbidity and mortality. Obstetrics & Gynecology 125, 3(2015), 690–694.
[57] Michael C Lu. 2018. Reducing maternal mortality in the United States. Jama 320,12 (2018), 1237–1238.
[58] Marco Lui and Timothy Baldwin. 2012. langid. py: An off-the-shelf languageidentification tool. In Proceedings of the ACL 2012 system demonstrations (ACL).25–30.
[59] N Martin, E Cillekens, and A Freitas. 2017. Lost mothers. ProPublica.[60] Andrew Kachites McCallum. 2002. Mallet: A machine learning for language
toolkit. http://mallet. cs. umass. edu (2002).[61] David Mechanic. 1996. Changing medical organization and the erosion of trust.
The Milbank Quarterly (1996), 171–189.[62] Danielle Mowery, Albert Park, Mike Conway, and Craig Bryan. 2016. Towards
automatically classifying depressive symptoms from Twitter data for populationhealth.
[63] Donald Musa, Richard Schulz, Roderick Harris, Myrna Silverman, and Stephen BThomas. 2009. Trust in the health care system and the use of preventive healthservices by older black and white adults. American journal of public health 99, 7(2009), 1293–1299.
[64] NYC Health. [n.d.]. Severe Maternal Morbidity: New York City, 2008-2012.https://www1.nyc.gov/assets/doh/downloads/pdf/data/maternal-morbidity-report-08-12.pdf.
[65] Gregory Park, H Andrew Schwartz, Johannes C Eichstaedt, Margaret L Kern,Michal Kosinski, David J Stillwell, Lyle H Ungar, and Martin EP Seligman. 2015.Automatic personality assessment through social media language. Journal ofpersonality and social psychology 108, 6 (2015), 934.
[66] Michael J. Paul and Mark Dredze. 2011. You Are What You Tweet: AnalyzingTwitter for Public Health. In International Conference on Weblogs and Social Media(ICWSM). 265–272.
[67] Michael J Paul and Mark Dredze. 2017. Social monitoring for public health.Synthesis Lectures on Information Concepts, Retrieval, and Services 9, 5 (2017),1–183.
[68] Emily E Petersen, Nicole L Davis, David Goodman, Shanna Cox, Nikki Mayes,Emily Johnston, Carla Syverson, Kristi Seed, Carrie K Shapiro-Mendoza,William M Callaghan, et al. 2019. Vital Signs: Pregnancy-Related Deaths, UnitedStates, 2011–2015, and Strategies for Prevention, 13 States, 2013–2017. Morbidityand Mortality Weekly Report 68, 18 (2019), 423.
[69] Daniel Preotiuc-Pietro, Jordan Carpenter, Salvatore Giorgi, and Lyle Ungar. 2016.Studying the Dark Triad of personality through Twitter behavior. In Proceed-ings of the 25th ACM international on conference on information and knowledgemanagement. ACM, 761–770.
[70] Daniel Preotiuc-Pietro, Sina Samangooei, Trevor Cohn, Nicholas Gibbins, andMahesan Niranjan. 2012. Trendminer: An architecture for real time analysis ofsocial media text. In In Proceedings of the 6th International AAAI Conference onWeblogs and Social Media, Workshop on Real-Time Analysis and Mining of SocialStreams, ICWSM.
[71] Daniel Preoţiuc-Pietro, H Andrew Schwartz, Gregory Park, Johannes Eichstaedt,Margaret Kern, Lyle Ungar, and Elisabeth Shulman. 2016. Modelling valence and
arousal in facebook posts. In Proceedings of the 7th Workshop on ComputationalApproaches to Subjectivity, Sentiment and Social Media Analysis. 9–15.
[72] Daniel Rieman, Kokil Jaidka, H Andrew Schwartz, and Lyle Ungar. 2017. Domainadaptation from user-level facebook models to county-level twitter predictions.In Proceedings of the Eighth International Joint Conference on Natural LanguageProcessing (Volume 1: Long Papers). 764–773.
[73] Robin Fields. [n.d.]. New York City Launches Committee to Review MaternalDeaths. https://www.propublica.org/article/new-york-city-launches-committee-to-review-maternal-deaths.
[74] James A Russell. 1980. A circumplex model of affect. Journal of personality andsocial psychology 39, 6 (1980), 1161.
[75] H Andrew Schwartz, Johannes Eichstaedt, Margaret L Kern, Gregory Park,Maarten Sap, David Stillwell, Michal Kosinski, and Lyle Ungar. 2014. Towardsassessing changes in degree of depression through facebook. In Proceedings of theWorkshop on Computational Linguistics and Clinical Psychology: From LinguisticSignal to Clinical Reality. 118–125.
[76] H Andrew Schwartz, Johannes C Eichstaedt, Margaret L Kern, Lukasz Dziurzyn-ski, Richard E Lucas, Megha Agrawal, Gregory J Park, Shrinidhi K Lakshmikanth,Sneha Jha, Martin E P Seligman, and Lyle H Ungar. 2013. Characterizing geo-graphic variation in well-being using tweets. In Proceedings of the 7th InternationalAAAI Conference on Weblogs and Social Media (ICWSM).
[77] H Andrew Schwartz, Johannes C Eichstaedt, Margaret L Kern, Lukasz Dziurzyn-ski, Stephanie M Ramones, Megha Agrawal, Achal Shah, Michal Kosinski, DavidStillwell, Martin EP Seligman, and Lyle H Ungar. 2013. Personality, gender, andage in the language of social media: The Open-Vocabulary approach. PLoS ONE(2013).
[78] H Andrew Schwartz, Salvatore Giorgi, Maarten Sap, Patrick Crutchley, LyleUngar, and Johannes Eichstaedt. 2017. DLATK: Differential language analysisToolKit. In Proceedings of the 2017 Conference on Empirical Methods in NaturalLanguage Processing: System Demonstrations. 55–60.
[79] Michael E Sobel. 1982. Asymptotic confidence intervals for indirect effects instructural equation models. Sociological methodology 13 (1982), 290–312.
[80] VG Vinod Vydiswaran, Yang Liu, Kai Zheng, David A Hanauer, and QiaozhuMei. 2014. User-created groups in health forums: What makes them special?. InEighth International AAAI Conference on Weblogs and Social Media.
[81] Sen. Elizabeth Warren. [n.d.]. Sen. Elizabeth Warren On Black Women Ma-ternal Mortality: ’Hold Health Systems Accountable For Protecting BlackMoms’. https://www.essence.com/feature/sen-elizabeth-warren-black-women-mortality-essence/.
[82] Carla Abou Zahr, Tessa M Wardlaw, and Yoonjoung Choi. 2004. Maternal mor-tality in 2000: estimates developed by WHO, UNICEF and UNFPA. World HealthOrganization.
[83] Mohammadzaman Zamani, Anneke Buffone, and H Andrew Schwartz. 2018.Predicting Human Trustfulness from Facebook Language. arXiv preprintarXiv:1808.05668 (2018).

Quantifying Community Characteristics of Maternal Mortality Using Social Media WWW ’20, April 20–24, 2020, Taipei, Taiwan
APPENDIXWe include further details on results and discussions from the maintext below:
A SAMPLE TWEETSThe last column shows a sample of three tweets for the topic. To findthese representative tweets, we extract topic loadings over a randomset of 500,000 pregnancy-related tweets. We then order the tweetsby topic loadings and hand-select three tweets (out of the top ten)that best describe the topic, ignoring noisy or uninformative tweets.For example, a tweet “teen rates!!!” would load extremely high inour first topic, but it doesn’t capture any additional informationover the list of the highest-weighted words within the topic. Notethat all typos and emoticons in the tweets are included unchanged.
Topic Label Sample TweetsTeenPregnancy(1.34%)
teenage pregnancy #iblamedavidcameronDecreasing infant mortality around the world<URL>#BecauseOfYolo teenage pregnancy rate hasrisen
MorningSickness(0.54%)
The purpose of our lives is to give birth to thebest which is within us Marianne Williamson#spiritualityEcotopic pregnancy diagnosis symptoms andcomplications <URL>Getting a sickness that isn’t morning sicknesswhile #pregnant #sucks #cough #throathurts#stuffynose #blah
CelebrityPregnancies(1.42%)
Amber rose is pregnant ? #damnwizhopefully kim k’s pregnancy doesnt last 72 daysTaylor swift pregnant by harry
AbortionRights (2.15%)
Lawmakers ban shackling of pregnant inmates<URL>#SouthAfrica to care for all #HIV positive infants<URL> #worldaidsday #womensrights #childrenNebraska governor rejects prenatal care fundingfor illegal immigrants <URL>
MaternalStudies(2.56%)
Lower autism risk with folic acid supplementsin pregnancy <URL>Postpartum cardiovascular risk linked to glucoseintolerance during pregnancy <URL>Increased autism risk linked to hospital-diagnosed maternal infections <URL>
CongratulatoryRemarks(3.06%)
Congrats to <USER> and <USER> on the birthof their baby#5yearsago i gave birth to my wonderful daugh-ter <3 <3 <3Awwwwww my nephew’s wife is pregnant <3congrats!
Table 5: Sample topics with sample tweets
B THEORETICAL MODELSWe present high-level details for each of the four models used inthis paper. Detailed descriptions and evaluations can be found inthe corresponding papers. Note that none of the models describedbelow were developed for this paper.
Affect. An affect model was built using a set of 2,895 annotatedFacebook posts. Each post was rated by two psychologists on anine-point ordinal scale, based on the affective circumplex modelintroduced by Russell [74]. A ℓ2 penalized linear (ridge) regressionwas built using 1—2grams extracted from each message. Usinga 10-fold cross-validation setup, the ngram model resulted in aprediction accuracy (Pearson r ) of 0.65. Full details can be found inPreoţiuc-Pietro et al. [71].
Depression. The MyPersonality data set [53], which consistedof approximately 154,000 consenting users who shared Facebookstatuses and completed a 100-item personality questionnaire wasused. The personality questionnaire is based on the InternationalPersonality Item Pool proxy for the NEO Personality Inventory [21].This work then takes the average response to the seven depression-facet items (located within the larger Neuroticism scale) to estimateuser-level degree of depression. A ridge-penalized regression modelwas built [47] using a set of 2,000 LDA topics and 1-3grams extractedover 27,749 individuals and tested on 1,000 random individuals whoused at least 1,000 words across all of their statuses. This resultedin a final prediction accuracy (Pearson r ) of 0.39. Full details can befound in Schwartz et al. [75].
Trust. Similar to the depression model, the trust model was builtusing the MyPersonality Facebook data set [53]. Consenting indi-viduals were asked to share their Facebook statuses and answer aBig-Five personality questionnaire. The average of three of the tentrust-facet items from the agreeableness domain – (1) "I believe thatothers have good intentions," (2) "I trust what people say," and (3) "Isuspect hidden motives in others" (reverse-coded) – was used as ameasure of trust. A predictive model was built on 26,243 users whoanswered the above question and also shared Facebook statuses(with at least 1,000 words across all statuses) and evaluated on asmaller set of users (N =621) who answered the ten trust-facetitems. Using a set of 2,000 LDA topics and 1-3grams, this resulted ina prediction accuracy (Pearson r ) of 0.35. Full details can be foundin Zamani et al. [83].
Stress. Participants were recruited through Qualtrics (an onlinesurvey platform, similar to Amazon Mechanical Turk), where eachparticipant answered a series of demographic questions, the 10-itemCohen’s Stress scale [19] and consented to share their Facebookstatuses. The analysis was then limited to those who self-reportedage and gender (female/male) and who posted at least 500 wordsacross all Facebook statuses, resulting in a final set of 2,749 partic-ipants. A set of 2,000 Facebook topics were used as features in aridge penalized regression model [47]. This resulted in a predictionaccuracy of 0.32 (Pearson r ), using a 10-fold cross validation setup.Full details can be found in Guntuku et al. [43].

WWW ’20, April 20–24, 2020, Taipei, Taiwan Abebe and Giorgi, et al.
C DOMAIN TRANSFER: APPLYINGFACEBOOK MODELS TO TWITTER DATA
All four of our theoretical models were trained and evaluated onFacebook data in their original papers, whereas we applied themodels to Twitter data. Some of the models have been shown towork in other domains (i.e., stress on Facebook vs Twitter; Guntuku2019). Additionally, previous work has found is that effect sizestend to vanish without correcting for the domain transfer [72],which we argue makes our prediction task harder. Additionally,Rieman et al. [72] showed that user-level Facebook models appliedto county-level Twitter data are stable in terms of direction of effectsizes.
D SPATIAL DISTRIBUTIONSFigure 3 shows the relationship between maternal mortality rates(residualized on race, median age of females, socioeconomics andrisk factors) and the topic loadings for the Congratulatory Remarkstopic. Markers in the scatter plot are colored according to U.S.Census regions (Midwest, Northeast, South and West). We see thatlower usage of this topic is associated with high mortality rates. Wealso see spatial clustering across the regions. For example, the Westtends to have lower rates of mortality but large variance in topicusage. The South has the most variation in mortality in addition tothe largest outliers in topic usage. Figure ?? includes a similar setof plots for the theoretically-relevant features, showing significantassociations between affect and trust and maternal mortality.
1 0 1 2 3 4
Maternal Mortality Rate
2
1
0
1
2
3
4
5
Con
grat
ulat
ory
Rem
arks
SouthWestNortheastMidwest
Figure 3: Maternal mortality rate (residualized) vs the Con-gratulatory Remarks topic loading. Dots are colored bywhich U.S. Census Region the county resides in: Midwest,Northeast, South and West.
1 0 1 2 3 4
Maternal Mortality Rate
2
1
0
1
2
3
Affe
ct
SouthWestNortheastMidwest
(a) Affect
1 0 1 2 3 4
Maternal Mortality Rate
2
1
0
1
2
3
Dep
ress
ion
SouthWestNortheastMidwest
(b) Depression
1 0 1 2 3 4
Maternal Mortality Rate
3
2
1
0
1
2
3
Str
ess
SouthWestNortheastMidwest
(c) Stress
1 0 1 2 3 4
Maternal Mortality Rate
2
1
0
1
2
3
Tru
st
SouthWestNortheastMidwest
(d) Trust
Figure 4: Maternal mortality rate (residualized) vs theoreti-cally relevant features. Dots are colored by which U.S. Cen-sus Region the county resides in: Midwest, Northeast, Southand West.