Embed Size (px)
Citation preview

Paula C. Carder, PhD Jacklyn Kohon, PhD Aubrey Limburg Amanuel Zimam Megan Rushkin, MPH Margaret B. Neal, PhD Spring, 2016
Community-Based Care
Resident and Community Characteristics Chart Book Adult Foster Home

i
Table of Contents Section 1 – Adult Foster Home Characteristics ......................................................................................................................................... 1
Table 1.1 – Occupancy Rate .................................................................................................................................................................... 1
Table 1.2 – Rate of AFH Respondents at Full Capacity ........................................................................................................................... 2
Table 1.3 – Providers Living in AFH by Year ............................................................................................................................................ 3
Table 1.4 – Provider Certification by Year ............................................................................................................................................... 4
Table 1.5 – Regional Distribution of Sample and Response.................................................................................................................... 5
Figure 1.1 – Oregon Regions by County used for Sampling .................................................................................................................... 6
Section 2 – Adult Foster Home Staff ........................................................................................................................................................... 7
Table 2.1 – Number of Caregivers Employed by Year ............................................................................................................................. 7
Table 2.2 – Caregiver Certifications ........................................................................................................................................................ 8
Figure 2.1 – Staff Training Topics Covered in the Prior 12 Months ........................................................................................................ 9
Table 2.3 – Staff and Resident Languages ............................................................................................................................................ 10
Figure 2.2 – Visits from Health Service Professionals in 2015 and 2016 .............................................................................................. 11
Table 2.4 – Visits from Health Service Professionals by Region ............................................................................................................ 12
Figure 2.3 – Use of a Fall Risk Assessment Tool .................................................................................................................................... 13
Section 3 – Rates, Fees, and Medicaid Use............................................................................................................................................... 14
Table 3.1 – Average Total Monthly Charge for Private Room .............................................................................................................. 14
Figure 3.1 – Rate Structures Reported by AFHs .................................................................................................................................... 15
Figure 3.2 – Percent of Private-Pay Residents Paying by Type of Rate ................................................................................................ 16
Table 3.2 – Available Services and Additional Charges ........................................................................................................................ 17
Figure 3.3 – Estimated Total Annual Charges for AFHs in Oregon ....................................................................................................... 18
Table 3.3 – Estimated Annual Profession Charges for Oregon AFHs .................................................................................................... 19

ii
Section 4 – Community Services and Policies ........................................................................................................................................... 20
Table 4.1 – Resident Needs and Behaviors that Prompt a Move-Out Notice ....................................................................................... 20
Section 5 – Residents ................................................................................................................................................................................ 21
Figure 5.1 – Age Distribution of AFH Residents .................................................................................................................................... 21
Table 5.1 – Gender, Marital Status, Age ............................................................................................................................................... 22
Table 5.2 – Race/Ethnicity .................................................................................................................................................................... 23
Figure 5.2 – Resident Location Prior to Move-In ................................................................................................................................... 24
Figure 5.3 – Resident Move-Out Location ............................................................................................................................................. 25
Table 5.3 – Move-In and Move-Out Locations ...................................................................................................................................... 26
Figure 5.4 – Resident Length of Stay upon Move-Out .......................................................................................................................... 27
Table 5.4 – Length-of-Stay .................................................................................................................................................................... 28
Table 5.5 – Comparison of Residents’ Personal Care Needs ................................................................................................................. 29
Table 5.6 – Chronic Conditions .............................................................................................................................................................. 30
Figure 5.6– Falls in Prior 90 days and Falls Resulting in Injury or Hospitalization ................................................................................ 31
Table 5.7 – Health Service Use .............................................................................................................................................................. 32
Table 5.8 – Medications and Treatments ............................................................................................................................................. 33

Oregon Community-Based Care Chartbook, 2016: Adult Foster Homes Section 1 – Adult Foster Home Characteristics
1
Section 1 – Adult Foster Home Characteristics 1
Table 1.1 – Occupancy Rate
Total Licensed Capacity of Survey Respondents
Occupancy of survey respondents Occupancy rate
1,401 1,218 87%
SOURCE: Oregon CBC Survey 2016: AFH, Table 1
Survey respondents were licensed to care for 1,401 residents and reported 1,218 current residents, for an occupancy rate of 87 percent.
1 For literature, references, and more information about this study, see the Oregon CBC Survey 2016 available at http://www.oregon.gov/DHS/SENIORS-
DISABILITIES/Pages/publications.aspx and https://www.pdx.edu/ioa/oregon-community-based-care-project

Oregon Community-Based Care Chartbook, 2016: Adult Foster Homes Section 1 – Adult Foster Home Characteristics
2
Table 1.2 – Rate of AFH Respondents at Full Capacity
Licensed capacity
% (n) At maximum capacity
% (n)
1 resident 6% (20) 100% (20)
2 residents 3% (9) 78% (7)
3 residents 6% (20) 50% (10)
4 residents 13% (40) 30% (12)
5 residents 72% (230) 62% (143)
Overall 319 60% (191)
SOURCE: Oregon CBC Survey 2016: AFH, Table 2
Sixty-percent of AFH providers were at full capacity. Of the homes licensed for five residents, 62 percent actually had five residents.

Oregon Community-Based Care Chartbook, 2016: Adult Foster Homes Section 1 – Adult Foster Home Characteristics
3
Table 1.3 – Providers Living in AFH by Year
2015 % (n)
2016 % (n)
Live at AFH 89% (200) 85% (272)
Family in AFH 56% (115) 72% (196)
Average number of family members 2.1 2.2
17 or younger 32% (76) 29% (126)
18 or older 68% (162) 71% (303)
SOURCE: Oregon CBC Survey 2016: AFH, Table 3
Eighty-five percent of providers lived at their AFH, and of those, 72 percent had family members living in the home. Of these family members, 29 percent were age 17 or younger.
Oregon Community-Based Care Chartbook, 2016: Adult Foster Homes Section 1 – Adult Foster Home Characteristics
4
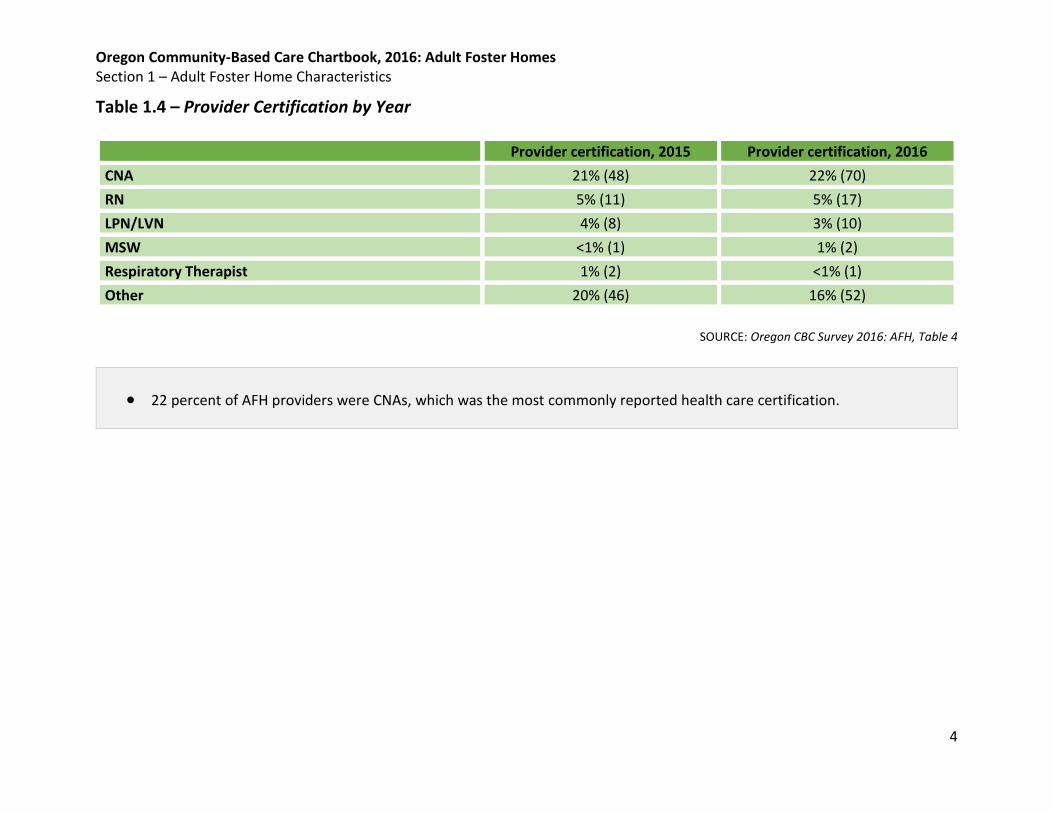
Table 1.4 – Provider Certification by Year
Provider certification, 2015 Provider certification, 2016
CNA 21% (48) 22% (70)
RN 5% (11) 5% (17)
LPN/LVN 4% (8) 3% (10)
MSW <1% (1) 1% (2)
Respiratory Therapist 1% (2) <1% (1)
Other 20% (46) 16% (52)
SOURCE: Oregon CBC Survey 2016: AFH, Table 4
22 percent of AFH providers were CNAs, which was the most commonly reported health care certification.

Oregon Community-Based Care Chartbook, 2016: Adult Foster Homes Section 1 – Adult Foster Home Characteristics
5
Table 1.5 – Regional Distribution of Sample and Response
Population % (n)
Sample Population % (n)
Respondents % (n)
Response Rate % (n)
Region 1: Portland Metro 50% (847) 50% (313) 47% (150) 48% (150)
Region 2: Willamette Valley/North Coast 25% (415) 24% (150) 25% (80) 53% (80)
Region 3: Southern Oregon/South Coast 16% (268) 16% (100) 17% (53) 53% (53)
Region 4: East of the Cascades
10% (162) 10% (63) 11% (35) 56% (35)
Total 1,692 626 318 51% (318)2
SOURCE: Oregon CBC Survey 2016: AFH, Table A1
Half of all adult foster homes in Oregon are located in Region 1 (Portland Metro).
Region 4 (East of the Cascades) had the highest response rate (56 percent) of all four regions in Oregon.
2 One respondent completed the questionnaire anonymously and is, therefore, not reflected in this total as the region is unknown in that case.

Oregon Community-Based Care Chartbook, 2016: Adult Foster Homes Section 1 – Adult Foster Home Characteristics
6
Figure 1.1 – Oregon Regions by County used for Sampling
SOURCE: Oregon CBC Survey 2016: AFH, Figure A1
This figure is a geographic depiction of the four regions in which adult foster homes were grouped in Oregon.

Oregon Community-Based Care Chartbook, 2016: Adult Foster Homes Section 2 – Adult Foster Home Staff
7
Section 2 – Adult Foster Home Staff
Table 2.1 – Number of Caregivers Employed by Year
Number of caregivers, 2015
% (n) Number of caregivers, 2016
% (n)
0 20% (46) 12% (38)
1 35% (80) 23% (72)
2 26% (58) 32% (100)
3 9% (20) 19% (61)
4 2% (4) 8% (24)
5 or more 8% (18) 7% (21)
SOURCE: Oregon CBC Survey 2016: AFH, Table 5
Forty-two percent of homes employed at least one caregiver. Most AFHs employed one to three caregivers, although 12 percent of homes did not employ a caregiver, compared to 20
percent last year. AFHs employed, on average, 2.2 caregivers (compared to 1.6 last year).

Oregon Community-Based Care Chartbook, 2016: Adult Foster Homes Section 2 – Adult Foster Home Staff
8
Table 2.2 – Caregiver Certifications
Caregivers
% (n)
LPN/LVN 2% (15)
CNA 14% (94)
CMA 3% (22)
Personal Care (not licensed or certified) 81% (552)
SOURCE: Oregon CBC Survey 2016: AFH, Table 6
Most caregivers did not hold a certification or license, though 19 percent did. The majority (81 percent) of caregivers were personal care staff who were not licensed or certified.
Oregon Community-Based Care Chartbook, 2016: Adult Foster Homes Section 2 – Adult Foster Home Staff
9
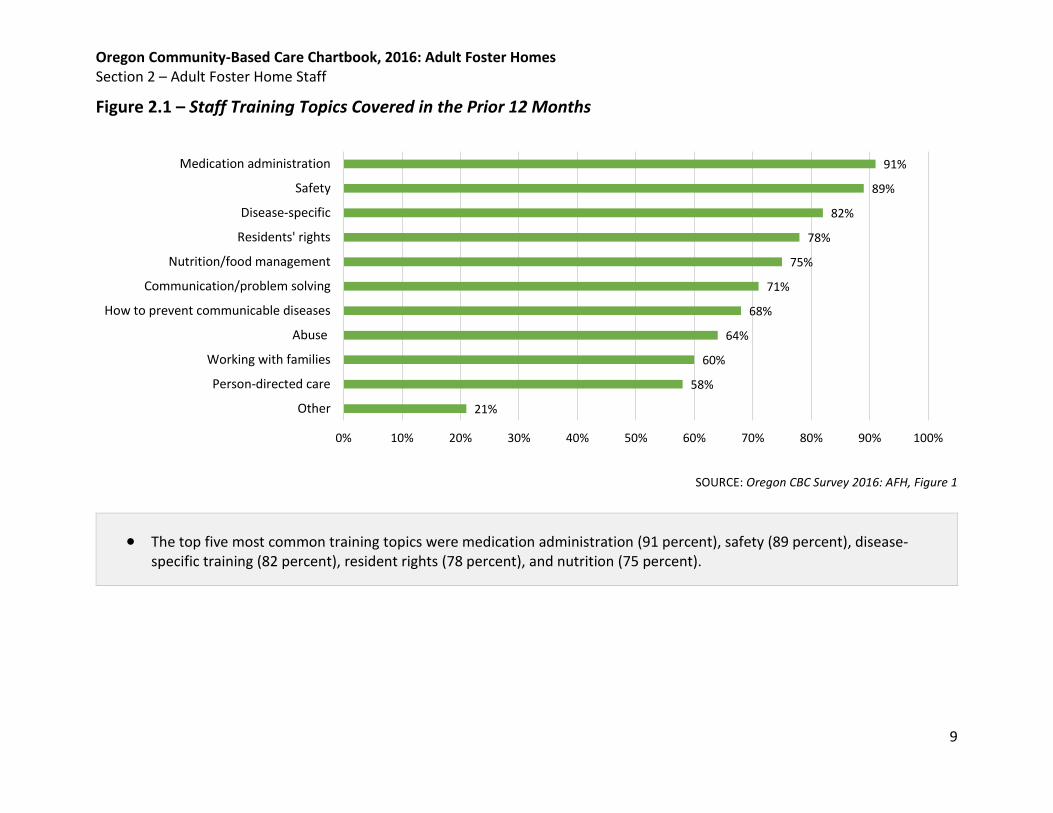
Figure 2.1 – Staff Training Topics Covered in the Prior 12 Months
SOURCE: Oregon CBC Survey 2016: AFH, Figure 1
The top five most common training topics were medication administration (91 percent), safety (89 percent), disease-specific training (82 percent), resident rights (78 percent), and nutrition (75 percent).
21%
58%
60%
64%
68%
71%
75%
78%
82%
89%
91%
0% 10% 20% 30% 40% 50% 60% 70% 80% 90% 100%
Other
Person-directed care
Working with families
Abuse
How to prevent communicable diseases
Communication/problem solving
Nutrition/food management
Residents' rights
Disease-specific
Safety
Medication administration

Oregon Community-Based Care Chartbook, 2016: Adult Foster Homes Section 2 – Adult Foster Home Staff
10
Table 2.3 – Staff and Resident Languages
Languages Staff Residents Languages Staff Residents Languages Staff Residents
Romanian 67 4 Hindi 2 1 Native American 1 -
Spanish 40 9 Lao 2 3 Tamil 1 -
Tagalog 27 1 Nepali 2 - Thai 1 1
Filipino 15 - Samoan 2 1 Tiwa 1 -
Russian 11 4 Telugu 2 - Tongan 1 -
German 8 2 Tibetan 2 - Vietnamese - 4
Hungarian 8 - Visayan 2 - Greek - 2
French 5 2 Arabic 1 - Bulgarian - 1
Amharic 4 1 ASL 1 - Estonian - 1
Italian 3 - Cambodia 1 1 Halian - 1
Filipino 3 - Chamorro 1 - Japanese - 1
Tigrigna 3 - Chinese 1 1 Korean - 1
Ukrainian 3 2 Czechoslovakian 1 - Latvian - 1
African 2 - Hebrew 1 - Marshallese - 1
SOURCE: Oregon CBC Survey 2016: AFH, Table B1
The language most commonly spoken by staff was Romanian. The language most commonly spoken by residents was Spanish.
Only four percent of all residents primarily spoke a language other than English. Thirty-six homes reported at least one resident who spoke a language other than English, and of these, 39 percent (14
homes) reported language compatibility between the resident and an employee.

Oregon Community-Based Care Chartbook, 2016: Adult Foster Homes Section 2 – Adult Foster Home Staff
11
Figure 2.2 – Visits from Health Service Professionals in 2015 and 2016
SOURCE: Oregon CBC Survey 2016: AFH, Figure 2
This figure compares the percent of homes that were visited by each of six types of professionals. For 2016, in order of most to least, homes were visited by a: licensed nurse (66 percent), case manager (50 percent),
physical or occupational therapist, medical doctor (MD) or nurse practitioner (NP), hospice worker, mental health provider, and dentist/dental hygienist.
Twelve percent of homes were not visited by any of these health professionals. For all regions, AFHs reported fewer visits from health service professionals compared to last year.
76%72%
49%
36%39%
20%
66%
50%
38%35%
31%
13%
0%
10%
20%
30%
40%
50%
60%
70%
80%
Licensed nurse Case manager PT or OT MD or NP Hospice Mental health
2015 2016

Oregon Community-Based Care Chartbook, 2016: Adult Foster Homes Section 2 – Adult Foster Home Staff
12
Table 2.4 – Visits from Health Service Professionals by Region
Region 1: Portland Metro
% (n)
Region 2: Willamette
Valley/North Coast % (n)
Region 3: Southern
Oregon/South Coast % (n)
Region 4: East of the Cascades
% (n)
Total % (n)
Hospice 36% (54) 25% (20) 24% (13) 35% (12) 31% (99)
Nurse 74% (111) 48% (38) 57% (31) 82% (28) 66% (208)
MD 50% (75) 25% (20) 9% (5) 32% (11) 35% (111)
MH 15% (23) 15% (12) 6% (3) 6% (2) 13% (40)
Physical/occupational therapist 42% (63) 27% (21) 46% (25) 38% (13) 38% (122)
Case manager 47% (71) 52% (41) 48% (26) 65% (22) 50% (160)
Dentist/hygienist 16% (24) 3% (2) 4% (2) - 9% (28)
Other 11% (16) 5% (4) - 6% (2) 7% (22)
Total 150 79 54 34 317
SOURCE: Oregon CBC Survey 2016: AFH, Table 7
This table provides more detailed information about visits to adult foster homes from health service professionals (Figure 2.2).
AFHs in Region 1 (Portland Metro) reported the greatest percentage of visits from hospice workers (36 percent), medical doctors (50 percent), and dentists/dental hygienists (16 percent).
AFHs in Region 3 (Southern Oregon/South Coast) reported the greatest percentage of visits from physical and/or occupational therapists (46 percent).
AFHs in Region 3 was the most likely to have had no health professionals visit the home in the past 90 days.
AFHs in Region 4, East of the Cascades, reported the highest percentage of visits from nurse and home health providers (82 percent) and case managers (65 percent).

Oregon Community-Based Care Chartbook, 2016: Adult Foster Homes Section 2 – Adult Foster Home Staff
13
Figure 2.3 – Use of a Fall Risk Assessment Tool
SOURCE: Oregon CBC Survey 2016: AFH, Figure 3
Oregon’s DHS encourages AFH providers to use a validated fall risk assessment tool such as the Centers for Disease Control’s STEADI (Stop Elderly Accidents, Deaths and Injuries) tool, the TUG (Timed Up and Go) test, or another tool that has been shown to reliably assess fall risks among older adults.
Forty-six percent of homes used a fall risk assessment tool as a matter of standard practice or on a case-by-case basis.
21%
33%
23%
23%
Don't know No Case-by-case Yes

Oregon Community-Based Care Chartbook, 2016: Adult Foster Homes Section 3 – Rates, Fees, and Medicaid Use
14
Section 3 – Rates, Fees, and Medicaid Use
Table 3.1 – Average Total Monthly Charge for Private Room
Minimum Average Maximum
Region 1: Portland Metro $950 $3,325 $5,325
Region 2: Willamette Valley/North Coast $570 $3,170 $6,000
Region 3: Southern Oregon/South Coast $800 $3,018 $4,300
Region 4: East of the Cascades $700 $2,950 $4,350
SOURCE: Oregon CBC Survey 2016: AFH, Table 8
The mean monthly charge for the 191 responding AFHs was $3,202. When comparing the average total monthly charges by the four regions in Oregon, the highest rates were found in the
Portland Metro area ($3,325), and the Willamette Valley/North Coast ($3,170).

Oregon Community-Based Care Chartbook, 2016: Adult Foster Homes Section 3 – Rates, Fees, and Medicaid Use
15
Figure 3.1 – Rate Structures Reported by AFHs
SOURCE: Oregon CBC Survey 2016: AFH, Figure 4
AFH providers structure their monthly rates in at least four different ways. Forty-six percent of homes charged each resident the same monthly rate, 21 percent charged a base rate plus additional fees based on services provided, 19 percent based the monthly rate on the resident’s care needs, and 13 percent negotiated with the resident (or payee) based on ability to pay.
46%
21%
19%
13%1%
Flat monthly rate Base rate plus fees
Monthly rate based on care needs Rate negotiated with resident
Other

Oregon Community-Based Care Chartbook, 2016: Adult Foster Homes Section 3 – Rates, Fees, and Medicaid Use
16
Figure 3.2 – Percent of Private-Pay Residents Paying by Type of Rate
SOURCE: Oregon CBC Survey 2016: AFH, Figure 5
While homes had different ways in which they charged residents for care and services, this affects the number and percentage of residents paying in these different ways.
Fifty percent of AFHs charged their residents a flat monthly fee. However, of current residents, only 18 percent lived in a home that charges a flat fee.
The majority of residents paid a base rate plus additional fees based on services provided
55%
18%
18%
9%1%
Base rate plus fees Flat monthly rate
Monthly rate based on care needs Rate negotiated with resident
Other

Oregon Community-Based Care Chartbook, 2016: Adult Foster Homes Section 3 – Rates, Fees, and Medicaid Use
17
Table 3.2 – Available Services and Additional Charges
Available
% (n) Charge % (n)
Night-time care 86% (171) 68% (116)
Advanced MC 68% (134) 72% (97)
Two- or more person transfer assist 68% (133) 72% (97)
Obesity care 41% (82) 46% (38)
Catheter/colostomy 76% (150) 77% (116)
Advanced diabetes care 81% (161) 70% (111)
Other 73% (30) 77% (24)
SOURCE: Oregon CBC Survey 2016: AFH, Table 9
The most commonly reported services for which an additional fee was charged included: catheter/colostomy or similar care (77 percent), advanced memory care (72 percent), two-person transfer assist (72 percent), advanced diabetes care (70 percent) and night-time care (68 percent).

Oregon Community-Based Care Chartbook, 2016: Adult Foster Homes Section 3 – Rates, Fees, and Medicaid Use
18
Figure 3.3 – Estimated Total Annual Charges for AFHs in Oregon
SOURCE: Oregon CBC Survey 2016: AFH, Figure 6
The total estimated charges were $171,391,409, of which 61 percent were private pay charges, 39 percent were for Medicaid services.
Medicaid services (total paid), $66,944,729
39%
Private Pay (estimate),
$104,446,680 61%
Medicaid services (total paid) Private Pay (estimate)

Oregon Community-Based Care Chartbook, 2016: Adult Foster Homes Section 3 – Rates, Fees, and Medicaid Use
19
Table 3.3 – Estimated Annual Profession Charges for Oregon AFHs
Estimated Monthly and Annual Profession Charges for Oregon CBC Settings
Questionnaire Respondent Facilities
Private Pay
Total current residents 1218
- Total current Medicaid beneficiaries 719
= Total of current private pay residents 499
x Average total monthly charge including services $3,266
= Total private pay charges $1,629,734
Other Facilities in Oregon (non-respondents)
Private Pay
Licensed capacity 6074
x Occupancy rate* 0.87
= Estimated total current residents 5284
x Estimated % of Medicaid residents** 0.59
= Estimated total Medicaid beneficiaries 3118
Estimated total current residents 5284
- Estimated total Medicaid beneficiaries 3118
= Estimated total private pay residents $ 2,166
x Average total monthly charge including services* $ 3,266
Total est. charges for private pay residents $7,074,156
Estimated Total Annual Private Pay Charges $104,446,680
Total Annual Medicaid Charges Paid (data from DHS) $66,944,729
Estimated Total Annual Industry Charges for All AFHs in Oregon $171,391,409
SOURCE: Oregon CBC Survey 2016: AFH, Table A2
With data from DHS on Medicaid expenditures paid in 2015 (including room and board charges) and data provided by respondents on the average monthly charge for single occupancy, we estimated the total annual private pay charges for AFHs in Oregon.
The calculation of industry charges was inspired by a similar calculation conducted using data from the national survey of residential care communities (Khatutsky et al., 2016).

Oregon Community-Based Care Chartbook, 2016: Adult Foster Homes Section 4 – Community Services and Policies
20
Section 4 – Community Services and Policies
Table 4.1 – Resident Needs and Behaviors that Prompt a Move-Out Notice
% (n)
Two-person transfer 27% (84)
Wandering outside 27% (84)
Sliding-scale insulin shots 5% (15)
Hitting/acting out towards residents/caregivers 69% (218)
Other 25% (79)
SOURCE: Oregon CBC Survey 2016: AFH, Table 10
Oregon rules (OAR 411-50) permit AFH operators to move out or transfer a resident for any of seven specified conditions, including medical reasons, behaviors that pose an imminent danger to the resident or others, and behaviors that interfere with the rights of other residents.
Sixty-nine percent of AFHs listed hitting others/acting in anger as a reason for a move-out notice.

Oregon Community-Based Care Chartbook, 2016: Adult Foster Homes Section 5 – Residents
21
Section 5 – Residents
Figure 5.1 – Age Distribution of AFH Residents
SOURCE: Oregon CBC Survey 2016: AFH, Figure 7
The majority of residents (60 percent) were aged 75 or older.
About 22 percent of residents were under 65 years of age. Ages ranged from 27 to 103 years old with an average of 77 years of age.
6%
16%
17%
18%
42%
18-49 50-64 65-74 75-84 85 and over

Oregon Community-Based Care Chartbook, 2016: Adult Foster Homes Section 5 – Residents
22
Table 5.1 – Gender, Marital Status, Age
% (n)
Gender
Male 34% (409)
Female 66% (808)
Transgender <1% (1)
Marital Status
Married 9% (110)
Living with spouse 25% (27)
Single 91% (1,108)
Age
18-49 6% (72)
50-64 16% (194)
65-74 17% (212)
75-84 18% (222)
85 and over 42% (512)
SOURCE: Oregon CBC Survey 2016: AFH, Table B2
Of the 1,218 residents who were living in the responding AFHs, 66 percent were female, , 91 percent single or un-partnered, and 42 percent were 85 years of age or older.

Oregon Community-Based Care Chartbook, 2016: Adult Foster Homes Section 5 – Residents
23
Table 5.2 – Race/Ethnicity3
% (n)
Hispanic 2% (20)
American Indian/Alaska Native 1% (14)
Asian 2% (24)
Black 2% (28)
Native Hawaiian/Pacific Islander <1% (5)
White 90% (1,097)
Two or more races 1% (15)
Other/unknown 1% (15)
Total 1,218
SOURCE: Oregon CBC Survey 2016: AFH, Table B3
The majority (90 percent) of residents were White, non-Hispanic.
Although the majority of residents in AFHs were White, non-Hispanic (90 percent), residents who were Hispanic of any race, Asian or Black each made up two percent of the resident sample (6 percent in total). All other racial or ethnic groups made up one percent or less of the resident sample.
3 According to data from the 2010 U.S. Census for Oregon, AFHs have a similar percentage of White residents (90 percent) as the population of adults over the
age of 65 in Oregon (89 percent) (U.S. Census Bureau, 2012). The rates of Asian and Black residents are also similar to the older adult population in Oregon with each at two percent.

Oregon Community-Based Care Chartbook, 2016: Adult Foster Homes Section 5 – Residents
24
Figure 5.2 – Resident Location Prior to Move-In
SOURCE: Oregon CBC Survey 2016: AFH, Figure 8
The largest percentage of residents moved into their current AFH from home (20 percent).
It was much less likely for residents to move in from memory care (2 percent), a hospital stay (7 percent), or from an independent living setting (8 percent).
20%
18%
16%
13%
13%
8%
7%
2%
2%
0.40%
0% 5% 10% 15% 20% 25%
Home
NF
AFH
AL/RC
Home of relative
Independent living
Hospital
MC
Other
Don't know

Oregon Community-Based Care Chartbook, 2016: Adult Foster Homes Section 5 – Residents
25
Figure 5.3 – Resident Move-Out Location
SOURCE: Oregon CBC Survey 2016: AFH, Figure 9
The majority of residents discharged in the prior 90 days died at the AFH (49 percent).
Among the residents who did not pass away in the home, most moved to another AFH (10 percent) or to their home in the community (8 percent).
49%
10%
8%
7%
5%
5%
4%
4%
3%
2%
2%
0% 5% 10% 15% 20% 25% 30% 35% 40% 45% 50%
Died
AFH
Home
Don't know
AL/RC
NF
Home of relative
MC
Hospital
Independent living
Other

Oregon Community-Based Care Chartbook, 2016: Adult Foster Homes Section 5 – Residents
26
Table 5.3 – Move-In and Move-Out Locations
Move-in
% (n) Move-out
% (n)
Home 20% (50) 8% (8)
Home of relative 13% (33) 4% (4)
Independent living 8% (21) 2% (2)
AL/RC 13% (33) 5% (5)
MC 2% (5) 4% (4)
Hospital 7% (18) 3% (3)
AFH 16% (40) 10% (10)
NF 18% (44) 5% (5)
Other 2% (5) 2% (2)
Died - 49% (48)
Don't know <1% (1) 7% (7)
Total 250 98
SOURCE: Oregon CBC Survey 2016: AFH, Table B4
This table provides more detailed information about move-in (Figure 5.2) and move-out (Figure 5.3) location for adult foster home residents in Oregon.

Oregon Community-Based Care Chartbook, 2016: Adult Foster Homes Section 5 – Residents
27
Figure 5.4 – Resident Length of Stay upon Move-Out
SOURCE: Oregon CBC Survey 2016: AFH, Figure 10
Most residents stayed for less than one year (62 percent).
Stays of 30 days or less accounted for about 12 percent of moves, and stays of 90 days or less accounted for 30 percent of all moves.
5%
2%
5%
18% 18%
14%15%
9%
15%
0%
2%
4%
6%
8%
10%
12%
14%
16%
18%
20%
1 - 7 days 8 - 13 days 14 - 30 days 31 - 90 days 3 - 6 months 6 - 12 months 1 - 2 years 2 - 4 years 4 or more years

Oregon Community-Based Care Chartbook, 2016: Adult Foster Homes Section 5 – Residents
28
Table 5.4 – Length-of-Stay
% (n)
1 - 7 days 5% (5)
8 - 13 days 2% (2)
14 - 30 days 5% (5)
31 - 90 days 18% (17)
3 - 6 months 18% (17)
6 - 12 months 14% (13)
1 - 2 years 15% (14)
2 - 4 years 9% (9)
4 or more years 15% (14)
Total 96
SOURCE: Oregon CBC Survey 2016: AFH, Table B5
This table provides more detailed information about length of stay (Figure 5.4) for adult foster home residents in Oregon.

Oregon Community-Based Care Chartbook, 2016: Adult Foster Homes Section 5 – Residents
29
Table 5.5 – Comparison of Residents’ Personal Care Needs
AFH
% AL/RC/MC
% National
%
Eating 24% 9% 20%
Transfer from bed/chair 43% 27% 30%
Dressing 59% 48% 47%
Bathing 82% 65% 62%
Using the bathroom 52% 39% 39%
Incontinence 60% 42% -
Getting around/mobility 47% 30% 29%
Mobility aid 77% 70% -
SOURCE: Oregon CBC Survey 2016: AFH, Table 11
Personal care needs in which more than half of residents required assistance include incontinence, dressing, and using the bathroom.
Seventy-seven percent of residents used a mobility aid to get around and 47 percent required staff assistance with mobility.

Oregon Community-Based Care Chartbook, 2016: Adult Foster Homes Section 5 – Residents
30
Table 5.6 – Chronic Conditions
% (n)
Alzheimer’s/dementia 49% (596)
Hypertension 45% (553)
Depression 40% (492)
Heart disease 39% (470)
Arthritis 38% (458)
Diabetes 22% (272)
Osteoporosis 16% (197)
Mental illness 15% (180)
COPD 15% (180)
Intellectual disability 9% (114)
Cancer 7% (84)
Drug and/or alcohol abuse 4% (48)
Total 1,218
SOURCE: Oregon CBC Survey 2016: AFH, Table 11
The five most common chronic conditions in AFHs were Alzheimer’s disease or other dementias (49 percent), hypertension (45 percent), depression (40 percent), heart disease (39 percent), and arthritis (38 percent).

Oregon Community-Based Care Chartbook, 2016: Adult Foster Homes Section 5 – Residents
31
Figure 5.6– Falls in Prior 90 days and Falls Resulting in Injury or Hospitalization
SOURCE: Oregon CBC Survey 2016: AFH, Figure 11 & Figure 12
The majority (85 percent) of residents had zero falls in the prior 90 days while 10 percent of residents had one fall and fiver percent had more than one fall.
Of the 15 percent of residents who had fallen in the prior 90 days, 67 percent had no injury resulting from the fall.
85%
10%
5%
0 falls One fall More than one fall
67%
20%
13%
No injury Injury Hospitalization

Oregon Community-Based Care Chartbook, 2016: Adult Foster Homes Section 5 – Residents
32
Table 5.7 – Health Service Use
% (n)
Treated in hospital ER 14% (170)
Discharged from overnight hospital stay 6% (76)
Received hospice care 10% (120)
SOURCE: Oregon CBC Survey 2016: AFH, Table B6
Of the total number of AFH residents, 14 percent had been treated in a hospital emergency department in the prior 90 days.
Six percent of residents had been discharged from an overnight hospital stay in the prior 90 days.

Oregon Community-Based Care Chartbook, 2016: Adult Foster Homes Section 5 – Residents
33
Table 5.8 – Medications and Treatments
% (n)
No medications/injections 2% (35)
Nine or more medications 54% (659)
Antipsychotic medications 34% (419)
Self-administer medications 5% (65)
Receive assistance for oral medications 80% (970)
Receive assistance with injection medications 11% (137)
Receive injections from a licensed nurse 2% (24)
Receive nurse treatment from a licensed nurse 8% (95)
Total 1,218
SOURCE: Oregon CBC Survey 2016: AFH, Table B7
Among Oregon AFH settings, 54 percent of residents were taking nine or more medications.
Antipsychotic medications were used by 34 percent of AFH residents.