Embed Size (px)
Citation preview

Communications Market Report: Wales
Research Document
Publication date: 1 August 2013


1
Introduction
This is Ofcom’s eighth annual review of the communications market in Wales. The report offers a detailed overview of communications services across the nation and monitors key trends in the availability and take-up of digital services across Wales.
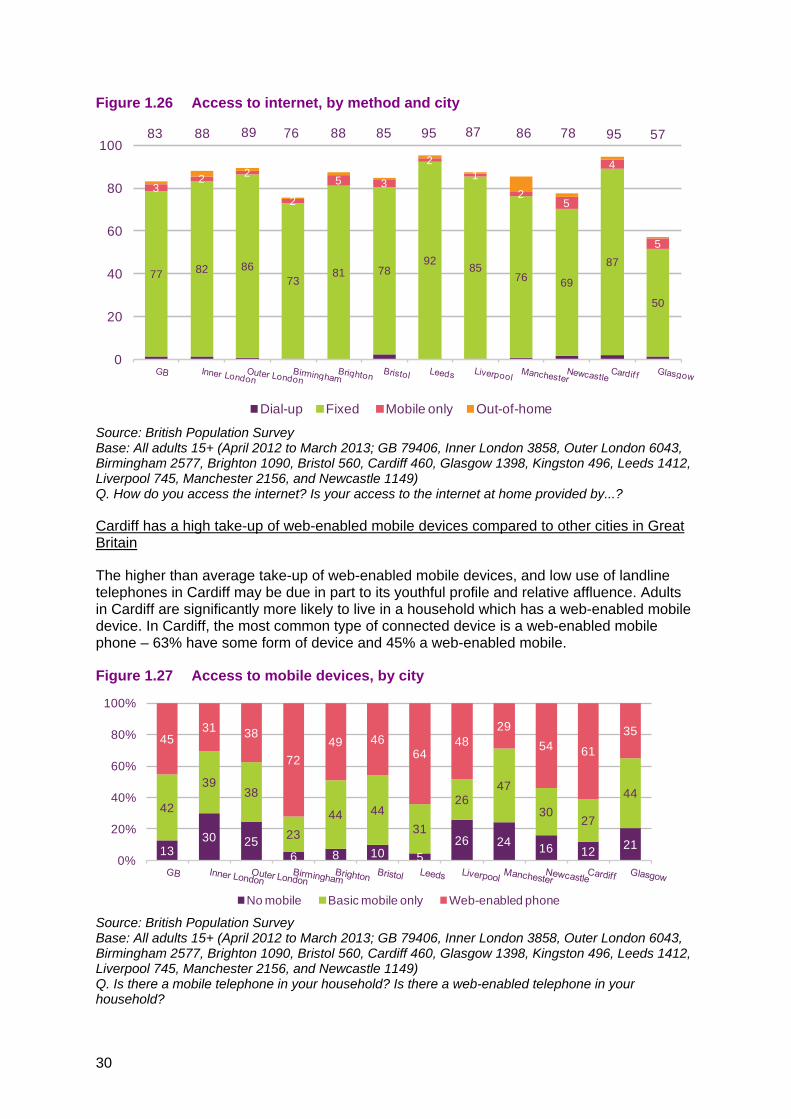
In 2012, total spend by the BBC and ITV1 on first-run originated TV programming for viewers in Wales decreased by 3% year on year to £26m. However, Wales increased its spend in 2012 on non-news/non-current affairs by 8% - the only proportional increase for this genre across the four nations. Conversely, year-on-year spending on news in Wales was down by 14%. Expenditure per head of population in Wales decreased by 3% year on year to £8.84 in 2012, and the number of first-run originated hours decreased by 6%; this is on par with the UK-wide average. S4C spent a total of £68m on first-run Welsh language programming in 2012, an 8% decrease on 2011 in nominal terms, and the total number of hours broadcast by S4C increased by 6.2%.
Three quarters (75%) of consumers in Wales now have access to the internet, either through a fixed broadband connection, a mobile broadband connection (i.e. dongle) or mobile phone. This represents a 2% year-on-year increase in internet take-up. Nine per cent of consumers in Wales access the internet exclusively through a mobile phone.
Over half of mobile users in Wales have a smartphone, a 12 percentage point increase on 2012. Wales continues to have the highest level of mobile-only households among the UK nations, with just under one in four households (23%) solely using mobile phones to make and receive calls in the home.
People living in Wales say they love sending and receiving post more than those in any other nation, but they are also more likely to have reduced, and say they will continue to reduce, the amount of post they send. Customers in Wales also have the highest levels of satisfaction with Royal Mail.
This year’s report explores findings from our research to understand use of and attitudes towards government services online (e-government) and consumers’ use of the internet to make purchases (e-retail) as well as users’ experience of mobile phone quality of service.
This is just a snapshot of this year’s report, highlighting the key stories of take-up and use of communications services in Wales. We are publishing the full data set and charts in a searchable resource, which can be found at www.ofcom.org.uk/cmrwales. Companion reports for the UK and each of the nations can be found at www.ofcom.org.uk/cmr.
We publish this report to support Ofcom’s regulatory goal to research markets constantly and to remain at the forefront of technological understanding. It also fulfils the requirements on Ofcom under Section 358 of the Communications Act 2003 (the Act) to publish an annual factual and statistical report, and addresses the requirement to undertake and make public our consumer research (as set out in Sections 14 and 15 of the Act).
The information set out in this report does not represent any proposal or conclusion by Ofcom in respect of the current or future definition of markets. Nor does it represent any proposal or conclusion about the assessment of significant market power for the purpose of the Communications Act 2003, the Competition Act 1998 or any other relevant legislation.

2
Contents Introduction 1
Key trends for Wales 3
Setting the scene 4
Key facts about Wales 4
1 Wales’ communications market 5
1.1 Key findings for Wales 5 1.2 Use of online services in Wales: e-government and e-retail 9 1.3 ‘Not-spots’ - users’ experience of mobile phone quality of service 17 1.4 Availability and take-up of communications services in Cardiff and
availability in Bangor 20
2 Television and audio-visual content 37
2.1 Recent developments in Wales 37 2.2 Digital television take-up in Wales 38 2.3 Smart TV and HDTV ownership 38 2.4 Broadcast television viewing 40 2.5 TV programming for viewers in Wales 44 2.6 PSB television quota compliance 48 2.7 Welsh language programming 50
3 Radio and audio content 53
3.1 Recent developments in Wales 53 3.2 Radio service availability 54 3.3 Community radio broadcasting 54 3.4 Patterns of listening to audio content 55 3.5 Digital radio set ownership and listening 57 3.6 The radio industry 59
4 Internet and web-based content 61
4.1 Internet take-up 61 4.2 Internet-enabled devices 61 4.3 Internet use 63
5 Telecoms and networks 65
5.1 Recent developments in Wales 65 5.2 Availability of fixed broadband services 65 5.3 Availability of mobile services 68 5.4 Service take-up 71 5.5 Satisfaction with telecoms services 77
6 Post 81
6.1 Sending and receiving post in Wales: residential customers 81 6.2 Attitudes towards Royal Mail 83 6.3 Sending and receiving post: business customers 84

3
Key trends for Wales
Rural areas lead the way with higher use of tablets…up 23 percentage points (pp) in the past year, bringing ownership in rural areas into line with the UK average (27% vs. 24% average). In comparison, and despite a 10pp rise, tablet ownership in urban areas is 19%; significantly lower than both rural Wales and the UK average.
…and greater use of mobile internet... Half of adults in Wales now own a smartphone, with the UK’s biggest rise in rural Wales (+15pp). Also in rural Wales, a rise in use of mobiles to access the internet; rising to 49% to equal the UK average.
…despite lower than average satisfaction with 3G network internet access (81% vs. 88%). And a fifth of mobile users say they have been unable to access the mobile internet at some point.
Dongle use declines…Two-thirds of households in Wales have home broadband access. The proportion with mobile broadband (using a dongle) declined to 7% over the past year.
…and Wales reports highest levels of ‘smartphone-only’ internet access... At 9%, this is more than twice the UK average (4%). This year, use of pre-pay services has declined (from 59% to 41%), at least partly due to the rise in smartphones.
...and the highest proportion of mobile-only households. Eight percentage points higher than the UK average, almost one in four (23%) households in Wales used only mobile phones to make and receive calls at home.
People in Wales spend more time watching TV than any other nation… around 4.5 hours each day. Six in ten (60%) report this as their most-missed media activity, significantly higher than the UK average, with comparatively fewer citing ‘mobile phone’ or ‘going online’.
…and two-fifths (38%) of broadband customers watch TV online. This is more popular on a weekly basis among broadband customers in urban (31%) than in rural (16%) areas.
Higher than average use of online government services (66%)…but users have less positive perceptions compared to the other nations. Fewer considered these services ‘more convenient’ or stated a preference for ‘online’. This is consistent with a higher stated preference for face-to-face communications with government services (34% vs. 19% average) in Wales.

4
Setting the scene
Key facts about Wales
Source: Office for National Statistics: Region and Country Profiles, Key Statistics – March 2013; Office for National Statistics: Family Spending 2012 edition; Office for National Statistics: 2011 Census, Key Statistics for Unitary Authorities in Wales
A note on our Technology Tracker survey research We conducted a face-to-face survey of 3,750 respondents aged 16+ in the UK, with 492 interviews conducted in Wales. Quotas were set and weighting applied to ensure that the sample was representative of the population of Wales in terms of age, gender, socio-economic group and geographic location. Fieldwork took place in January and February 2013.
Respondents were defined as urban if they lived in a settlement with a population of 2000 or more and rural if they lived in areas with smaller populations. The survey sample in Wales has error margins of approximately +/- 3-4% at the 95% confidence level. In urban and rural areas; survey error margins are approximately +/-4-6%.
In addition to the survey data, this report refers to information from a range of other sources, including data provided to Ofcom by stakeholders. Tables summarising the data collected in our survey are published on Ofcom’s website.
Figure Wales UK
Population 3.063m (mid-2011 estimate) 63.232m (mid-2011 estimate)
Age profile Population aged <16: 18.1%Population aged 65+:18.5%
Population aged <16: 18.2%Population aged 65+:16.1%
Population density 147 people per square kilometre 260 people per square kilometre
Language 18.6% of the population can speakWelsh
n/a
Unemployment 8.2% of the working age population 7.8% of the working age population
Income and expenditure Weekly household income: £598Weekly household expenditure: £398
Weekly household income: £699Weekly household expenditure: £470

5
1 Wales’ communications market 1 1.1 Key findings for Wales
Introduction
This section sets out a selection of the key facts and figures relating to communications markets across Wales in 2012, comparing and contrasting between nations and highlighting changes that have taken place in the past year.
Key findings for Wales
Use of online services
• In Wales, two-thirds of those with internet access use online government services, e.g. paying car tax, applying for benefits, completing the Census, applying for a bus pass, applying for a school place etc. Around half (53%) of users of the online services say they have engaged with government services or policies more since accessing them online.
• Sixty-two per cent of internet users in Wales say they shop online and 79% of online shoppers in Wales say they feel secure when paying online.
• Around three-quarters of online shoppers in Wales are confident that goods bought online will be delivered on time and in good condition. But among current online shoppers in Wales, around one-third had previously decided not to buy online before because of a concern regarding delivery; e.g. 19% mentioned concerns about high delivery costs.
‘Not-spots’ – users’ experience of mobile phone quality of service
• Slightly more mobile users in Wales experience problems than the UK average. Six in ten respondents in Wales had experienced at least one problem, compared with those in England and Scotland (52% and 51%).
• The ability to make or receive calls or texts is particularly important when choosing a provider, for people living in Wales. Mobile users living in Wales are significantly more likely than those in England or Scotland to say that the ability to make or receive calls or texts is the most important factor when choosing a provider.
TV and audio-visual content
• People in Wales spend 4.5 hours per day watching TV, the highest across all the nations.
• Spend on first-run originated content for viewers in Wales decreased by 3% year on year, slightly below the average UK decline of 4%.
• Total spend on non-news programming for people in Wales increased by 8% year on year..

6
• First-run originated hours in Wales have decreased by almost a quarter (24%) since 2007; the largest relative reduction in first-run originated nations’ output over the five-year period.
• Total cost per hour for nations’ programming decreased by 4% from 2007 for Wales – the lowest across the nations, compared to the UK average reduction of 24%.
• The volume of originated networked productions in Wales increased to 1.7% in 2012.
Radio and audio content
• More people in Wales listen to the radio than in any other nation. Radio services reached 93.1% of the adult population in Wales, the highest of all the UK nations and 3.5 percentage points higher than the UK average of 89.5%.
• BBC radio stations are more popular in Wales than in any other nation. In 2012, BBC radio stations accounted for 61% of all listening hours in Wales, a higher share for this sector than in any other UK nation.
• Ownership of DAB digital radios is significantly lower than the UK average. Just over one in four (27%) of those who listen to radio in Wales own a DAB digital radio, compared to the UK average of 41%. The proportion of listening through a digital platform in Wales grew by 1.9 percentage points in 2012, lower than any other UK nation.
• Commercial radio revenue per head of population was lowest in Wales. The commercial revenues generated by local commercial radio stations in Wales stood at £17.7m in 2012. Adjusting for population size, Wales has the lowest revenue per head of all the UK nations, despite a £0.10 increase on 2010.
Internet and web-based content
• One in ten (9%) consumers in Wales access the internet exclusively through a mobile phone, the highest proportion among the devolved nations and twice the UK average (4%). Across all access methods, three-quarters (75%) of consumers in Wales were online by Q1 2013.
• A third (35%) of those aged 16-34 say their smartphone is their most important device for internet access. This is likely to be a reflection of the one in five (20%) 16-34 year olds in Wales who access the internet exclusively on their smartphone, compared to the UK average of 9% for that age group.
• Internet users in Wales claim to spend significantly less time online than the UK average. According to research conducted for Ofcom’s Adult Media Literacy Report, internet users in Wales claimed to spend 13.6 hours on the internet per week, significantly less than the UK average of 16.8 hours.
Telecoms and networks
• Wales had the largest increase in the proportion of premises that are in postcodes served by NGA networks in the year to June 2013. In Wales this proportion was 48% in June 2013, and although this was the lowest figure among the

7
UK nations it was an 11 percentage point increase compared to the 37% figure recorded in June 2012, the largest increase recorded over the period.
• Take-up of fixed-line and broadband services are lower than average in Wales: Landline and overall broadband take-up were both below the UK averages for these services in Wales in Q1 2013. In Wales, 66% of households had a broadband connection during the period, nine percentage points lower than the UK average (75%), while fixed line take-up in Wales (76%) was eight percentage points lower than the UK average (84%).
• Wales has the highest proportion of mobile-only households among the UK nations: Just under one in four households in Wales (23%) solely used mobile phones to make and receive calls in the home in Q1 2013, a three percentage point increase compared to a year previously and eight percentage points higher than the UK average (15%).
• Over half of mobile users in Wales have a smartphone: Smartphone adoption continued to increase in Wales in the year to Q1 2013, when over half of mobile phone users (54%) had a smartphone, a 12 percentage point increase compared to Q1 2012. Mobile users in Wales had the second highest smartphone take-up among the UK nations, after England.
• Satisfaction with mobile services remains high in Wales: Overall satisfaction with mobile services was high in Wales in Q1 2013, when 94% of mobile users were either ‘very’ or ‘fairly’ satisfied with their service. Satisfaction with mobile reception was also high in Wales, at 86% of mobile users, although Wales had the lowest proportion of smartphone users who were satisfied with their ability to connect to the internet over 3G or 4G, at 81%.
Post
• Residents in Wales are more likely to say they love sending and receiving post. When asked about their attitudes to post, nearly two-thirds of adults in Wales say they love sending and receiving letters and cards (65%), higher than the UK average of 56%. However, this does not appear to be driven by sending mail, as people in Wales only send an average of 6.7 items each month compared to 8 items for people living in England.
• People in Wales are more likely to have reduced the amount of post they send and to expect this trend to continue. When asked about how the amount of post they send has changed in recent times, people in Wales are the most likely to say they now send less (-15% net). They also anticipate that they will reduce their use of post for sending letters, cards and parcels in the future (-16% net).
• People in Wales receive the most items of post and are more likely than the UK as a whole to have ordered goods to be delivered. When asked about the amount of post they have received in the past week, people in Wales claim to have received the highest number of items on average (10), especially when compared to residents in Scotland (4.8). This is perhaps due to the high propensity of people living in Wales to order items for delivery by post (76% in Wales vs. 69% across UK).
• Businesses in Wales are the least likely to have switched some mail to other communication methods in the past year. When asked if their organisation had moved some mail to another form of communication over the past 12 months, 61% of respondents in Wales said that they had, the lowest proportion of all the UK nations. Among those which had, businesses in Wales are more likely to say this is for better speed, rather than as a cost-saving exercise.

8
Figure 1.1 Fast facts for Wales
UK
Engl
and
Scot
land
Wal
es
Nor
ther
n Ire
land
UK
urb
an
UK
rura
l
Wal
es
urba
n
Wal
es
rura
l
TV take-up 97 97 97 98 98 97 98 98 98
Smart TV take-up among TV homes 7 8 4- 6 6 7 7 6 8
DAB ownership amongst radio listeners
41 +3
43 +3 29- 27- 24- 41 39 26- 31-
Catch-up TV viewing (on mobile or computer)* 27 28 18- 25 24 27 28 24 26
Broadband take-up 75 76 70- 66- 74 +5 74 82+
+5 64- 73
Mobile broadband take-up 5 5 7 7 5 6 4 7 8+
Use mobile to access internet 49 +10
49 +9
44-
+13 47 +8
45 +10
49 +10
48 +13 46 49
+19
Mobile phone take-up 92 92 92
+7 92 94 92 93 92 91
Smartphone take-up 51 +12
52 +12
45-
+13 49 +10
45-
+11 51 +12
51 +14
50 +9
48 +15
Fixed landline take-up 84 85 83 76- 82 83 91+ 74- 86
Tablet computer take-up 24 +13
24 +13
24 +13
21 +13
29+
+20 23 +12
29+
+18 19-
+10 27 +23
E-reader take-up (personal use) 16 +6
17 +7
14 +6
15
12-
+4 15 +4
21+
+6 14 18
Households taking bundles 60 +3 60 60
+13 50- 57 +6 59 64
+8 51- 46-
Fixed telephony availability 100 100 100 100 100
Fixed broadband availability1 99.98 100 99.86 100 100
LLU ADSL broadband availability2 94 +2
95 +2
87 +3
93 +5
85 +6
Virgin Media cable broadband availability3 48 51 38 22 28
BT Openreach / Kcom fibre broadband availability4 56 59 25 41 93
NGA broadband availability5 73 +8
76 +8
52 +7
48 +11 95
2G mobile availability6 99.6 99.8 99.3 98.8 98.5
3G mobile availability7 99.1 99.5 96.6 97.7 97.4
DTT availability8 98.5 98.6 98.7 97.8 97.4
TV consumption (hours per day) 4.0 4.0 4.3 4.5 4.1
Radio consumption (hours per day) 3.2 3.2 3.1 3.3 3.1
Key: +Figure is significantly higher than UK average; -Figure is significantly lower than UK average; +xx Figures has risen significantly by xx percentage points since Q1 2012

9
*Catch-up TV – due to wording change in 2013 questionnaire, data are not directly comparable to previous years Source: Ofcom research Q1 2013, BARB, RAJAR, industry data Base: All adults aged 16+ (n = 3750 UK, 2250 England, 501 Scotland, 492 Wales, 507 Northern Ireland, 1962 England urban, 288 England rural, 250 Scotland urban, 251 Scotland rural, 247 Wales urban, 245 Wales rural, 254 Northern Ireland urban, 253 Northern Ireland rural) 1. Proportion of premises able to receive ADSL broadband services based on data reported by BT 2. Proportion of homes connected to an LLU-enabled BT local exchange area, December 2012 3. Proportion of homes in postcodes served by Virgin Media’s cable broadband network, June 2013 4. Proportion of homes in postcodes served by BT Openreach/ KCom’s fibre broadband networks, June 2013 5. Proportion of homes in postcodes served by NGA networks, June 2013 6. Proportion of premises that have outdoor 2G mobile coverage from at least one operator, June 2013 7. Proportion of premises that have outdoor 3G mobile coverage from at least one operator 8. Estimated proportion of homes that can receive the PSB channels via DTT (3PSB Mux coverage). Joint TV planning project (Arqiva, BBC, Ofcom)
1.2 Use of online services in Wales: e-government and e-retail
Introduction
With more opportunities to carry out activities online that were once carried out only in person or by post, we decided to focus this section of the report on the use of government services online (‘e-government’) and consumers’ use of the internet to make purchases (‘e-retail’).
This section reports several pieces of relevant research. These include Ofcom’s ongoing Technology Tracker survey research (see Setting the scene for more details) and Ofcom’s Media Literacy tracker, which measures media literacy across the devolved nations of the UK among adults aged 16 and over 1. But much of the data comes from a bespoke piece of research on the use of, and attitudes towards, the internet for e-government and e-retail, conducted in March 2013 2. We comment only on those differences that are statistically significant.
In Wales, two-thirds of those with internet access have used online government services
Among those with internet access in Wales, 66% claimed to have used a government service online, e.g. paying car tax, applying for benefits, completing the Census, applying for a bus pas, applying for a school place, etc. (see Figure 1.2) 3. The proportion in Wales who said they had used online government services is similar to the proportion in the UK overall, but is significantly higher than in Northern Ireland.
1 The dataset reported here comprises results from fieldwork conducted by Saville Rossiter-Base in autumn 2012 among 236 adults in Scotland, 231 adults in Wales, and 213 adults in Northern Ireland. 2 The research involved 2971 UK adults, including 410 in Wales, in the face-to-face survey of UK residential consumers conducted in March 2013 by Kantar Media. Ofcom has collected data looking at similar areas in both the Technology Tracker and the Media Literacy research. The data reported here focus on use of governmennt services online and provide the respondent with 11 examples e.g. applying for a school place, completing the Census or applying for benefits. The Technology Tracker figures reported within this report in the Internet and web-based content section focus more simply on ‘using local council/government websites’. The Media Literacy research looks at finding information separately to completing transactions online through council/government websites. The differences in the question wording and also methodology result in a range of figures in this area.

10
Using online government services does not vary significantly between those with internet access living in urban (68%) and rural areas (63%) in Wales. Those in socio-economic groups ABC1 were more likely to have said they use online government services (78%) than those in C2DE (52%).
Figure 1.2 Proportion ‘ever’ using online government services, by nation
Source: Kantar Media Omnibus. Base: All with internet access. Internet access could be inside or outside the home, and be on a variety of devices. UK (2271) England (1325) Scotland (399) Wales (297) Northern Ireland (250). Question: Q.8 Nowadays, many government services are available online. Some examples of these services include <Examples> Do you ever use government online services?
In Wales, about one-third of adults said their preferred method for completing government processes was through a website or by email
Ofcom’s Media Literacy study identifies preferences for different e-government services. Across all the nations, relatively few adults said their preferred method of contact with the local council (e.g. about refuse collection) was through a website or by email (see Figure 1.3). The majority of adults said they preferred to contact their local council about this type of issue by making either a mobile or landline telephone call.
However, when asked about their preferred method of contact for completing tasks such as renewing a driving licence, car tax of passport online, etc., they preferred to do the task through a website or by email. In Wales, around a third (32%) of adults said their preferred method for completing government processes was through a website, although a similar proportion (34%) said they would prefer to meet in person to do this.
61% 62%57%
66%
48%
UK England Scotland Wales Northern Ireland
% That use services

11
Figure 1.3 Preferred method of contact with local council and for government processes, by nation
Source: Ofcom research, fieldwork carried out by Saville Rossiter-Base in September to November 2012. Base: All adults aged 16+ (1805 UK, 1125 England, 236 Scotland, 231 Wales, 213 Northern Ireland). Significance testing shows any difference between any nation and the UK. NZ2A-E. Please use this list to say which one way you would prefer to make contact for a few different reasons that I’ll read out. (Prompted responses, single coded)
In Wales, 69% of all adults with internet access said they would feel confident using government services online (see Figure 1.4). Around eight in ten of those who used government services online in Wales said that they were ‘more convenient’ (78%) and ‘save time’ (80%). In addition, around half (53%) of users of the online services say they have engaged with government services or policies more since accessing them online. Attitudes towards using government services online are similar across the nations.
4
1
5
4
3
3
32
22
27
21
22
10
5
8
11
10
53
53
52
50
50
17
14
17
17
17
5
2
2
2
23
32
40
45
43
3
9
10
16
15
34
34
24
18
19
4
3
4
4
10
11
6
7
7
12
6
6
6
6
3
0% 20% 40% 60% 80% 100%
N Ireland
Wales
Scotland
England
UK
N Ireland
Wales
Scotland
England
UK
Text message Mobile phone call Home/ landline phone call Letter email/ website Meet in person Don't know
Contacting the local council to find out about refuse collection
Completing government processes such as registering for tax credits, renewing driving licence, car tax or passport, complete tax return

12
Figure 1.4 Attitude towards online government services, by nation
Source: Kantar Media Omnibus. Base: All with internet access: UK (2271), England (1325), Scotland (399), Wales (297), Northern Ireland (250). All ever used e-government services: the UK (1294), England (779), Scotland (217), Wales (187), Northern Ireland (109).Question: Q.9 Thinking about the kinds of services I have just shown you please tell me to what extent you agree or disagree with each of the following statements.
About three in five internet users in Wales say they shop online
In Wales, 62% of internet users claimed they shop online for goods, services, tickets etc; this is a similar proportion as claimed in the rest of the UK (see Figure 1.5). Those living in rural areas were more likely to say they shopped online (73%) than those in urban areas (59%), and those in socio-economic groups ABC1 (70%) were more likely to shop online than those in C2DE (53%).
Figure 1.5 Proportion of internet users shopping online, by nation
Source: Ofcom technology tracker research, Q1 2013.Base: Adults aged 16+ who use the internet at home or elsewhere 2013. % purchasing good/services/tickets etc online. (UK= 2918, England=1787, Scotland=394,Wales=361, Northern Ireland=376). QE5. Which, if any, of these do you use the internet for? Note figures in the chart below are not directly comparable to figures on internet from previous years due to changes in question wording.
Figure 1.6 shows the proportion of those shopping online through various devices that may be able to access the internet. In Wales, 57% of those with a tablet shop online using their
69%
83% 82%75%
62%58%
70%
84% 83%76%
62%58%
67%
84% 79%72%
64% 62%69%
78% 80%67%
61%
53%
64%
89%85% 81%
60% 61%
I would feel confident using these services
Online government services are more
convenient
Online government services save me time
I prefer to access government services
online
Online government services are well
designed
I engage with government services\
policies more since accessing them
UK England Scotland Wales Northern Ireland
% Agree strongly or slightly
Among all Among users of e-government services
32% 33%22%
37% 38%
30% 29% 43%25% 22%
62% 62% 65% 62% 60%
Uk England Scotland Wales Northern Ireland
Used in the past week Used less often

13
tablet, 55% of those with a desktop computer shop using this, 53% of those with a laptop or netbook shop online using this, while 32% of smartphone owners shop using their smartphone.
Figure 1.6 Proportion of people shopping online through devices, by nation
Source: Kantar Media Omnibus Base: All who have each device. Desktop: UK (913) England (567) Scotland (133) Wales (119) NI (94). Laptop/netbook: UK (1647) England (951) Scotland (303) Wales (211) NI (182). Tablet: UK (608) England (334) Scotland (113) Wales (79) NI (82). Smartphone: UK (1230) England (715) Scotland (213) Wales (157) NI (145). Bases are 75+ respondents. Question: Q.1A Which of these activities do you use your device for nowadays?
The items that internet shoppers in Wales had bought online most often in the past six months were: clothing or footwear (63%), physical multimedia products, e.g. books, CDs, DVDs (52%), hotel or holiday bookings (41%), cinema or theatre tickets (39%) insurance for cars /home /travel etc (38%), transport, e.g. train or plane tickets (35%), electrical devices e.g. TVs (33%), digital multimedia e.g. music or e-books (30%), furniture (25%), household devices, e.g. kettles (22%) and groceries or take-aways (22%).
When asked about their preferred method of contact for booking a holiday (e.g. mobile phone, landline phone, in person, email/website etc), adults across all nations were most likely to say that they would prefer contact via a website or email, or would like to meet in person. In Wales, 35% said they would prefer contact via a website or email, and 34% preferred to meet in person.
Around three-quarters of online shoppers in Wales feel secure when making online payments
In general, across the nations, around three-quarters of those shopping online felt secure when they were paying for products and services online (see Figure 1.7). Similarly, 79% of online shoppers in Wales said they felt secure when paying online.
51% 48% 47%
29%
50%46% 46%
28%
51%
43% 40%
28%
53%57% 55%
32%
54% 55%48%
35%
Laptop/Netbook Tablet Desktop Smartphone
UK England Scotland Wales Northern Ireland
Among owners of each device

14
Figure 1.7 Perceptions of security when shopping online, by nation
Source: Kantar Media Omnibus. Base: All who use online shopping in the UK (1221), England (689) Scotland (211) Wales (179) Northern Ireland (142). Question: Q.11A Generally, when ordering online how secure do you feel when paying for products or services online? Using a scale form 1-5, where 1 means not at all secure and 5 means very secure.
Online shoppers in Wales claim that their decisions about which website to buy from are influenced by several main factors: whether the site is well known or is a reputable brand (53%), the security of the site, e.g. secure payment options (42%), the website offering the product or service at the lowest price (38%), recommendations from friends, family and colleagues (35%) and the delivery options (27%). Although the frequency of mentions of these factors differ slightly across the nations, the five most important factors remain constant across all nations within the UK.
When online shoppers were asked how they decided which websites they would be happy to buy from, 40% of online shoppers in Wales said they would buy only from websites they had previously bought from (see Figure 1.8). Around half (48%) said they would tend to buy something from a website they had not used before, once they had made checks on the site. The remaining 12% said they would buy from a website they had not used before (without necessarily making any checks on it). Online shoppers in Wales and Northern Ireland were more likely than those in the UK overall to say they would buy only from websites they had bought from in the past; they were therefore more cautious about using websites that were new to them.
76% 77%70%
79%74%
Feel secure when paying for products or services online (rating 4 or 5)
UK England Scotland Wales Northern Ireland
% Feel secure

15
Figure 1.8 Online shoppers’ choice of websites for shopping, by nation
Source: Ofcom research, fieldwork carried out by Saville Rossiter-Base in September to November 2012. Base: All who say they shop online (1076 UK, 667 England, 151 Scotland, 139 Wales, 119 Northern Ireland) Significance testing shows any difference between any nation and the UK. IN33E– When you want to buy something online, which of the following statements most closely applies? (Prompted responses, single coded)
General views on the postal service are included elsewhere in the report, but here we report on online shoppers’ opinions on the delivery of goods purchased online. This is included here because the delivery of goods is part of the overall online shopping experience.
Around three-quarters of online shoppers in Wales are confident that goods bought online will be delivered on time and in good condition
Among those who shop online, confidence levels were similar across the nations that the goods would arrive on time and be in good condition. In Wales, 79% of online shoppers were confident in the delivery of goods bought online (see Figure 1.9)
25 2519
40 39
67 6773
4856
8 8 8 125
UK England Scotland Wales N Ireland
I would buy an itemfrom a website that Ihad never previouslybought from as longas it sold what Iwanted
I would buy an itemfrom a website that Ihad never previouslybought from, once Ihad made certainchecks and wassatisfied the websitewas trusthworthy
I only buy items fromwebsites that I havepreviously bought from

16
Figure 1.9 Confidence in delivery when shopping online, by nation
Source: Kantar Media Omnibus. Base: All who use online shopping in the UK (1221), England (689) Scotland (211) Wales (179) Northern Ireland (142). Q.11B Generally, when ordering online how confident are you that the goods will arrive on time and in good condition? Using a scale form 1-5, where 1 means not at all confident and 5 means very confident.
Around nine in ten (88%) online shoppers in Wales said they usually had their online purchases delivered to their home address, rather than to a work address, friends or family or to a store.
Online shoppers in Wales claimed that the factors which influenced their decision about which delivery method to use were: the price (free delivery 54% and cheapest delivery 38%), speed of delivery (29%), and the availability of order tracking 18%). Although the proportion of online shoppers who mentioned individual factors differed slightly between the nations, the four most important factors remained constant across all nations within the UK.
Among online shoppers in Wales, around one-third had not made a purchase before because of concerns regarding delivery
Even among those who said they now made purchases online, around two in five online shoppers (41%) in the UK said that delivery concerns had previously prevented them making an online purchase (see Figure 1.10). In Wales, 35% of online shoppers said that any concern had prevented them making a purchase before, and 19% mentioned concerns about high delivery costs in particular. Across the devolved nations, online shoppers in Northern Ireland had the most concerns, specifically regarding high costs of delivery and delivery not being available in their area.
79% 80%75% 79% 79%
Feel confident when ordering online that goods will arrive on time and in good condition (rating 4 or 5)
UKEnglandScotlandWalesNorthern Ireland
% Feel confident

17
Figure 1.10 Delivery concerns preventing online purchasing, by nation
Source: Kantar Media Omnibus. Base: All who use online shopping in the UK (1221), England (689) Scotland (211) Wales (179) Northern Ireland (142). Question: Q.14 Have delivery concerns ever prevented you from buying items online? If yes, which of the following reasons prevented you from shopping?
1.3 ‘Not-spots’ - users’ experience of mobile phone quality of service
Introduction
Ofcom is undertaking a programme of work to bring about improvements both in mobile phone coverage (whether it is possible to receive a mobile signal or not) and mobile phone reception (where although a signal may be present, it is not possible to connect or sustain a call or use data services).
As part of this work, we have commissioned research to understand the consumer experience. This research will help us understand the extent to which mobile phone reception issues affect consumers, and what type of problems are most prevalent and cause most concern. We also wanted to understand the impact of location on the consumer experience, including indoor and outdoor locations and while travelling.
We considered these specific issues:
• Being unable to make/connect a call (including if the phone shows ‘bars’ present)
• Poor sound quality / call breaks up
• Calls ending unexpectedly – not while travelling (when stationary or walking around)
• Calls ending unexpectedly – while travelling e.g. by road/rail
• Being unable to send a text message
• Text message does not arrive or arrives late
• Being unable to access or sustain access to mobile internet
• Being unable to send emails
41%
25%
11%6% 6%
3% 3%
42%
26%
13%
7%4% 3% 2%
37%
26%
7%2%
8%
2% 1%
35%
19%
8%5% 4% 3% 5%
54%
32%
9% 7%
24%
4% 2%
Any delivery concerns prevented
online shopping
Delivery costs too high
Not be at home to receive delivery
Item too valuable to send by post
Delivery not available in area
Did not want to use particular delivery
provider
Other
UKEnglandScotlandWalesNorthern Ireland
% mentioned each reason

18
Fieldwork was conducted in two waves using a face-to-face omnibus survey in November 2012. The total sample comprised 2,136 adults aged 16 and over. The research was conducted among a representative sample of UK consumers, and we also captured the experiences of specific sub-groups:
• the populations within each of the four nations
• those in urban and rural areas
• small business consumers (defined as those working within a business employing between one and ten employees)
• regular rail users
• regular road users
The research identified that a significant proportion of consumers were dissatisfied with certain aspects of their mobile service.
Mobile users in Wales experience more problems than the UK average
More mobile users in Wales reported problems than the UK average. Six in ten respondents in Wales had experienced at least one problem, higher than in England and Scotland (52% and 51%). In Northern Ireland, 75% of respondents reported having ever experienced problems with reception.
There is a known problem with road and rail coverage within Wales, but this did not show up in the research data, probably due to low sample sizes in these areas. Without specifically surveying those areas, or having a large enough sample to drill down in sufficient geographic detail, it was unlikely that these problems would be identified in this research.
Welsh consumers stated that ‘no signal’ is the problem they experience most (42%), followed by being unable to use the mobile internet (22%) and text messages arriving late or not at all (16%).

19
Figure 1.11 Mobile phone users who have ever experienced problems with reception
Source: Kantar Media omnibus, (14th – 20th November 2012) Base: All who use a mobile phone (N=1743/195/95/103) Q13: Thinking about your mobile reception with ... in the UK, do you ever experience any of the following issues?
The ability to make or receive calls or texts is particularly important for people living in Wales, and and for those in rural areas when choosing a provider
For consumers in each of the four nations, the ability to make or receive voice calls or text messages is one of the top two most important factors in choosing a mobile provider. Mobile users living in Wales and Northern Ireland are significantly more likely than those in England or Scotland to say that the ability to make or receive calls or texts is more important than cost.
Figure 1.12 Most important element when considering mobile provider
Source: Kantar Media omnibus, (14th – 20th November 2012) Base: All who use a mobile phone (N=2136/1743/195/95/103/1757/379) Q.10 And which is the ... important to you when thinking about your mobile operator? Most important.
52 51
60
75
32 31
42
59
15 1713
26
14 13 14
30
159
2225
12 12 11
34
12 1216
33
129 11
30
8 69
13
0
10
20
30
40
50
60
70
80
England Scotland Wales Northern Ireland
Any problem
No signal/ reception on phonePoor sound quality/ call breaks upCall ends unexpectedly
Unable to use mobile internet
Unable to make/connect a callText message does not arrive/ arrives lateUnable to send text messagesUnable to send/ receive emails
37 3734
5247
37
45
34 3538
2528
3530
8 7 8 6
14
8 67 7 8 96 7 97 8
52 4
84
0
10
20
30
40
50
60
Total England Scotland Wales Northern Ireland
Urban Rural
Ability to make/ receive calls
Cost of phone service\contract
Speed or reliability of internet
Handset - type and functionality
Quality of customer service

20
1.4 Availability and take-up of communications services in Cardiff and availability in Bangor
Introduction
In its 2013/14 Annual Plan, Ofcom committed to undertake further research into the effect of communications infrastructure availability on high-density areas, including cities and towns. We will combine the results of this work with the conclusions of our work on the availability of communications services in the nations, published on 16 May 20134, which looked primarily at the provision of communications services in rural areas. This information will contribute to our understanding of the needs of different parts of the UK regarding communications services, and to help us understand how the market has delivered, and the impact of public interventions. As part of this research, Ofcom commissioned 11 case studies of UK cities, to assess the availability of communications services and the factors driving this. The relevant cities are:
Wales: Cardiff, Bangor England: London, Birmingham, Manchester, Cambridge, Exeter Scotland: Glasgow, Inverness Northern Ireland: Belfast, Derry-Londonderry
The full report by Analysys Mason can be found on the Ofcom website,5 and a further overview of the findings is included in the UK Communications Market Report.
In parallel, we have also used data from the British Population Survey (BPS) to consider how take-up of telecommunications services varies in different cities across the UK. The methodology for this is described in more detail below.
The second phase of our research, which will be the subject of a separate report, will consist of six case studies of international cities, as well as a more detailed analysis of some of the projects identified in the first phase.
This section focuses on the availability and take-up of telecommunications services in the city of Cardiff, drawing on the key findings of Ofcom’s Infrastructure Report 2012 as well as our own analysis of BPS data. In addition, we present data from the Infrastructure Report 2012 in relation to the communications infrastructure in Bangor. It was not possible to obtain BPS data on Bangor.
Methodology The British Population Survey asks consumers about mobile and landline telephone, internet and fixed broadband, and comprises around 2,000 face-to-face, in-home interviews with adults (aged 15+) every week, allowing detailed regional and sub-demographic analysis. It covers Great Britain.
Using data from the British Population Survey (BPS) from April 2012 to March 2013, we analysed some of the largest UK cities – Inner and Outer London, Bristol and Brighton in the South, Birmingham, Leeds and Kingston-upon-Hull in the Midlands/Yorkshire; Liverpool, Manchester and Newcastle in the North and Glasgow and Cardiff in the nations. The relevant sample sizes can be found in the UK Communications Market Report.
4 http://stakeholders.ofcom.org.uk/market-data-research/market-data/economic-geography/ 5 http://stakeholders.ofcom.org.uk/binaries/research/cmr/cmr13/cities-report.pdf

21
The British Population Survey uses a different methodology to Ofcom’s Technology Tracker, in that quotas, and question wordings, are different. In addition, key statistics such as mobile and tablet take-up are household-based rather than per individual. As such, the two data sources should not be compared. The BPS data allow us to make comparisons between ownership in different cities in Great Britain. Key take-up data at an overall level for Wales should be taken from the Key Facts section of this report.
Cardiff
Summary of key findings
• All premises in Cardiff have access to basic broadband infrastructure, and the city has a higher than average take-up of broadband services.
• Next-generation access (NGA) broadband infrastructure is available to over 90% of premises in Cardiff.
• Ten per cent of premises in the city cannot connect to a service faster than 2Mbit/s, the minimum speed defined for basic broadband connectivity. This may be because the Cardiff city boundary incorporates a number of more rural areas, which can struggle to receive a reliable speed due to the length of copper loops in the access network.
• The existence of lines less than 2Mbit/s in Cardiff is mitigated in part by the ubiquitous 3G mobile coverage. But consumers appear at present to consider mobile broadband access as a complement to, rather than a substitute for, fixed broadband access.6
• Take-up of communications services in Cardiff may be skewed by its youthful demographic and relative affluence.
• In particular, the city has a higher than average take-up of web-enabled mobile devices, and lower than average use of landline telephones.
• Cardiff has a high number of WiFi hotspots, compared to the other cities assessed.
• Cardiff Council is investing £4m to provide wireless access in all city schools, and will also commit to providing wireless access free in all community hubs, youth centres and leisure centres. This will be in addition to the facilities already available in Council offices and libraries.
• Cardiff Council has developed an urban broadband plan for the city, which will benefit from funding from the super-connected cities project.
Cardiff has a population of 341,000, with residential premises accounting for 95% of all premises
Figure 1.13 shows the size of the city in terms of population and number of residential and non-residential premises. The population is based on the 2011 Census and the number of premises is based on postcodes within the local authority boundary. 6 Ofcom’s fuller provisional assessment of this matter is referred to in, for example, our Fixed Access Market Review consultation document at: http://stakeholders.ofcom.org.uk/binaries/consultations/fixed-access-market-reviews/summary/fixed-access-markets.pdf

22
Cardiff’s economy has developed rapidly over the past ten years. The main industries are financial and professional services, creative industries and life sciences. The city also has one of the highest levels of employment in the media sector outside London.7
Figure 1.13 City population and premises data
Source: Analysys Mason
For this study the city boundary is defined by Cardiff City Council, and is shown in detail in the following figure:
Figure 1.14 Map of Cardiff area, highlighting city boundary
Source: Analysys Mason
Next-generation access (NGA) is available to 92% of premises in Cardiff
Figure 1.15, identifies fixed network infrastructure for the two main operators, BT and Virgin Media. This includes the availability of both first-generation broadband (ADSL copper8 and DOCSIS cable technologies9) and NGA infrastructure (FTTx10 and DOCSIS v3.0 cable technologies11). Future NGA availability is predicted based on BT announcements for the upgrade of exchanges with NGA technology by 2015.
7 Source: Analysys Mason 8 Asymmetric digital subscriber line (ADSL) is a technology for transmitting digital information over existing copper telephone lines, which allows users to connect to the internet. 9 Data over cable service interface specification (DOCSIS) is an international telecommunications standard that is employed by many cable operators to provide internet access over their existing infrastructure. 10 Fibre to the x (FTTx) is a generic term used to describe any broadband network using optical fibre to replace all or part of the usual metal local loop used for last-mile telecommunications. 11 DOCSIS v3.0 is the next generation of DOCSIS, which allows users to experience significantly faster speeds.
City Population Total premises Business premises
Residential premises
Cardif f c.341,000 c.152,000 c.8000 c.144,000

23
The BT NGA network is currently available to around 78% of premises in Cardiff. This will increase slightly to 84% as BT upgrades its exchanges in accordance with current plans. Virgin Media’s network is available to around 68% of premises in Cardiff, and, on the basis of what Virgin Media has declared its intentions to be, this figure is unlikely to change by 2015. Current total availability is 14 percentage points higher (at 92%) than the BT-only figures, suggesting that there is substantial overlap of the two operator networks (i.e. the majority of premises that have access to Virgin Media’s network also have access to BT’s network). Predicted future total availability increases by just 1%, to 93%, suggesting that BT will extend its NGA network to many premises that already have access to the cable network.
In relation to the other 11 cities which we examine in detail in the UK Communications Market Report, Cardiff’s NGA availability is 21% more than the city average.
Although the availability of first-generation broadband is 100%, some premises experience broadband speeds of less than 2Mbit/s, which is considered below the minimum requirement for a basic broadband service.
Figure 1.15 Fixed network infrastructure availability: premises passed
Source: Analysys Mason, Ofcom Infrastructure Report 2012
Figure 1.16 shows the proportion of lines with a speed of less than 2 Mbit/s. Ten per cent of lines in Cardiff lines have speeds less than 2Mbit/s; this is 4.5% higher than the average across all the cities assessed.
100%
68%
100%78%
68%
92%84%68%
93%
0%
20%
40%
60%
80%
100%
BT Virgin Media Total
First-generation broadband
NGA (current)
NGA (future)
Proportion of premises passed

24
Figure 1.16 Percentage of lines with speeds less than 2Mbit/s, and relative positioning
Source: Analysys Mason, Ofcom Infrastructure Report 2012
Cardiff has 14 exchanges, ten of which have been upgraded to NGA
Figure 1.17 shows the number of exchanges serving the city postcodes, the percentage of lines that support both ADSL and ADSL Max12, and the average number of lines per exchange.13 Note that not all of these exchanges are physically located within the city boundary. All of the copper lines support basic broadband (both ADSL and ADSL Max).
Figure 1.17 Number of exchanges and % of lines with access to basic broadband
Source: Analysys Mason
The BT fibre network comprises fibre to the cabinet (FTTC) and fibre to the home (FTTH) infrastructure. Figure 1.18 shows the FTTC status of the city exchanges according to BT’s current roll-out plans, compared to the other cities assessed.
12 ADSL Max is a ‘rate-adaptive’ variant of ADSL, where the transmitted bit rate varies depending on the physical conditions of the twisted-pair copper line, which may change over time. In contrast, the bit rate for ADSL is fixed and does not change. 13 Source: Analysys Mason
10.0%
5.5%
10.0%
0%
2%
4%
6%
8%
10%
12%
% Cardiff lines <2Mbit/s Average for 11 cities Average for UK
No. of exchanges serving city postcodes
% of lines that have access to both ADSL & ADSL Max
Average number of lines per exchange
14 100% 10,800

25
Figure 1.18 FTTC status of exchanges serving city postcodes, according to BT’s roll-out plans
Source: Analysys Mason
To date, ten of the serving exchanges (71% of total serving exchanges) have been upgraded to FTTC14. BT plans to upgrade three serving exchanges to FTTC by 2015. Therefore, if BT’s upgrade plans are implemented, 13 BT exchanges (93% of total exchanges) will serve the city with FTTC technology by 2015.
Nine operators offer NGA services in Cardiff
In addition to the two main operators which own fibre network infrastructure (BT and Virgin Media), a number of alternative operators have their own fibre network infrastructures, or at least a point of presence (i.e. an interconnection with another communications provider) in the city. Alternative operators tend to focus on providing services to larger business customers.
Seven alternative operators have been identified as having, as part of their national networks, a point of presence in the city: Easynet, SSE, Surf Telecom, TalkTalk, Virgin Media business, Vodafone and Vtesse.15
Cardiff has 240 WiFi hotspots, equivalent to 7.1 hotspots per 10,000 residents
Figure 1.19 shows key WiFi hotspot data for Cardiff. The largest providers of WiFi infrastructure in UK cities are currently BT (branded as BT Openzone) and The Cloud, which is owned by BSkyB. Each operator owns a mix of outdoor and indoor WiFi access points. Other private and public organisations own hotspots, but they tend to make a small contribution to a city total. We have therefore used the total hotspots for BT and The Cloud to derive a city benchmark16. Cardiff has 14% more hotspots per 10,000 city residents than the average across the cities analysed.
14 Note that only a proportion of the cabinets which connect to the upgraded exchanges have been upgraded. Although data are not available on the actual number of cabinets upgraded across the city, BT has stated that for the national FTTC roll-out, on average of 85% of premises are passed with NGA, which equates to an average 70% of cabinets per exchange area. 15 Source: Analysys Mason 16 There is, in general, a good correlation between number of hotspots and number of city residents, therefore that ratio forms a suitable benchmark for comparing WiFi availability between cities
0%
20%
40%
60%
80%
100%
Other in-plan exchanges
Already upgraded exchanges

26
Figure 1.19 Key city hotspot data
Source: Analysys Mason
3G services are available through at least four operators across more than 98% of Cardiff
Figure 1.20 shows the proportion of premises that are covered by 3G networks, compared to the average across the other cities assessed, and the UK as a whole. At the time of writing EE was the only operator providing 4G coverage in Cardiff 17.
Figure 1.20 3G mobile coverage in city
Source: Analysys Mason, Ofcom Infrastructure Report 2012
Ninety-six per cent of premises in Cardiff have a choice of four or more fixed-line telecoms providers. Ofcom assigns a classification code to each exchange, which indicates how many operators have a presence in that exchange. These are typically local loop unbundling operators offering first-generation broadband wholesale services. The classifications are:
• a classification of 3 means 4 or more operators (including BT) are present
• a classification of 2 means 2 or 3 operators (including BT) are present
• a classification of 1 means BT is the only operator present.
Figure 1.21 shows the proportion of Cardiff exchanges with each market classification:
Figure 1.21 Key city exchange data
Source: Analysys Mason
17 Source: Analysys Mason
City total Total hotspots per 10,000 city residents (city benchmark)
Total hotspots per 10,000 city residents (11 city average)
Percentage difference from 11 city average
240 7.1 6.2 +14%
% of premises with 3G signal from 4 operators (city benchmark)
% of premises with 3G signal from 4 operators (11 city average)
% of premises with 3G signal from 4 operators (UK average)
Percentage difference from 11 city average
98.6% 95.7% 77.3% +2.9%
Ofcom classification % of total exchanges % of premises passed
3 71.4% 96%
2 21.4% 4%
1 7.1% 0%

27
Seventy-one per cent of exchanges are classification 3, and together they provide 96% of lines. Virgin Media also has a presence in 86% of exchange areas18. The number of operators present in an exchange is generally a good indicator of the degree of competition, and these findings suggest that there is a high level of competition in the provision of first-generation broadband services across Cardiff.19
An equivalent, or similar classification, for SFBB is not yet established (although communications providers are currently using the generic Ethernet access product from BT Wholesale to provide retail superfast services).
Including superfast broadband, the average maximum modem sync speed for Cardiff is 34.4 Mbit/s
Figure 1.22 compares the average maximum modem sync speed for basic broadband lines, and for all lines, (including basic and SFBB). The speed values are also compared to the city average. Note that the result for all lines (including SFBB lines) is for illustrative purposes only, as we have assumed all superfast lines to be 40Mbit/s.
Figure 1.22 Average maximum modem sync speed compared to other cities
Source: Analysys Mason, Ofcom Infrastructure Report 2012
Cardiff Council has developed an urban broadband plan for the city, which will benefit from funding from the super-connected cities project
Cardiff Council recently obtained £11m in UK government funding for its super-connected cities project; the funds will help the Council deliver its Urban Broadband Plan. The original scope of the project involved the deployment of fibre to street cabinets, and the installation of wireless hotspots across the city. The project also intended to provide 100% superfast 4G mobile phone technology coverage, WiFi in high-footfall areas, and wireless infrastructure at two council-owned housing developments in the city. £600,000 is already being spent on wireless internet at bus shelters and on buses. As with many super-connected city projects, the scope is being modified to focus on wireless-concession projects and voucher schemes for small and medium-sized enterprises.
Cardiff Council recently established Digital Cardiff which has a remit to support a self-sustaining digital media, technology and creative super-cluster in Cardiff, to cover a range of activities including business, culture, entertainment, education and community services.
18 Source: Analysys Mason 19 This does not represent Ofcom’s assessment of competition for the purpose of any market analysis under the Competition Act 2003. Ofcom has recently published a consultation document on our current review of the wholesale broadband access market (see: http://stakeholders.ofcom.org.uk/binaries/consultations/review-wba-markets/summary/WBA_July_2013.pdf)
Excluding SFBB lines Including SFBB lines
Average maximum speed (Mbit/s)
City average (Mbit/s)
% dif ference f rom city average
Average maximum speed (Mbit/s)
City average (Mbit/s)
UK average (Mbit/s)
% dif ference f rom city average
12.3 14.1 -13% 34.4 29.9 12.7 +15%

28
Cardiff has a significantly younger age profile than Great Britain as a whole
To understand some of the differences in take-up of communications services, it is helpful to look at the demographic profiles of GB cities. Cardiff has a much younger age profile than Great Britain as a whole; 28% of the sample are under 25 and 52% are under 35. This can be partially explained by the high student population in Cardiff (20% of the Cardiff sample were students).
Figure 1.23 City profile, by age
Source: British Population Survey Base: All adults 15+ (April 2012 to March 2013; GB 79406, Inner London 3858, Outer London 6043, Birmingham 2577, Brighton 1090, Bristol 560, Cardiff 460, Glasgow 1398, Leeds 1412, Liverpool 745, Manchester 2156, and Newcastle 1149) Q. How old are you?
Cardiff has the most affluent socio-economic profile, with 76% of adults in socio-economic group ABC1, compared to 54% for Great Britain as a whole.
Figure 1.24 City profile, by socio-economic group
Source: British Population Survey Base: All adults 15+ (April 2012 to March 2013; GB 79406, Inner London 3858, Outer London 6043, Birmingham 2577, Brighton 1090, Bristol 560, Cardiff 460, Glasgow 1398, Leeds 1412, Liverpool 745, Manchester 2156, and Newcastle 1149) Q.Derived from questions about employment and job title.
207 12 9
23 2110 17
6 10 8 14
31
2228
17
33 35
2330
15 14 17
29
17
22
22
19
18 20
15
14
13 9 15
13
16
3016
27
15 14
24
18
22 1722
22
16 20 22 2812 11
28 21
44 5038
22
0%
20%
40%
60%
80%
100%
15-24
25-34
35-44
45-64
65+
24 2816
58
4
2717
51
624
14
44
2225
26
18
31
18
8
20
7
1619
2028
31
26
15
4917
40
22
55
44 61
25
2617
32
9 16
39 36
8
3216
7 12
0%
20%
40%
60%
80%
100%
AB
C1
C2
DE

29
Cardiff has the lowest use of landline telephones
In order to have fixed broadband, it is necessary to have a landline. The BPS is likely to understate the true number of landlines as it focuses on those people who have a landline ‘telephone’ – i.e. a device to make and/or receive calls, rather than a line capable of receiving a broadband connection. Therefore anyone with fixed broadband, or who says they have a landline ‘telephone’ in the household is classed as having a fixed connection.
On this assumption, adults in Cardiff are significantly less likely than those in other GB cities to use their landline as a phone connection. The higher than average take-up of web-enabled mobile devices, and the low use of landline telephones in Cardiff, may be due in part to its youthful profile, as 28% of the Cardiff sample is under 25 and Ofcom research suggests that this age group is the least likely to use landline telephony.
Figure 1.25 Access to landline, by city
Source: British Population Survey Base: All adults 15+ (April 2012 to March 2013; GB 79406, Inner London 3858, Outer London 6043, Birmingham 2577, Brighton 1090, Bristol 560, Cardiff 460, Glasgow 1398, Kingston 496, Leeds 1412, Liverpool 745, Manchester 2156, and Newcastle 1149) Q. Is there a landline telephone in your household? How do you access the internet?
Over nine in ten adults in Cardiff have access to the internet, mainly through fixed broadband
Cardiff has a significantly higher percentage of individuals accessing the internet, by any means, than the majority of other cities and Great Britain as a whole.
5 4 2 56 5 3 5 5 7 47 7 13
61914 10 8
21 13 114
3 1314
3
2517 27 26
8 16 1651
7538 27
39
18
62 56 61 65 65 64
41
11
39 44 5034
0%
20%
40%
60%
80%
100%Landline telephone and internet
Internet only
Landline telephone
Mobile only
30
Figure 1.26 Access to internet, by method and city
Source: British Population Survey Base: All adults 15+ (April 2012 to March 2013; GB 79406, Inner London 3858, Outer London 6043, Birmingham 2577, Brighton 1090, Bristol 560, Cardiff 460, Glasgow 1398, Kingston 496, Leeds 1412, Liverpool 745, Manchester 2156, and Newcastle 1149) Q. How do you access the internet? Is your access to the internet at home provided by...?
Cardiff has a high take-up of web-enabled mobile devices compared to other cities in Great Britain
The higher than average take-up of web-enabled mobile devices, and low use of landline telephones in Cardiff may be due in part to its youthful profile and relative affluence. Adults in Cardiff are significantly more likely to live in a household which has a web-enabled mobile device. In Cardiff, the most common type of connected device is a web-enabled mobile phone – 63% have some form of device and 45% a web-enabled mobile.
Figure 1.27 Access to mobile devices, by city
Source: British Population Survey Base: All adults 15+ (April 2012 to March 2013; GB 79406, Inner London 3858, Outer London 6043, Birmingham 2577, Brighton 1090, Bristol 560, Cardiff 460, Glasgow 1398, Kingston 496, Leeds 1412, Liverpool 745, Manchester 2156, and Newcastle 1149) Q. Is there a mobile telephone in your household? Is there a web-enabled telephone in your household?
77 82 8673
81 7892 85
76 69
87
50
32 2
2
5 3
21
25
4
5
0
20
40
60
80
100
Dial-up Fixed Mobile only Out-of-home
83 88 578589 88 9595 8687 7876
1330 25
6 8 10 526 24 16 12 21
42
3938
2344 44
31
2647
3027
44
4531 38
7249 46
6448
2954 61
35
0%
20%
40%
60%
80%
100%
No mobile Basic mobile only Web-enabled phone

31
Access to cable TV is significantly higher in Cardiff than in other cities in Great Britain
As cable roll-out is mainly focused in urban areas, it is not surprising that access to cable TV is higher in many cities than across Great Britain as a whole. Cardiff, in particular, has high take-up of cable TV.
Figure 1.28 TV platform, by city
Source: British Population Survey Base: All adults 15+ (April 2012 to March 2013; GB 79406, Inner London 3858, Outer London 6043, Birmingham 2577, Brighton 1090, Bristol 560, Cardiff 460, Glasgow 1398, Kingston 496, Leeds 1412, Liverpool 745, Manchester 2156, and Newcastle 1149) Q. Does your household have satellite /cable TV?
Bangor
Summary of key findings
• The availability of communications services in Bangor may be affected by the fact that it is a relatively small city.
• While the city has reasonably high NGA availability, Virgin Media does not provide coverage in the city, and a significant minority of premises are served by fewer than four mobile operators.
• Bangor is particularly well-served in terms of WiFi hotspot density, compared to the other cities assessed.
• The city has benefited from several cases of public intervention. For example, Bangor recently had its only serving exchange upgraded with the support of a public subsidy from the Superfast Cymru project.
• Bangor also benefits from the Welsh government’s Broadband Support Scheme, which provides up to £1000 for individuals or businesses with slow broadband access to secure a better connection.
4659
4323
5141 39
59 5846 42
55
3735
3754
2018 19
19 2933
23
29
156
19 21 2838 40
20 10 1933
151 1 1 3 1 3 2 2 3 2 2 1
0%
20%
40%
60%
80%
100%
Neither Satellite TV Cable TV Both

32
Bangor has a population of 14,800, with residential premises accounting for 92% of all premises
Figure 1.29 shows the size of the city in terms of population and number of residential and non-residential premises. The population is based on the 2011 census and the number of premises is based on postcodes within the local authority boundary. Bangor’s small economy is dominated, through its university, by education.
Figure 1.29 City population and premises data
Source: Analysys Mason
For this study the city boundary is defined by the combination of appropriate Lower Super Output Areas (LSOA), published by the Office for National Statistics, for areas of contiguous urban density, which are shown in detail in the following figure:
Figure 1.30 Map of area local to Bangor, highlighting city boundary
Source: Analysys Mason
Next-generation access is available to 85% of premises in Bangor
Figure 1.31 identifies fixed network infrastructure for the two main operators, BT and Virgin Media. This includes the availability of both first-generation broadband (ADSL copper and DOCSIS cable technologies) and NGA infrastructure (FTTx and DOCSIS v3.0 cable technologies). Future NGA availability is predicted based on BT announcements for the upgrade of exchanges with NGA technology by 2015.
The BT NGA network is currently available to around 85% of city premises: these are all served by just one exchange, which has been upgraded. This figure will only change in the future as BT upgrades more cabinets attached to the city’s only serving exchange. Virgin Media does not provide service to any premises in the city, and, based on its declared intentions, this is unlikely to change by 2015. On that basis, in future, around 85% of premises across the city will have access to NGA infrastructure, and this will be provided by BT alone.
City Population Total premises Business premises
Residential premises
Bangor c.14,800 c.6000 c.500 c.5500

33
In relation to the 11 other cities that we examine in detail in the UK Communications Market Report, Bangor’s NGA availability is 14% more than the average for these cities.
Although the availability of first-generation broadband is 100%, some premises experience broadband speeds of less than 2Mbit/s, which is considered below the minimum requirement for a basic broadband service.
Figure 1.31 Fixed network infrastructure availability: premises passed
Source: Analysys Mason, Ofcom Infrastructure Report 2012
Figure 1.32 shows the proportion of lines with a speed of less than 2 Mbit/s; in Bangor, this figure is 6.5%.
Figure 1.32 Percentage of lines with speeds less than 2Mbit/s, and relative positioning
Source: Analysys Mason, Ofcom Infrastructure Report 2012
Bangor only has one copper exchange, which supports 6,000 lines, and has been upgraded to NGA
All of the copper lines support basic broadband (both ADSL and ADSL Max) 20.
Four operators offer NGA services in Bangor
In addition to the two main operators that own fibre network infrastructure (BT and Virgin Media), a number of alternative operators have their own fibre network infrastructures, or at least a point of presence (i.e. an interconnection with another communications provider), in the city. Alternative operators tend to focus on providing services to larger business customers.
20 Source: Analysys Mason.
Operator First-generation broadband
NGA (current) NGA (future)
BT 100% 85% 85%
Virgin Media 0% 0% 0%
Total 100% 85% 85%
6.5% 5.5%
10.0%
0%
2%
4%
6%
8%
10%
12%
% lines <2Mbit/s Average for 11 cities Average for UK

34
Two alternative operators have been identified as having, as part of their national networks, a point of presence in Bangor: Fibrespeed and Vodafone (proximity) 21.
Bangor has 21 WiFi hotspots, equivalent to 14.1 hotspots per 10,000 residents
Figure 1.33 shows key WiFi hotspot data for Bangor. The largest providers of WiFi infrastructure in UK cities are currently BT (branded as BT Openzone) and The Cloud, which is owned by BSkyB. Each operator owns a mix of outdoor and indoor WiFi access points. Other private and public organisations own hotspots, but they tend to make only a small contribution to a city total. We have therefore used the total hotspots for BT and The Cloud to derive a city benchmark22. Bangor has 129% more hotspots per 10,000 city residents than the cities average.
Figure 1.33 Key city hotspot data
Source: Analysys Mason
Around three-quarters of premises in Bangor receive 3G coverage from four operators
Figure 1.34 shows the proportion of premises that are covered by 3G networks, compared to the average across the other cities assessed and the UK as a whole. At the time of writing, no operators are currently providing 4G coverage in Bangor.
Figure 1.34 3G mobile coverage in Bangor
Source: Analysys Mason, Ofcom Infrastructure Report 2012
All premises in Bangor have a choice of two or three fixed-line telecoms providers
Ofcom assigns a classification code to each exchange, which is an indicator of the level of local competition in the provision of communications services, as it shows how many operators have a presence in that exchange. These are typically local loop unbundling operators offering first-generation broadband wholesale services. The classifications are:
• a classification of 3 means 4 or more operators (including BT) are present
21 Source: Analysys Mason 22 There is in general a good correlation between the number of hotspots and the number of city residents, therefore that ratio forms a suitable benchmark for comparing WiFi availability between cities.
City total Total hotspots per 10,000 city residents (city benchmark)
Total hotspots per 10,000 city residents (11 city average)
Percentage difference from 11 city average
21 14.1 6.2 +129%
% of premises with 3G signal from 4 operators (city benchmark)
% of premises with 3G signal from 3 operators (city benchmark)
% of premises with 3G signal from 4 operators (11 city average)
% of premises with 3G signal from 4 operators (UK average)
Percentage difference from 11 city average
76% 22.2% 95.7% 77.3% -19.7%

35
• a classification of 2 means 2 or 3 operators (including BT) are present
• a classification of 1 means BT is the only operator present.
Figure 1.35 shows the proportion of Bangor exchanges with each market classification:
Figure 1.35 Key city exchange data
Source: Analysys Mason
The only exchange serving the city is rated as classification 2. Furthermore, Virgin Media does not have a presence in any of the exchange areas23. These findings suggest that there is limited competition in the provision of first-generation broadband services in Bangor24.
An equivalent, or similar classification, for SFBB is not yet established (although communications providers are currently using the generic Ethernet access product from BT Wholesale to provide retail superfast services).
Including superfast broadband, the average maximum modem sync speed for Bangor is 15.9Mbit/s
Figure 1.36 compares the average maximum modem sync speed for j basic broadband lines, and for all lines, including basic and SFBB. The speed values are also compared to the other cities. Note that the result for all lines (including SFBB lines) is for illustrative purposes only, as we have assumed all superfast lines to be 40Mbit/s.
Figure 1.36 Average maximum modem sync speed compared to other cities
Source: Analysys Mason, Ofcom Infrastructure Report 2012
The average maximum modem sync speed for basic broadband lines across the city is greater than the average by 13%.The average maximum modem speed for all broadband lines across the city is less than the average, by 47%.
23 Source: Analysys Mason 24 Again, this is not an assessment of competition for the purpose of a market analysis under the Competition Act 2003.
Ofcom classification % of total exchanges % of premises passed
3 0% 0%
2 100% 100%
1 0% 0%
Excluding SFBB lines Including SFBB lines
Average maximum speed (Mbit/s)
City average (Mbit/s)
% difference Average maximum speed (Mbit/s)
City average (Mbit/s)
UK average (Mbit/s)
% difference
15.9 14.1 +13% 15.9 29.9 12.7 -47%

36
Gwynedd Council has set up ‘Digital Gwynedd’, which aims to establish Gwynedd as a fully digital area
The local authority is Gwynedd Council, and it has set up Digital Gwynedd as part of its 2011-2014 three-year plan. The aim is to establish Gwynedd as a fully digital area. The project is working towards a state-of-the-art broadband infrastructure, and aims to inspire people and businesses and help them gain the skills and information they need to make the most of the technology. Digital Gwynedd helps Gwynedd’s residents and businesses to take advantage of the support that is currently available from the Welsh government and others. Digital Gwynedd operates projects in various areas, including the ICT infrastructure.
Digital Gwynedd recently presented a case to the Welsh government for the roll-out of faster broadband across Gwynedd. It has also held a survey among over 700 of Gwynedd’s residents and businesses, to establish their current and desired future use of the internet. The survey also collected information on the quality of their connection.
Bangor has benefited from several cases of public intervention
Bangor recently had its only serving exchange upgraded with the support of a public subsidy from the Superfast Cymru project. The city was one of the first in Wales to benefit from the scheme, which involves the Welsh government and BT working in partnership to develop a nationwide SFBB infrastructure to deliver high-speed fibre broadband access to 96% of homes and businesses in Wales by 2016. In total, the project will invest £425m. This has been achieved through a total investment by the public sector of £205m, which includes European Structural Funding of £89.5m (£80m of which is convergence funding), UK government funding of £56.9m and Welsh government funding of £58.6m, with the remainder invested by BT25.
Bangor also benefits from the Welsh government’s Broadband Support Scheme, which provides up to £1000 for individuals or businesses with slow broadband access to secure a better connection. Digital Gwynedd ran a campaign to raise awareness of the initiative.
25 http://www.superfast-cymru.com/faqs

37
2 Television and audio-visual content 2 2.1 Recent developments in Wales
The BBC and S4C have published details of a five-year operating agreement which guarantees S4C’s editorial and managerial independence while safeguarding appropriate accountability to the BBC Trust for licence fee funding spent by the channel. The BBC will contribute £76.3m in 2013-14, falling each year to £74.5m by 2016-17.
Following the 2013 Budget, the DCMS confirmed that 1.09% less funding would be available to S4C in 2013/14. The following year, the budget would reduce by a further 1.06%. The UK Government had agreed to contribute £6.7m towards S4C budget in 2013/14, and £7m in 2014/15, following an agreement that the majority of the channel’s budget would be funded through the licence fee.
The BBC and S4C have also confirmed a renewed partnership agreement which will see continued investment in Welsh-language programming for the next four years. The agreement guarantees the statutory minimum of 520 hours of programming supplied to S4C each year by BBC Wales.
S4C launched its digital fund, S4C Digital Media Ltd, to promote developments in the area of multi-platform and digital media. The fund, worth £1m a year over the next four years, aims to support new creative products and services across digital platforms.
ITV has announced further modernisation, designed to reduce its operating costs and help to secure the long-term future of news and programmes in Wales. Proposals include restructuring all technical, craft and support roles into one integrated multi-skilled production team.
Independent television producers have been given a £200,000 funding boost by Channel 4 and the Welsh Government. The channel’s Alpha Fund is designed to support the development of creative output from Welsh-based producers and suppliers.
Edwina Hart, the Welsh Government Minister for Economy, Science and Transport, has also announced that the Welsh Government will offer flexible funding support for television production in Wales. The Wales Screen Commission provides information on locations, crew and costs (which are approximately 20% les than in London).
Ofcom awarded the local TV licence for Cardiff to Made TV Ltd. The channel will be called Made in Cardiff and will have a transmission footprint which includes Newport, the South Wales Valleys and Bridgend, covering 350,000 households. The Swansea licence, which did not attract any applications during the first round of licensing, will be included in a second round of licensing in 2013, along with Bangor and Mold. The closing date for applications is 11 September 2013.
Ofcom is presently working towards offering new ten-year licences to ITV, STV, UTV and Channel 5 before the current licences expire at the end of 2014. This follows Culture Secretary Maria Miller’s decision, announced in November 2012, not to block the renewal of the licences. We have consulted on the terms of those renewals, with three consultations - on the licensed areas, the financial terms of the renewal, and the programming obligations of the licences - all closing on 2 May 2013.26
26 http://stakeholders.ofcom.org.uk/consultations/c3-licensed-area/

38
2.2 Digital television take-up in Wales
Digital switchover completed in Wales
The majority (99%) of all TV households in Wales are now receiving digital television. Digital switchover in Wales was completed in October 2012.
Just under half of Welsh households receive satellite television through the main set
Figure 2.1 shows that in 2013, just under half (48%) of consumers in Wales have satellite television, compared to 53% in 2012. Just under two in five (38%) stated they had Freeview, with a further 11% receiving cable television through their main television set.
Satellite television is more prominent as the main platform in rural areas of Wales, with three in five (60%) using this platform; this compares to 44% of those in urban areas. Both urban and rural areas have similar proportions of Freeview television, with cable being used by 14% of those in urban areas.
Figure 2.1 Main television set share, by platform
QH1a. Which, if any, of these types of television does your household use at the moment? Source: Ofcom research, Q1 2013 Base: All adults aged 16+ (n = 3750 UK, 492 Wales, 2250 England, 501 Scotland, 507 Northern Ireland, 247 Wales urban, 245 Wales rural, 811 Wales 2008, 987 Wales 2009, 1075 Wales 2010, 493 Wales 2011, 513 Wales 2012, 492 Wales 2013)
2.3 Smart TV and HDTV ownership
Just under two-thirds of households in Wales have an HD-ready television
Sixty-four per cent of Welsh households claim to have either HDTV services or an HD-ready television; Just under two in five (39%) receive HDTV services, with the remaining 25% claiming to have an HD-ready TV but be unable to receive HD services.
Within Wales, there are differences between those who live in rural and urban households. Seventy-two per cent of those in rural households have an HD-ready television, compared to 62% in urban locations. Forty-five per cent of households in a rural location claim to receive HD channels, compared to 37% in urban locations. Similar levels in urban and rural locations have HD-ready televisions but do not receive HD services (25% and 27% respectively).
http://stakeholders.ofcom.org.uk/consultations/c3-c5-obligations/ http://stakeholders.ofcom.org.uk/consultations/c3-c5-finance/
4048
40 3754
4460
44 46 45 51 53 48
3938
39 43
3239
36
3134 40
37 3538
1611
17 1611 14
85
8 8 9 1116 111 1
2 2 2 3 2 2 2 2 2 2 1 2
0%
20%
40%
60%
80%
100%
UK 2013 Wales 2013
England 2013
Scotland 2013
N Ireland 2013
Wales urban 2013
Wales rural 2013
Wales 2008
Wales 2009
Wales 2010
Wales 2011
Wales 2012
Wales 2013
No TV in household
Only terrestrial TV (channels 1-4/1-5)
DTV via broadband DSL line
Cable TV
Freeview (pay or f ree)
Satellite (pay or f ree)
% homes

39
Figure 2.2 Proportion of homes with HD television
QH53. Is the main TV in your household an HDTV set or HD ready?/ QH54. For the main TV set, does your household have an HD TV service – from either Sky, Virgin Media, Freesat or Freeview? Source: Ofcom research, Q1 2013 Base: All adults aged 16+ (n = 3750 UK, 492 Wales, 2250 England, 501 Scotland, 507 Northern Ireland, 247 Wales urban, 245 Wales rural)
Smart TV take-up continues to grow in Wales
Among those with a television in their household, 6% claim to have a smart television; double the number who claimed this in 2012. Rural areas have seen the highest level of take-up, with 8% claiming to have a smart TV (a rise of 5pp on 2012), compared to 6% in urban areas (a 3pp increase on 2012).
Figure 2.3 Smart TV take-up in Wales
QH18. Are any of your TV sets “smart TVs”? These are new types of TV that are connected to the internet and can stream video directly onto your television screen, without the need for a computer, set-top box or games console. Source: Ofcom research, Q1 2013 Base: All adults aged 16+ with a TV in household (n = 3661 UK, 485 Wales, 2197 England, 487 Scotland, 492 Northern Ireland, 243 Wales urban, 242 Wales rural)
24 25 24 27 23 25 27
4939
4953
4937
45
0%
20%
40%
60%
80%
100%
UK 2013 Wales 2013 England 2013 Scotland 2013 N Ireland 2013 Wales urban 2013
Wales rural 2013
HDTV channels
HD ready, no channels
73 727379
64 6272
% TV homes
7 68
46 6
8
0%
5%
10%
15%
20%
UK 2013 Wales 2013 England 2013 Scotland 2013 N Ireland 2013 Wales urban 2013
Wales rural 2013
Figure above bar shows % point change in take-up of Smart TVs from Q1 2012
+2 +2+3+3 +/-0 +3 +5

40
2.4 Broadcast television viewing
People in Wales spend 4.5 hours per day watching TV
In 2012, people in Wales spent 4.5 hours per day watching television, which is the highest across all the nations (Figure 2.4).
Figure 2.4 Average hours of daily TV viewing, by nation: 2012
Source: TV = BARB. Based on all individuals (aged 4+). PSBs = BBC One, BBC Two, ITV1, C4, Channel 5 including HD variants. *Note: This figure reflects the average across the English regions with the highest in the North East (4.4) and lowest in the West (3.7) respectively.
Over half (52%) of all viewing is to the five main PSB channels
In 2012, the five main PSB channels accounted for a combined 52% share of total TV viewing in Wales, comparable to that in the other nations and equal to the average 52% share across the UK.
Hours per person per day
4.0 4.0* (see note)
4.3 4.5 4.1
53% 53% 53% 53% 51%
47% 47% 47% 47% 49%
0%
20%
40%
60%
80%
100%
UK England* Scotland Wales N Ireland
Non-PSBs
Main PSBs
Share of daily hours %

41
Figure 2.5 Share of the five main PSB channels, all homes: 2012
Source: BARB, all individuals (4+). HD channel variants are included.
Between 2007 and 2012, there was a ten percentage point reduction in the combined share of the five main PSB channels in Wales (to 52% in 2012). This reduction was broadly comparable with the average decrease across the UK, which was 11pp.
Figure 2.6 Reduction in combined share of the five main PSB channels, all homes: 2007 and 2012
Source: BARB, all individuals (4+). HD channel variants are included. Note: In 2010 a new BARB panel was introduced, including the re-defining of boundaries. Therefore, pre and post panel change data should be compared with some caution. Note: Following digital switchover in Wales in 2010 S4C ceased to carry Channel 4 content. S4C is therefore included in the main PSB channels in 2007 but not in 2012. S4C’s share in Wales in 2012 is 1.3%.
The PSB channels’ total combined share (including digital channels) decreased by 4.8pp between 2007 and 2012, more than the UK average net loss of 2.5pp
From 2007 to 2012, the main five PSB channels experienced a 10.4pp decrease in their combined share of total TV viewing (compared to the UK average decrease of 11.4pp). Among viewers in Wales, the PSB portfolio channels enjoyed an increase of 5.6pp (UK average 8.9pp); resulting in a net loss overall of 4.8pp in the total combined channel share -
21% 19% 23% 20% 25% 21% 19% 19%25% 23% 20% 20% 21% 17%
6% 6%7%
6%7%
6% 6% 6%
8% 6%6% 6% 6%
5%
15% 20% 13%13%
15%14% 17% 17%
15%14% 16% 15% 16%
18%
6%6%
6%6%
6%6% 6% 6%
5%5% 6% 6% 4% 6%
4%6%
4%4%
4%4% 5% 4%
4%4% 4% 5% 4% 5%
0%
20%
40%
60%
80%U
K
Bor
der
Eas
t of E
ngla
nd
Lond
on
Mer
idia
n
Mid
land
s
Nor
th E
ast
Nor
th W
est
Sou
th W
est
Wes
t
Yor
kshi
re
Sco
tland
Wal
es
N. I
rela
nd
Channel 5Channel 4ITV1BBC2BBC1
52% 57% 51% 48% 56% 51% 53% 53% 58% 54% 52% 53% 52% 52%
Audience share (%)
52% 57% 51% 48%56% 51% 53% 53% 58% 54% 52% 53% 52% 52%
11% 4% 15%13%
9% 13% 8% 9%14%
9% 15% 10% 10% 14%
0%
20%
40%
60%
80%
100%
UK
Bor
der
Eas
t of
Eng
land
Lond
on
Mer
idia
n
Mid
land
s
Nor
th E
ast
Nor
th W
est
Sou
th W
est
Wes
t
Yor
kshi
re
Sco
tland
Wal
es
N. I
rela
ndShare loss since 2007
Share of the main PSB channels in 2012
Share (%)

42
higher than the UK average net loss of 2.5pp and more than that experienced in any of the other nations.
Figure 2.7 Net change in the audience share of the five main PSB channels and their portfolio channels, all homes: 2007-2012
Source: BARB, all individuals (4+) Notes: i) PSB main channels include HD variants but not +1s. ‘PSB portfolio channels’ include main PSB +1 channels and the PSB digital channels and their respective +1s). ii) Following digital switchover in Wales in 2010 S4C ceased to carry Channel 4 content. S4C is therefore included in the main PSB channels in 2007 but not in 2012. S4C’s share in Wales in 2012 is 1.3%. iii) In 2010 a new BARB panel was introduced, including the re-defining of boundaries. Therefore, pre and post panel change data should be compared with some caution.
BBC One early evening news bulletins attracted 29% share in Wales
In 2012, BBC One’s early-evening nation’s news bulletin attracted an average 29% share of TV viewing in Wales – broadly in line with the UK average of 28%. ITV Wales’ counterpart bulletin attracted a lower average share (18%) than BBC One’s, which was also the lowest across the nations. The viewing figures in Wales remain broadly unchanged since last year.
-11.4%
-3.9%
-14.6%
-13.1%
-8.9%
-13.4%
-8.0%
-8.8%
-14.3%
-8.5%
-14.5%
-10.4%
-10.4%
-14.1%
8.9%7.2%
8.5%9.1%
6.8%9.2%
6.4%7.3%
9.6%7.1%
9.5%8.3%
5.6%10.3%
-16 -12 -8 -4 0 4 8 12
UKBorder
East of EnglandLondon
MeridianMidlands
North EastNorth WestSouth West
WestYorkshireScotland
WalesN. Ireland
Change in total share of f ive main PSB channels since 2007 Change in total share of the PSB portfolio channels since 2007
52%52%
54%
53%52%
58%53%53%51%56%48%51%57%
52%
19%
22%21%21%20%
19%20%20%
22%20%22%
20%20%
21%
Change in audience share (percentage points)

43
Figure 2.8 BBC One and ITV,/STV,/UTV,/ITV Wales early-evening news bulletin shares, all homes: 2012
Source: BARB, all individuals (4+) Note: Based on regional news prog, start time 17:55-18:35, 10 mins+ duration, BBC One and ITV, weekdays.
Over half of adults in Wales name TV as their main source of local news
In 2012, 54% of adults in Wales stated that TV was their main source of local news, marginally higher than the UK average of 50%. The internet was second with 18%, while talking to people scored lowest across the nations, with 7% citing it as their main source of local news.
Figure 2.9 Main sources of local news, by nation
Source: Ofcom Media Tracker 2012. Base: All adults; England (1,434); Scotland (189); Wales (118); Northern Ireland (113).Only responses ≥ 3% labelled
28%
25% 34
%
22%
33%
27%
26%
26%
43%
37%
30%
30%
29%
26%
18%
38%
17%
12% 18
%
15% 21
%
17%
16%
14% 19
% 27%
18%
34%
0%
10%
20%
30%
40%
50%U
K
Bor
der
Eas
t of E
ngla
nd
Lond
on
Mer
idia
n
Mid
land
s
Nor
th E
ast
Nor
th W
est
Sou
th W
est
Wes
t
Yor
kshi
re
Sco
tland
Wal
es
N. I
rela
nd
BBC One
ITV1/STV/UTV/ITV Wales
Share (%)
‘Can you tell me what, if anything, is your main source of news about what is going on in your own local area’
50% 49% 54% 54% 55%
9% 9%12% 11% 11%
15% 16%15%
8% 7%
9% 9% 4% 18%8%
9% 9% 12%7%
16%
0%
20%
40%
60%
80%
100%
UK England Scotland Wales N Ireland
Other
Talking to people
Internet
Newspapers
Radio
TV

44
In 2012, 62% of adults in Wales stated television as their main source of news about their nation – the lowest figure across the nations. 16% of respondents cited the internet as their second main source of news. This is considerably higher than in Scotland and Northern Ireland (2% and 9% respectively).
Figure 2.10 Main source of nations’ news for each nation
Source: Ofcom Media Tracker. Base: All respondents in Scotland (189), Wales (118), Northern Ireland (113). Only responses ≥ 3% labelled.
2.5 TV programming for viewers in Wales
The following section outlines spend and hours of programming for viewers in Wales, Scotland, Northern Ireland, and the English regions provided by the BBC and ITV /UTV /STV. The figures exclude Gaelic and Welsh language programming but include some spend on Irish-language programming by the BBC. See section 2.7 for details on S4C.
Programme definitions First-run originations - Programmes commissioned by or for a licensed public service channel with a view to their first showing on television in the United Kingdom in the reference year.
First-run acquisitions - A ready-made programme bought by a broadcaster from another rights holder and broadcast for the first time in the UK during the reference year.
Repeats - All programmes not meeting one of the two definitions above.
Spend on first-run originated content for viewers in Wales decreased by 3% year on year
In 2012, £266m was spent by the BBC and ITV /STV /UTV on producing first-run originated programmes specifically for viewers in Wales, Scotland, Northern Ireland and the English regions, down by £10m (or 4%) from 2011 and down by 30% since 2007.
69%62%
69%
12%
9%7%
11%
10%10%
5%5%16%9%
0%
20%
40%
60%
80%
100%
Scotland Wales Northern Ireland
Other
Internet
Talking to peopleRadio
Newspapers
TV
‘Can you tell me what, if anything, is your *main* source of news about what is going on in [Scotland, Wales, Northern Ireland]?’

45
Spend in Wales decreased by over a third (35%) between 2007 to 2012. This figure is below the UK average and gives Wales the highest relative decrease across the nations over the five-year period.
At £26m, spend by the BBC and ITV on first-run originated TV content specifically for viewers in Wales was down 3% year on year.
Figure 2.11 Spend on first-run originated nations/regions’ output by the BBC /ITV /STV /UTV
Source: Broadcasters. All figures expressed in 2012 prices. Note: Spend data for first-run originations only. Spend excludes Gaelic and Welsh language programming but includes some spend on Irish language programming by the BBC. This does not account for total spend on BBC Alba or BBC spend on S4C output.
Total spend on non-news programming for people in Wales increased by 8% year on year
Turning to total spend, Wales increased its spend in 2012 on non-news/non-current affairs by 8% from 2011 . Conversely, year-on-year spending on news in Wales was down by 14%.
£234 £216£173 £174 £168 £165
£34 £32£29 £27 £26 £23
£70£57
£57 £56 £55 £52
£41£37
£31 £27 £27 £26
£379m£343m
£291m £283m £276m £266m
£0m
£100m
£200m
£300m
£400m
2007 2008 2009 2010 2011 2012
Wales
Scotland
Northern Ireland
England
-4% -30%
-3% -35%
-6% -27%
-10% -33%
-2% -30%
Spend
5 years1 year% change
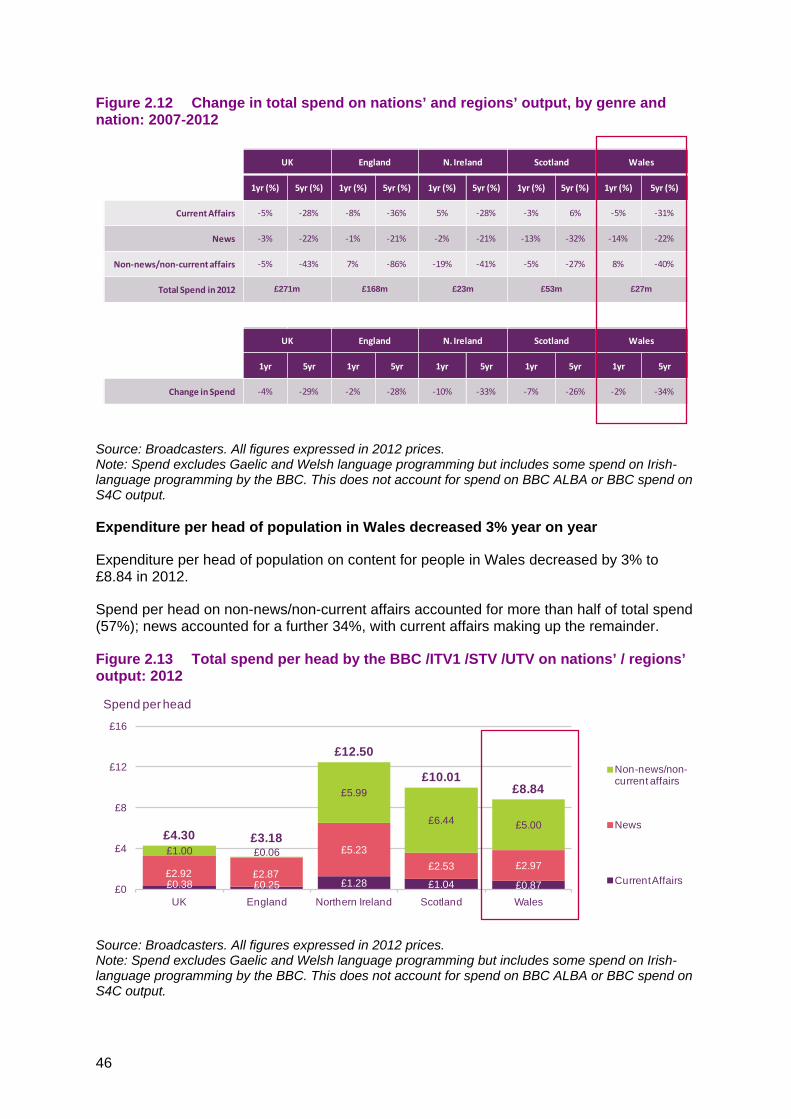
46
Figure 2.12 Change in total spend on nations’ and regions’ output, by genre and nation: 2007-2012
Source: Broadcasters. All figures expressed in 2012 prices. Note: Spend excludes Gaelic and Welsh language programming but includes some spend on Irish-language programming by the BBC. This does not account for spend on BBC ALBA or BBC spend on S4C output.
Expenditure per head of population in Wales decreased 3% year on year
Expenditure per head of population on content for people in Wales decreased by 3% to £8.84 in 2012.
Spend per head on non-news/non-current affairs accounted for more than half of total spend (57%); news accounted for a further 34%, with current affairs making up the remainder.
Figure 2.13 Total spend per head by the BBC /ITV1 /STV /UTV on nations’ / regions’ output: 2012
Source: Broadcasters. All figures expressed in 2012 prices. Note: Spend excludes Gaelic and Welsh language programming but includes some spend on Irish-language programming by the BBC. This does not account for spend on BBC ALBA or BBC spend on S4C output.
UK England N. Ireland Scotland Wales
1yr (%) 5yr (%) 1yr (%) 5yr (%) 1yr (%) 5yr (%) 1yr (%) 5yr (%) 1yr (%) 5yr (%)
Current Affairs -5% -28% -8% -36% 5% -28% -3% 6% -5% -31%
News -3% -22% -1% -21% -2% -21% -13% -32% -14% -22%
Non-news/non-current affairs -5% -43% 7% -86% -19% -41% -5% -27% 8% -40%
Total Spend in 2012 £271m £168m £23m £53m £27m
UK England N. Ireland Scotland Wales
1yr 5yr 1yr 5yr 1yr 5yr 1yr 5yr 1yr 5yr
Change in Spend -4% -29% -2% -28% -10% -33% -7% -26% -2% -34%
£0.38 £0.25 £1.28 £1.04 £0.87£2.92 £2.87
£5.23£2.53 £2.97
£1.00 £0.06
£5.99
£6.44 £5.00£4.30 £3.18
£12.50
£10.01£8.84
£0
£4
£8
£12
£16
UK England Northern Ireland Scotland Wales
Non-news/non-current affairs
News
Current Affairs
Spend per head

47
First-run originated hours in Wales down by almost a quarter (24%) since 2007
The BBC and ITV1 /STV /UTV produced a total of 11,002 hours of first-run originated content for the English regions, Scotland, Wales and Northern Ireland in 2012, down 6% (or 645 hours) since 2011, and down 7% (857 hours) since 2007.
Wales had the largest relative reduction in first-run originated nations’ output over the five-year period; down by almost a quarter (24%) since 2007 to 954 hours in 2012.
Over a one-year period, however, the number of first-run originated hours decreased by 6% in Wales, which is on par with the UK-wide average decrease of 6%.
Figure 2.14 Hours of first-run originated nations’ / regions’ output, by genre and broadcaster: 2012
Source: Broadcasters. Note: Hours data for first-run originations only. Hours excludes Gaelic and Welsh language programming but includes some spend on Irish language programming by the BBC. This does not include total hours for BBC ALBA or BBC hours on S4C output.
Total cost per hour for nations’ programming has decreased 4% since 2007 for Wales – the lowest across the nations
When analysing the cost of making programmes for the nations, cost-per-hour calculations show that England, Northern Ireland and Scotland produced programmes more cost-effectively in 2012 than in 2007.
Over the five-year period, cost per hour decreased by 4% in Wales, compared to the UK average reduction of 24%.
513 257 28 178 50
5,0554,002
385
314
354
83494
170
320
250205
52 40
70
433,149
2,282219
424
224
1,24617
72
1,124
33
UK England Northern Ireland Scotland Wales
ITV/STV/UTV non-news/non-current affairsITV/STV/UTV news
ITV/STV/UTV current affairs
BBC non-news/non-current affairs
BBC news
BBC current affairs
Hou
rs o
f out
put
11,002 hrs-6%-7%
6,704 hrs-1%-15%
914 hrs-2%-21%
2,430 hrs-17%51%
2012 total hoursChange since 2011Change since 2007
954hrs-6%-24%
48
Figure 2.15 Cost per hour for total nations’ and regions’ output, by nation: 2007–2012
Source: Broadcasters. All figures expressed in 2012 prices. Note: Spend excludes Gaelic and Welsh language programming but includes some spend on Irish language programming by the BBC. This does not include hours or spend on BBC ALBA or BBC hours and spend on S4C output.
2.6 PSB television quota compliance
Share of spend in Wales continued to grow, rising to 3.5% in 2012
Figure 2.16 illustrates the distribution of spend on qualifying first-run originated network programming by the five main PSB channels. In 2012 55.4% of qualifying expenditure was devoted to productions made within the M25 - down from 57% in 2011. A further 20.3% of first-run spending was captured by producers based in the North of England and 12.1% in southern England.
Share of spend dedicated to Wales continued to grow, with the figure rising to 3.5% in 2012 from 2.8% in 2011. In Scotland, first-run productions accounted for 4.4% of expenditure of network programming, down marginally on 2011 and, as in the South of England, reversing the trend of growth seen between 2008 and 2011. In the Midlands and eastern England, expenditure on first-runs rose marginally to 2.6%, while in Northern Ireland the share of total spend declined to 0.8% from 1% in the previous year.
In 2012, expenditure on originated network productions rose particularly strongly in northern England, where it increased by 3.6 percentage points, primarily driven by the BBC relocating a significant production base to Salford during the year. The increase came at the expense of southern England, which bucked the positive trend of the previous years as its share of overall spend on qualifying first-run commissioned network programming contracted by 2.6 percentage points compared to 2011.
£30k £30k£26k
£40k
£27k£23k £24k £22k £19k
£26k
£0k
£10k
£20k
£30k
£40k
UK England Northern Ireland Scotland Wales
2007
2012
Cos
t per
hou
r
-24%Change
since 2007 -18% -16% -51% -4%
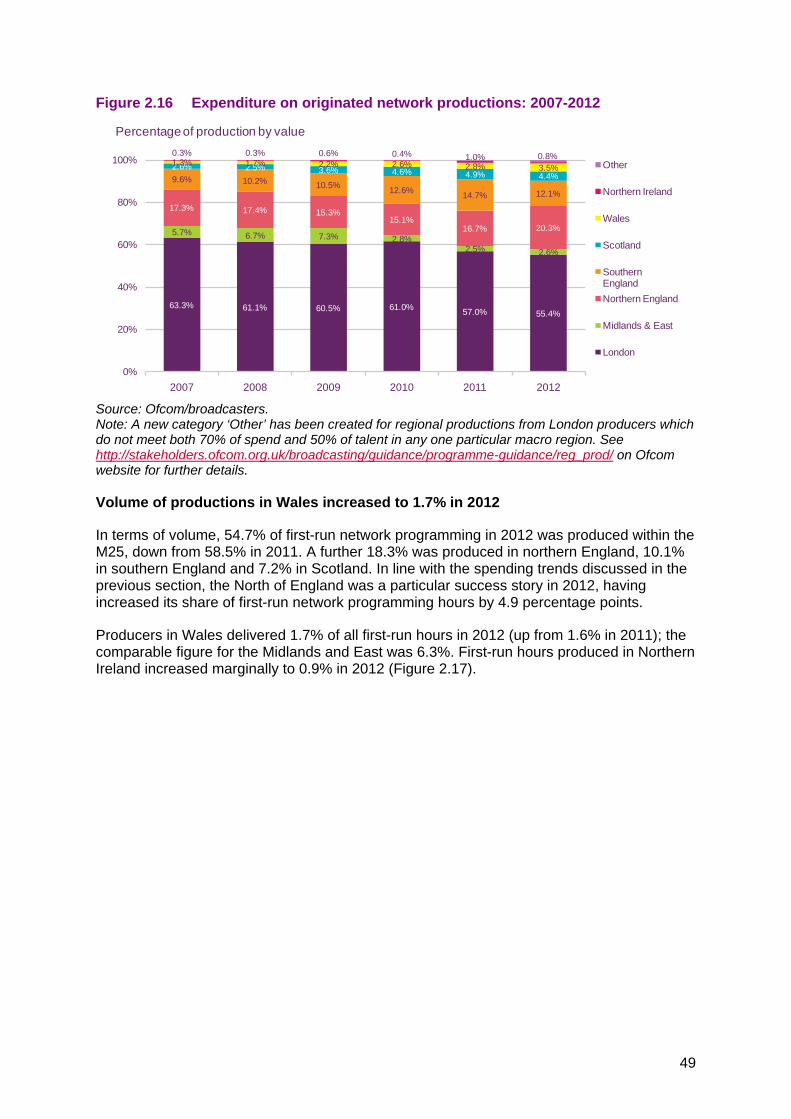
49
Figure 2.16 Expenditure on originated network productions: 2007-2012
Source: Ofcom/broadcasters. Note: A new category ‘Other’ has been created for regional productions from London producers which do not meet both 70% of spend and 50% of talent in any one particular macro region. See http://stakeholders.ofcom.org.uk/broadcasting/guidance/programme-guidance/reg_prod/ on Ofcom website for further details.
Volume of productions in Wales increased to 1.7% in 2012
In terms of volume, 54.7% of first-run network programming in 2012 was produced within the M25, down from 58.5% in 2011. A further 18.3% was produced in northern England, 10.1% in southern England and 7.2% in Scotland. In line with the spending trends discussed in the previous section, the North of England was a particular success story in 2012, having increased its share of first-run network programming hours by 4.9 percentage points.
Producers in Wales delivered 1.7% of all first-run hours in 2012 (up from 1.6% in 2011); the comparable figure for the Midlands and East was 6.3%. First-run hours produced in Northern Ireland increased marginally to 0.9% in 2012 (Figure 2.17).
Percentage of production by value
63.3% 61.1% 60.5% 61.0% 57.0% 55.4%
5.7% 6.7% 7.3% 2.8%2.5% 2.6%
17.3% 17.4% 15.3%15.1%
16.7% 20.3%
9.6% 10.2% 10.5% 12.6% 14.7% 12.1%
2.6% 2.5% 3.6% 4.6% 4.9% 4.4%1.3% 1.7% 2.2% 2.6% 2.8% 3.5%
0.3% 0.3% 0.6% 0.4% 1.0% 0.8%
0%
20%
40%
60%
80%
100%
2007 2008 2009 2010 2011 2012
Other
Northern Ireland
Wales
Scotland
Southern EnglandNorthern England
Midlands & East
London

50
Figure 2.17 Volume of originated network productions: 2007-2012
Source: Ofcom/broadcasters. Note: A new category ‘Other’ has been created for regional productions from London producers which do not meet both 70% of spend and 50% of talent in any one particular macro region. See http://stakeholders.ofcom.org.uk/broadcasting/guidance/programme-guidance/reg_prod/ on Ofcom website for further details.
2.7 Welsh language programming
Spend on, and hours of, Welsh-language output
The BBC has a statutory obligation to provide S4C output, which is funded from the BBC’s licence revenue. The 2012 obligation was to provide S4C with ten hours of output per week (520 hours per year) which the BBC exceeded by 47 hours in 2012, totalling 567 hours. In 2011, the BBC Trust and the S4C Authority renewed their existing agreement, to maintain the partnership between the two broadcasters until 2013. New provisions include the immediate availability of all BBC-produced S4C programmes on the BBC iPlayer and a commitment to deliver popular Welsh-language soap opera Pobol y Cwm in high definition. The agreement also confirmed the reduction in funding for the 520 hours of programming, to £19.4m in 2011/12 from £23.5m in 2010/11. S4C spent £68m on first-run commissioned programming in 201227; an 11% fall in real terms on 2011. This was the second consecutive year of decline in spend.
27 £68m excludes the BBC’s 2012 statutory contribution.
64.3% 64.6% 62.7% 60.8% 58.5% 54.7%
4.4% 8.9% 9.5% 8.3% 7.7%6.3%
17.9% 12.7% 11.3% 11.6% 13.4% 18.3%
10.8% 11.0% 11.4% 12.9% 10.9% 10.1%
1.7% 1.8% 3.3% 4.6% 6.8% 7.2%
0.7% 0.9% 1.7% 1.4% 1.6% 1.7%
0.2% 0.1% 0.2% 0.5% 0.8% 0.9%
0%
20%
40%
60%
80%
100%
2007 2008 2009 2010 2011 2012
Other
Northern Ireland
Wales
Scotland
Southern England
Northern England
Midlands & East
London

51
Figure 2.18 Spend by S4C on first-run Welsh-language programming
Source: S4C. All figures expressed in 2012 prices. Note: BBC statutory hours for S4C are per calendar year. BBC’s financial contribution for S4C statutory hours are reported by financial year in BBC accounts but are reported by calendar year in the S4C Annual Report.
The total number of hours broadcast by S4C in 2012 rose by 410 hours to 6,629 hours, which was driven by increases in repeats and first-run commissioned output from independent producers. Repeats continued to make up the majority of the channel’s output, accounting for 56% of all programming during the year. Repeated hours were up by 14%; from 3,254 hours in 2011 to 3,717 hours in 2012. First-run commissions from indie companies increased by 9% year on year, bringing the total to 1,990 hours in this category.
In contrast, first-run acquisitions experienced the steepest decline, as the number of hours in this category fell by 29% to 342 hours in 2012, which was below the 2010 level of 351 hours. The percentage fall in the BBC statutory programming hours was also in double digits (-11%), while first-run commissions from the BBC were flat year on year.
In terms of overall first-run commission hours, children’s programming and drama experienced steep increases of 45% and 39% respectively, followed by a 12% increase in programming dedicated to light music and entertainment. These three genres were the reason behind the 9% growth in overall first-run commission hours, bringing the total to 2,003 hours in 2012. All other categories, comprising general factual, current affairs, sport and religion, experienced year-on-year declines.
£13m £16m
£21m £17m
£2m £2m
£9m £8m
£9m£9m
£5m£5m
£12m£11m
£4m£1m
£76m£68m
£0m
£10m
£20m
£30m
£40m
£50m
£60m
£70m
£80m
2011 2012
Religion
Sport
Music and Arts
Children
Light Music/ EntertainmentCurrent Affairs
General Factual
Drama
Spend on Welsh language programming

52
Figure 2.19 Type of Welsh-language output on S4C, by hours
Source: S4C.
630 672 711 640 567
3,237 3,521 3,371 3,254 3,717
8358 351 482
34221
12 14 13 131,3551,432
1,772 1,8301,990
0
1,000
2,000
3,000
4,000
5,000
6,000
7,000
2008 2009 2010 2011 2012
First-run commissions (indie)
First-run commissions (BBC)
First-run acquisitions
Repeats
BBC Statutory
Hours 5,326 5,695 6,219 6,6296,219

53
3 Radio and audio content 3 3.1 Recent developments in Wales
On 24 June 2012, Global Radio acquired the outstanding share capital in GMG Radio (re-named Real and Smooth Ltd). On 2 August 2012, the then Secretary of State for Culture, Media and Sport, Jeremy Hunt, issued an intervention notice in relation to the proposed acquisition. The notice specified “the need, in relation to every different audience in the United Kingdom or in a particular area or locality of the United Kingdom, for there to be a sufficient plurality of persons with control of the media enterprises serving that audience”. He asked Ofcom to investigate and to report to him with advice and recommendations by 28th September 2012. In North Wales and the Cardiff area, we identified that before the merger there had been comparatively few news media providers available to consumers. We therefore looked particularly closely at this area.
Although the merger resulted in a reduction in the number of media owners, we found that there will continue to be a variety of other platforms, including TV, newspapers and online. In relation to nations’ /regional /local news and current affairs, we did not identify any substantive plurality concerns resulting from the transaction. Our advice to the Secretary of State was that we did not consider that it is, or may be, the case that Global Radio’s acquisition of GMG Radio operates, or may be expected to operate, against the public interest.28
As in the case with all such changes of control, Section 355 of the Communications Act requires Ofcom to undertake a review of each analogue radio station’s Character of Service. In the case of Wales, additional programming obligations, reflecting the content that the previous owner had been delivering, have been incorporated into the Format for Real Radio Wales, adding news and sport into the character of service as “important ingredients.”
In October 2012, the Office of Fair Trading referred the merger to the Competition Commission and it published the result of its investigation in May 2013. The Competition Commission decided that Global Radio must sell radio stations in seven areas of the UK, including Cardiff and North Wales following its completed acquisition of Real and Smooth Limited29.
In other developments in the radio sector, Swansea Bay Radio Ltd. requested a change in the character of service of Nation Hits (formerly Nation 80s and Bay Radio), to limit the requirement to deliver certain speech requirements. Ofcom sought views on the requested changes and subsequently decided to reject the Format Change Request on the basis that the departure from the existing Format would narrow the range of programmes available to listeners in the Swansea area.
28 Ofcom’s report on the public interest test on the acquisition of GMG’s radio stations by Global Radio, 11 October 2012 http://stakeholders.ofcom.org.uk/binaries/consultations/gmg-radio-holdings/annexes/final.pdf 29 Competition Commission report 21 May 2013 http://www.competition-commission.org.uk/assets/competitioncommission/docs/2012/global-radio-gmg/130521_global_radio_gmg_final_report.pdf

54
3.2 Radio service availability
Listeners in Wales have access to up to 75 radio services
In April 2013, a new DAB multiplex serving north-east Wales and west Cheshire commenced transmission. This has resulted in the number of DAB services exceeding the number of existing analogue services for BBC, UK-wide commercial and local commercial services. The multiplex line-up is BBC Radio Wales, BBC Radio Cymru, Dee on DAB, Real Radio Wales, Nation Radio and 107.6 Juice FM.
However, the local radio multiplex licence for South Wales / Severn Estuary was not renewed, and expired on 29 July 2013. The frequencies on which this local radio multiplex service broadcast will be used to improve the coverage of other local DAB radio multiplex services, helping to provide more consistent availability of DAB throughout the UK.
Figure 3.1 Radio station availability: Wales
Source: Ofcom, April 2013 Note: This chart shows the maximum number of radio services available in Wales; local variations along with reception constraints mean that listeners may not be able to access all of these
3.3 Community radio broadcasting
Four licence awards made
Four community radio licences were awarded in April 2012, and the stations are preparing to start broadcasting. These services are for Anglesey/Ynys Môn, Harlech, Bodelwyddan (Denbighshire), and Carmarthenshire, Ceredigion and north Pembrokeshire.
In 2013, there were eight community radio stations on air in Wales – the same as in the previous two years.
The Welsh Government has also recently announced a one-year extension to its community radio fund, following a review. All 12 licensed community radio stations in Wales were eligible to apply for a share of the £100,000 fund.
The nine radio stations that were awarded grants are:
• Bro Radio - £12,260 • BRFM - £10,072
1214
17
7
3
16
8
0
5
10
15
20
All BBC UK-wide commercial Local commercial Community licences
Digital Analogue

55
• Calon FM - £12,260 • GTFM - £12,260 • Point FM - £12,260 • Radio Beca - £10,000 • Radio Cardiff - £9,298 • Radio Tircoed - £9,330 • Tudno FM - £12,260
3.4 Patterns of listening to audio content
More people in Wales than in any other nation listen to the radio
Radio services reached 93.1% of the adult population in Wales, the highest of all the UK nations and 3.5 percentage points higher than the UK average of 89.5%. Listeners in Wales also listened for longer. Adult radio listeners in Wales spent an average of 23.1 hours each week listening to the radio in 2012, the highest across all of the UK nations. (Figure 3.2).
Figure 3.2 Average weekly reach and listening hours: 2012
Source: RAJAR, All adults (15+), year ended Q4 2012. Reach is defined as a percentage of the area’s adult population who listen to a station for at least five minutes in the course of an average week.
BBC radio stations remain more popular in Wales than in other nations
In 2012, BBC radio stations accounted for 61% of all listening hours in Wales, a higher share for this sector than in any other UK nation. Over half (51%) of all listening hours were to the BBC network stations, again higher than in any other nation and higher than the UK average of 46%. The BBC network stations have gained listening share at the expense of BBC Radio Wales and Radio Cymru; as BBC network stations’ share of listening grew by two percentage points year on year, the BBC’s national services share fell by the same amount. The share of listening to local commercial stations in Wales was the lowest of all the nations, accounting for 25% of all listening. (Figure 3.3)
89.5%87.1%93.1%86.7%89.6%Reach
22.2 hours21.4 hours23.1 hours21.6 hours22.2 hoursAverage weekly listening
UK TOTALNorthern Ireland
WalesScotlandEngland

56
Figure 3.3 Share of listening hours, by nation: 2012
Source: RAJAR, All adults (15+), year ended Q4 2012
While the fall in ‘not stated’ (i.e. respondents not indicating ‘digital’ or ‘analogue’ over this six-year period) reflects a change in RAJAR methodology rather than a listening shift, an underlying trend is still evident: take-up of digital radio listening in Wales has grown by over a fifth in the past three years. Over two-thirds share of listening remains on analogue.
Figure 3.4 Share of listening hours via digital and analogue platforms in Wales: 2007-2012
Source: RAJAR, All adults (15+), calendar years 2007 - 2012
One fifth (21%) of adults listened to BBC Wales/Radio Cymru in an average week in 2012, a fall of 1.8 percentage points on the previous year. The proportion of adults listening to BBC Radio Cymru was on a par with 2011, and it reached 5% of the population in an average week in 2012. Listening to nations-based BBC stations was slightly less popular in Wales than elsewhere, with BBC Radio Scotland reaching 22% of adults per week and BBC Radio Ulster 35%.
47 3851
2446
89
10
22
812
15
12
813
30 3825
3630
2 2 1 10 2
0%
20%
40%
60%
80%
100%
England Scotland Wales Northern Ireland
UK
Other
Local/nations commercial
UK commercial
BBC Local/nations
BBC network
Share of listening hours
76 73 72 74 69 67
12 15 1622 25 27
11 12 12 4 6 6
0%
20%
40%
60%
80%
100%
2007 2008 2009 2010 2011 2012
Not statedDigitalAnalogue
Share of total listening hours
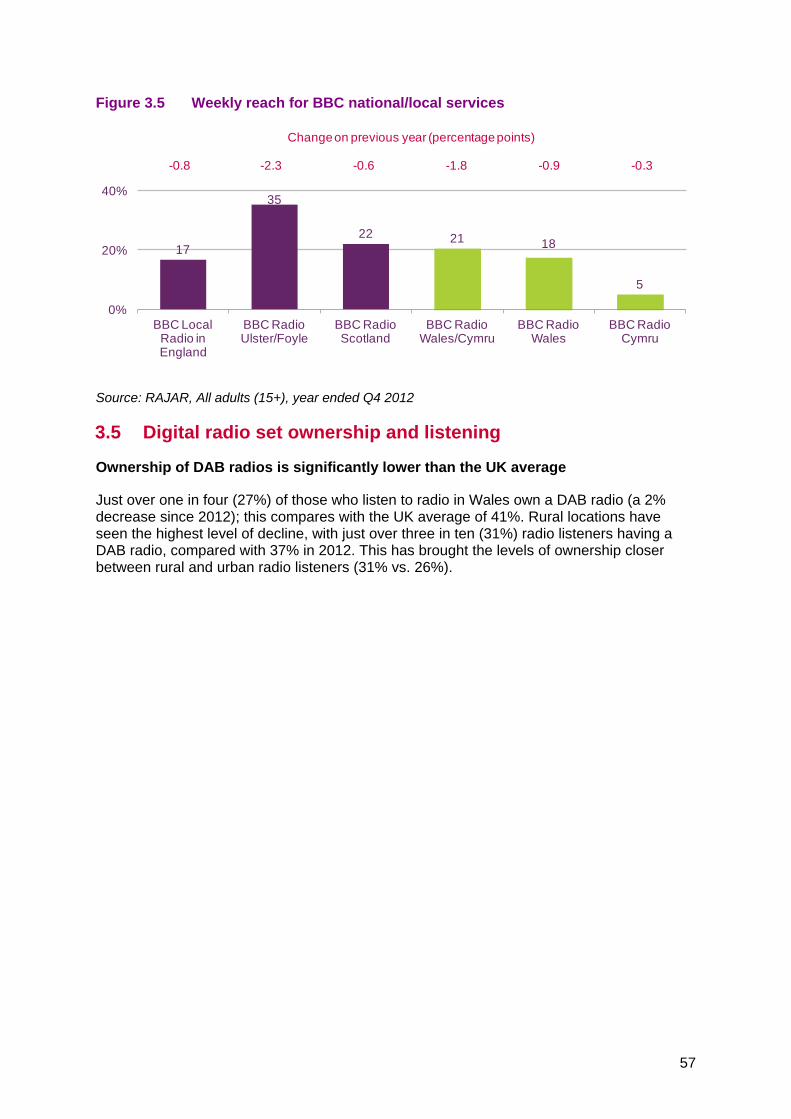
57
Figure 3.5 Weekly reach for BBC national/local services
Source: RAJAR, All adults (15+), year ended Q4 2012
3.5 Digital radio set ownership and listening
Ownership of DAB radios is significantly lower than the UK average
Just over one in four (27%) of those who listen to radio in Wales own a DAB radio (a 2% decrease since 2012); this compares with the UK average of 41%. Rural locations have seen the highest level of decline, with just over three in ten (31%) radio listeners having a DAB radio, compared with 37% in 2012. This has brought the levels of ownership closer between rural and urban radio listeners (31% vs. 26%).
17
35
22 21 18
5
0%
20%
40%
BBC Local Radio in England
BBC Radio Ulster/Foyle
BBC Radio Scotland
BBC Radio Wales/Cymru
BBC Radio Wales
BBC Radio Cymru
Change on previous year (percentage points)
-0.8 -2.3 -0.6 -1.8 -0.9 -0.3

58
Figure 3.6 Ownership of DAB radios
Q4. You said earlier that you have (NUMBER) radio sets in your home that someone in the household listens to in most weeks. How many of these radio sets are digital radios? Source: Ofcom research, Q1 2013 Base: Adults aged 16+ who listen to radio (n = 2910 UK, 383 Wales, 1747 England, 375 Scotland, 405 Northern Ireland, 195 Wales urban, 188 Wales rural, 638 Wales 2008, 848 Wales 2009, 854 Wales 2010, 397 Wales 2011, 405 Wales 2012, 383 Wales 2013) Note: Remaining percentages are Don’t know responses. NB. Data in 2011 based on those who listen to radio and have any radio sets in the household that someone listens to in most weeks.
Year-on-year growth in digital listening was lowest in Wales
The proportion of listening through a digital platform in Wales grew by 1.9 percentage points in 2012; a smaller increase than in any other UK nation.
Alongside the lower than average take-up of DAB sets in Wales, digital listening was lower than average at 27%, broadly comparable to Scotland and higher than Northern Ireland. Although the digital listening shown in Figure 3.7 includes listening via digital television and online, the majority of digital listening is via a DAB set, so it is not surprising that lower DAB take-up is reflected in a lower proportion of digital listening.
41
27
43
29 24 26 31 27 27 29 27 29 27
0%
15%
30%
45%
UK 2013 Wales 2013
England 2013
Scotland 2013
N Ireland 2013
Wales urban 2013
Wales rural 2013
Wales 2008
Wales 2009
Wales 2010
Wales 2011
Wales 2012
Wales 2013
Percentage of respondentsFigure above bar shows % point change in
DAB sets in household from Q1 2012
-6-1+3 +/-0+3 +2-2

59
Figure 3.7 Share of listening hours via digital and analogue platforms: 2012
Source: RAJAR, All adults (15+), year ended Q4 2012
3.6 The radio industry
Commercial radio revenue per head of population was lowest in Wales
The revenues generated by local commercial radio stations in Wales stood at £17.7m in 2012. Adjusting for population size, Wales has the lowest revenue per head of all the UK nations, despite a £0.10 increase on 2011. (Figure 3.8)
BBC Radio spend on BBC Wales and BBC Cymru totalled £36.4m in 2012-13, an 8% increase year on year. Expenditure per head at £11.88 was the second highest of all the nations and an increase of £0.71 on the previous year. This is due to the smaller population in Wales and the added expenditure of running two services.
Figure 3.8 Local /nations’ radio spend and revenue, per head of population: 2012-13
Source: Broadcasters Note: The UK total shows the average for local commercial radio across the four nations and therefore excludes revenues for the UK-wide commercial stations: Classic FM, talkSPORT and Absolute.
62 61 66 67 72
31 32 29 27 19
7 7 5 6 8
0%
20%
40%
60%
80%
100%
UK England Scotland Wales Northern Ireland
Not stated
Digital
Analogue
Digital listening year on year change (percentage points)
+3.4 +3.6 +2.4 +1.9 +2.5
£3.98
£6.74
£2.87
£6.69£7.37 £7.72
£11.88
£5.78
£13.17
£7.11
0
5
10
15
BBC local/nations programme spend 2012-13 Local commercial radio revenue 2012
UK nations average England Scotland Wales Northern Ireland
Radio revenue / spend per head (£ per capita)
£0.16 £0.16 £0.14 £0.10 £0.38£0.12 £0.04 £0.04 £0.71 -£0.10Annual change:


61
4 Internet and web-based content 4 4.1 Internet take-up
One in ten consumers in Wales access the internet exclusively through a mobile phone
Three-quarters of households in Wales (75%) had access to the internet at Q1 2013 (via broadband, mobile phone or narrowband), with a two percentage point year-on-year increase.
Internet access via a mobile increased by eight percentage points to 47%, with those accessing the internet exclusively through a mobile phone or smartphone rising from 4% in 2012 to 9% in 2013 – the highest across the devolved nations. Subsequently, the total number of mobile data users has continued to rise (to 48%), despite the nine percentage point fall in consumers using a mobile broadband connection (7%).
Figure 4.1 Internet take-up, Wales: 2008-2013
Source: Ofcom Technology Tracker Base: All adults aged 16+ (n = 811 Wales 2008, 987 Wales 2009, 1075 Wales 2010, 493 Wales 2011, 513 Wales 2012, 492 Wales 2013)
4.2 Internet-enabled devices
One in five households in Wales own a tablet computer
Just over one in five (21%) households in Wales now own a tablet computer, slightly lower than the UK average of 24%. Growth in tablet ownership in Wales has been on a par with the UK average, increasing by 13 percentage points in the year to Q1 2013.
Take-up of tablets has been particularly marked in rural areas, where just over one in four (27%) households claim to own a tablet, an increase of 23 percentage points on Q1 2012. Take-up in urban areas has also increased, but by a smaller margin of ten percentage points, to one in five (19%) households.
Households (%)
5560
6672 73 75
45
5864
71 68 66
5557
64 63 63
2430 30
4348
18 21 25
3947
4911
16 16 16
70
20
40
60
80
100
Q1 08 Q1 09 Q1 10 Q1 11 Q1 12 Q1 13
Internet
Total broadband
Fixed broadband
Mobile data user
Internet on mobile
Internet via phone/ smartphone onlyMobile broadband

62
Figure 4.2 Take-up of tablet computers
Source: Ofcom research, Q1 2013 Base: All adults aged 16+ (n = 3750 UK, 492 Wales, 2250 England, 501 Scotland, 507 Northern Ireland, 247 Wales urban, 245 Wales rural, 493 Wales 2011, 513 Wales 2012, 492 Wales 2013) QE1. Does your household have a PC, laptop, netbook or tablet computer?
One in seven consumers in Wales personally use an e-reader
Personal use of an e-reader rose two percentage points to one in seven (15%) consumers in Wales. Take-up in Q1 2013 was on par with the UK average (16%); while growth across the rest of the UK was greater than in Wales. Wales had previously had the highest take-up among UK nations in Q1 2012.
Consumers in rural areas of Wales (18%) were more likely to use an e-reader than those in urban areas (14%). As with the rest of the UK, the split between 3G and non-3G e-readers remained broadly similar.
Figure 4.3 Personal use of e-readers, 2013
Source: Ofcom research, Q1 2013 Base: All adults aged 16+ (n = 3750 UK, 492 Wales, 2250 England, 501 Scotland, 507 Northern Ireland, 247 Wales urban, 245 Wales rural) QB1. Which of the following do you, or does anyone in your household, have in your home at the moment? / QB2. And do you personally use.../ QB6. Does your household’s e-reader have built-in 3G access to a mobile network?
Households (%) / percentage point change in take-up of tablet computers from Q1 2012
24 21 24 2429
1927
2 8
21
+13+13
+13 +13
+20
+10
+23
0%
10%
20%
30%
UK Wales England Scotland N Ireland WalesUrban
WalesRural
2011 2012 2013
Nation Urbanity Wales
Individuals (%) / Percentage point year on year change
8 8 8 7 5 7 9
8 7 97
77
9
+6 +2+7
+5+4
+1
+3
0%
5%
10%
15%
20%
25%
30%
UK Wales England Scotland N Ireland WalesUrban
WalesRural
Non-3G e-reader 3G e-reader

63
A third of 16-34s claim their smartphone is their most important device for internet access
Use of the mobile internet continues to grow in Wales; 47% accessed the internet on their handset compared to 49% in the UK. Furthermore, one in ten consumers in Wales accesses the internet only through their mobile phone. However, when asked what was their most important device for accessing the internet, the majority of consumers in Wales chose their laptop (52%). Nevertheless, a fifth (19%) chose their smartphone, a greater proportion than the UK average (15%).
Those aged 16-34 were significantly less likely (40%) than those aged 35-54 (63%) to choose their laptop as their most important internet device, and significantly more likely than other age groups (at 35%) to choose their smartphone. This reflects the fact that one in five (20%) 16-34 year olds in Wales access the internet exclusively on their smartphone, compared to the UK averages of 4% for all ages and 9% for 16-34 year olds.
Device preferences reflect, in part, take-up of devices; we consider device importance by ownership in Chapter 4 of the UK Communications Market Report.
Figure 4.4 Most important device for accessing the internet in Wales
Source: Ofcom research, Q1 2013 Base: Internet users aged 16+ (n = 2918 UK,, 361 Wales, 172 Wales urban, 189 Wales rural, 130 16-34, 126 35-54, 105 55+, 191 ABC1, 170 C2DE, 109 under £17.5K, 129 £17.5K+). Question: Which is the most important device you use to connect to the internet, at home or elsewhere? “Other” responses include: “Netbook”, “Games console”, “Other device”, “None” and “don’t know”.
4.3 Internet use
Internet users in Wales claim to spend significantly less time online than the UK average
According to research conducted for Ofcom’s Adult Media Literacy Report, internet users in Wales claim to spend 13.6 hours on the internet per week. This is significantly lower than the UK average of 16.8 hours. Following a similar pattern as the rest of the UK, internet users claim to spend the majority of their time online at home, followed by their workplace or place of education, and the least time online in any other location.
46 52 53 51 4063 55 55 49 42
59
28 17 16 2012
13 3318 16 22
1315 19 21 14
3513 3
15 24 29 148 9 7 12 10 8 8 10 7 2 14
0%
20%
40%
60%
80%
100%
UK
Wal
es
Wal
esU
rban
Wal
esR
ural
16-3
4
35-5
4
55+
AB
C1
C2D
E
Und
er
£17.
5K
£17.
5K+
Urbanity Age Group Social Group Household Income
Other
Tablet
Smartphone
Desktop
Laptop
Individuals (%)

64
Figure 4.5 Claimed time spent on the internet in a typical week
Source: Ofcom research, fieldwork carried out by Saville Rossiter-Base in September to November 2012 IN6A-C – How many hours in a typical week would you say you use the internet at home/ at your workplace or place of education/ anywhere else? (Unprompted responses, single coded) Base: All adults aged 16+ who use the internet at home or elsewhere (1381 UK, 857 England, 183 Scotland, 177 Wales, 164 Northern Ireland). Significance testing shows any difference between any nation and the UK.
Two-fifths of broadband users in Wales shopped online in the past week
Almost nine in ten internet users (86%) in Wales use the internet for general browsing and surfing, and of the more specific activities asked about, sending and receiving email (78%) is the most popular, with 67% of internet users having done this in the past week.
Purchasing goods and services online is the second most popular specific use of the internet (62%), with two in five broadband users having done this in the past week (37%). Visiting social networking sites (51%) and internet banking (42%) are other popular weekly activities among internet users in Wales.
Figure 4.6 Use of online applications among broadband users in Wales
Source: Ofcom research, Q1 2013 Base: Adults aged 16+ who use the internet at home or elsewhere (n= 361 Wales 2013) QE5. Which, if any, of these do you use the internet for? Note figures in the chart below are not directly comparable to figures on internet from previous years due to changes in question wording
Hours per week
8.5
11.7
10.9
9.6
10.9
2.1
4.1
4.2
2.9
4.1
1.1
2.5
1.8
1.1
1.8
11.7
18.3
16.9
13.6
16.8
0 4 8 12 16 20
N Ireland
Scotland
England
Wales
UK
At home At workplace/ place of education Anywhere else
Individuals (%)
2810
1720
1719
142122
1629
4251
3767
7695
36
55
610
814
118
1514
1010
2511
102
51415
2226272728
323031
4352
6162
7886
97
0% 20% 40% 60% 80% 100%
Streamed audio servicesRealtime gambling/auctions
Listening to radioFinding/ downloading info for college
Instant messagingDownloading music/f ilms/video clips
Uploading/ adding content to internetFind health information
Playing gamesWatching video clips/ webcasts
Using local council/ Government websitesTV/ Video viewing
BankingUsing social networking sites
Purchasing goods/servicesSending and receiving email
General surf ing/browsingAny
Used in the past weekUse less often

65
5 Telecoms and networks 5 5.1 Recent developments in Wales
Superfast Cymru
The Welsh Government and BT are working together to deliver the Superfast Cymru programme, the largest partnership of its kind in the UK. Superfast Cymru seeks to build on commercial fibre roll-out, with the aim of providing 96% of premises across Wales with access to fibre broadband by 2016. The Superfast Cymru programme will use a combination of public and private funds to deliver broadband to parts of Wales that are not covered by commercial plans; it increases the total investment in fibre broadband in Wales.
The fibre broadband roll-out will begin during 2013/14 in two-thirds of unitary authorities in Wales: Blaenau Gwent, Bridgend, Caerphilly, Denbighshire, Flintshire, Gwynedd, Isle of Anglesey, Merthyr Tydfil, Neath Port Talbot, Newport, Powys, Rhondda Cynon Taff, Swansea and the Vale of Glamorgan. Roll-out will be underway in all unitary authorities by 2014/15.
Broadband support scheme
The Welsh Government Minister for Economy, Science and Transport, Edwina Hart AM, announced in March 2013 that the Broadband Support Scheme would be extended for an additional six months. The scheme provides a grant of up to £1,000 to those who live in ‘not-spots’ and ‘slow-spots’ throughout Wales to help them find alternative broadband solutions e.g. satellite or wireless.
5.2 Availability of fixed broadband services
LLU broadband availability in Wales was the second highest among the UK nations at the end of 2012
Almost all UK premises are connected to an ADSL-enabled BT local exchange, although some may not be able to receive ADSL broadband services, or may be able to do so only at very slow speeds, as a result of the long length or poor quality of the line from the premises to the local exchange.
BT has just under 5,600 local exchanges, of which around 30 were not able to provide ADSL broadband at the end of 2012. Most of the BT local exchanges that are not capable of providing ADSL broadband are in Scotland (the remainder being in England) and the proportion of premises connected to an ADSL-enabled BT exchange is marginally lower in Scotland than in the rest of the UK (Figure 5.1).
Local loop unbundling (LLU) operators are able to provide fixed telecoms services by placing their own network equipment in the incumbent’s local exchange. This is then connected to the LLU provider’s backhaul network and ADSL broadband services are provided to the end user over the copper line from the exchange, which is leased from the incumbent operator. LLU operators generally benefit from economies of scale that are not available when purchasing wholesale services on a per-unit basis, and are better able to differentiate their services from those offered by their competitors. Premises in LLU-enabled exchange areas benefit, as they usually have a greater choice of ADSL broadband services, and access to lower-cost services.

66
We estimate that 94% of UK premises were connected to an unbundled BT local exchange at the end of 2012, two percentage points higher than had been the case a year previously. This increase was largely due to LLU providers deploying services in rural areas: while the proportion of premises connected to an LLU-enabled local exchange in urban areas was unchanged at 99% during the year, the proportion in rural areas increased by over eight percentage points, to 72%. This pattern is typical of telecoms network deployment: roll-out usually begins in urban areas (where there are larger numbers of premises and therefore potential customers), and subsequently spreads to less densely populated areas. In fact, urban LLU availability was at a similar level to current rural availability as far back as 2006.
Wales had the second-highest availability of LLU broadband at the end of 2012, when 93% of premises were connected to an LLU-enabled BT local exchange. Across the UK nations this proportion ranged from 85% in Northern Ireland to 95% in England (in Scotland it was 87%).
Figure 5.1 Proportion of premises connected to ADSL and LLU-enabled exchanges: December 2012
Sources: Ofcom/BT, December 2012 data
Wales had the lowest availability of cable broadband services among the UK nations at the end of 2012
As part of its work to monitor the UK’s communications infrastructure, Ofcom collects data which show the total number of premises that are in postcodes in which one or more premise can receive services from cable and fibre broadband networks. This methodology is likely to slightly overestimate the coverage of these networks, as not all premises in a postcode will necessarily be able to receive the same services.
Data provided to Ofcom by Virgin Media show that 48% of UK premises were in postcodes that were served by its cable broadband network in June 2013 (Figure 5.2). Among the UK nations, the proportion of premises in postcodes served by Virgin Media’s cable broadband network was lowest in Wales, at 22%, and highest in England at 51%. All of Virgin Media’s cable network is able to provide broadband speeds of ‘up to’ 100Mbit/s, and Virgin Media is rolling out an upgrade to ‘up to’ 120Mbit/s; due to be completed by the end of 2013.
99.9
8
100.
00
99.8
6
100.
00
100.
00
100.
00
99.9
8
100.
00
100.
00
100.
00
99.9
9
100.
00
100.
00
100.
00
100.
00
99.9
1
94 95 87 93 85 100
95 89 94 95 93 96 96 98 99
72
0
20
40
60
80
100
UK
Eng
land
Sco
tland
Wal
es
N Ir
elan
d
Lond
on SE
SW EM
WM EE
Y&
H
NE
NW
UK
Urb
an
UK
Rur
al
All ADSL
LLU ADSL
Proportion of premises (per cent)

67
Figure 5.2 Proportion of premises in postcodes served by Virgin Media’s cable broadband network
Sources: Ofcom/Virgin Media, June 2013 data
Wales had the second-lowest availability of fibre broadband among the UK nations in June 2013
Data provided to Ofcom by BT Openreach and Kcom (the incumbent operator in the Kingston-upon-Hull area) show that over half of UK premises (56%) were in postcodes that were served by their fibre broadband networks by June 2013 (Figure 5.3). Once again, this is likely to slightly overstate the availability of fibre broadband services, as different premises in the same postcode may be served by different street cabinets, and one cabinet may have been upgraded while another has not.
In Wales, 41% of premises were in postcodes served by BT Openreach’s fibre network by June 2013, the second-lowest proportion across the UK nations after Scotland (25%). The proportion of premises that were served by BT Openreach/ Kcom’s fibre networks was highest (at 93%) in Northern Ireland, which has benefitted from a Department of Enterprise, Trade and Investment (DETI) initiative to increase the availability of superfast broadband services.
Figure 5.3 Proportion of premises in postcodes served by BT Openreach/ Kcom fibre broadband networks
Sources: Ofcom/BT Openreach/Kcom, June 2013 data
48 5138
22 28
6846 36
51 6048 44 48 54 51
200
20
40
60
80
UK
Eng
land
Sco
tland
Wal
es
N Ir
elan
d
Lond
on SE
SW EM
WM EE
Y&
H
NE
NW
UK
Urb
an
UK
Rur
al
Proportion of premises (per cent)
Proportion of premises (per cent)
56 59
2541
9376 70
50 53 4964
49 47 56
0
20
40
60
80
100
UK
Eng
land
Sco
tland
Wal
es
N Ir
elan
d
Lond
on SE
SW EM
WM EE
Y&
H
NE
NW
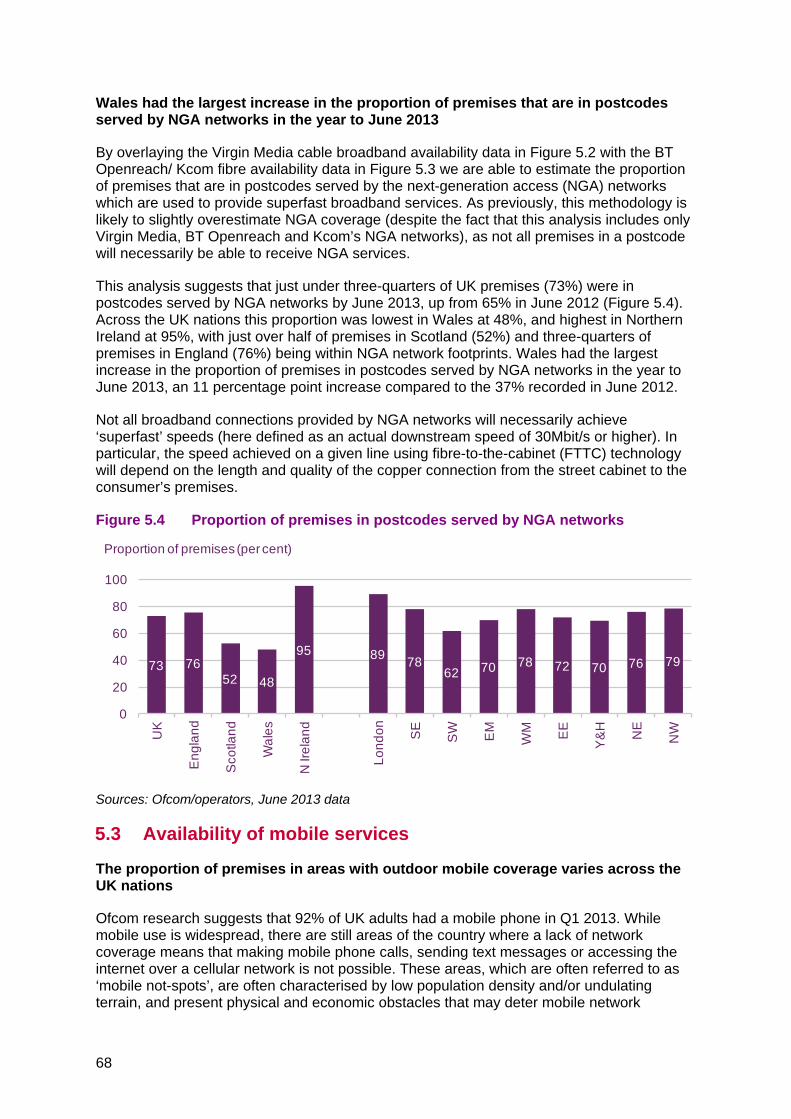
68
Wales had the largest increase in the proportion of premises that are in postcodes served by NGA networks in the year to June 2013
By overlaying the Virgin Media cable broadband availability data in Figure 5.2 with the BT Openreach/ Kcom fibre availability data in Figure 5.3 we are able to estimate the proportion of premises that are in postcodes served by the next-generation access (NGA) networks which are used to provide superfast broadband services. As previously, this methodology is likely to slightly overestimate NGA coverage (despite the fact that this analysis includes only Virgin Media, BT Openreach and Kcom’s NGA networks), as not all premises in a postcode will necessarily be able to receive NGA services.
This analysis suggests that just under three-quarters of UK premises (73%) were in postcodes served by NGA networks by June 2013, up from 65% in June 2012 (Figure 5.4). Across the UK nations this proportion was lowest in Wales at 48%, and highest in Northern Ireland at 95%, with just over half of premises in Scotland (52%) and three-quarters of premises in England (76%) being within NGA network footprints. Wales had the largest increase in the proportion of premises in postcodes served by NGA networks in the year to June 2013, an 11 percentage point increase compared to the 37% recorded in June 2012.
Not all broadband connections provided by NGA networks will necessarily achieve ‘superfast’ speeds (here defined as an actual downstream speed of 30Mbit/s or higher). In particular, the speed achieved on a given line using fibre-to-the-cabinet (FTTC) technology will depend on the length and quality of the copper connection from the street cabinet to the consumer’s premises.
Figure 5.4 Proportion of premises in postcodes served by NGA networks
Sources: Ofcom/operators, June 2013 data
5.3 Availability of mobile services
The proportion of premises in areas with outdoor mobile coverage varies across the UK nations
Ofcom research suggests that 92% of UK adults had a mobile phone in Q1 2013. While mobile use is widespread, there are still areas of the country where a lack of network coverage means that making mobile phone calls, sending text messages or accessing the internet over a cellular network is not possible. These areas, which are often referred to as ‘mobile not-spots’, are often characterised by low population density and/or undulating terrain, and present physical and economic obstacles that may deter mobile network
Proportion of premises (per cent)
73 7652 48
95 89 7862 70 78 72 70 76 79
0
20
40
60
80
100
UK
Eng
land
Sco
tland
Wal
es
N Ir
elan
d
Lond
on SE
SW EM
WM EE
Y&
H
NE
NW

69
operators (MNOs) from installing mobile phone masts in these areas. In other areas of the UK, some operators have installed masts and provide a mobile service where other operators do not have a presence, leading to the creation of ‘partial not-spots’.
How we measure the availability of mobile telephony for this report The coverage information presented in Ofcom’s Communications Market Reports and Infrastructure Report is collected by Ofcom from the four MNOs. Information on coverage is provided by each operator for each 200x200m pixel of landmass across the UK. This information is correlated with maps of premises to give the premises coverage figures.
The availability figures quoted all refer to outdoor coverage. Coverage figures for indoor reception are likely to be lower, because radio signals are attenuated as they pass through the fabric of buildings. Indoor reception is highly dependent on the building in which reception is desired, and where the user is located in the building, making it difficult to calculate accurate indoor coverage figures.
Figure 5.5 and Figure 5.6 show in detail levels of mobile coverage based on premises (i.e. homes and offices) for 2G and 3G services respectively. 3G is often considered the minimum necessary to provide a satisfactory experience of mobile internet, while 2G is considered satisfactory for telephone calls and text messaging. Mobile network operator Everything Everywhere (EE) launched 4G mobile services in the UK in October 2012, but we do not include details of 4G mobile coverage here.
98.8% of premises in Wales were in areas with outdoor 2G coverage in June 2013
The coverage data provided to us by MNOs shows that by June 2013, 94.1% of premises had outdoor coverage from all three UK 2G network operators (EE, O2 and Vodafone) (Figure 5.5). In total, 99.6% of premises were in areas where at least one mobile network provided outdoor 2G coverage, suggesting that 0.4% of UK premises (around 100,000 premises) were in areas without any 2G mobile coverage. The proportion of premises in areas with outdoor 2G coverage recorded in June 2013 is slightly lower than the 99.7% figure, calculated from 2011 data, that was included in the 2012 Communications Market Reports, and we are investigating this discrepancy.
2G coverage was slightly higher than average in England in June 2013, when 99.8% of premises were in areas with outdoor 2G mobile coverage. Wales had the second lowest proportion of premises with outdoor coverage from all three 2G networks in June 2013, at 87.0%, while 1.2% of premises in Wales (around 20,000 premises) were in areas without 2G coverage. The lower-than-average network coverage in Wales is a reflection of its hilly terrain, which restricts the propagation of mobile signals. Northern Ireland had the lowest 2G population coverage across the UK nations, with 81.0% having outdoor coverage from all three networks, and 1.5% being in areas without any 2G coverage.
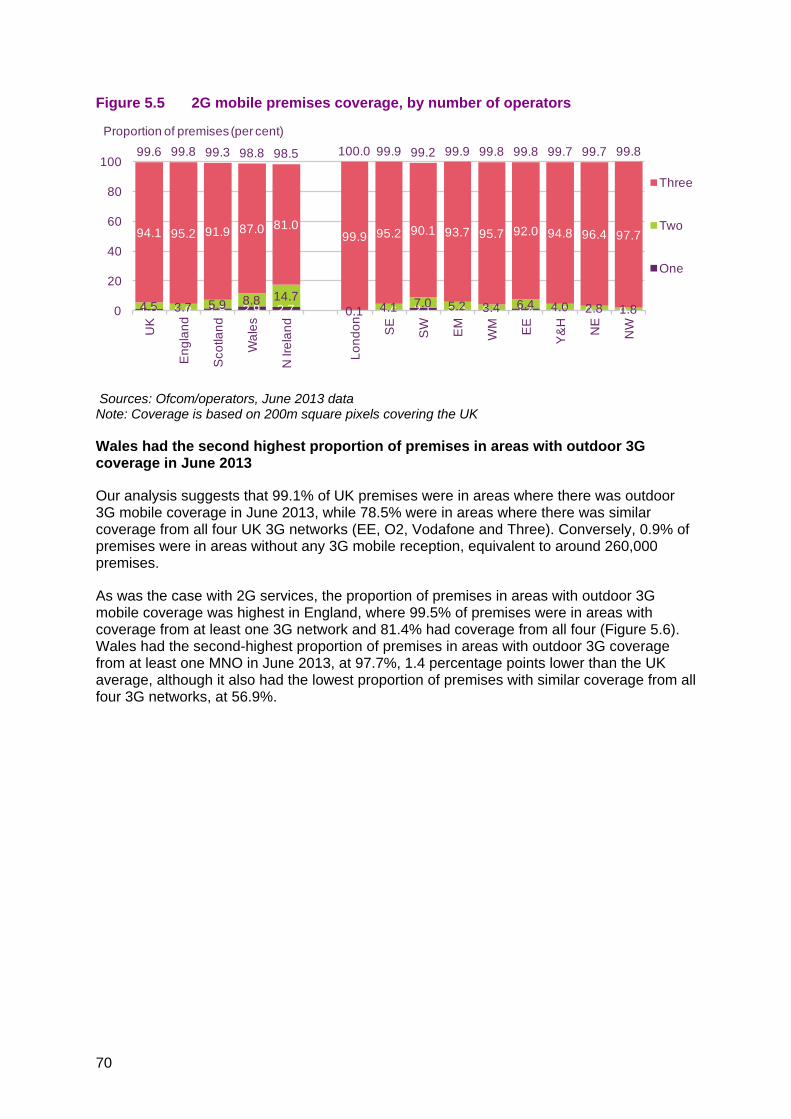
70
Figure 5.5 2G mobile premises coverage, by number of operators
Sources: Ofcom/operators, June 2013 data Note: Coverage is based on 200m square pixels covering the UK
Wales had the second highest proportion of premises in areas with outdoor 3G coverage in June 2013
Our analysis suggests that 99.1% of UK premises were in areas where there was outdoor 3G mobile coverage in June 2013, while 78.5% were in areas where there was similar coverage from all four UK 3G networks (EE, O2, Vodafone and Three). Conversely, 0.9% of premises were in areas without any 3G mobile reception, equivalent to around 260,000 premises.
As was the case with 2G services, the proportion of premises in areas with outdoor 3G mobile coverage was highest in England, where 99.5% of premises were in areas with coverage from at least one 3G network and 81.4% had coverage from all four (Figure 5.6). Wales had the second-highest proportion of premises in areas with outdoor 3G coverage from at least one MNO in June 2013, at 97.7%, 1.4 percentage points lower than the UK average, although it also had the lowest proportion of premises with similar coverage from all four 3G networks, at 56.9%.
1.0 0.8 1.5 2.9 2.7 0.6 2.1 0.9 0.7 1.4 0.9 0.6 0.44.5 3.7 5.9 8.8 14.70.1 4.1 7.0 5.2 3.4 6.4 4.0 2.8 1.8
94.1 95.2 91.9 87.0 81.099.9 95.2 90.1 93.7 95.7 92.0 94.8 96.4 97.7
99.6 99.8 99.3 98.8 98.5 100.0 99.9 99.2 99.9 99.8 99.8 99.7 99.7 99.8
0
20
40
60
80
100U
K
Eng
land
Sco
tland
Wal
es
N Ir
elan
d
Lond
on SE
SW EM
WM EE
Y&
H
NE
NW
Three
Two
One
Proportion of premises (per cent)

71
Figure 5.6 3G mobile premises coverage, by number of operators
Sources: Ofcom/operators, June 2013 data Note: Coverage is based on 200m square pixels covering the UK
5.4 Service take-up
Take-up of fixed line and broadband services are lower than average in Wales
Landline and overall broadband take-up were both below the UK averages for these services in Wales in Q1 2013 (Figure 5.7). The difference between take-up levels in Wales and the UK average was greatest for broadband services, where the proportion of adults in Wales who had a fixed or mobile broadband connection (66%) was nine percentage points lower than the UK average (75%), as a result of fixed broadband take-up in Wales (63%) being lower than the UK average of 72%. Fixed line take-up in Wales (76%) was eight percentage points lower than the UK average of 84%.
Mobile phone take-up remained high in Wales in Q1 2013, with over nine in ten adults (92%) having a mobile phone in Q1 2013, identical to the UK average. Smartphone take-up in Wales (49%) was also in line with the UK average (51%), and Wales had the highest proportion of homes that were mobile-only across the UK nations, at 23%.
1.2 0.8 2.4 2.8 4.6 0.5 2.2 0.9 0.7 1.6 0.9 0.7 0.57.7 6.115.2 19.9 10.3
4.714.6 7.9 5.9 10.2 6.2 7.4 2.8
11.7 11.210.0
18.020.5
12.415.7 21.1
10.916.9 15.2 11.6
3.7
78.5 81.4 69.056.9 61.9
99.582.3
65.9 69.882.1 70.7 77.0 79.7
92.5
99.1 99.5 96.6 97.7 97.4 100.0 99.8 98.4 99.7 99.6 99.4 99.3 99.3 99.5
0
20
40
60
80
100U
K
Eng
land
Sco
tland
Wal
es
N Ir
elan
d
Lond
on SE
SW EM
WM EE
Y&
H
NE
NW
Four
Three
Two
One
Proportion of premises (per cent)

72
Figure 5.7 Take-up of communications services, 2013
QC1. Is there a landline phone in your home that can be used to make and receive calls?/ QD2. Do you personally use a mobile phone?/ QD24B. Do you personally use a smartphone?/ QE1. Does your household have a PC or laptop computer?/ QE2. Do you or does anyone in your household have access to the internet/ world wide web at home?/ QE9. Which of these methods does your household use to connect to the Internet at home?/ QD28A. Which if any, of the following activities, other than making and receiving voice calls, do you use your mobile for? Source: Ofcom research, Q1 2013 Base: All adults aged 16+ (n = 3750 UK, 492 Wales, 2250 England, 501 Scotland, 507 Northern Ireland, 247 Wales urban, 245 Wales rural)
Two-thirds of households in Wales have a broadband connection
Sixty-six per cent of households in Wales had a broadband connection in Q1 2013, nine percentage points less than the UK average of 75% (Figure 5.8). Household broadband take-up has remained stable in Wales since Q1 2011, and was the lowest among the devolved nations in Q1 2013.30 In rural areas of Wales 73% of homes had access to broadband in Q1 2013, in line with the UK average, although take-up was lower than average in urban areas of Wales, at 64%.
The proportion of homes in Wales with fixed broadband increased by six percentage points to 59% in the year to Q1 2013, although this is still below the UK average of 70%. As was the case across the UK as a whole, the use of mobile broadband fell in Wales over the same period (in the case of Wales down by nine percentage points to 7%). As there was an increase in the proportion of households that only accessed the internet using a smartphone during the same period, it is likely that some consumers are now using smartphones instead of dongles to access the internet.
30 The differences in total broadband take-up between Q1 2011, Q1 2012 and Q1 2013 are not statistically significant at a 95% confidence level. Differences in total broadband take-up in Q1 2013 between Wales and both England and Northern Ireland are statistically significant.
UK Wales England Scotland N Ireland Wales urban Wales rural
IndividualVoice telephony Fixed Line 84% 76% 85% 83% 82% 74% 86%
Mobile phone 92% 92% 92% 92% 94% 92% 91%Smartphone 51% 49% 52% 45% 45% 50% 48%Mobile-only homes 15% 23% 15% 16% 18% 26% 13%
Internet Total Internet 80% 75% 81% 76% 78% 74% 81%Broadband (fixed and mobile)
75% 66% 76% 70% 74% 64% 73%
Fixed Broadband 72% 63% 73% 67% 71% 62% 67%Mobile Broadband 5% 7% 5% 7% 5% 7% 8%Mobile internet 49% 47% 49% 44% 45% 46% 49%

73
Figure 5.8 Consumer broadband take-up in Wales, by connection type
Source: Ofcom research, Q1 2013 Base: All adults aged 16+ (n = 3750 UK, 492 Wales, 2250 England, 501 Scotland, 507 Northern Ireland, 247 Wales urban, 245 Wales rural, 811 Wales 2008, 987 Wales 2009, 1075 Wales 2010, 493 Wales 2011, 513 Wales 2012, 492 Wales 2013) QE9. Which of these methods does your household use to connect to the internet at home? (NB 2008 survey did not cover mobile broadband. 2008 measure shows any broadband)
Older, and lower-income, households are least likely to have broadband in Wales
Consumers in Wales over the age of 65 (35%) and those living in households with an annual income of less than £17.5k (47%) were the least likely to have broadband access in Q1 2013, reflecting the pattern seen across the UK as a whole (Figure 5.9). There were differences in broadband take-up between those over the age of 65 (35%) and over the age of 55 (52%) in Wales, although the largest differences between Wales and the UK average was among the 16 to 34 age group (67% and 80% respectively), C2DE households (52% and 63%), and households with children (77% and 88%).
Figure 5.9 Consumer broadband take-up in Wales, by demographic
Source: Ofcom research, Q1 2013 Base: All adults aged 16+ (n =492 Wales, 140 16-34s, 234 35-64s, 118 65+, 225 ABC1, 267 C2DE, 185 <£17.5k income, 141 £17.5k+, 172 children in home, 320 no children in home) QE9. Which of these methods does your household use to connect to the internet at home?
Households (%)
70 5971 63 69 58 64
45 46 48 54 53 59
23
24 2
4 2
9 910 10 3
34
33 3
3 63 7
6 6 4
7566
7670 74
6473
4558
6471 68 66
0 %
20 %
40 %
60 %
80 %
100 %
UK Wales Eng-land
Scot-land
N Ireland
WalesUrban
WalesRural
2008 2009 2010 2011 2012 2013
Nations 2013 Urbanity Wales
Mobile broadband only Fixed and mobile broadband Fixed broadband only
Households (%)
66 6779
52
35
82
52 47
8877
59
75 8087
58
42
86
6354
90 88
67
0%
20%
40%
60%
80%
100%
Nation 16-34 35-54 55+ 65+ ABC1 C2DE <£17.5k £17.5k+ Yes No
Age group Social group Household income
Children in household?
Wales UK

74
Wales has the highest proportion of mobile-only households among the UK nations
Just less than one in four households in Wales (23%) solely used mobile phones to make and receive calls in the home in Q1 2013, a three percentage point increase compared to the previous year (Figure 5.10). Just over seven in ten households in Wales (71%) used both fixed and mobile telephone services, while a further 5% used only a fixed line. Over a quarter (26%) of households in urban areas of Wales were mobile-only in Q1 2013, an increase of four percentage points compared to Q1 2012, and twice the proportion recorded in rural areas (13%).
Figure 5.10 Cross-ownership of household telephony services
QC1. Is there a landline phone in your home that can be used to make and receive calls?/ QD1. How many mobile phones in total do you and members of your household use? Source: Ofcom research, Q1 2013 Base: All adults aged 16+ (n = 3750 UK, 492 Wales, 2250 England, 501 Scotland, 507 Northern Ireland, 247 Wales urban, 245 Wales rural, 811 Wales 2008, 987 Wales 2009, 1075 Wales 2010, 493 Wales 2011, 513 Wales 2012, 492 Wales 2013)
Over half of mobile users in Wales have a smartphone
As was the case across the UK, smartphone adoption continued to increase in Wales in the year to Q1 2013, when over half (54%) of mobile phone users in Wales used a smartphone, a 12 percentage point increase compared to Q1 2012 (Figure 5.11). Among the UK nations, Wales had the second highest smartphone take-up among mobile users in Q1 2013, after England (57%), and smartphone take-up increased in both urban and rural areas of Wales during the year, with the increase being higher in rural areas (at 17 percentage points) than in urban ones (11 percentage points).
79 71 80 76 78 6981
70 71 72 73 74 71
55
5 7 45
69 11 7 7 6 5
15 23 15 16 18 2613 19 16 19 19 20 23
0%
20%
40%
60%
80%
100%
UK 2013 Wales 2013
England 2013
Scotland 2013
N Ireland 2013
Wales urban 2013
Wales rural 2013
Wales 2008
Wales 2009
Wales 2010
Wales 2011
Wales 2012
Wales 2013
Neither fixed or mobileMobile only
Fixed only
Fixed and mobile
Figure above bar shows % point change in mobile only from Q1 2012+/-0 +1+3 -1+/-0 +/-0+4

75
Figure 5.11 Take-up of smartphones among mobile users
QD24B. Do you personally use a smartphone? A smartphone is a phone on which you can easily access emails, download files and applications, as well as view websites and generally surf the internet. Popular brands of Smartphone include BlackBerry, iPhone and Android phones such as the Samsung Galaxy. Source: Ofcom research, Q1 2013 Base: Adults aged 16+ who personally use a mobile phone (n = 3387 UK, 440 Wales, 2020 England, 464 Scotland, 463 Northern Ireland, 222 Wales urban, 218 Wales rural, 416 Wales 2011, 456 Wales 2012, 440 Wales 2013)
Contract use remains unchanged in Wales, despite growth in smartphone take-up
Forty-nine per cent of mobile phone users in Wales used pay-as-you-go mobile services in Q1 2013, ten percentage points higher than the UK average (39%). The year to Q1 2013 was the first period since 2008 when there was no decline in pay-as-you-go use in Wales (Figure 5.12). Increasing use of mobile contracts was noted in rural areas of Wales, but not in urban areas: 41% of mobile users in rural areas were using a pay-as-you-go service (eight percentage points lower than in Q1 2012) compared to 51% of those in urban locations (a three percentage point increase since Q1 2012).
Use of pay-as-you-go mobile contracts was lower than average among smartphone users in Wales in Q1 2013, at 27% of users. Pay-monthly contracts are popular among smartphone users as they allow consumers to spread the cost of the handset (which is often hundreds of pounds) across the lifetime of the contract.
56 54 5749 48 54 53
2942
54
0%
10%
20%
30%
40%
50%
60%
UK 2013 Wales 2013
England 2013
Scotland 2013
N Ireland 2013
Wales urban 2013
Wales rural 2013
Wales 2011
Wales 2012
Wales 2013
Figure above bar shows % point change in use of mobile phones from Q1 2012
+13 +11+14+12 +11 +17+10

76
Figure 5.12 Type of mobile subscription
QD11. Which of these best describes the mobile package you personally use most often? (NB 2008 survey did not cover type of contract) Source: Ofcom research, Q1 2013 Base: Adults aged 16+ who personally use a mobile phone (n = 3387 UK, 440 Wales, 2020 England, 464 Scotland, 463 Northern Ireland, 222 Wales urban, 218 Wales rural, 656 Wales 2008, 836 Wales 2009, 923 Wales 2010, 416 Wales 2011, 456 Wales 2012, 440 Wales 2013)
Reported levels of voice over IP use fell in Wales in 2013
Less than one in five adults in Wales (19%) claimed to use voice over IP (VoIP) services in Q1 2013, the lowest proportion recorded across the UK nations (Figure 5.13). As was the case in Scotland, there was a decline in VoIP use in Wales in the year to Q1 2013, which was evident in both rural and urban areas (down by four percentage points and seven percentage points respectively). Across the UK as a whole, 28% of adults claimed to use VoIP in Q1 2013, a two percentage point increase compared to Q1 2012.
39 4938 41 49 51 41
66 64 58 55 48 49
5245
53 53 40 4353
34 3332 42
44 45
0%
20%
40%
60%
80%
100%
UK 2013 Wales 2013
England 2013
Scotland 2013
N Ireland 2013
Wales urban 2013
Wales rural 2013
Wales 2008
Wales 2009
Wales 2010
Wales 2011
Wales 2012
Wales 2013
Unsure
Other
Contract unsure type
Contract SIM only
Contract with handset
Prepay / Pay as you go
Figure above bar shows % point change in prepay from Q1 2012-6 -3 -11+1 -7 -8+3

77
Figure 5.13 Individual use of voice over IP
QE30. Have you or anyone in your household ever used one of these services to make voice calls using the internet?/QE5. Which, if any, of these do you use the internet for? *NB 2013 measure combines responses from internet users (at QE5A) and all UK adults (at QE30), data not comparable with previous years. *NB Question wording for QE5A-B prior to 2013 asked about household use of the internet at home. In 2013 QE5A-B asked about individual use of the internet anywhere. Source: Ofcom research, Q1 2013 Base: All adults aged 16+ (n = 3750 UK, 492 Wales, 2250 England, 501 Scotland, 507 Northern Ireland, 247 Wales urban, 245 Wales rural, 811 Wales 2008, 987 Wales 2009, 1075 Wales 2010, 493 Wales 2011, 513 Wales 2012, 492 Wales 2013)
5.5 Satisfaction with telecoms services
Satisfaction with mobile reception remains high in Wales
Satisfaction levels with communication services in Wales were comparable to the UK averages in Q1 2013, with over four in five adults saying they were satisfied with their fixed line and mobile telephony services. Overall satisfaction with mobile services was high, with over nine in ten (94%) of mobile users being either ‘very’ or ‘fairly’ satisfied with their service, and satisfaction with mobile reception (86%) also remained high (Figure 5.14). But although satisfaction levels were high, they were below those reported in Wales in Q1 2012.
Satisfaction with fixed-line services was also high, with just under nine in ten (88%) of landline users being satisfied, five percentage points lower than in Q1 2012. Levels of satisfaction with fixed broadband services (85%) were also high, although, again, this was lower than the figure recorded in Q1 2012 (91%). Satisfaction with the speed of fixed broadband connections was lower than overall satisfaction, with three in four adults (75%) saying they were either ‘very’ or ‘fairly’ satisfied, down from 83% in 2012.
Proportion of individuals with broadband at home
2819
2921
2719 19
11 13 15 1423 19
0%
20%
40%
60%
80%
0%
10%
20%
30%
40%
UK 2013 Wales 2013
England 2013
Scotland 2013
N Ireland 2013
Wales urban 2013
Wales rural 2013
Wales 2008
Wales 2009
Wales 2010
Wales 2011
Wales 2012
Wales 2013
Use of VoIP
Broadband penetration (%)
Individual use of VoIP
Figure above bar shows % point change in current use of VoIP from Q1 2012
+2 -4 +2 +3-3 -7-4

78
Figure 5.14 Satisfaction with mobile reception
QD21c. Thinking about your mobile phone service only, how satisfied are you with (main supplier) for reception/ accessing network? Source: Ofcom research, Q1 2013 Base: Adults aged 16+ who personally use a mobile phone (n = 3387 UK, 440 Wales, 2020 England, 464 Scotland, 463 Northern Ireland, 222 Wales urban, 218 Wales rural, 645 Wales 2008, 836 Wales 2009, 923 Wales 2010, 416 Wales 2011, 456 Wales 2012, 440 Wales 2013) Note: Figures above chart columns indicate the proportion of people who were ‘very’ or ‘fairly’ satisfied with their mobile reception
Satisfaction with ability to connect to the internet via a mobile network is lowest in Wales
Just over four in five mobile users in Wales (81%) were either ‘very’ or ‘fairly’ satisfied with their ability to access the internet using 3G in Q1 2013, lower than the 88% average recorded across all of the UK nations (Figure 5.15). Around half of mobile users in Wales (47%) claimed to be ‘very’ satisfied with their ability to access 3G services, the lowest level among the UK nations and five percentage points lower than the UK average of 52%.
Figure 5.15 Satisfaction with ability to connect to the internet via a 3G or 4G network
QD21k. Thinking about your mobile phone service only, how satisfied are you with (main supplier) for ability to connect to the internet using the mobile network (3G or 4G)? Source: Ofcom research, Q1 2013 Base: Adults aged 16+ who personally use a smartphone (n = 1683 UK, 212 Wales, 1052 England, 220 Scotland, 199 Northern Ireland, 108 Wales urban, 104 Wales rural) Note: Figures above chart columns indicate the proportion of people who were ‘very’ or ‘fairly’ satisfied with the ability to connect to the internet using the mobile network
Figure above bar shows % point change in total satisfied from Q1 2012
56 53 56 57 51 53 55 60 57 53 55 48 53
32 33 32 34 31 34 30 29 32 34 32 41 33
88 86 89 90 83 87 85 89 90 87 87 89 86
0%20%40%60%80%
100%
UK 2013 Wales 2013
England 2013
Scotland 2013
N Ireland 2013
Wales urban 2013
Wales rural 2013
Wales 2008
Wales 2009
Wales 2010
Wales 2011
Wales 2012
Wales 2013
Fairly satisfied Very satisfied
-1 +/-0 -5-3 +/-0 +2-3
52 4765
50 55 47 50
36 3428
37 29 34 31
8881
93 88 84 81 81
0%
20%
40%
60%
80%
100%
UK 2013 Wales 2013 Scotland 2013
England 2013
N Ireland 2013
Wales urban 2013
Wales rural 2013
Fairly satisfied
Very satisfied

79
Decline in satisfaction with speed of fixed broadband service in Wales
Seventy-five per cent of fixed broadband users in Wales said that they were ‘very’ or ‘fairly’ satisfied with the speed of their fixed broadband service in Q1 2013, eight percentage points lower than the 83% recorded in Q1 2012, and 12 percentage points less than the Q1 2011 figure of 87% (Figure 5.16). Similarly, in the year to Q1 2013 the proportion of fixed broadband users in Wales who claimed to be ‘very’ satisfied with the speed of their service fell from 43% to 34%.
The decline in satisfaction with fixed broadband speeds in Wales in the year to Q1 2013 was driven by falling satisfaction in urban areas, where just under three in four fixed broadband users (74%) were either ‘very’ or ‘fairly’ satisfied with the speed of their service in Q1 2013. This was 11 percentage points lower than the Q1 2012 figure of 85%, and the proportion who were ‘very satisfied’ fell from 43% to 34%. This compares to the 82% of fixed broadband users in rural areas who were satisfied with their fixed broadband speed in Q1 2013, an increase of five percentage points compared to Q1 2012. In the year to Q1 2012 the opposite had been true, and falling satisfaction with fixed broadband speeds had reflected falling satisfaction in rural areas.
Figure 5.16 Satisfaction with speed of fixed broadband connection
QE8b. Thinking about your fixed broadband internet service, how satisfied are you with (main supplier) for the speed of your service while online (not just the connection)? Source: Ofcom research, Q1 2013 Base: Adults aged 16+ with a fixed broadband connection at home (n = 2548 UK, 294 Wales, 1562 England, 341 Scotland, 351 Northern Ireland, 140 Wales urban, 154 Wales rural, 386 Wales 2008, 527 Wales 2009, 604 Wales 2010, 303 Wales 2011, 318 Wales 2012, 294 Wales 2013) Note: Figures above chart columns indicate the proportion of people who were ‘very’ or ‘fairly’ satisfied with their speed of service while online
41 36 43 32 35 34 4360 48 47 45 42 36
39 39 38 50 43 3939
21 37 35 43 41 39
81 75 81 82 78 7482 82 85 82 87 83
75
0%
20%
40%
60%
80%
100%
UK 2013 Wales 2013
England 2013
Scotland 2013
N Ireland 2013
Wales urban 2013
Wales rural 2013
Wales 2008
Wales 2009
Wales 2010
Wales 2011
Wales 2012
Wales 2013
Fairly satisfied Very satisfied
Figure above bar shows % point change in total satisfied from Q1 2012
+5-11+1 +1+1-8 -3


81
6 Post 6 6.1 Sending and receiving post in Wales: residential customers
Residents in Wales are more likely to say they love sending and receiving post
When asked about their attitudes to post, nearly two-thirds of adults in Wales said they loved sending and receiving letters and cards (65%), higher than any other UK nation (Figure 6.1).
However, this does not appear to be driven by their sending mail - people in Wales only send an average of 6.7 items each month, compared to 8 items for people living in England.
Figure 6.1 Attitudes to sending and receiving post
Source: Ofcom Residential Postal Tracker, Q3 2012-Q1 2013 Base: All respondents (n = 3671 UK, 399 Wales) QH2A-H. SHOWCARD - AGREEMENT WITH STATEMENTS ABOUT SENDING/ RECEIVING POST
People in Wales are more likely to have reduced, and to expect to continue to reduce, the amount of post they send
When asked whether the amount of post they send has changed recently, people in Wales are the most likely to say they now send less post (-15% net). They also anticipate that they will reduce their use of post for sending letters, cards and parcels in the future (-16% net).
30%
46%
49%
52%
53%
56%
59%
60%
36%
38%
54%
56%
47%
65%
58%
61%
0% 20% 40% 60% 80%
I send fewer letters due to cost
I only use post if there is no alternative
I would feel cut off from society if I can't send/receive post
I only send mail first class if it needs to get there next day
I prefer to send emails rather than letters
I love to send and receive letters and cards
I trust second class post to get there in reasonable timeframe
I prefer to send letters or emails to companies rather than make a phone call
WalesUK

82
Figure 6.2 Net claimed change in amount of post sent in past two years
Source: Ofcom Residential Postal Tracker, Q3 2012-Q1 2013 Base: All respondents (n = 3671 UK, 2109 England, 613 Scotland, 399 Wales, 550 N Ireland) QC10: Compared with two years ago, would you say that the number of items you send through the post has...increased greatly, increased slightly, stayed the same, decreased slightly, decreased greatly?( Multiple choice) Note: chart shows net percentage (% who claim their use has increased - % those who claim their use has decreased)
Figure 6.3 Change in amount of post predicted to be sent in the next two years
Source: Ofcom Residential Postal Tracker, Q3 2012-Q1 2013 Base: All respondents (n = 3671 UK, 2109 England, 613 Scotland, 399 Wales, 550 N Ireland) QC16: Looking to the future... Compared with now, would you say that the number of letters, cards and parcels you will be sending in the post two years from now will have.....increased greatly, increased slightly, stayed the same, decreased slightly, decreased greatly? Note: chart shows net percentage (% who claim their use will increase - % those who claim their use will decrease)
People in Wales receive the most items of post and are more likely than the UK as a whole to have ordered goods to be delivered
When asked about the amount of post they have received in the past week, people in Wales claim to have received the highest average number of items (10), especially when compared to residents in Scotland (4.8).
This is perhaps due to the high propensity of people living in Wales to order items for delivery by post; Figure 6.5 shows that over three-quarters of residents have done this compared to just 69% across the UK as a whole.
-9% -9%-12%
-15%-10%
-20%
-10%
0%
10%
20%
UK England Scotland Wales N Ireland
-8% -7% -9%
-16%
-7%
-20%
-10%
0%
10%
20%
UK England Scotland Wales N Ireland

83
Figure 6.4 Approximate number of items received by post in the past week
Source: Ofcom Residential Postal Tracker, Q3 2012-Q1 2013 Base: All adults aged 16+ (n = 3671 UK, 2109 England, 613 Scotland, 399 Wales, 550 Northern Ireland) QD1. Approximately how many items of post - including letters, cards and parcels - have you personally received in the last week?
Figure 6.5 Proportion of consumers who have ordered items to be delivered by post
Source: Ofcom Residential Postal Tracker, Q3 2012-Q1 2013 Base: All respondents (n = 3671 UK, 2109 England, 613 Scotland, 399 Wales, 550 N Ireland) QD8. Do you ever order items to be delivered to you through the post? IF YES Have you ever had to return any goods you bought which were delivered to you by post?
6.2 Attitudes towards Royal Mail
Nine in ten residents in Wales are satisfied with Royal Mail
When asked about their overall satisfaction levels with Royal Mail, the majority of people in Wales (90%) say they are satisfied, compared to 86% across the UK as a whole.
This appears to be primarily driven by satisfaction with delivery times (Figure 6.6). However, people in Wales are less satisfied with the closeness of post boxes to home or work.
8 7 185 11
16 15
24
1117
17 18
15
1417
34 3528
3735
17 18 922
136 6 1 8 7
0%
25%
50%
75%
100%
UK England Scotland Wales N Ireland
Don't know
21+ items
11-20 items
5-10 items
3 or 4 items
1 or 2 items
None
Items of post received per month (% of respondents)8.5 4.8 10.0 7.4
Mean number of items received per week8.9
30 31 29 24 28
40 3858
53 41
29 3113 23 30
1 2
0%
25%
50%
75%
100%
UK England Scotland Wales N Ireland
Don't know
Yes but have not returned any goodsYes, and have returned some goodsDo not order items for delivery by post
Proportion of respondents (%)69% 71% 76% 71%
Total proportion who order items to be delivered69%

84
Figure 6.6 Satisfaction with specific aspects of Royal Mail’s service
Source: Ofcom Residential Postal Tracker, Q3 2012-Q1 2013 Base: All respondents (n = 3671 UK, 399 Wales) QE3A-K. SHOWCARD - SATISFACTION WITH ASPECTS OF ROYAL MAIL'S SERVICE *Base: All respondents (from Q1 2013) (n = 1224 UK, 138 Wales)
6.3 Sending and receiving post: business customers
Almost three-quarters of business in Wales spend less than £1k on post each year
Businesses in Wales are the most likely to say that post plays a mainly administrative role, especially when compared to businesses in Northern Ireland (57% v 48%). Perhaps as a consequence, nearly three-quarters of businesses (73%) in Wales spend less than £1k each year on sending post (Figure 6.7).
Figure 6.7 Monthly spend on sending postal items
Source: Ofcom Business Postal Tracker, Q3 2012-Q1 2013 Base: All respondents (n = 1218 UK, 804 England, 144 Scotland, 134 Wales, 136 N Ireland) QV1. On average, how much money does your organisation spend per month on sending mail items? Please think about all the letters, packets and parcels you may send as an organisation.
52%
71%
78%
80%
81%
81%
83%
84%
85%
89%
94%
53%
79%
70%
72%
84%
86%
84%
81%
89%
75%
99%
0% 20% 40% 60% 80% 100%
Cost of postage
Time of day post is delivered
Number of post boxes and Post offices
Location of post boxes and Post Offices
Length of time to reach its destination
Reliability / consistency of delivery time*
Last collection time of the post box you tend to use*
Number of days a week your post box is emptied*
Security of the service
Closeness of post box to home/work*
Number of days post is delivered each week*
WalesUK
Monthly spend (% of respondents)
69 68 68 73 70
18 18 22 14 15
8 8 6 6 86 6 6 6 7
0%
20%
40%
60%
80%
100%
UK England Scotland Wales N Ireland
£420< (more than £5k pa)
£209-£420 (£2.5k-£5k pa)
£83-£208 (£1k-£2.5k pa)
<£83 (less than £1k per annum)

85
Businesses in Wales are the least likely to have switched some mail to other communication methods in the past year
When asked if their organisation had moved some of its mail to another form of communication over the past 12 months, 61% of respondents in Wales said that they had (Figure 6.8), less than in other UK nations. Among those who have, they are more likely to say this is for reasons of speed, rather than as a cost-saving exercise.
In addition, when asked about the volume of mail they plan to send over the next 12 months, only 7% of businesses in Wales say they anticipated sending fewer items.
Figure 6.8 Amount of businesses switching to other forms of communication over the past year
Source: Ofcom Business Postal Tracker, Q3 2012-Q1 2013 Base: All respondents (n = 1218 UK, 804 England, 144 Scotland, 134 Wales, 136 N Ireland) QF4. Over the last 12 months, has your organisation moved some mail to other communication methods?
Proportion of respondents (%)
72% 72% 77%61% 70%
28% 28% 23%39% 30%
0%
20%
40%
60%
80%
100%
UK England Scotland Wales N Ireland
No
Yes


![EXECUTIVE SUMMARY - New South Wales€¦ · Web viewBUSINESS CASE [APPLICANT] [INSERT VERSION][INSERT DATE] ... the development of a Stakeholder and Communications Plan is recommended](https://img.pdfslide.us/doc/110x75/5edf5101ad6a402d666aaaab/executive-summary-new-south-wales-web-view-business-case-applicant-insert-versioninsert.jpg)