Embed Size (px)
Citation preview
Communicating Impact
Telling Your Story: Part 1

2

3
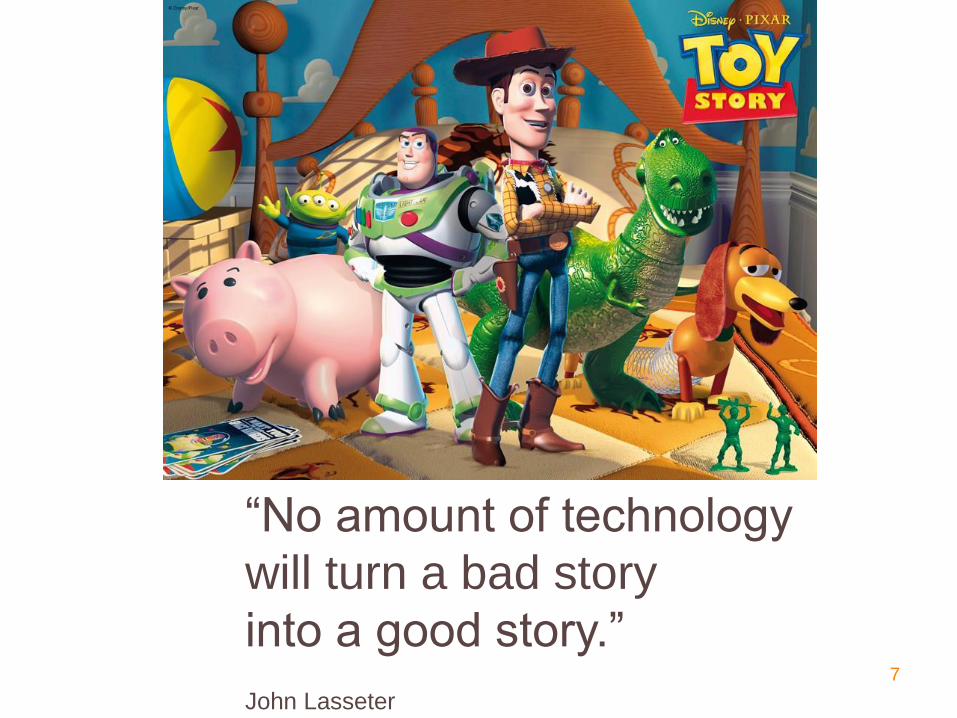
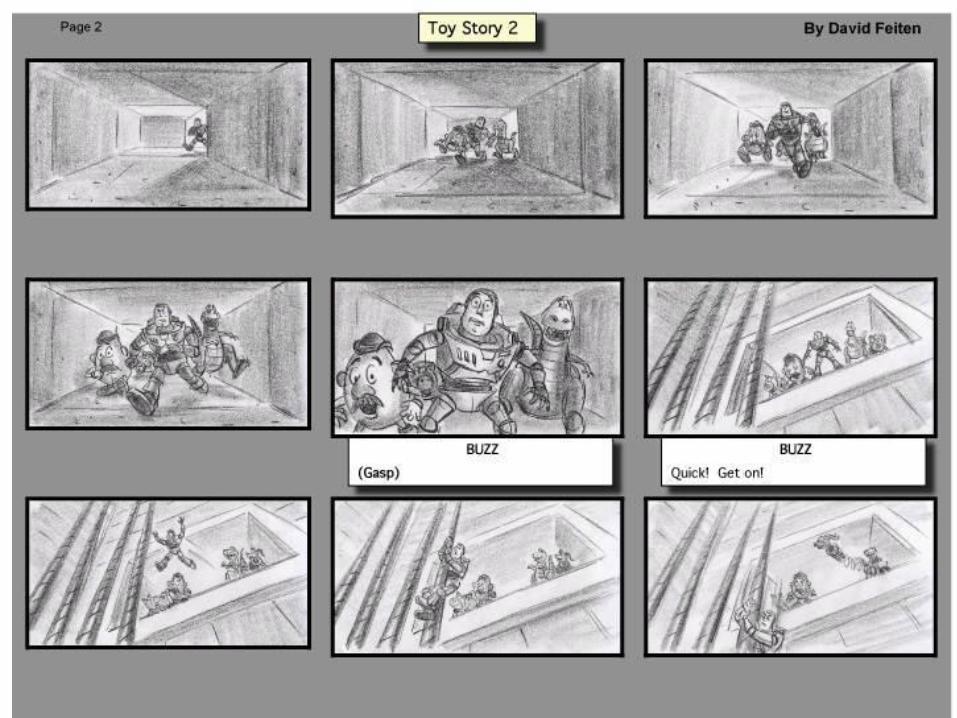
“No amount of technology
will turn a bad story
into a good story.”
John Lasseter

Communicating Impact
Telling Your Story: Part 1
Ventures’ Story
7
“No amount of technology
will turn a bad story
into a good story.”
John Lasseter
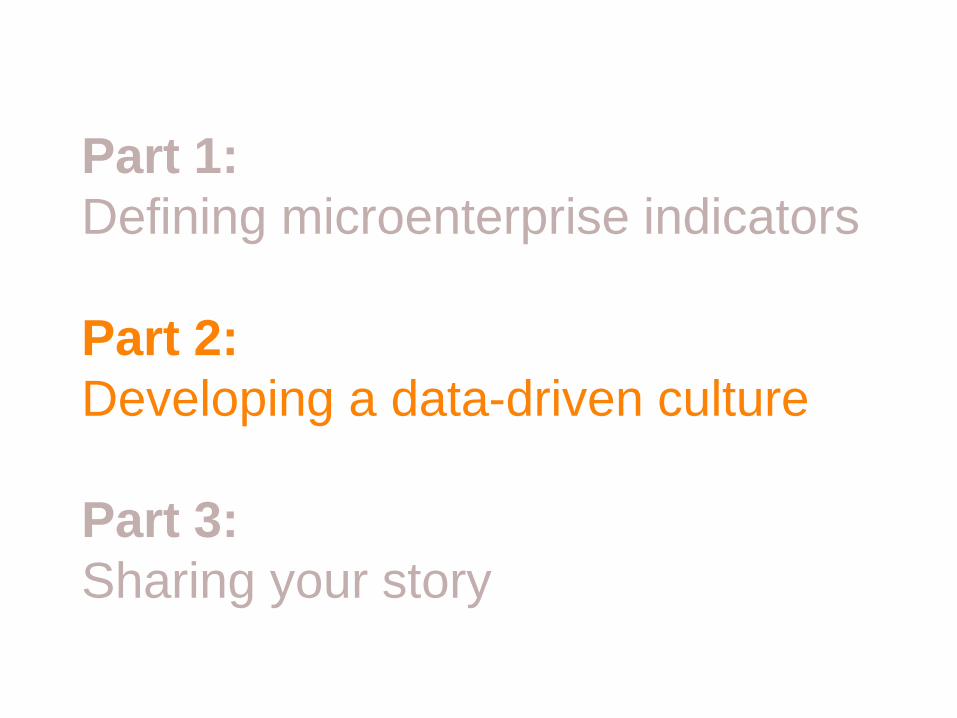
Part 1:
Defining microenterprise indicators
Part 2:
Developing a data-driven culture
Part 3:
Sharing your story
Part 1:
Defining microenterprise indicators
Part 2:
Developing a data-driven culture
Part 3:
Sharing your story
10
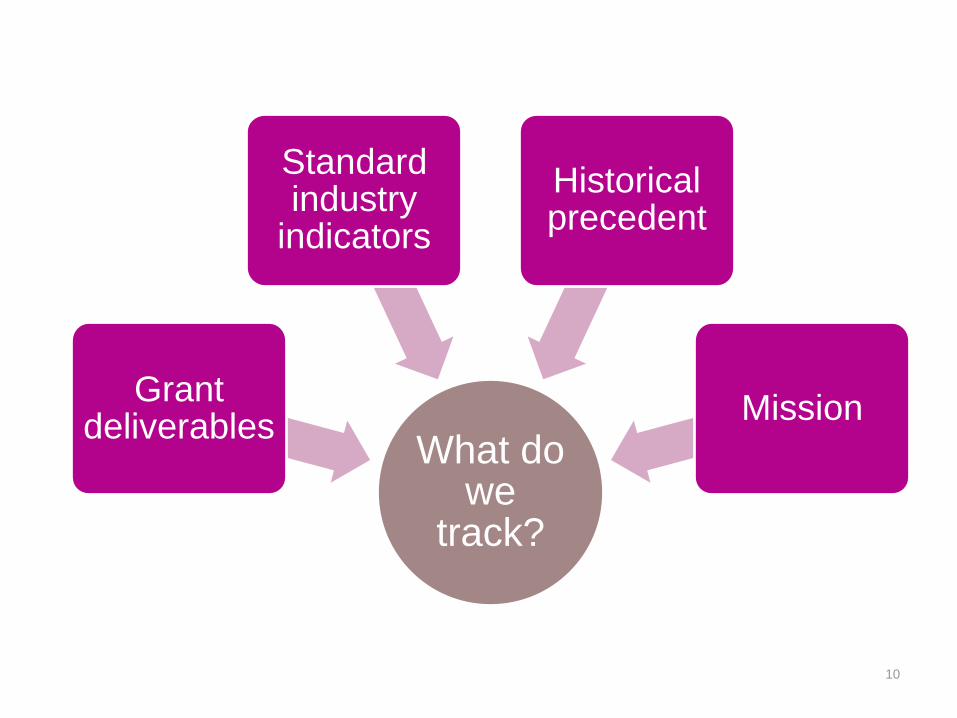
What do we
track?
Grant deliverables
Standard industry
indicators
Historical precedent
Mission
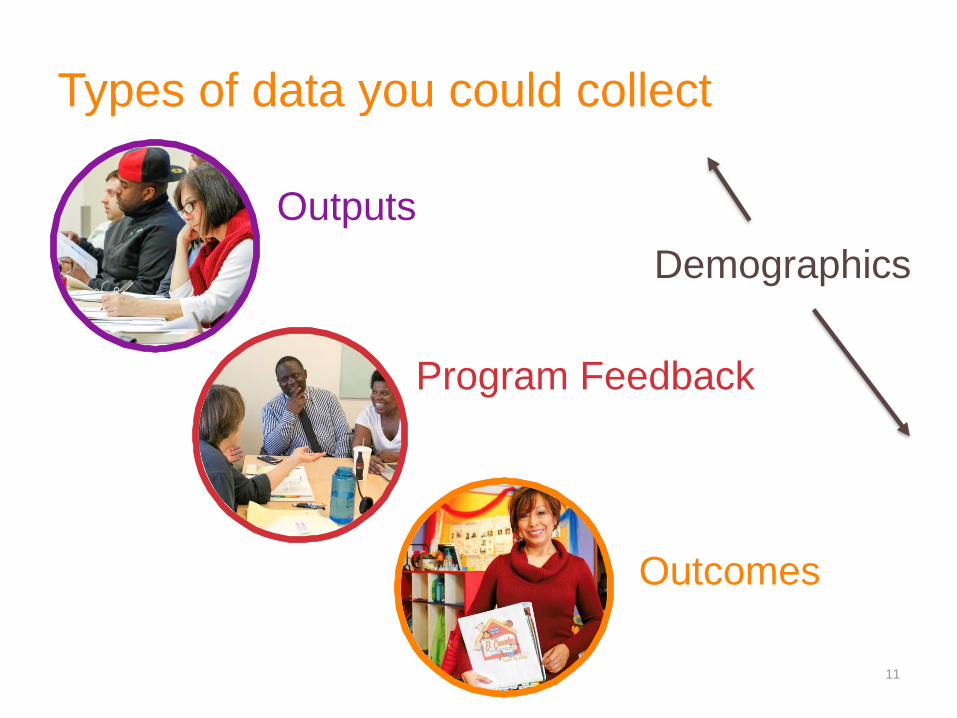
Types of data you could collect
11
Outputs
Demographics
Program Feedback
Outcomes
What story do you want
to tell?
12
13
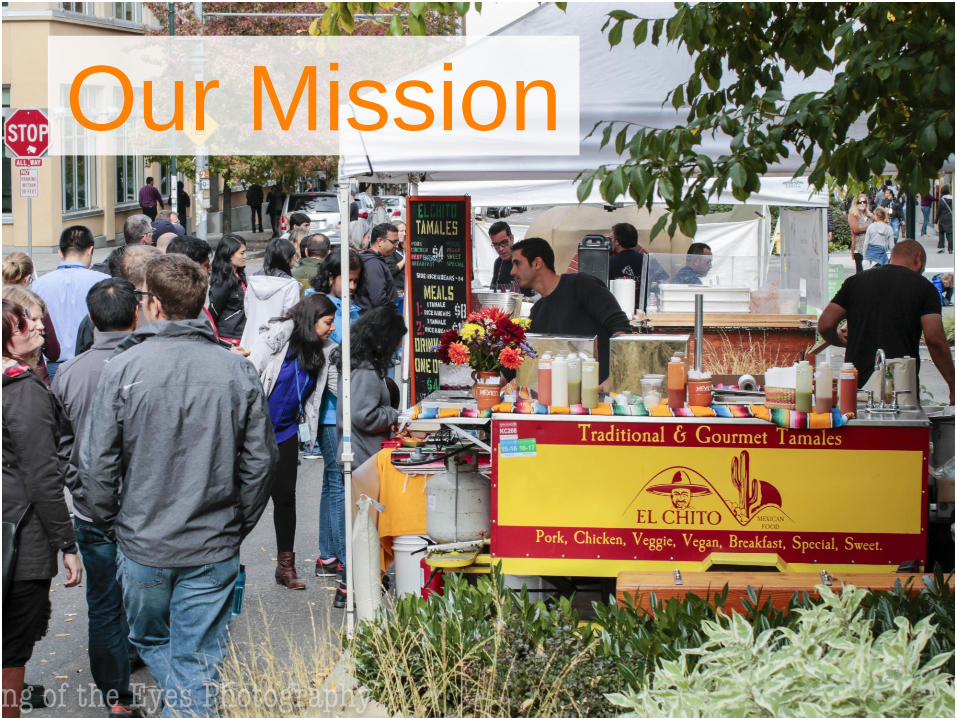
Our Mission
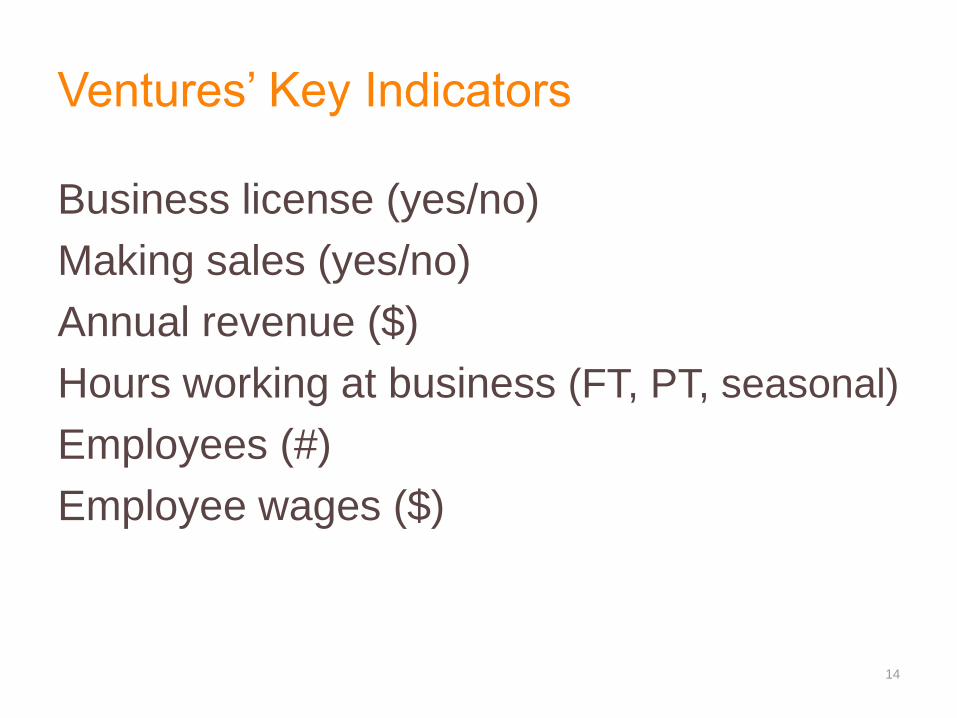
Ventures’ Key Indicators
Business license (yes/no)
Making sales (yes/no)
Annual revenue ($)
Hours working at business (FT, PT, seasonal)
Employees (#)
Employee wages ($)
14
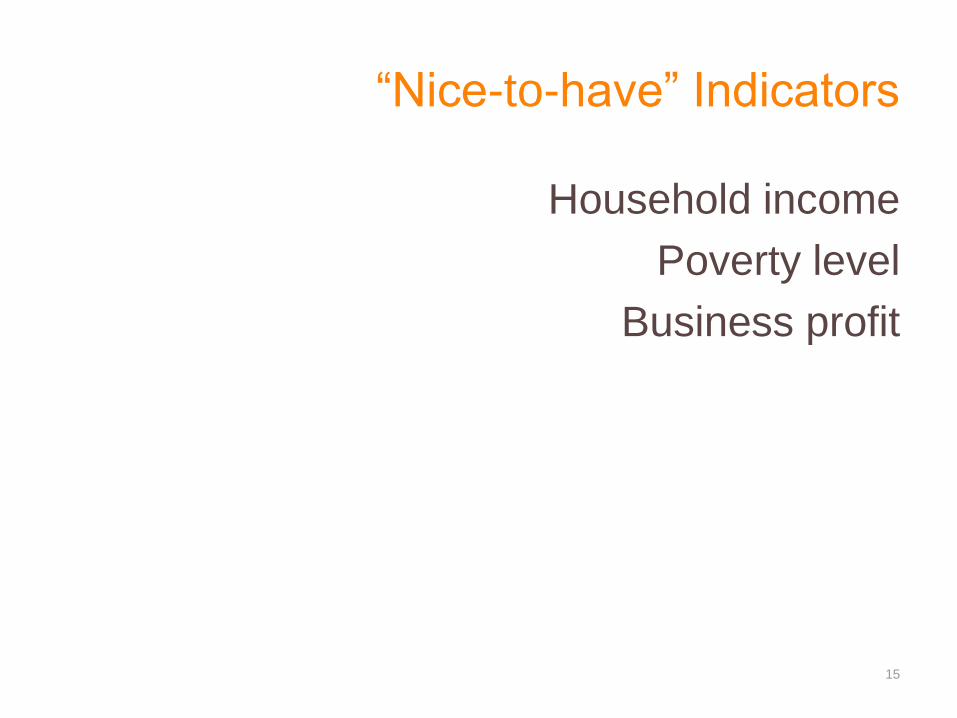
“Nice-to-have” Indicators
Household income
Poverty level
Business profit
15
16
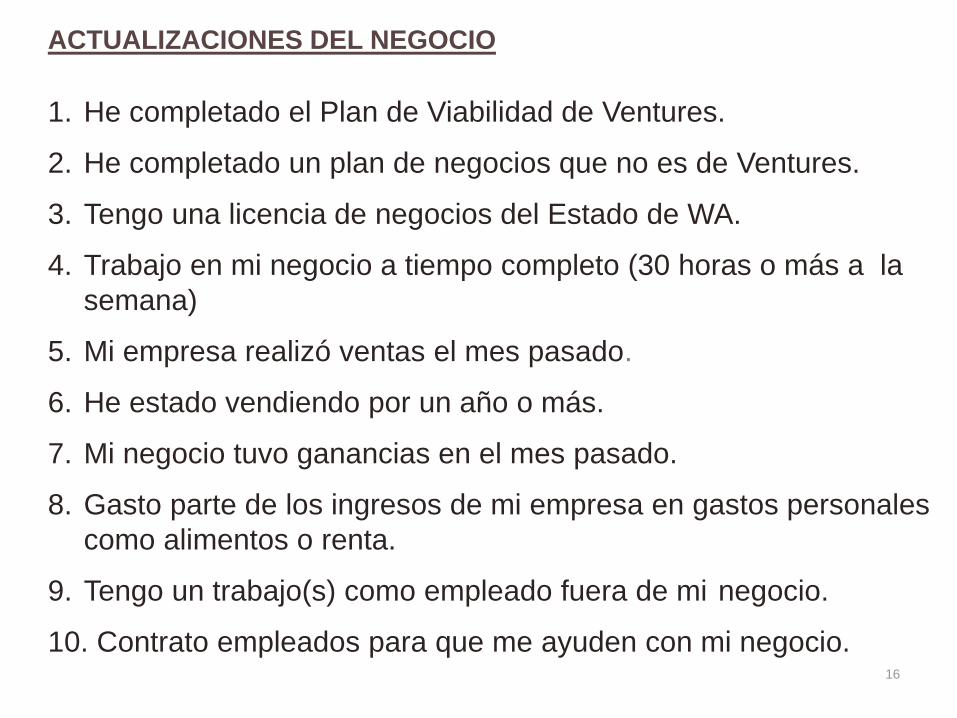
ACTUALIZACIONES DEL NEGOCIO
1. He completado el Plan de Viabilidad de Ventures.
2. He completado un plan de negocios que no es de Ventures.
3. Tengo una licencia de negocios del Estado de WA.
4. Trabajo en mi negocio a tiempo completo (30 horas o más a la
semana)
5. Mi empresa realizó ventas el mes pasado.
6. He estado vendiendo por un año o más.
7. Mi negocio tuvo ganancias en el mes pasado.
8. Gasto parte de los ingresos de mi empresa en gastos personales
como alimentos o renta.
9. Tengo un trabajo(s) como empleado fuera de mi negocio.
10. Contrato empleados para que me ayuden con mi negocio.
17
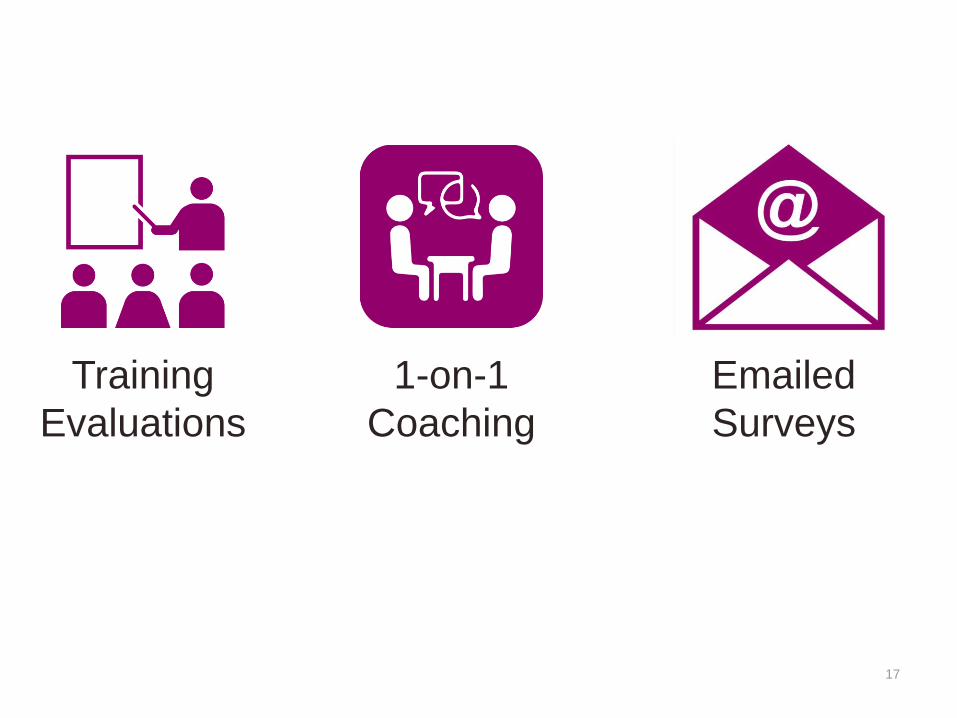
Training
Evaluations
1-on-1
Coaching
Emailed
Surveys

Challenges
18
Asking tough questions
19
Part 1:
Defining microenterprise indicators
Part 2:
Developing a data-driven culture
Part 3:
Sharing your story
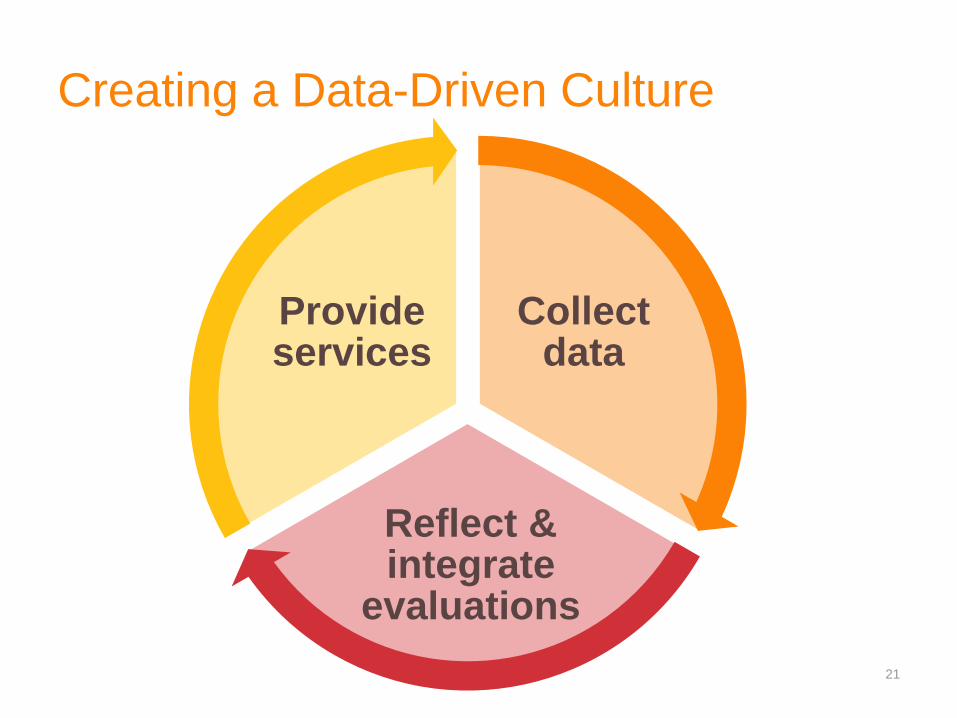
Creating a Data-Driven Culture
21
Collect data
Reflect & integrate
evaluations
Provide services
22
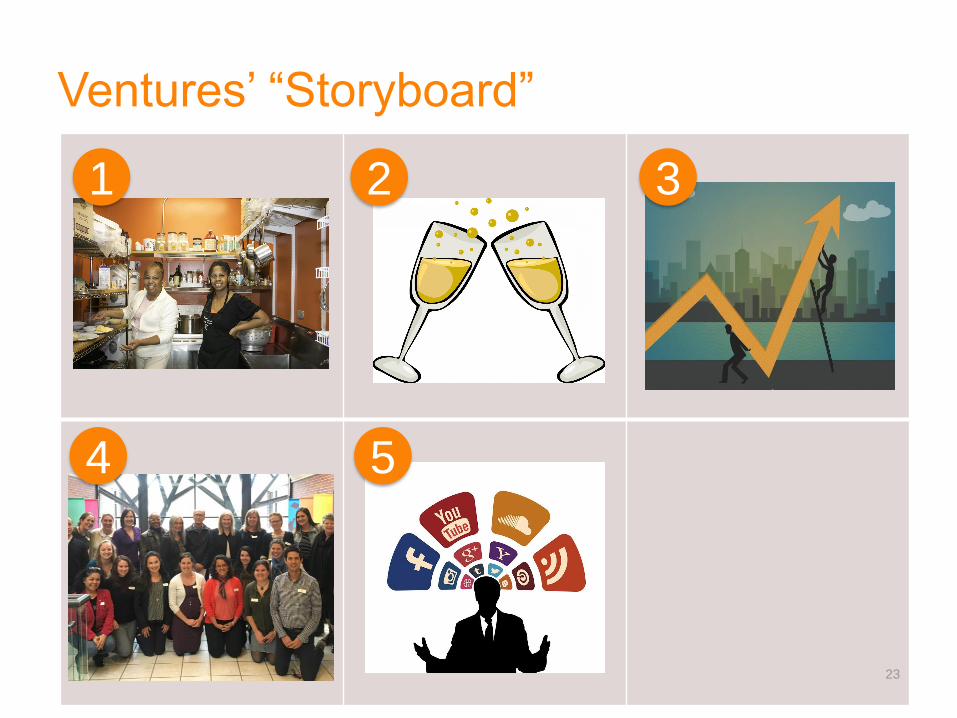
Ventures’ “Storyboard”
23
1 2 3
4 5
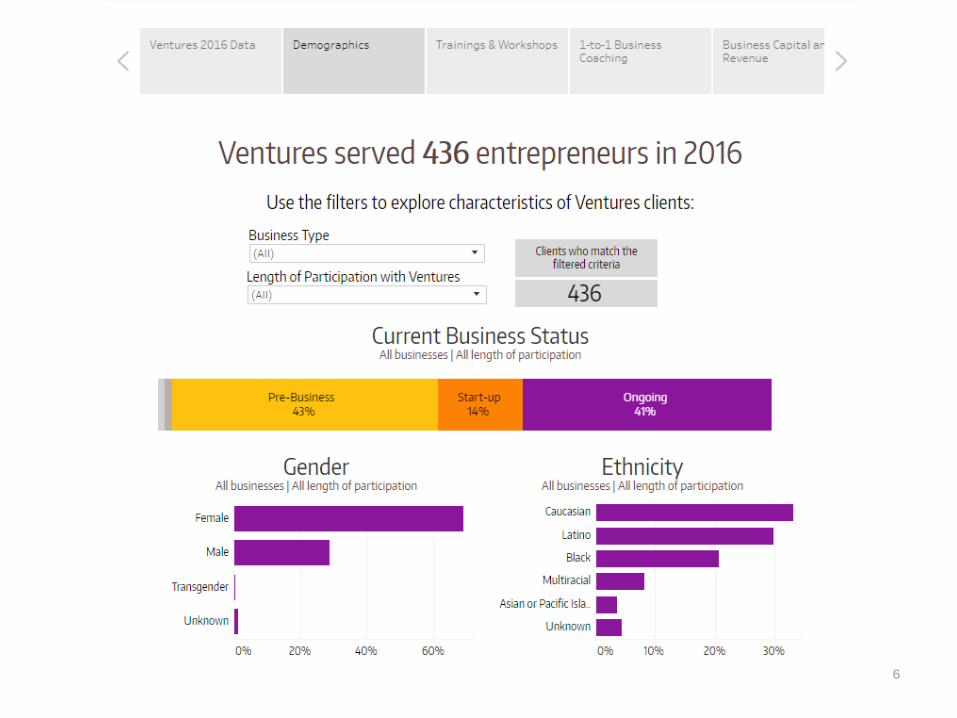
Understand
your clients
24
1
25
1
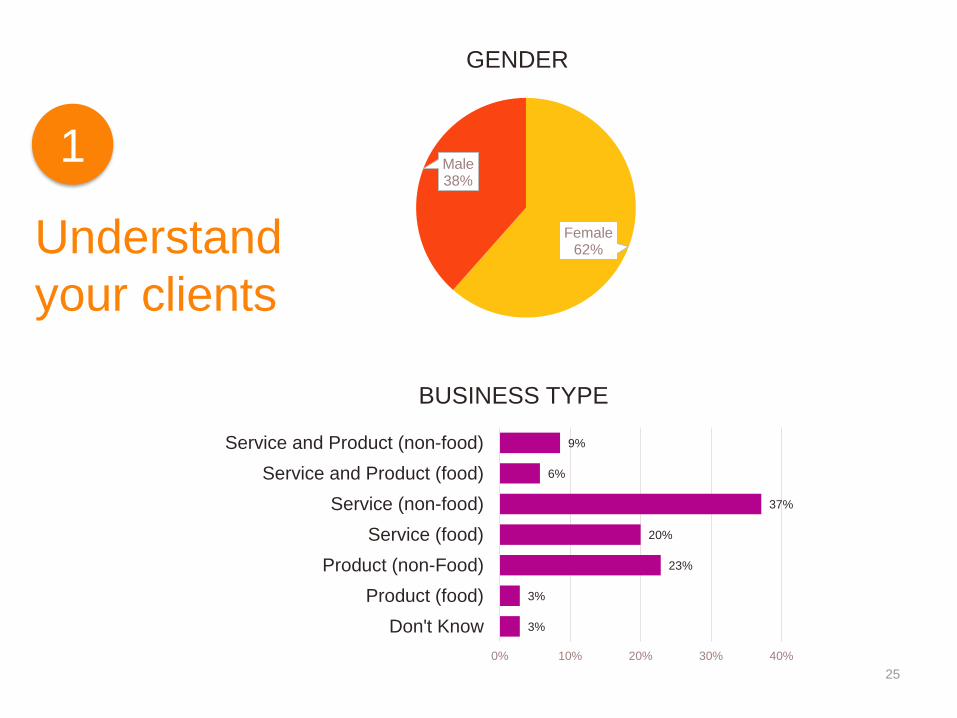
Female62%
Male38%
GENDER
3%
3%
23%
20%
37%
6%
9%
0% 10% 20% 30% 40%
Don't Know
Product (food)
Product (non-Food)
Service (food)
Service (non-food)
Service and Product (food)
Service and Product (non-food)
BUSINESS TYPE
Understand
your clients

Celebrate
success
26
2
27
2
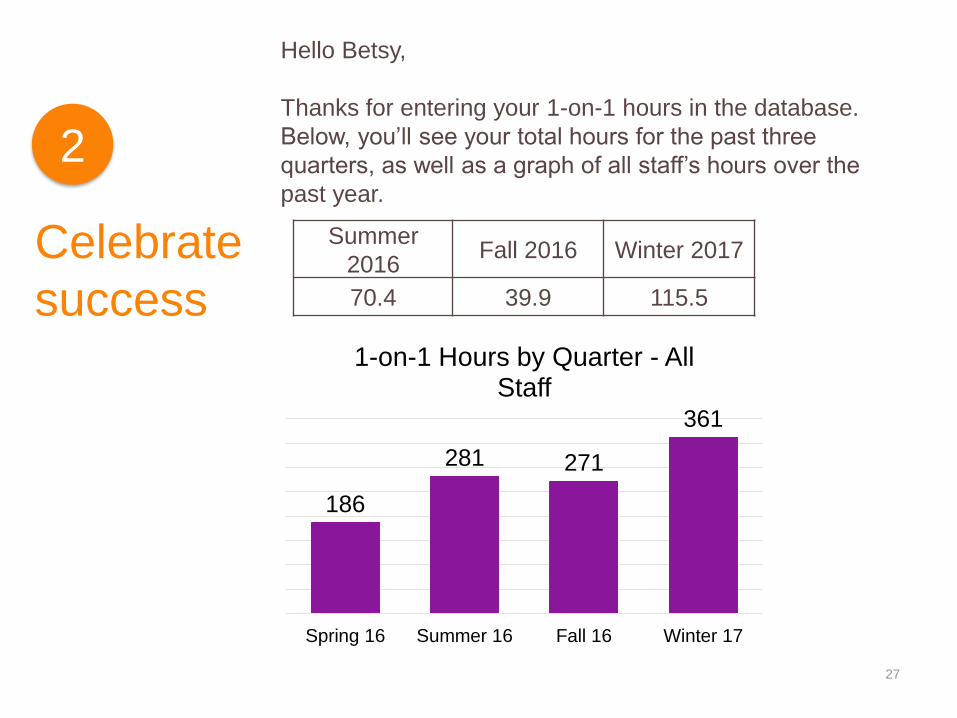
186
281 271
361
Spring 16 Summer 16 Fall 16 Winter 17
1-on-1 Hours by Quarter - All Staff
Summer
2016Fall 2016 Winter 2017
70.4 39.9 115.5
Hello Betsy,
Thanks for entering your 1-on-1 hours in the database.
Below, you’ll see your total hours for the past three
quarters, as well as a graph of all staff’s hours over the
past year.
Celebrate
success
Improve
programs
28
3

Creating a Data-Driven Culture
29
Collect data
Reflect & integrate
evaluations
Provide services
30
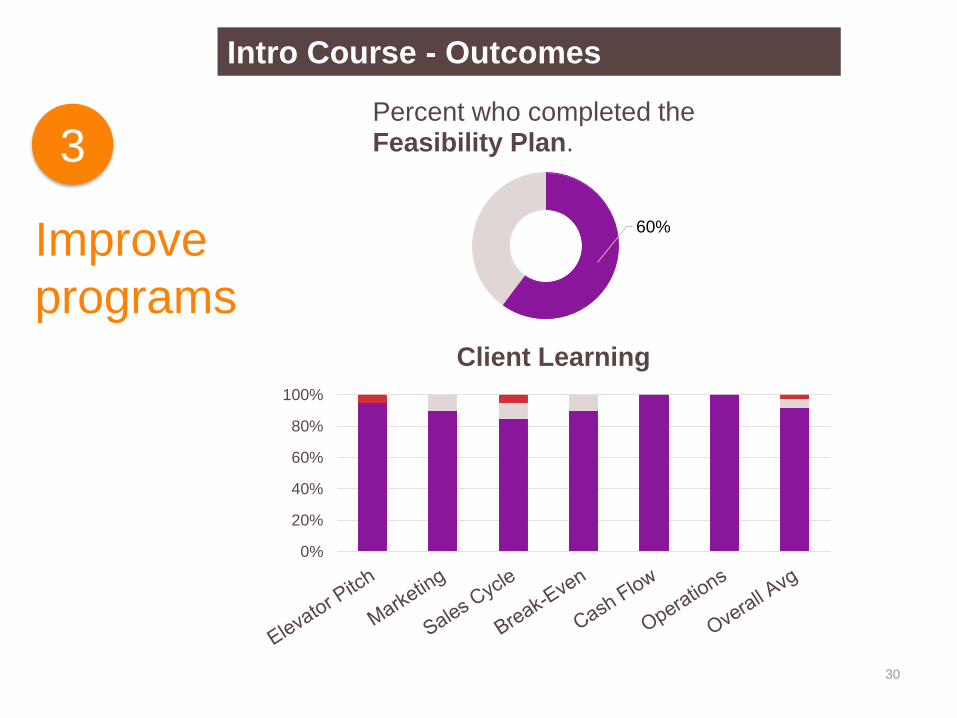
3
60%
Percent who completed the Feasibility Plan.
0%
20%
40%
60%
80%
100%
Client Learning
Intro Course - Outcomes
Improve
programs
Empower
staff
31
4
32
4
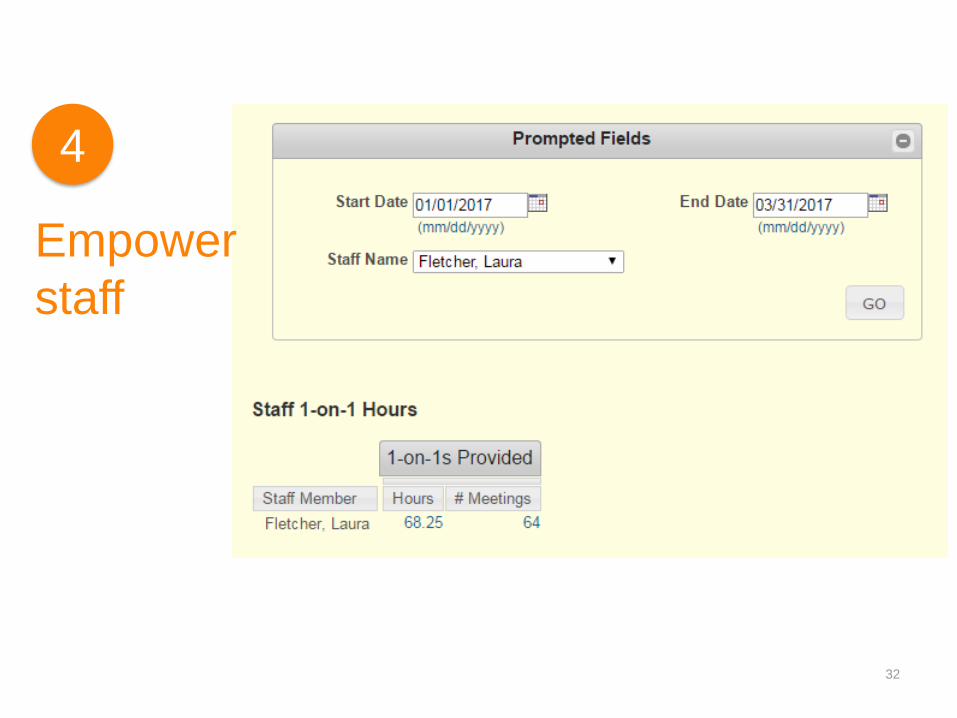
Empower
staff
Communicate
impact
33
5
Part 1:
Defining microenterprise indicators
Part 2:
Developing a data-driven culture
Part 3:
Sharing your story
35
5
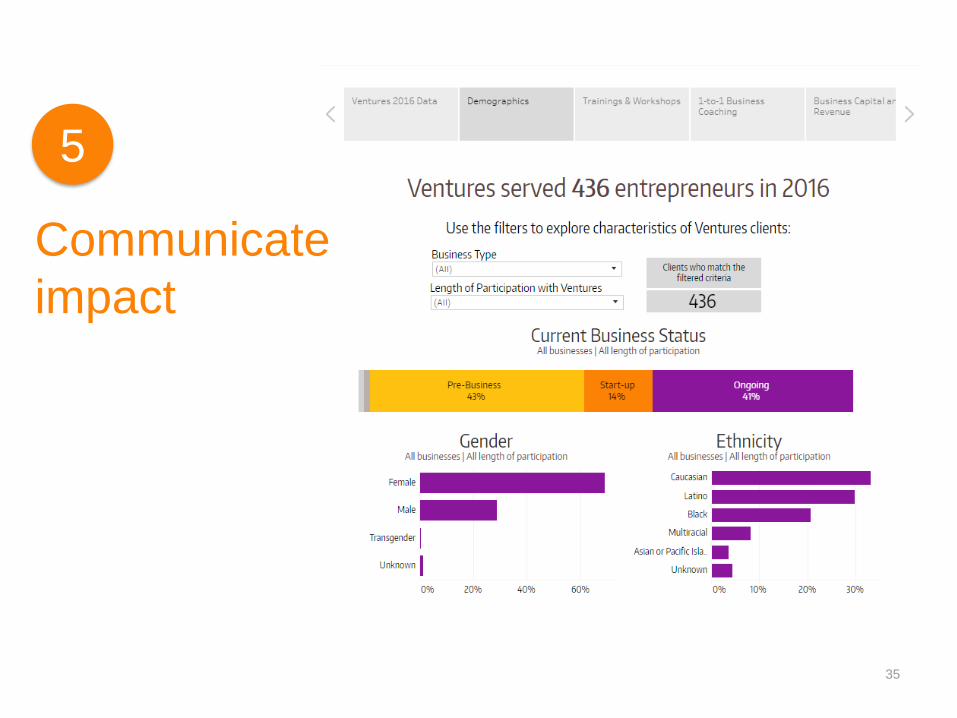
Communicate
impact
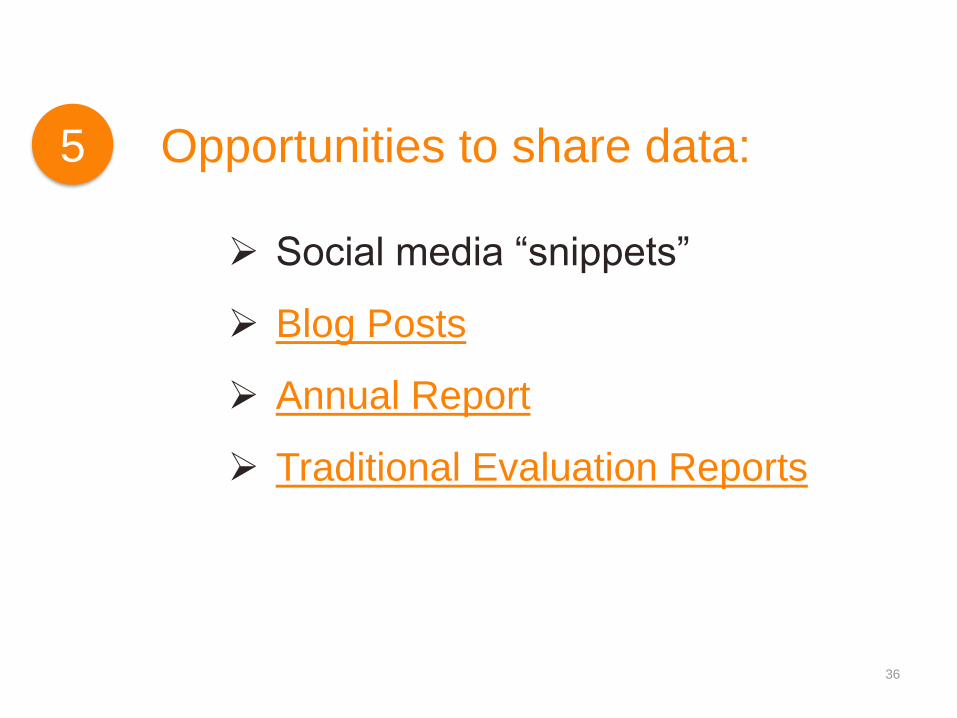
Opportunities to share data:
36
5
Social media “snippets”
Blog Posts
Annual Report
Traditional Evaluation Reports
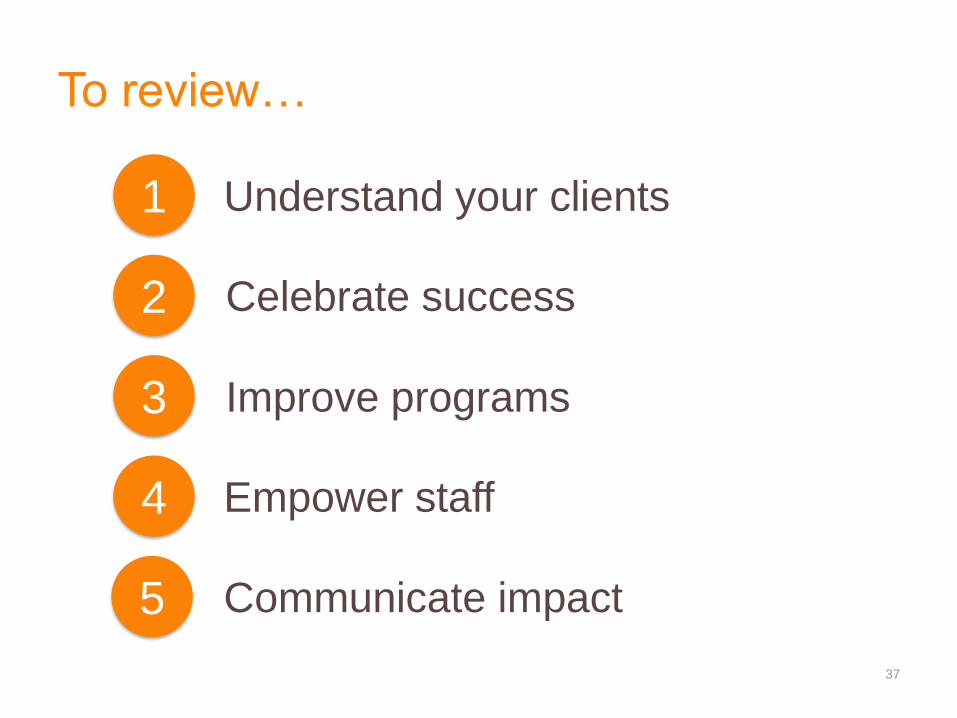
To review…
37
1
2
3
4
5
Understand your clients
Celebrate success
Improve programs
Empower staff
Communicate impact
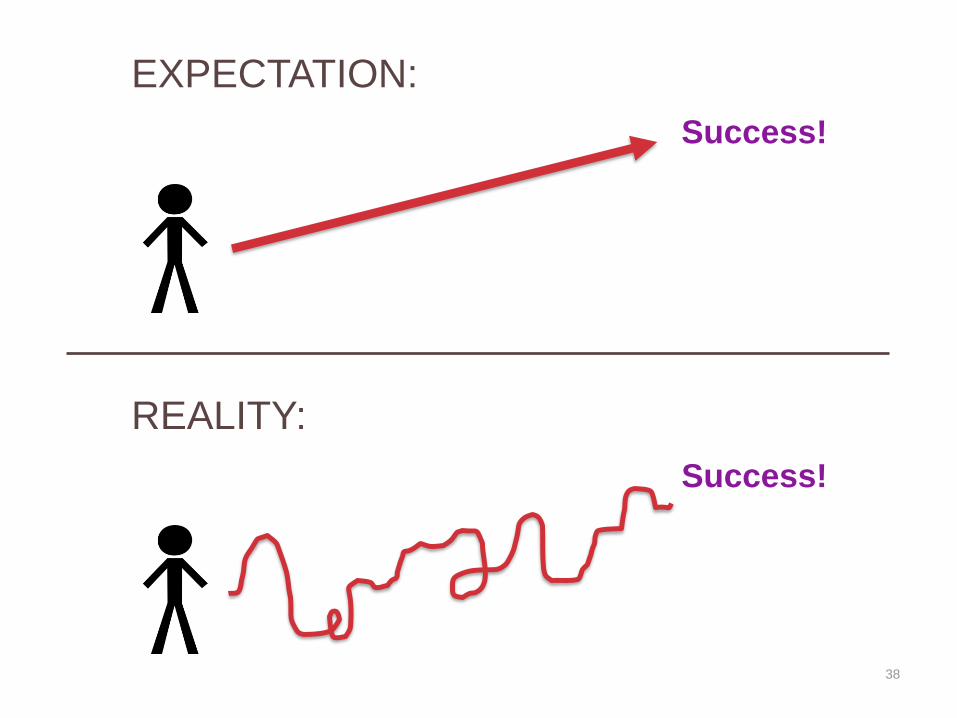
38
Success!
Success!
EXPECTATION:
REALITY:
Data must be useful
in order to be utilized.
39
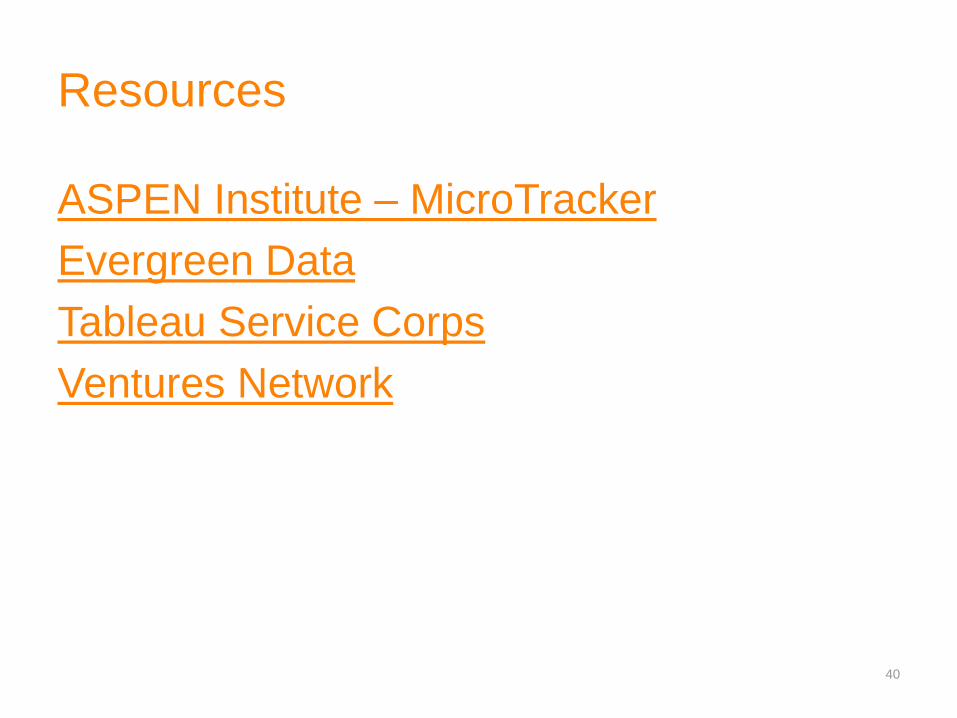
Resources
ASPEN Institute – MicroTracker
Evergreen Data
Tableau Service Corps
Ventures Network
40
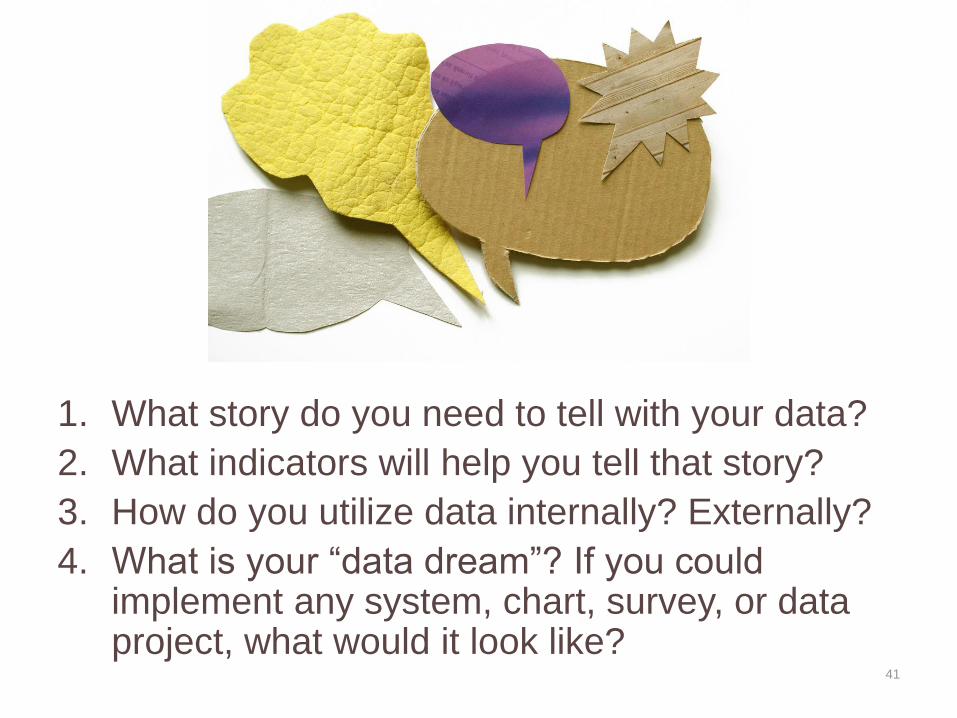
1. What story do you need to tell with your data?
2. What indicators will help you tell that story?
3. How do you utilize data internally? Externally?
4. What is your “data dream”? If you could implement any system, chart, survey, or data project, what would it look like?
41

Thanks!
Kellie Kinzel
Data & Evaluation Manager
Ventures
206-352-1945
43