Embed Size (px)
Citation preview
2 0 2 0 V o l u m e 4 4https://doi.org/10.33321/cdi.2020.44.71
Australian Group on Antimicrobial Resistance (AGAR) Australian Staphylococcus aureus Sepsis Outcome Programme (ASSOP) Annual Report 2019Geoffrey W Coombs, Denise A Daley, Shakeel Mowlaboccus and Stanley Pang, on behalf of the Australian Group on Antimicrobial Resistance
Communicable Diseases Intelligence ISSN: 2209-6051 Online
This journal is indexed by Index Medicus and Medline.
Creative Commons Licence – Attribution-NonCommercial-NoDerivatives CC BY-NC-ND
© 2020 Commonwealth of Australia as represented by the Department of Health
This publication is licensed under a Creative Commons Attribution – Non-Commercial NoDerivatives 4.0 International Licence from https://creativecommons.org/licenses/by-nc-nd/4.0/legalcode (Licence). You must read and understand the Licence before using any material from this publication.
Restrictions The Licence does not cover, and there is no permission given for, use of any of the following material found in this publication (if any):
• the Commonwealth Coat of Arms (by way of information, the terms under which the Coat of Arms may be used can be found at www.itsanhonour.gov.au);
• any logos (including the Department of Health’s logo) and trademarks;
• any photographs and images;
• any signatures; and
• any material belonging to third parties.
Disclaimer Opinions expressed in Communicable Diseases Intelligence are those of the authors and not necessarily those of the Australian Government Department of Health or the Communicable Diseases Network Australia. Data may be subject to revision.
Enquiries Enquiries regarding any other use of this publication should be addressed to the Communication Branch, Department of Health, GPO Box 9848, Canberra ACT 2601, or via e-mail to: [email protected]
Communicable Diseases Network Australia Communicable Diseases Intelligence contributes to the work of the Communicable Diseases Network Australia. http://www.health.gov.au/cdna
Communicable Diseases Intelligence (CDI) is a peer-reviewed scientific journal published by the Office of Health Protection, Department of Health. The journal aims to disseminate information on the epidemiology, surveillance, prevention and control of communicable diseases of relevance to Australia.
Editor Tanja Farmer
Deputy Editor Simon Petrie
Design and Production Kasra Yousefi
Editorial Advisory Board David Durrheim, Mark Ferson, John Kaldor, Martyn Kirk and Linda Selvey
Website http://www.health.gov.au/cdi
Contacts Communicable Diseases Intelligence is produced by: Health Protection Policy Branch Office of Health Protection Australian Government Department of Health GPO Box 9848, (MDP 6) CANBERRA ACT 2601
Email: [email protected]
Submit an Article You are invited to submit your next communicable disease related article to the Communicable Diseases Intelligence (CDI) for consideration. More information regarding CDI can be found at: http://health.gov.au/cdi.
Further enquiries should be directed to: [email protected].
1 of 18 health.gov.au/cdi Commun Dis Intell (2018) 2020;44(https://doi.org/10.33321/cdi.2020.44.71) Epub 15/09/2020
Australian Group on Antimicrobial Resistance (AGAR) Australian Staphylococcus aureus Sepsis Outcome Programme (ASSOP) Annual Report 2019Geoffrey W Coombs, Denise A Daley, Shakeel Mowlaboccus and Stanley Pang, on behalf of the Australian Group on Antimicrobial Resistance
Annual report
Abstract
From 1 January to 31 December 2019, 39 institutions around Australia participated in the Australian Staphylococcus aureus Sepsis Outcome Programme (ASSOP). The aim of ASSOP 2019 was to determine the proportion of Staphylococcus aureus bacteraemia (SAB) isolates in Australia that are antimicrobial resistant, with particular emphasis on susceptibility to methicillin and on characterising the molecu-lar epidemiology of the methicillin-resistant isolates. A total of 3,157 S. aureus bacteraemia episodes were reported, of which 79.8% were community-onset. 18.5% of S. aureus were methicillin resistant. The 30-day all-cause mortality associated with methicillin-resistant SAB was 14.0%, which was not significantly different from the 14.3% mortality associated with methicillin-susceptible SAB (p = 0.9). With the exception of the β-lactams and erythromycin, antimicrobial resistance in methicillin-sus-ceptible S. aureus was rare. However, in addition to the β-lactams, approximately 36% of methicillin-resistant S. aureus (MRSA) were resistant to ciprofloxacin, 34% to erythromycin, 13% to tetracycline, 9% to gentamicin and 4% to co-trimoxazole. When applying the EUCAST breakpoints, teicoplanin resistance was detected in two S. aureus isolates. Resistance was not detected for vancomycin and linezolid. Resistance to non-beta-lactam antimicrobials was largely attributable to two healthcare-associated MRSA clones: ST22-IV [2B] (EMRSA-15) and ST239-III [3A] (Aus-2/3 EMRSA). ST22-IV [2B] (EMRSA-15) is the predominant healthcare-associated clone in Australia. Eighty percent of methicillin-resistant SAB, however, were due to community-associated clones. Although polyclonal, approximately 71.4% of community-associated clones were variously characterised as ST93-IV [2B] (Queensland CA-MRSA), ST5-IV [2B], ST45-VT [5C2&5], ST1-IV [2B], ST30-IV [2B], ST78-IV [2B] and ST8-IV [2B]. Community-associated MRSA (CA-MRSA), in particular the ST45-VT [5C2&5] clone, have acquired multiple antimicrobial resistance determinants including ciprofloxacin, erythromycin, clindamycin, gentamicin and tetracycline. The multiresistant ST45-VT [5C2&5] clone accounted for 12.7% of CA-MRSA. As CA-MRSA is well established in the Australian community, it is important that antimicrobial resistance patterns in community- and healthcare-associated SAB are monitored, as this information will guide therapeutic practices in treating S. aureus sepsis.
Keywords: Australian Group on Antimicrobial Resistance (AGAR); antimicrobial resistance surveil-lance; Staphylococcus aureus; methicillin-susceptible Staphylococcus aureus (MSSA); methicillin-resistant Staphylococcus aureus (MRSA); bacteraemia
2 of 18 health.gov.au/cdiCommun Dis Intell (2018) 2020;44(https://doi.org/10.33321/cdi.2020.44.71) Epub 15/09/2020
Background
Globally, Staphylococcus aureus is one of the most frequent causes of hospital-acquired and community-acquired blood stream infections.1 Although there are a wide variety of manifes-tations of serious invasive infection caused by S. aureus, in the great majority of these cases the organism can be detected in blood cultures. Therefore, S. aureus bacteraemia (SAB) is con-sidered a very useful marker for serious invasive infection.2
Although prolonged antimicrobial therapy and prompt source control are used to treat SAB,3 mortality ranges from as low as 2.5% to as high as 40%.4–6 Mortality rates, however, are known to vary significantly with patient age, clinical manifestation, comorbidities and methicil-lin resistance.7,8 A prospective study of SAB conducted in 27 laboratories in Australia and New Zealand found a 30-day all-cause mortal-ity of 20.6%.9 On univariate analysis, increased mortality was significantly associated with older age; European ethnicity; methicillin resist-ance; infections not originating from a medical device; sepsis syndrome; pneumonia/empyema; and treatment with a glycopeptide or other non-β-lactam antibiotic.
The Australian Group on Antimicrobial Resistance (AGAR), a network of laboratories located across Australia, commenced surveil-lance of antimicrobial resistance in S. aureus in 1986.10 In 2013 AGAR commenced the Australian Staphylococcus aureus Sepsis Outcome Programme (ASSOP).11 The primary objective of ASSOP 2019 was to determine the proportion of SAB isolates demonstrating antimicrobial resistance with particular emphasis on:
1. Assessing susceptibility to methicillin; and
2. Molecular epidemiology of methicillin-resistant S. aureus (MRSA).
Methodology
Participants
Thirty-nine laboratories from all Australian states and mainland territories.
Collection period
From 1 January to 31 December 2019, the 39 laboratories collected all S. aureus isolated from blood cultures. S. aureus with the same anti-microbial susceptibility profiles isolated from a patient’s blood culture within 14 days of the first positive culture were excluded. A new S. aureus sepsis episode in the same patient was recorded if it was identified by a culture of blood collected more than 14 days after the last positive culture. Data were collected on age, sex, date of admis-sion and discharge (if admitted), and mortality at 30 days from date of first positive blood culture. To avoid interpretive bias, no attempt was made to assign attributable mortality. Each episode of bacteraemia was designated hospital-onset if the first positive blood culture(s) in an episode were collected > 48 hours after admission.
Laboratory testing
Participating laboratories performed antimi-crobial susceptibility testing using the Vitek2® (bioMérieux, France) or the Phoenix™ (Becton Dickinson, USA) automated microbiology sys-tems according to the manufacturer’s instruc-tions. S. aureus was identified by matrix-assisted laser desorption ionization (MALDI) using either the Vitek MS® (bioMérieux, France) or the MALDI Biotyper (Bruker Daltonics, Germany). Appropriate growth on chromogenic agar or polymerase chain reaction (PCR) for the pres-ence of the nuc gene may have been performed for confirmation.
Minimum inhibitory concentration (MIC) data and isolates were referred to the Antimicrobial Resistance and Infectious Diseases (AMRID) Research Laboratory at Murdoch University. Clinical and Laboratory Standards Institute (CLSI)12 and European Committee on Antimicrobial Susceptibility
3 of 18 health.gov.au/cdi Commun Dis Intell (2018) 2020;44(https://doi.org/10.33321/cdi.2020.44.71) Epub 15/09/2020
Testing (EUCAST)13 breakpoints were utilised for interpretation. Isolates with a resistant or an intermediate category were classified as non-susceptible. Linezolid and daptomycin non-susceptible isolates were retested by Etest® (bioMérieux) using the Mueller-Hinton agar recommended by the manufacturer. The control strain used was S. aureus ATCC 29213. High-level mupirocin resistance was determined by the Phoenix™ or by using a mupirocin 200 μg disk according to CLSI guidelines on all isolates with a mupirocin MIC > 8 mg/L by Vitek2®. Multi-resistance was defined as resistance to three or more of the following non-β-lactam antimicrobials: vancomycin, teicoplanin, eryth-romycin/clindamycin, tetracycline, ciprofloxa-cin, gentamicin, co-trimoxazole, fusidic acid, rifampicin, high level mupirocin, and linezolid.
Molecular testing was performed by whole genome sequencing (WGS) using the NextSeq platform (Illumina, San Diego, USA). Sequencing results were analysed using the Nullarbor pipeline.14 SCCmec was determined using KmerFinder V 3.115 and the SCCmec data-base curated from the CGE database.16, 17
Chi-square tests for comparison of two propor-tions and calculation of 95% confidence inter-vals (95% CI) were performed using MedCalc for Windows, version 12.7 (MedCalc Software, Ostend Belgium).
Approval to conduct the prospective data collec-tion was given by the research ethics committee associated with each participating laboratory.
Results
From 1 January to 31 December 2019, a total of 3,157 unique episodes of S. aureus bacterae-mia were identified. A significant difference (p < 0.0001) was seen in patient sex, with 64.7% (2,042) being male (95% CI 63.0–66.3%). The mean age of patients was 58 years, ranging from 0 to 106 years, with a median age of 62 years. Overall 79.8% of episodes (2,519/3,157) were community-onset (95% CI 78.4–81.2%). All-cause mortality at 30 days was 14.3% (95% CI 12.9–15.8%). Methicillin-resistant SAB mortal-
ity was 14.0% (95% CI 12.6–15.5%); methicillin-susceptible SAB mortality was 14.3% (95% CI 12.9–15.8%).
Methicillin-susceptible Staphylococcus aureus (MSSA) antimicrobial susceptibility:
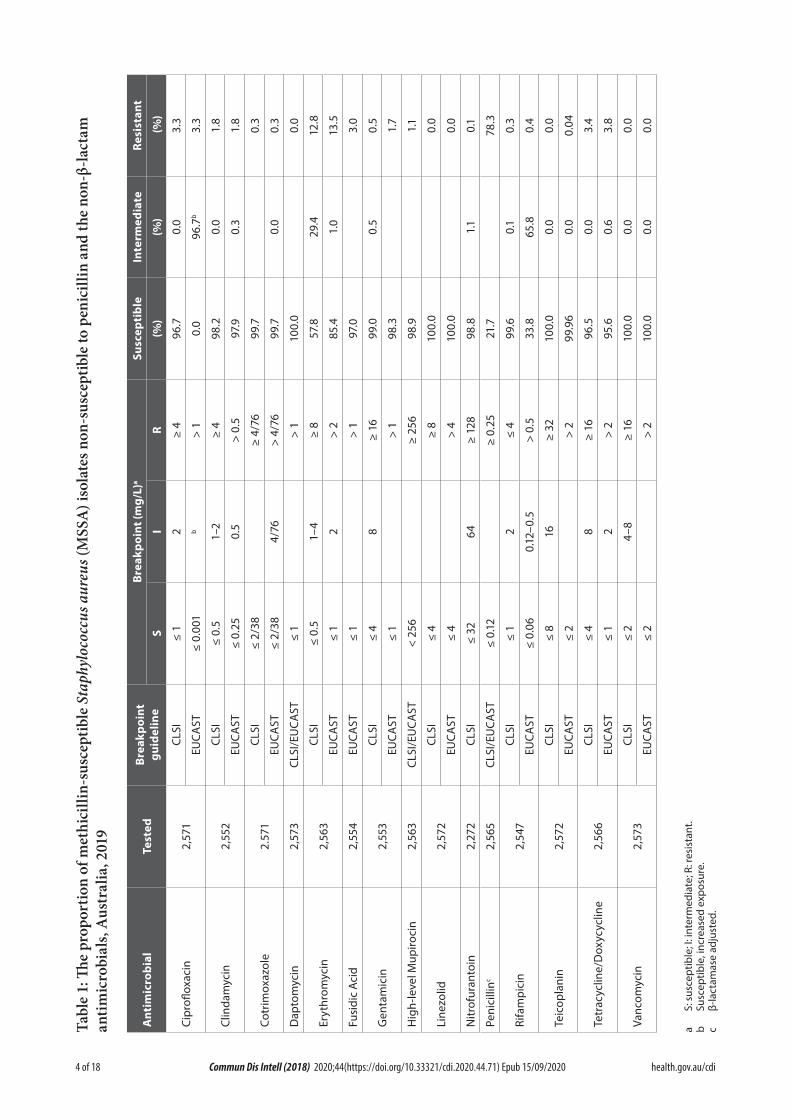
Overall 81.5% (2,574) of the 3,157 isolates were methicillin susceptible of which 75.1% (1,934) were penicillin resistant (MIC > 0.12 mg/L). However as β-lactamase was detected in 74 phe-notypically penicillin susceptible isolates, 78.3% of MSSA were considered penicillin resistant. Nine penicillin-susceptible isolates were not available for β-lactamase testing. Apart from erythromycin resistance (12.8% and 13.5% using CLSI and EUCAST breakpoints respectively), resistance to the non-β-lactam antimicrobials amongst MSSA was rare, ranging from 0% to 3.8% (Table 1). There were five isolates reported by Vitek2® as non-susceptible to daptomycin (MIC > 1.0 mg/L). However by Etest®, four of the isolates were considered daptomycin sus-ceptible (MICs 0.19–1.0 mg/L). The remaining isolate, with an Etest® MIC of 2.0 mg/L, was considered non-susceptible by CLSI and resist-ant by EUCAST interpretive criteria. By Vitek2®, two isolates were reported as linezolid resistant (MIC > 4 mg/L). However by Etest®, the isolates had MICs of 1.5 and 2.0 mg/L and were therefore considered linezolid susceptible. Using EUCAST interpretive criteria, 28 isolates were reported by Vitek2® as non-susceptible to teicoplanin (MIC 4.0 mg/L). By Etest®, 27 isolates had a teicoplanin MIC of ≤ 2.0 mg/L. One isolate was not available for confirmation. All MSSA were vancomycin susceptible. Twenty-nine (1.1%) of 2,563 isolates had high-level mupirocin resistance, of which 18 isolates were referred from Queensland. Nineteen of the 29 mupirocin-resistant MSSA were also resistant to fusidic acid. Inducible resistance to clindamycin was determined by the Vitek2® susceptibility system. Of the 2,279 isolates tested, 10.4% (237) were erythromycin resistant/clindamycin susceptible (CLSI break-points), of which 89.9% (213) were classified as having inducible clindamycin resistance. Multi-resistance was uncommon in MSSA (0.7%, 18/2,553).
4 of 18 health.gov.au/cdiCommun Dis Intell (2018) 2020;44(https://doi.org/10.33321/cdi.2020.44.71) Epub 15/09/2020
Tabl
e 1:
The
prop
ortio
n of
met
hici
llin-
susc
eptib
le S
taph
yloc
occu
s aur
eus (
MSS
A) i
sola
tes n
on-s
usce
ptib
le to
pen
icill
in a
nd th
e no
n-β-
lact
am
antim
icro
bial
s, A
ustr
alia
, 201
9
Ant
imic
robi
alTe
sted
Brea
kpoi
nt
guid
elin
eBr
eakp
oint
(mg/
L)a
Susc
epti
ble
Inte
rmed
iate
Resi
stan
t
SI
R(%
)(%
) (%
)
Cipr
oflox
acin
2,57
1CL
SI≤
12
≥ 4
96.7
0.0
3.3
EUCA
ST≤
0.00
1b
> 1
0.0
96.7
b3.
3
Clin
dam
ycin
2,55
2CL
SI≤
0.5
1–2
≥ 4
98.2
0.0
1.8
EUCA
ST≤
0.25
0.5
> 0.
597
.90.
31.
8
Cotr
imox
azol
e2.
571
CLSI
≤ 2/
38≥
4/76
99.7
0.3
EUCA
ST≤
2/38
4/76
> 4/
7699
.70.
00.
3
Dap
tom
ycin
2,57
3CL
SI/E
UCA
ST≤
1>
110
0.0
0.0
Eryt
hrom
ycin
2,56
3CL
SI≤
0.5
1–4
≥ 8
57.8
29.4
12.8
EUCA
ST≤
12
> 2
85.4
1.0
13.5
Fusi
dic
Aci
d2,
554
EUCA
ST≤
1>
197
.03.
0
Gen
tam
icin
2,55
3CL
SI≤
48
≥ 16
99.0
0.5
0.5
EUCA
ST≤
1>
198
.31.
7
Hig
h-le
vel M
upiro
cin
2,56
3CL
SI/E
UCA
ST<
256
≥ 25
698
.91.
1
Line
zolid
2,57
2CL
SI≤
4≥
810
0.0
0.0
EUCA
ST≤
4>
410
0.0
0.0
Nitr
ofur
anto
in2,
272
CLSI
≤ 32
64≥
128
98.8
1.1
0.1
Peni
cilli
nc2,
565
CLSI
/EU
CAST
≤ 0.
12≥
0.25
21.7
78.3
Rifa
mpi
cin
2,54
7CL
SI≤
12
≤ 4
99.6
0.1
0.3
EUCA
ST≤
0.06
0.12
–0.5
> 0.
533
.865
.80.
4
Teic
opla
nin
2,57
2CL
SI≤
816
≥ 32
100.
00.
00.
0
EUCA
ST≤
2>
299
.96
0.0
0.04
Tetr
acyc
line/
Dox
ycyc
line
2,56
6CL
SI≤
48
≥ 16
96.5
0.0
3.4
EUCA
ST≤
12
> 2
95.6
0.6
3.8
Vanc
omyc
in2,
573
CLSI
≤ 2
4–8
≥ 16
100.
00.
00.
0
EUCA
ST≤
2>
210
0.0
0.0
0.0
a S:
sus
cept
ible
; I: i
nter
med
iate
; R: r
esis
tant
.b
Susc
eptib
le, i
ncre
ased
exp
osur
e.c
β-la
ctam
ase
adju
sted
.
5 of 18 health.gov.au/cdi Commun Dis Intell (2018) 2020;44(https://doi.org/10.33321/cdi.2020.44.71) Epub 15/09/2020
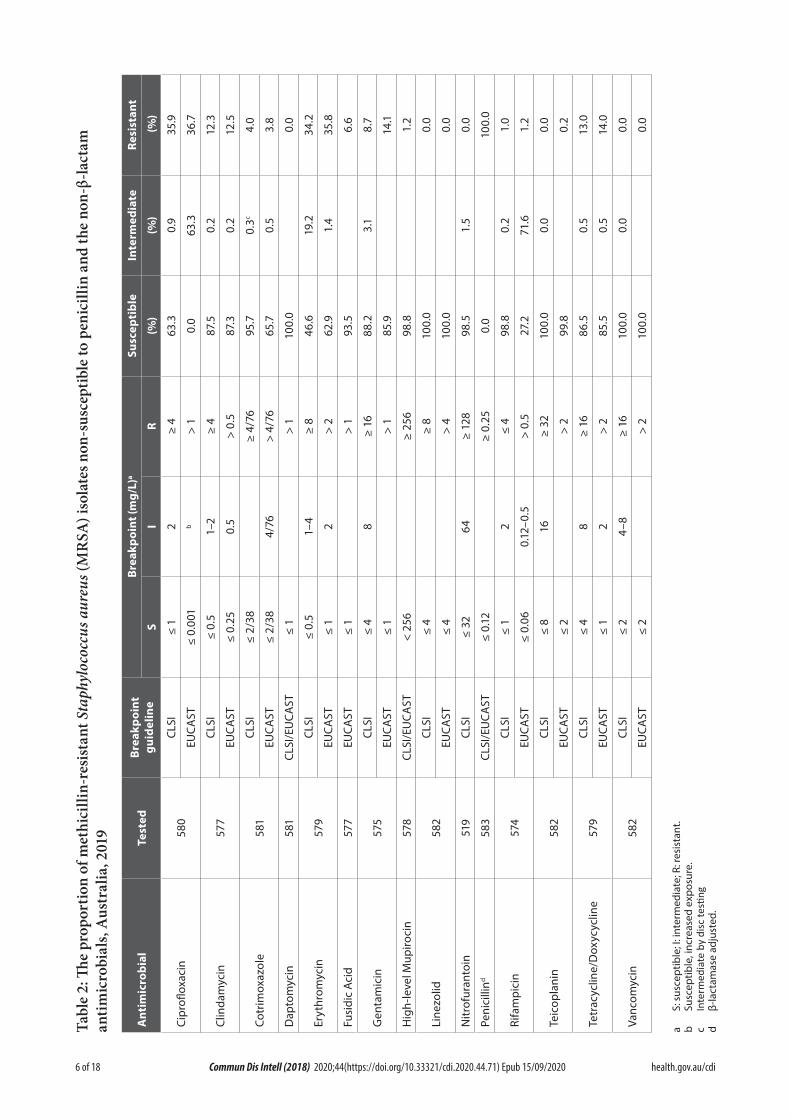
MRSA antimicrobial susceptibility
The proportion of S. aureus that were MRSA was 18.5% (95% CI 17.2–19.9%). Of the 583 MRSA identified, 525 were cefoxitin screen positive by Vitek2® and 51 had a cefoxitin MIC > 4 by Phoenix™. The remaining seven were identified as MRSA by mec/nuc PCR. Eight of the 583 MRSA isolates were phenotypically penicillin suscep-tible (MIC ≤ 0.125 mg/L), however β-lactamase was detected in all eight. Amongst the MRSA isolates, resistance to non-β-lactam antimicro-bials was common, except to rifampicin, nitro-furantoin, cotrimoxazole and fusidic acid where resistance ranged from 1.0% to 6.6% (Table 2). All MRSA were vancomycin susceptible. One isolate was reported by Vitek2® as daptomycin non-susceptible (MIC > 1.0 mg/L). By Etest®, the isolate was considered daptomycin susceptible (MIC 0.125 mg/L).
By Vitek2®, four isolates were linezolid resistant (MIC > 4 mg/L). However by Etest®, the isolates had MIC ≤ 2 mg/L and were therefore considered linezolid susceptible. When using the EUCAST resistant breakpoint of > 2 mg/L, one isolate was teicoplanin resistant (MIC = 4 mg/L). However, using the CLSI resistant breakpoint of > 8 mg/L, the isolate was classified as susceptible. Seven (1.2%) of 578 MRSA isolates tested had high-level mupirocin resistance.
Inducible resistance to clindamycin was deter-mined by the Vitek2® susceptibility system. Of the 527 isolates tested by Vitek2®, 22.2% (117) were erythromycin resistant/clindamycin susceptible (CLSI and EUCAST breakpoints), of which 88.0% (103) were classified as having inducible clindamycin resistance.
Multi-resistance was seen in 12.8% of MRSA (74/577).
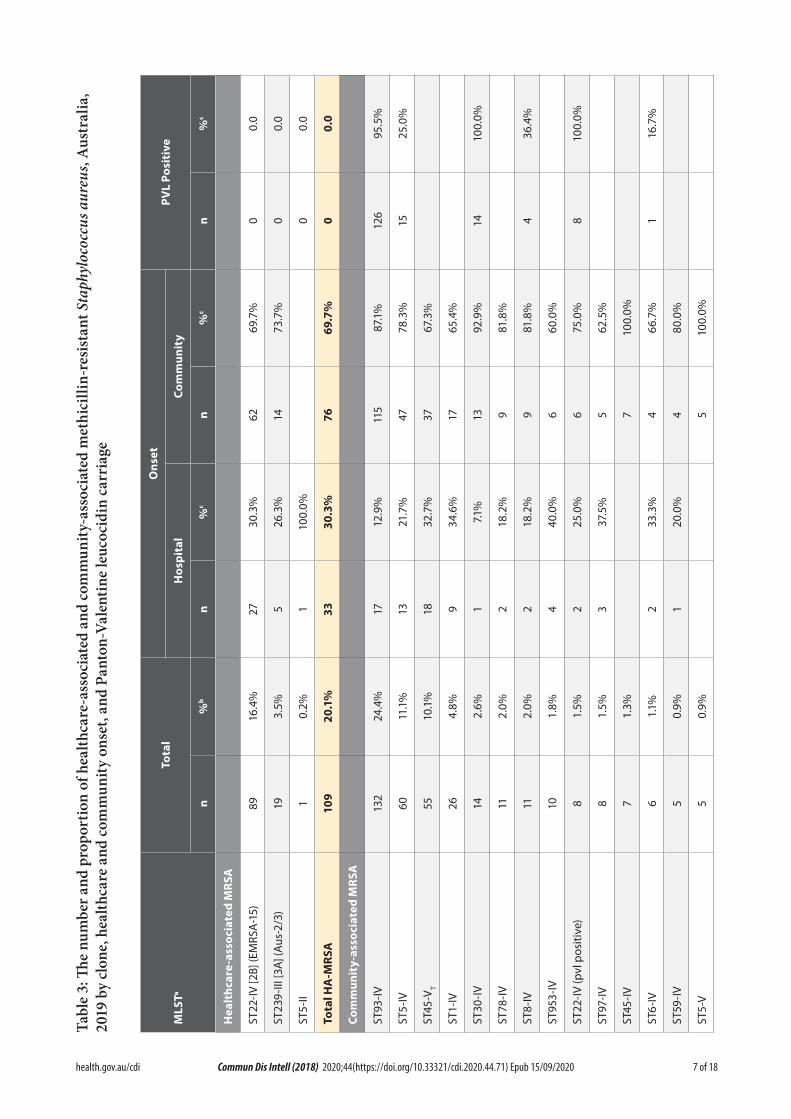
MRSA molecular epidemiology
WGS was performed on 93.0% of the MRSA (542/583). Based on molecular typing, 20.1% (109) and 79.9% (433) of isolates were identified
as healthcare-associated MRSA (HA-MRSA) and community-associated MRSA (CA-MRSA) clones respectively (Table 3).
Healthcare-associated methicillin-resistant Staphylococcus aureus
For the 109 HA-MRSA isolates, 30.3% (33) were epidemiologically classified as hospital-onset and 69.7% (76) were classified as community-onset. Three HA-MRSA clones were identified: 89 isolates of ST22-IV [2B] (EMRSA-15) (16.4% of MRSA typed and 2.8% of S. aureus); 19 iso-lates of ST239-III [3A] (Aus – 2/3 EMRSA) (3.5% and 0.6%), and one isolate of ST5-II (NY/Japan) (0.2% and 0.03%).
ST22-IV [2B] (EMRSA-15) was the dominant HA-MRSA clone in Australia, accounting for 81.7% of HA-MRSA, ranging from 0% in the Northern Territory to 100% in Western Australia (Table 4). ST22-IV [2B] (EMRSA-15) is PVL negative, and using CLSI breakpoints, 97.8% and 65.2% were ciprofloxacin and eryth-romycin non-susceptible respectively. Overall, 30.3% of ST22-IV were hospital-onset.
ST239-III [3A] (Aus-2/3 EMRSA) accounted for 17.4% of HA-MRSA, ranging from 0% in Western Australia and the Northern Territory to 50.0% in Queensland (Table 4). PVL-negative ST239-III [3A] (Aus-2/3 EMRSA) were typically resistant to erythromycin (100%), co-trimoxa-zole (89.5%), ciprofloxacin (100%), gentamicin (94.7%), tetracycline (100%) and clindamycin (57.9%). Overall, 26.3% of ST239-III were hos-pital-onset.
6 of 18 health.gov.au/cdiCommun Dis Intell (2018) 2020;44(https://doi.org/10.33321/cdi.2020.44.71) Epub 15/09/2020
Tabl
e 2:
The
prop
ortio
n of
met
hici
llin-
resi
stan
t Sta
phyl
ococ
cus a
ureu
s (M
RSA
) iso
late
s non
-sus
cept
ible
to p
enic
illin
and
the
non-
β-la
ctam
an
timic
robi
als,
Aus
tral
ia, 2
019
Ant
imic
robi
alTe
sted
Brea
kpoi
nt
guid
elin
eBr
eakp
oint
(mg/
L)a
Susc
epti
ble
Inte
rmed
iate
Resi
stan
t
SI
R(%
)(%
) (%
)
Cipr
oflox
acin
580
CLSI
≤ 1
2≥
463
.30.
935
.9
EUCA
ST≤
0.00
1b
> 1
0.0
63.3
36.7
Clin
dam
ycin
577
CLSI
≤ 0.
51–
2≥
487
.50.
212
.3
EUCA
ST≤
0.25
0.5
> 0.
587
.30.
212
.5
Cotr
imox
azol
e58
1CL
SI≤
2/38
≥ 4/
7695
.70.
3c4.
0
EUCA
ST≤
2/38
4/76
> 4/
7665
.70.
53.
8
Dap
tom
ycin
581
CLSI
/EU
CAST
≤ 1
> 1
100.
00.
0
Eryt
hrom
ycin
579
CLSI
≤ 0.
51–
4≥
846
.619
.234
.2
EUCA
ST≤
12
> 2
62.9
1.4
35.8
Fusi
dic
Aci
d57
7EU
CAST
≤ 1
> 1
93.5
6.6
Gen
tam
icin
575
CLSI
≤ 4
8≥
1688
.23.
18.
7
EUCA
ST≤
1>
185
.914
.1
Hig
h-le
vel M
upiro
cin
578
CLSI
/EU
CAST
< 25
6≥
256
98.8
1.2
Line
zolid
582
CLSI
≤ 4
≥ 8
100.
00.
0
EUCA
ST≤
4>
410
0.0
0.0
Nitr
ofur
anto
in51
9CL
SI≤
3264
≥ 12
898
.51.
50.
0
Peni
cilli
nd58
3CL
SI/E
UCA
ST≤
0.12
≥ 0.
250.
010
0.0
Rifa
mpi
cin
574
CLSI
≤ 1
2≤
498
.80.
21.
0
EUCA
ST≤
0.06
0.12
–0.5
> 0.
527
.271
.61.
2
Teic
opla
nin
582
CLSI
≤ 8
16≥
3210
0.0
0.0
0.0
EUCA
ST≤
2>
299
.80.
2
Tetr
acyc
line/
Dox
ycyc
line
579
CLSI
≤ 4
8≥
1686
.50.
513
.0
EUCA
ST≤
12
> 2
85.5
0.5
14.0
Vanc
omyc
in58
2CL
SI≤
24–
8≥
1610
0.0
0.0
0.0
EUCA
ST≤
2>
210
0.0
0.0
a S:
sus
cept
ible
; I: i
nter
med
iate
; R: r
esis
tant
.b
Susc
eptib
le, i
ncre
ased
exp
osur
e.c
Inte
rmed
iate
by
disc
testi
ngd
β-la
ctam
ase
adju
sted
.
7 of 18 health.gov.au/cdi Commun Dis Intell (2018) 2020;44(https://doi.org/10.33321/cdi.2020.44.71) Epub 15/09/2020
Tabl
e 3:
The
num
ber a
nd p
ropo
rtio
n of
hea
lthca
re-a
ssoc
iate
d an
d co
mm
unity
-ass
ocia
ted
met
hici
llin-
resi
stan
t Sta
phyl
ococ
cus a
ureu
s, A
ustr
alia
, 20
19 b
y cl
one,
hea
lthca
re a
nd co
mm
unity
ons
et, a
nd P
anto
n-Va
lent
ine
leuc
ocid
in c
arri
age
Ons
etTo
tal
PVL
Posi
tive
MLS
TaH
ospi
tal
Com
mun
ity
n%
bn
%c
n%
cn
%c
Hea
lthc
are-
asso
ciat
ed M
RSA
ST22
-IV [2
B] (E
MRS
A-1
5)89
16.4
%27
30.3
%62
69.7
%0
0.0
ST23
9-III
[3A]
(Aus
-2/3
)19
3.5%
526
.3%
1473
.7%
00.
0
ST5-
II1
0.2%
110
0.0%
00.
0
Tota
l HA
-MRS
A10
920
.1%
3330
.3%
7669
.7%
00.
0
Com
mun
ity-
asso
ciat
ed M
RSA
ST93
-IV13
224
.4%
1712
.9%
115
87.1
%12
695
.5%
ST5-
IV60
11.1
%13
21.7
%47
78.3
%15
25.0
%
ST45
-VT
5510
.1%
1832
.7%
3767
.3%
ST1-
IV26
4.8%
934
.6%
1765
.4%
ST30
-IV14
2.6%
17.1
%13
92.9
%14
100.
0%
ST78
-IV11
2.0%
218
.2%
981
.8%
ST8-
IV11
2.0%
218
.2%
981
.8%
436
.4%
ST95
3-IV
101.
8%4
40.0
%6
60.0
%
ST22
-IV (p
vl p
ositi
ve)
81.
5%2
25.0
%6
75.0
%8
100.
0%
ST97
-IV8
1.5%
337
.5%
562
.5%
ST45
-IV7
1.3%
710
0.0%
ST6-
IV6
1.1%
233
.3%
466
.7%
116
.7%
ST59
-IV5
0.9%
120
.0%
480
.0%
ST5-
V5
0.9%
510
0.0%
8 of 18 health.gov.au/cdiCommun Dis Intell (2018) 2020;44(https://doi.org/10.33321/cdi.2020.44.71) Epub 15/09/2020
Ons
etTo
tal
PVL
Posi
tive
MLS
TaH
ospi
tal
Com
mun
ity
n%
bn
%c
n%
cn
%c
ST72
-IV5
0.9%
240
.0%
360
.0%
ST87
2-IV
50.
9%1
20.0
%4
80.0
%
ST72
-V4
0.7%
375
.0%
125
.0%
125
.0%
ST88
-IV4
0.7%
125
.0%
375
.0%
ST14
9-IV
30.
6%1
33.3
%2
66.7
%
ST18
8-IV
30.
6%2
66.7
%1
33.3
%
ST52
13-IV
30.
6%3
100.
0%
ST59
-V3
0.6%
266
.7%
133
.3%
133
.3%
ST12
32-V
20.
4%1
50.0
%1
50.0
%2
100.
0%
ST61
42-V
20.
4%2
100.
0%
ST61
55-IV
20.
4%2
100.
0%
ST67
2-IV
20.
4%2
100.
0%
ST77
2-V
20.
4%1
50.0
%1
50.0
%2
100.
0%
ST8-
V2
0.4%
210
0.0%
ST10
5-II
10.
2%1
100.
0%
ST11
78-IV
10.
2%1
100.
0%
ST14
57-IV
10.
2%1
100.
0%
ST15
24-IV
10.
2%1
100.
0%1
100.
0%
ST15
-IV1
0.2%
110
0.0%
ST18
14-IV
10.
2%1
100.
0%
ST20
7-IV
10.
2%1
100.
0%
ST21
12-V
10.
2%1
100.
0%

9 of 18 health.gov.au/cdi Commun Dis Intell (2018) 2020;44(https://doi.org/10.33321/cdi.2020.44.71) Epub 15/09/2020
Ons
etTo
tal
PVL
Posi
tive
MLS
TaH
ospi
tal
Com
mun
ity
n%
bn
%c
n%
cn
%c
ST22
-V1
0.2%
110
0.0%
ST39
8-V
10.
2%1
100.
0%
ST46
-VI
10.
2%1
100.
0%
ST57
3-V
10.
2%1
100.
0%
ST5-
I1
0.2%
110
0.0%
ST5-
VI1
0.2%
110
0.0%
ST5-
VIII
10.
2%1
100.
0%
ST61
44-IV
10.
2%1
100.
0%
ST61
45-V
10.
2%1
100.
0%
ST61
46-V
10.
2%1
100.
0%
ST61
47-V
10.
2%1
100.
0%1
100.
0%
ST61
48-V
10.
2%1
100.
0%
ST61
49-IV
10.
2%1
100.
0%
ST61
50-IV
10.
2%1
100.
0%
ST61
51-IV
10.
2%1
100.
0%1
100.
0%
ST61
52-IV
10.
2%1
100.
0%1
100.
0%
ST61
53-IV
10.
2%1
100.
0%
ST61
54-IV
10.
2%1
100.
0%
ST61
56-IV
10.
2%1
100.
0%
ST61
58-IV
10.
2%1
100.
0%
ST61
59-IV
10.
2%1
100.
0%
ST67
2-V
10.
2%1
100.
0%

10 of 18 health.gov.au/cdiCommun Dis Intell (2018) 2020;44(https://doi.org/10.33321/cdi.2020.44.71) Epub 15/09/2020
Ons
etTo
tal
PVL
Posi
tive
MLS
TaH
ospi
tal
Com
mun
ity
n%
bn
%c
n%
cn
%c
ST78
9-IV
10.
2%1
100.
0%
ST83
5-IV
10.
2%1
100.
0%
ST92
0-IV
10.
2%1
100.
0%
Tota
l CA
-MRS
A43
379
.9%
102
23.6
%33
176
.4%
178
41.1
%
a M
ultil
ocus
seq
uenc
e ty
pe.
b Pe
rcen
tage
of a
ll M
RSA
type
d.c
Perc
enta
ge o
f the
str
ain.
Tabl
e 4:
The
num
ber a
nd p
ropo
rtio
n of
hea
lthca
re-a
ssoc
iate
d m
ethi
cilli
n-re
sist
ant S
taph
yloc
occu
s aur
eus (
MR
SA) m
ultil
ocus
sequ
ence
type
s (M
LST)
, Aus
tral
ia, 2
019,
by
regi
ona
MLS
TA
CT
NSW
NT
Qld
SATa
sV
icW
AA
us
n%
n%
n%
n%
n%
n%
n%
n%
n%
ST22
-IV6
75.0
%36
87.8
%0
850
.0%
571
.4%
583
.3%
1990
.5%
1010
0.0%
8981
.7%
ST23
9-III
225
.0%
49.
8%0
850
.0%
228
.6%
116
.7%
29.
5%0
1917
.4%
ST5-
II0
12.
4%0
00
00
01
0.9%
Tota
l8
100.
0%41
100.
0%0
1610
0.0%
710
0.0%
610
0.0%
2110
0.0%
1010
0.0%
109
100.
0%
a AC
T =
Aust
ralia
n Ca
pita
l Ter
ritor
y; N
SW =
New
Sou
th W
ales
; NT
= N
orth
ern
Terr
itory
; Qld
= Q
ueen
slan
d; S
A =
Sou
th A
ustr
alia
; Tas
= T
asm
ania
; Vic
= V
icto
ria; W
A =
Wes
tern
Aus
tral
ia; A
us =
Aus
tral
ia.
11 of 18 health.gov.au/cdi Commun Dis Intell (2018) 2020;44(https://doi.org/10.33321/cdi.2020.44.71) Epub 15/09/2020
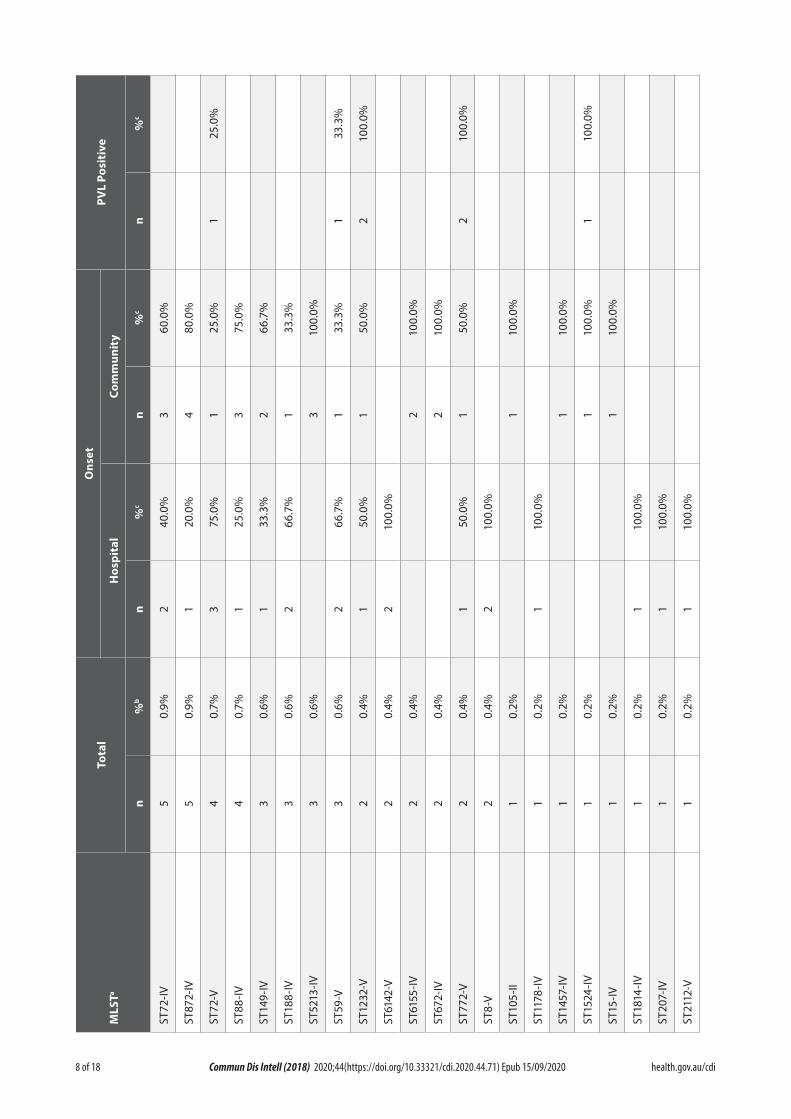
Community-associated methicillin-resistant Staphylococcus aureus
For the 433 CA-MRSA isolates, 23.6% (102) of episodes were epidemiologically classified as hospital-onset and 76.4% (331) were classi-fied as community-onset. Based on the multi locus sequence type and the SCCmec type, 61 CA-MRSA clones were identified (Table 3). Overall, 71.4% of CA-MRSA were classified into seven clones each having more than ten iso-lates: 132 isolates of ST93-IV [2B] (Queensland CA-MRSA) (24.4% of MRSA typed and 4.2% of S. aureus); 60 isolates of ST5-IV (11.1% and 1.9%); 55 isolates of ST45-VT (10.1% and 1.7%); 26 isolates of ST1-IV (4.8% and 0.8%); 14 isolates of ST30-IV (2.6% and 0.4%); 11 isolates of ST78-IV (2.0% and 0.3%) and 11 isolates of ST8-IV (2.0% and 0.3%).
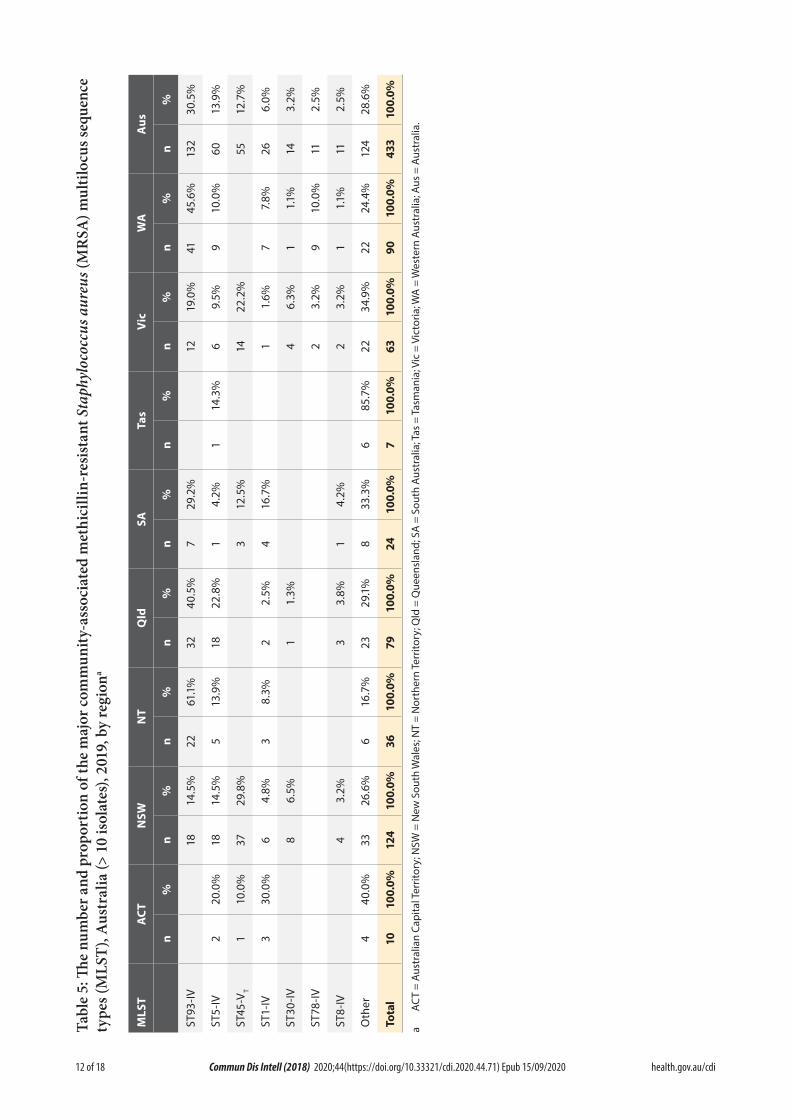
ST93-IV [2B] (Queensland CA-MRSA) accounted for 24.4% of CA-MRSA ranging from 0% in Tasmania and the Australian Capital Territory to 61.1% in the Northern Territory (Table 5). Typically PVL positive, 77.3% (102/132) of ST93-IV [2B] (Queensland CA-MRSA) were resistant to the β-lactams only; most of the remainder were additionally resistant to eryth-romycin (11.4%, 15/132) or to erythromycin and clindamycin (9.9%, 13/132). Single isolates were resistant to ciprofloxacin and clindamycin. Overall, 87.1% of ST93-IV were community-onset.
ST5-IV accounted for 13.9% of CA-MRSA and was isolated in all regions of Australia, rang-ing from 4.2% in South Australia to 22.8% in Queensland (Table 5). ST5-IV isolates, of which 25.0% were PVL positive, were typically resistant to the β-lactams only, 61.7% (37/60). Isolates were additionally resistant to erythromycin (15.0%, 9/60); fusidic acid (6.7%, 4/60); co-trimoxazole (3.3%, 2/60); ciprofloxacin (3.3% 2/60); erythro-mycin and clindamycin (3.3%, 2/60); and single isolates resistant to erythromycin, clindamycin, tetracycline and cotrimoxazole; rifampicin and fusidic acid; ciprofloxacin and gentamicin; and rifampicin. Overall, 78.3% of ST5-IV were community-onset.
ST45-VT accounted for 12.7% of CA-MRSA and was isolated primarily in New South Wales and Victoria (Table 5). All isolates were PVL negative and were resistant to the β-lactams and cipro-floxacin. Isolates were additionally resistant to erythromycin, gentamicin and tetracycline (16.4%, 9/55); gentamicin and tetracycline (12.7% 7/55); erythromycin, clindamycin and tetracycline (12.7%, 7/55); erythromycin and tetracycline (12.7%, 7/55); tetracycline (7.3%, 4/55); erythromycin, clindamycin, fusidic acid and tetracycline (5.5%, 3/55); gentamicin (5.5%, 3/55); erythromycin, fusidic acid and tetracy-cline (3.6%, 2/55). Single isolates were resistant to erythromycin, tetracycline and cotrimoxazole; erythromycin and clindamycin; fusidic acid and tetracycline; and fusidic acid. Overall, 67.3% of ST45-VT were community-onset.
ST1-IV accounted for 6.0% of CA-MRSA and was isolated in all regions of Australia except Tasmania, ranging from 1.6% in Victoria to 30% in the Australian Capital Territory (Table 5). Typically PVL negative, 61.5% of isolates were resistant to the β-lactams only (16/26); other iso-lates were additionally resistant to fusidic acid (15.4%, 4/26) or to erythromycin and fusidic acid (11.5%, 3/26). Single isolates were resistant to either ciprofloxacin; erythromycin; or eryth-romycin and clindamycin. Overall, 65.4% of ST1-IV were community-onset.
ST30-IV accounted for 3.2% of CA-MRSA and was isolated in all regions of Australia except the Australian Capital Territory, the Northern Territory, South Australia and Tasmania, rang-ing from 1.1% in Western Australia to 6.5% in New South Wales (Table 5). All isolates were PVL positive and were typically resistant to the β-lactams only (92.9%, 13/14). A single isolate was resistant to erythromycin and clindamycin. Overall, 92.9% of ST30-IV were community-onset.
ST78-IV accounted for 2.5% of CA-MRSA and was isolated in Western Australia and Victoria (Table 5). All isolates were PVL negative and predominantly resistant to the β-lactams only
12 of 18 health.gov.au/cdiCommun Dis Intell (2018) 2020;44(https://doi.org/10.33321/cdi.2020.44.71) Epub 15/09/2020
Tabl
e 5:
The
num
ber a
nd p
ropo
rtio
n of
the
maj
or co
mm
unity
-ass
ocia
ted
met
hici
llin-
resi
stan
t Sta
phyl
ococ
cus a
ureu
s (M
RSA
) mul
tiloc
us se
quen
ce
type
s (M
LST)
, Aus
tral
ia (>
10
isol
ates
), 20
19, b
y re
gion
a
MLS
TA
CT
NSW
NT
Qld
SATa
sV
icW
AA
us
n%
n%
n%
n%
n%
n%
n%
n%
n%
ST93
-IV18
14.5
%22
61.1
%32
40.5
%7
29.2
%12
19.0
%41
45.6
%13
230
.5%
ST5-
IV2
20.0
%18
14.5
%5
13.9
%18
22.8
%1
4.2%
114
.3%
69.
5%9
10.0
%60
13.9
%
ST45
-VT
110
.0%
3729
.8%
312
.5%
1422
.2%
5512
.7%
ST1-
IV3
30.0
%6
4.8%
38.
3%2
2.5%
416
.7%
11.
6%7
7.8%
266.
0%
ST30
-IV8
6.5%
11.
3%4
6.3%
11.
1%14
3.2%
ST78
-IV2
3.2%
910
.0%
112.
5%
ST8-
IV4
3.2%
33.
8%1
4.2%
23.
2%1
1.1%
112.
5%
Oth
er4
40.0
%33
26.6
%6
16.7
%23
29.1
%8
33.3
%6
85.7
%22
34.9
%22
24.4
%12
428
.6%
Tota
l10
100.
0%12
410
0.0%
3610
0.0%
7910
0.0%
2410
0.0%
710
0.0%
6310
0.0%
9010
0.0%
433
100.
0%
a AC
T =
Aust
ralia
n Ca
pita
l Ter
ritor
y; N
SW =
New
Sou
th W
ales
; NT
= N
orth
ern
Terr
itory
; Qld
= Q
ueen
slan
d; S
A =
Sou
th A
ustr
alia
; Tas
= T
asm
ania
; Vic
= V
icto
ria; W
A =
Wes
tern
Aus
tral
ia; A
us =
Aus
tral
ia.

13 of 18 health.gov.au/cdi Commun Dis Intell (2018) 2020;44(https://doi.org/10.33321/cdi.2020.44.71) Epub 15/09/2020
(72.7%, 8/11). Three isolates were also resist-ant to erythromycin (27.3%). Overall, 81.8% of ST78-IV were community-onset.
ST8-IV accounted for 2.5% of CA-MRSA and was isolated all regions except the Australian Capital Territory, the Northern Territory and Tasmania ranging from 1.1% in Western Australia to 4.2% in South Australia (Table 5). 36.4% of ST8-IV were PVL positive. Two isolates were resistant to the β-lactams only. Isolates were additionally resistant to ciprofloxacin (27.3%, 3/11); ciproflox-acin and erythromycin (18.2%, 2/11) and single isolates resistant to ciprofloxacin, erythromycin, clindamycin and cotrimoxazole; ciprofloxacin and tetracycline; and erythromycin. Overall, 81.8% of ST8-IV were community-onset.
Overall, 88.5% of CA-MRSA were non-multi-resistant, including 55.2% of CA-MRSA isolates which were resistant to the β-lactams only. A substantial increase was seen in multi-resistant CA-MRSA isolates in ASSOP 2019 (13.7%), from 9.2% in ASSOP 2013.11 Multi-resistance was pri-marily due to the ST45-VT clone.
Panton-Valentine leucocidin
Overall, 178 MRSA (32.8%) were PVL positive. All were CA-MRSA (Table 3).
Discussion
The AGAR surveillance programmes collect data on antimicrobial resistance, focussing on bloodstream infections caused by S. aureus, Enterococcus and Enterobacteriaceae. All data collected in the AGAR programs are generated as part of routine patient care in Australia, with most data available through laboratory and hospital bed management information systems. Isolates are referred to a central laboratory where strain and antimicrobial resistance deter-minant characterisation is performed. As the programmes are similar to those conducted in Europe,18 comparison of Australia antimicrobial resistance data with other countries is possible.
In ASSOP 2019, 18.5% (95% CI 17.2–19.9%) of the 3,157 SAB episodes were methicillin resist-
ant. In the 2018 European Centre for Disease Prevention and Control and Prevention (ECDC) SAB surveillance program, the European Union/European Economic Area (EU/EEA) population-weighted mean percentage of S. aureus resistant to methicillin was 16.4% (95% CI 16–17%), ranging from 0% (95% CI 0–4%) in Iceland to 43% (95% CI 39–49%) in Romania.18
In Europe, the EU/EEA population-weighted mean percentage has significantly decreased from 23.2% in 2009 to 16.4% in 2018. A decrease in methicillin-resistant SAB has been reported in several parts of the world19,20 and is believed to be due to the implementation of antimicrobial stewardship and a package of improved infec-tion control procedures including hand hygiene, MRSA screening and decolonisation, patient isolation and infection prevention care bun-dles.21–25 The percentage of methicillin-resistant SAB in Australia however has remained stable over the seven years of ASSOP ranging from 19.1% in 2013 to 18.5% in 2019. In Australia, although we have not seen a significant change in the percentage of methicillin-resistant SAB overall, we have observed significant decreases in HA-MRSA from 41.0% to 20.1% of all MRSA (p < 0.0001), and in hospital-onset MRSA from 38.0% to 24.9% of MRSA (p < 0.0001) over the seven ASSOP surveys.11,26–30
Because of the increased burden of CA-MRSA bacteraemia in Australia, a significant reduction in the overall proportion of SAB due to MRSA may prove problematic.
In ASSOP 2019, the all-cause mortality at 30 days was 14.3% (95% CI 12.9–15.8%). Methicillin-resistant SAB mortality was 14.0% (95% CI 12.6–15.5%); methicillin-susceptible SAB mor-tality was 14.3% (95% CI 12.9–15.8%).
With the exception of the β-lactams and eryth-romycin, antimicrobial resistance in MSSA remains rare. However for MRSA, in addition to the β-lactams, approximately 20% of isolates were resistant to erythromycin and ciprofloxacin and approximately 2% resistant to co-trimoxazole, tetracycline and gentamicin. Resistance was
14 of 18 health.gov.au/cdiCommun Dis Intell (2018) 2020;44(https://doi.org/10.33321/cdi.2020.44.71) Epub 15/09/2020
largely attributable to two healthcare-associated MRSA clones, ST22-IV [2B] (EMRSA-15), which is typically ciprofloxacin and erythromycin resistant, and ST239-III [3A] (Aus-2/3 EMRSA) which is typically erythromycin, clindamycin, ciprofloxacin, co-trimoxazole, tetracycline and gentamicin resistant. In the early 1980s the multi-resistant ST239-III [3A] (Aus-2/3 EMRSA) was the dominant HA-MRSA clone in Australian hospitals. However, in 2013 the first ASSOP survey showed that ST22-IV [2B] (EMRSA-15) was replacing ST239-III [3A] (Aus-2/3 EMRSA) as the most prevalent HA-MRSA and this change has occurred throughout most of the country.31 In ASSOP 2019 approximately 16% of MRSA were characterised as ST22-IV [2B] (EMRSA-15). CA-MRSA, in particular the ST45-VT clone (10.1% of MRSA), has acquired multiple antimicrobial resistance determinants including ciprofloxacin, erythromycin, clinda-mycin, gentamicin and tetracycline.
Resistance was not detected for vancomycin, linezolid or teicoplanin when CLSI interpretive criteria were applied. However two isolates were teicoplanin resistant when EUCAST criteria were applied. One isolate was non-susceptible to daptomycin by CLSI and EUCAST interpretive criteria.
Approximately 23.6% of SAB caused by CA-MRSA were hospital-onset. Transmission of CA-MRSA in Australian hospitals is thought to be rare.32, 33 It is likely that many of the hospital-onset CA-MRSA SAB infections reported in ASSOP 2019 were caused by the patient’s own colonising strains acquired prior to admission. In Australia, CA-MRSA clones such as PVL-positive ST93-IV [2B] (Queensland CA-MRSA) are well established in the community and therefore it is important to monitor antimicro-bial resistance patterns in both community-and healthcare-associated SAB as this information will guide therapeutic practices in treating S. aureus sepsis.
In conclusion, ASSOP 2019 has demonstrated that antimicrobial resistance in SAB in Australia continues to be a serious problem and continues
to be associated with a high mortality. This may be due, in part, to the prevalence of methicillin-resistant SAB in Australia, which is higher than most EU/EEA countries. Consequently, MRSA must remain a public health priority, and con-tinuous surveillance of SAB and its outcomes and the implementation of comprehensive MRSA strategies targeting hospitals and long-term care facilities are essential.
Acknowledgments
This study was funded by a grant from the Australian Commission on Safety and Quality in Health Care.
Members of the AGAR in 2019 were:
Australian Capital Territory
Peter Collignon and Susan Bradbury, The Canberra Hospital
New South Wales
Thomas Gottlieb and John Huynh, Concord Hospital
James Branley and Linda Douglass, Nepean Hospital
Angela Wong, Royal North Shore Hospital
Sebastiaan van Hal and Alicia Beukers, Royal Prince Alfred Hospital
Jon Iredell and Andrew Ginn, Westmead Hospital
Rod Givney and Bree Harris, John Hunter Hospital
Peter Newton and Melissa Hoddle, Wollongong Hospital
Jock Harkness and David Lorenz, St Vincent’s Hospital
15 of 18 health.gov.au/cdi Commun Dis Intell (2018) 2020;44(https://doi.org/10.33321/cdi.2020.44.71) Epub 15/09/2020
Michael Maley and Helen Ziochos, Liverpool Hospital
Monica Lahra and Peter Huntington, Sydney Children’s Hospital
Northern Territory
Rob Baird and Jann Hennessy, Royal Darwin Hospital
James McLeod, Alice Springs Hospital
Queensland
Enzo Binotto and Bronwyn Thomsett, Pathology Queensland Cairns Base Hospital
Graeme Nimmo and Narelle George, Pathology Queensland Central Laboratory, Royal Brisbane and Women’s Hospital
Petra Derrington and Cheryl Curtis, Pathology Queensland Gold Coast Hospital
Robert Horvath and Laura Martin, Pathology Queensland Prince Charles Hospital
Naomi Runnegar and Joel Douglas, Pathology Queensland Princess Alexandra Hospital
Jennifer Robson and Georgia Peachey, Sullivan Nicolaides Pathology, Greenslopes Hospital
Clare Nourse, Queensland Children’s Hospital
South Australia
Kelly Papanaoum and Xiao Ming Chen, SA Pathology, Flinders Medical Centre
Morgyn Warner and Kija Smith, SA Pathology, Royal Adelaide Hospital and Women’s and Children’s Hospital
Tasmania
Louise Cooley and David Jones, Royal Hobart Hospital
Pankaja Kalukottege and Kathy Wilcox, Launceston General Hospital
Victoria
Denis Spelman and Jacqueline Williams, The Alfred Hospital
Marcel Leroi and Elizabeth Grabsch, Austin Health
Tony Korman and Despina Kotsanas, Monash Medical Centre and Monash Children’s Hospital
Tony Korman and Kathryn Cisera, Dandenong Hospital
Andrew Daley and Gena Gonis, Royal Women’s and Children’s Hospital
Mary Jo Waters and Lisa Brenton, St Vincent’s Hospital
Western Australia
David McGechie and Denise Daley, PathWest Laboratory Medicine, WA Fiona Stanley Hospital
Ronan Murray and Jacinta Bowman, PathWest Laboratory Medicine, WA Sir Charles Gairdner Hospital
Michael Leung, PathWest Laboratory Medicine, Northwest WA
Owen Robinson and Geoffrey Coombs, PathWest Laboratory Medicine, WA Royal Perth Hospital
Sudha Pottumarthy-Boddu and Jacqueline Schuster, Australian Clinical Laboratories, St John of God Hospital, Murdoch
Shalinie Perera and Ian Meyer, Western Diagnostic Pathology, Joondalup Hospital
16 of 18 health.gov.au/cdiCommun Dis Intell (2018) 2020;44(https://doi.org/10.33321/cdi.2020.44.71) Epub 15/09/2020
Christopher Blyth, PathWest Laboratory Medicine, Perth Children’s Hospital
Author Details
Prof Geoffrey W Coombs,1,2
Ms Denise A Daley,2,3
Dr Shakeel Mowlaboccus,1
Dr Stanley Pang,1,2
on behalf of the Australian Group on Antimicrobial Resistance
1. Antimicrobial Resistance and Infectious Disease (AMRID) Research Laboratory, Murdoch University, Murdoch, Western Aus-tralia, Australia
2. Department of Microbiology, PathWest Labo-ratory Medicine-WA, Fiona Stanley Hospital, Murdoch, Western Australia, Australia
3. Australian Group on Antimicrobial Resist-ance, Fiona Stanley Hospital, Murdoch, Western Australia, Australia
Corresponding Author
Prof Geoffrey Coombs Antimicrobial Resistance and Infectious Disease (AMRID) Research Laboratory, Murdoch University, Murdoch, Western Australia, Australia Telephone: +61 8 6152 2397 Email: [email protected]
References
1. Laupland KB. Incidence of bloodstream in-fection: a review of population-based studies. Clin Microbiol Infect. 2013;19(6):492–500.
2. Johnson AP, Pearson A, Duckworth G. Sur-veillance and epidemiology of MRSA bacte-raemia in the UK. J Antimicrob Chemother. 2005;56(3):455–62.
3. Thwaites GE, Edgeworth JD, Gkrania-Klotsas E, Kirby A, Tilley R, Török ME et al. Clinical
management of Staphylococcus aureus bacte-raemia. Lancet Infect Dis. 2011;11(3):208–22.
4. Collignon P, Nimmo GR, Gottlieb T, Gosbell IB for the Australian Group on Antimi-crobial Resistance. Staphylococcus aureus bacteremia, Australia. Emerg Infect Dis. 2005;11(4):554–61.
5. Frederiksen MS, Espersen F, Frimodt-Møller N, Jensen AG, Larsen AR, Pallesen LV et al. Changing epidemiology of pediatric Staphy-lococcus aureus bacteremia in Denmark from 1971 through 2000. Pediatr Infect Dis J. 2007;26:398–405.
6. Benfield T, Espersen F, Frimodt-Møller N, Jensen AG, Larsen AR, Pallesen LV et al. Increasing incidence but decreasing in-hos-pital mortality of adult Staphylococcus aureus bacteraemia between 1981 and 2000. Clin Microbiol Infect. 2007;13(3):257–63.
7. van Hal SJ, Jensen SO, Vaska VL, Espedido BA, Paterson DL, Gosbell IB. Predictors of mortality in Staphylococcus aureus bactere-mia. Clin Microbiol Rev. 2012;25(2):362–86.
8. Kaasch AJ, Barlow G, Edgeworth JD, Fowler VG Jr, Hellmich M, Hopkins S et al. Staphy-lococcus aureus bloodstream infection: a pooled analysis of five prospective, observa-tional studies. J Infect. 2014;68(3):242–51.
9. Turnidge JD, Kotsanas D, Munckhof W, Rob-erts S, Bennett CM, Nimmo GR et al. Staphy-lococcus aureus bacteraemia: a major cause of mortality in Australia and New Zealand. Med J Aust. 2009;191(7):368–73.
10. Nimmo GR, Bell JM, Collignon PJ for the Australian Group on Antimicrobial Resist-ance. Fifteen years of surveillance by the Australian Group for Antimicrobial Resist-ance (AGAR). Commun Dis Intell Q Rep. 2003;27(Suppl):S47–54.
11. Coombs GW, Nimmo GR, Daly DA, Le TT, Pearson JC, Tan HL et al. Australian Staphy-
17 of 18 health.gov.au/cdi Commun Dis Intell (2018) 2020;44(https://doi.org/10.33321/cdi.2020.44.71) Epub 15/09/2020
lococcus aureus Sepsis Outcome Programme annual report, 2013. Commun Dis Intell Q Rep. 2014;38(4):E309–19.
12. Clinical and Laboratory Standards Institute (CLSI). M100. Performance standards for antimicrobial susceptibility testing; 30th Edi-tion. Villanova, PA, USA, January 2020.
13. The European Committee on Antimicrobial Susceptibility Testing (EUCAST). Breakpoint tables for interpretation of MICs and zone di-ameters. Version 10.0. Basel: EUCAST; 2020. Available from: https://www.eucast.org/fileadmin/src/media/PDFs/EUCAST_files/Breakpoint_tables/v_10.0_Breakpoint_Ta-bles.pdf.
14. Seemann T, Goncalves da Silva A, Bulach DM, Schultz MB, Kwong JC, Howden BP. Nullarbor. San Francisco; Github. [Accessed: 03 June 2016.] Available from: https://github.com/tseemann/nullarbor.
15. Clausen PTLC. Aarestrup FM, Lund O. Rapid and precise alignment of raw reads against redundant databases with KMA. BMC Bioinformatics. 2018;19(1):307.
16. International Working Group on The Classi-fication of Staphylococcal Cassette Chromo-some Elements (IWG-SCC). Classification of staphylococcal cassette chromosome mec (SCCmec): guidelines for reporting novel SCCmec elements. Antimicrob Agents Chem-other. 2009;53(12):4961–7.
17. Kondo Y, Ito T, Ma XX, Watanabe S, Kre-iswirth BN, Etienne J et al. Combination of multiplex PCRs for staphylococcal cassette chromosome mec type assignment: rapid identification system for mec, ccr and major difference in junkyard regions. Antimicrob Agents Chemother. 2007;51(1):264–74.
18. European Centre for Disease Prevention and Control (ECDC). Surveillance of antimicro-bial resistance in Europe 2018. [Internet.] Solna: ECDC; 2019. Available from: https://
www.ecdc.europa.eu/en/publications-data/surveillance-antimicrobial-resistance-eu-rope-2018.
19. Johnson AP, Davies J, Guy R, Abernethy J, Sheridan E, Pearson A et al. Mandatory sur-veillance of methicillin-resistant Staphylococ-cus aureus (MRSA) bacteraemia in England: the first 10 years. J Antimicrob Chemother. 2012;67(4):802–9.
20. de Kraker ME, Davey PG, Grundmann H, BURDEN study group. Mortality and hospi-tal stay associated with resistant Staphylococ-cus aureus and Escherichia coli bacteremia: estimating the burden of antibiotic resistance in Europe. PLoS Med. 2011;8(10):e1001104.
21. Johnson PD, Martin R, Burrell LJ, Grab-sch EA, Kirsa SW, O’Keeffe J et al. Efficacy of an alcohol/chlorhexidine hand hygiene program in a hospital with high rates of nosocomial methicillin-resistant Staphylococ-cus aureus (MRSA) infection. Med J Aust. 2005;183(10):509–14.
22. Vos MC, Behrendt MD, Melles DC, Molle-ma FP, de Groot W, Parlevliet G et al. 5 years of experience implementing a methicillin-resistant Staphylococcus aureus search and destroy policy at the largest university medi-cal center in the Netherlands. Infect Control Hosp Epidemiol. 2009;30(10):977–84.
23. Grayson ML, Jarvie LJ, Martin R, Johnson PD, Jodoin ME, McMullan C et al. Sig-nificant reductions in methicillin-resistant Staphylococcus aureus bacteraemia and clini-cal isolates associated with a multisite, hand hygiene culture-change program and sub-sequent successful statewide roll-out. Med J Aust. 2008;188(11):633–40.
24. Kim YC, Kim MH, Song JE, Ahn JY, Oh DH, Kweon OM et al. Trend of methicillin-resistant Staphylococcus aureus (MRSA) bacteremia in an institution with a high rate of MRSA after the reinforcement of antibiotic stewardship and hand hygiene. Am J Infect
18 of 18 health.gov.au/cdiCommun Dis Intell (2018) 2020;44(https://doi.org/10.33321/cdi.2020.44.71) Epub 15/09/2020
Control. 2013;41(5):e39–43.
25. Lawes T, Edwards B, López-Lozano JM, Gould I. Trends in Staphylococcus aureus bacteraemia and impacts of infection control practices including universal MRSA admis-sion screening in a hospital in Scotland, 2006–2010: retrospective cohort study and time-series intervention analysis. BMJ Open. 2012;2(3). pii: e000797.
26. Coombs GW, Daley DA, Thin Lee Y, Pear-son JC, Robinson JO, Nimmo GR et al. Australian Group on Antimicrobial Resist-ance Australian Staphylococcus aureus Sepsis Outcome Programme annual report, 2014. Commun Dis Intell Q Rep. 2016;40(2):E244–54.
27. Coombs GW, Daley DA, Lee YT, Pang S for the Australian Group on Antimicrobial Re-sistance. Australian Group on Antimicrobial Resistance (AGAR) Australian Staphylococ-cus aureus Sepsis Outcome Programme (AS-SOP) annual report 2016. Commun Dis Intell (2018). 2018;42. pii: S2209-6051(18)00021-0.
28. Coombs GW, Daley DA, Lee YT, Pang S, Bell JM, Turnidge JD et al. Australian Group on Antimicrobial Resistance (AGAR) Aus-tralian Staphylococcus aureus Sepsis Out-come Programme (ASSOP) Annual Report 2015. Commun Dis Intell(2018). 2018;42. pii: S2209-6051(18)00016-7.
29. Coombs GW, Daley DA, Lee YT, Pang S. Australian Group on Antimicrobial Re-sistance (AGAR) Australian Staphylococ-cus aureus Sepsis Outcome Programme (ASSOP) annual report 2017. Commun Dis Intell (2018). 2019;43. doi: https://doi.org/10.33321/cdi.2019.43.43.
30. Coombs GW, Daley DA, Mowlaboccus S, Lee YT, Pang S; Australian Group on Anti-microbial Resistance.Australian Group on Antimicrobial Resistance (AGAR) Australian Staphylococcus aureus Sepsis Outcome Pro-gramme (ASSOP) annual report 2018. Com-
mun Dis Intell (2018). 2020;44. doi: https://doi.org/10.33321/cdi.2020.44.18.
31. Coombs GW, Pearson JC, Nimmo GR, Collignon PJ, Bell JM, McLaws ML et al. Antimicrobial susceptibility of Staphylococ-cus aureus and molecular epidemiology of methicillin-resistant S. aureus isolated from Australian hospital inpatients: Report from the Australian Group on Antimicrobial Re-sistance 2011 Staphylococcus aureus Surveil-lance Programme. J Glob Antimicrob Resist. 2013;1(3):149–56.
32. O’Brien FG, Pearman JW, Gracey M, Ri-ley TV, Grubb WB. Community strain of methicillin-resistant Staphylococcus aureus involved in a hospital outbreak. J Clin Micro-biol. 1999;37(9):2858–62.
33. Schlebusch S, Price GR, Hinds S, Nourse C, Schooneveldt JM, Tilse MH et al. First outbreak of PVL-positive nonmultiresistant MRSA in a neonatal ICU in Australia: com-parison of MALDI-TOF and SNP-plus-bi-nary gene typing. Eur J Clin Microbiol Infect Dis. 2010;29(10):1311–4.