Embed Size (px)
Citation preview
Common Implementation Strategy for the Water Framework Directive
Environmental Quality Standards (EQS)
Substance Data Sheet
Priority Substance No. 21
Mercury and its Compounds
CAS-No. 7439-97-6
Final version Brussels, 15 January 2005
Disclaimer
This data sheet provides background information on the setting of the Environmental Quality Standard in accordance with Article 16 of the Water Framework Directive (2000/60/EC). The information was compiled, evaluated and used as outlined in the Manual [4] and has been discussed in a consultative process with the Expert Advisory Forum on Priority Substances and the Expert Group on Quality Standards. Furthermore, it has been peer-reviewed by the SCTEE [19]. The substance data sheet may, however, not necessarily represent the views of the European Commission.
New upcoming information was considered and included up to the date of finalisation of this data sheet. Information becoming available after finalisation of this document will be evaluated in the review process of priority substances according to Art. 16(4) of the Water Framework Directive. If necessary, the Environmental Quality Standard substance data sheets will then be revised in the light of technical and scientific progress.
Substance Data Sheet (21) Mercury and its Compounds Final Version of 15.01. 2005
- 1 -
1 Identity of substance Priority Substance No: 21 Mercury and its compounds CAS-Number: 7439-97-6 Classification WFD Priority List *: PHS
* PS: priority substance; PHS: priority hazardous substance; PSR: priority substance under review according to Decision 2455/2001.
2 Proposed quality standards
Note:
Although in this data sheet the use of the Added Risk Approach is suggested for setting quality standards for cadmium and its compounds (see section 8) the Commission may decide to refer to the Total Risk Approach and propose quality standards that already account for and comprise the natural background concentration.
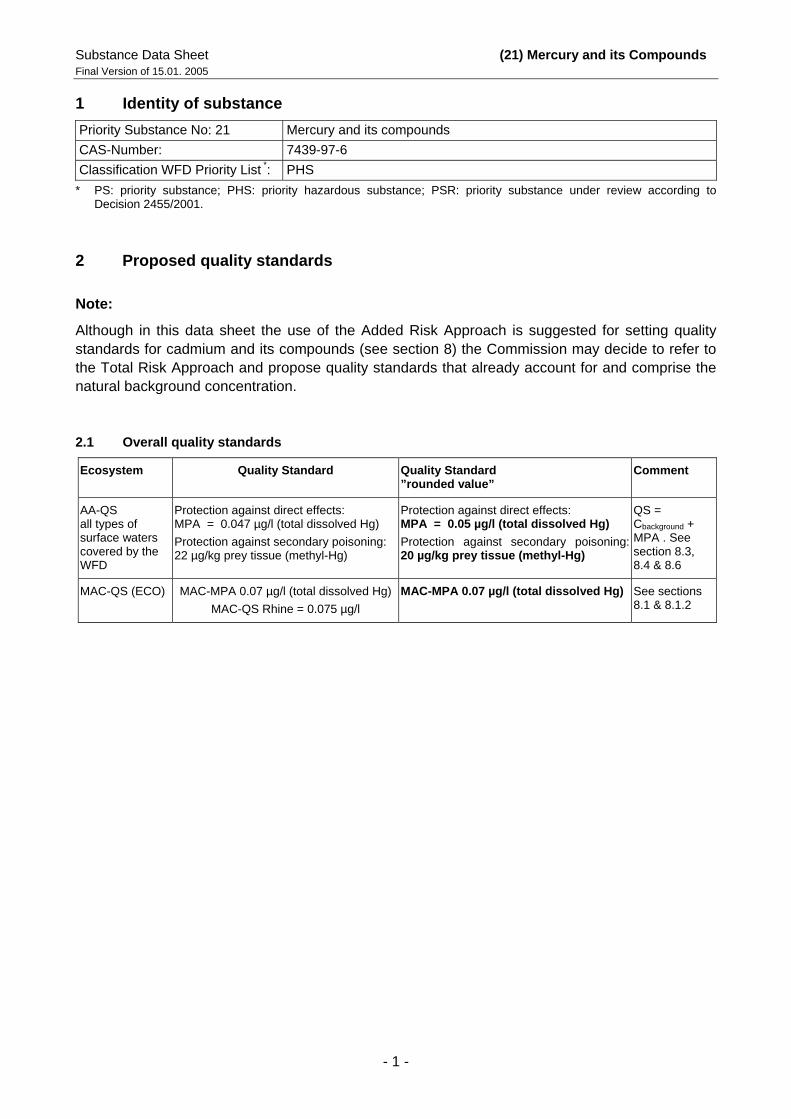
2.1 Overall quality standards
Ecosystem Quality Standard Quality Standard ”rounded value”
Comment
AA-QS all types of surface waters covered by the WFD
Protection against direct effects: MPA = 0.047 µg/l (total dissolved Hg) Protection against secondary poisoning:22 µg/kg prey tissue (methyl-Hg)
Protection against direct effects: MPA = 0.05 µg/l (total dissolved Hg) Protection against secondary poisoning: 20 µg/kg prey tissue (methyl-Hg)
QS = Cbackground + MPA . See section 8.3, 8.4 & 8.6
MAC-QS (ECO) MAC-MPA 0.07 µg/l (total dissolved Hg) MAC-QS Rhine = 0.075 µg/l
MAC-MPA 0.07 µg/l (total dissolved Hg) See sections 8.1 & 8.1.2
Substance Data Sheet (21) Mercury and its Compounds Final Version of 15.01. 2005
- 2 -
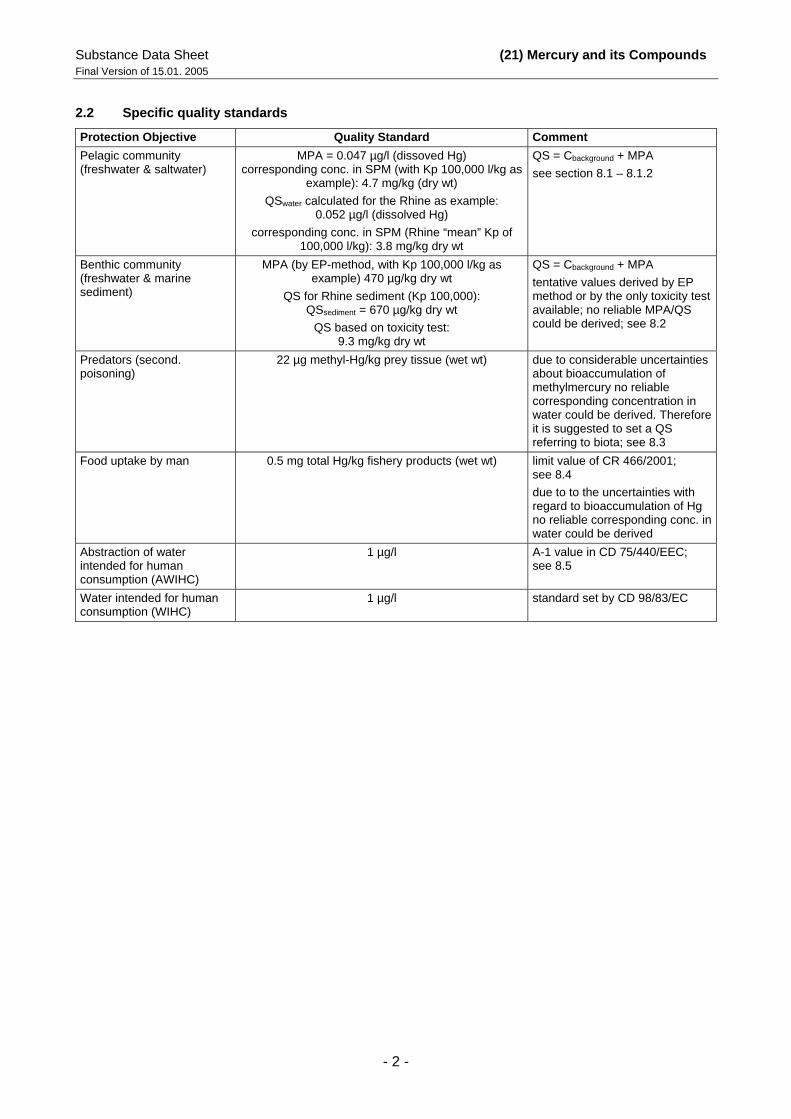
2.2 Specific quality standards
Protection Objective Quality Standard Comment Pelagic community (freshwater & saltwater)
MPA = 0.047 µg/l (dissoved Hg) corresponding conc. in SPM (with Kp 100,000 l/kg as
example): 4.7 mg/kg (dry wt) QSwater calculated for the Rhine as example:
0.052 µg/l (dissolved Hg) corresponding conc. in SPM (Rhine “mean” Kp of
100,000 l/kg): 3.8 mg/kg dry wt
QS = Cbackground + MPA see section 8.1 – 8.1.2
Benthic community (freshwater & marine sediment)
MPA (by EP-method, with Kp 100,000 l/kg as example) 470 µg/kg dry wt
QS for Rhine sediment (Kp 100,000): QSsediment = 670 µg/kg dry wt
QS based on toxicity test: 9.3 mg/kg dry wt
QS = Cbackground + MPA tentative values derived by EP method or by the only toxicity test available; no reliable MPA/QS could be derived; see 8.2
Predators (second. poisoning)
22 µg methyl-Hg/kg prey tissue (wet wt)
due to considerable uncertainties about bioaccumulation of methylmercury no reliable corresponding concentration in water could be derived. Therefore it is suggested to set a QS referring to biota; see 8.3
Food uptake by man 0.5 mg total Hg/kg fishery products (wet wt)
limit value of CR 466/2001; see 8.4 due to to the uncertainties with regard to bioaccumulation of Hg no reliable corresponding conc. in water could be derived
Abstraction of water intended for human consumption (AWIHC)
1 µg/l A-1 value in CD 75/440/EEC; see 8.5
Water intended for human consumption (WIHC)
1 µg/l standard set by CD 98/83/EC
Substance Data Sheet (21) Mercury and its Compounds Final Version of 15.01. 2005
- 3 -
3 Classification CAS No. Name R-Phrases and Labelling Reference 7439-97-6 Mercury and its
compounds T; R23 - R33 - N; R50-53 [20]
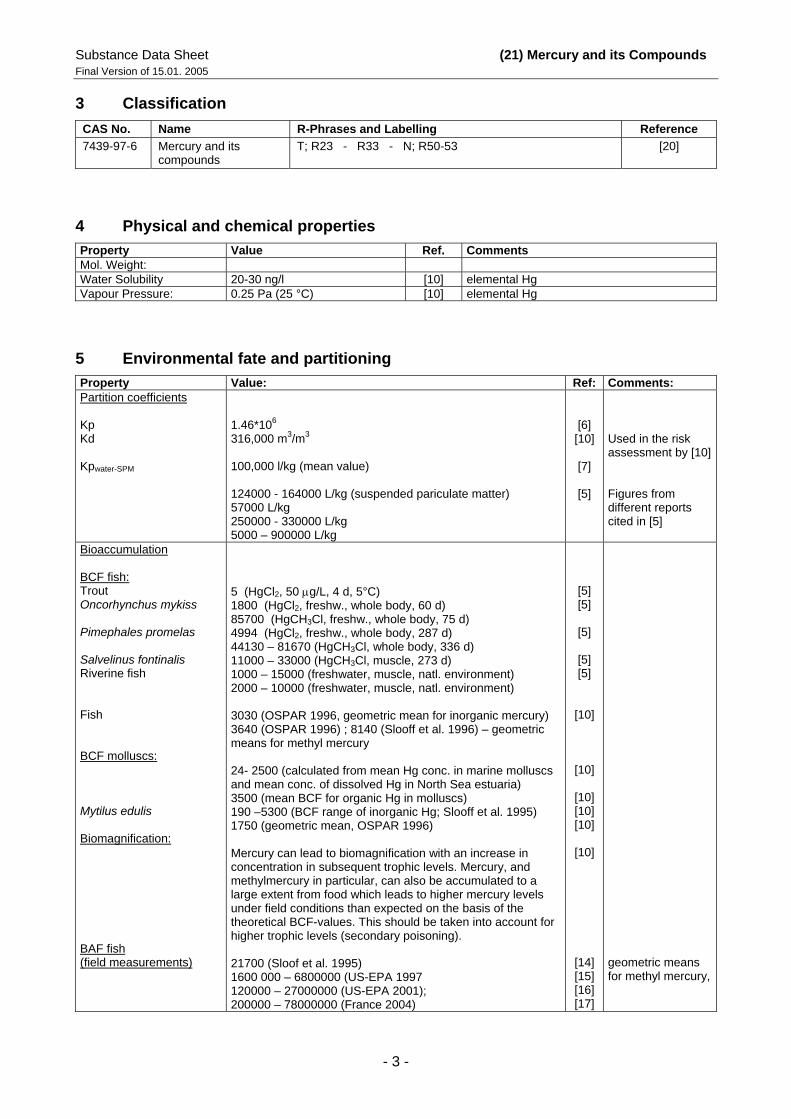
4 Physical and chemical properties Property Value Ref. Comments Mol. Weight: Water Solubility 20-30 ng/l [10] elemental Hg Vapour Pressure: 0.25 Pa (25 °C) [10] elemental Hg
5 Environmental fate and partitioning Property Value: Ref: Comments: Partition coefficients Kp Kd Kpwater-SPM
1.46*106
316,000 m3/m3 100,000 l/kg (mean value) 124000 - 164000 L/kg (suspended pariculate matter) 57000 L/kg 250000 - 330000 L/kg 5000 – 900000 L/kg
[6] [10]
[7]
[5]
Used in the risk assessment by [10] Figures from different reports cited in [5]
Bioaccumulation BCF fish: Trout Oncorhynchus mykiss Pimephales promelas Salvelinus fontinalis Riverine fish Fish BCF molluscs: Mytilus edulis Biomagnification: BAF fish (field measurements)
5 (HgCl2, 50 µg/L, 4 d, 5°C) 1800 (HgCl2, freshw., whole body, 60 d) 85700 (HgCH3Cl, freshw., whole body, 75 d) 4994 (HgCl2, freshw., whole body, 287 d) 44130 – 81670 (HgCH3Cl, whole body, 336 d) 11000 – 33000 (HgCH3Cl, muscle, 273 d) 1000 – 15000 (freshwater, muscle, natl. environment) 2000 – 10000 (freshwater, muscle, natl. environment) 3030 (OSPAR 1996, geometric mean for inorganic mercury) 3640 (OSPAR 1996) ; 8140 (Slooff et al. 1996) – geometric means for methyl mercury 24- 2500 (calculated from mean Hg conc. in marine molluscs and mean conc. of dissolved Hg in North Sea estuaria) 3500 (mean BCF for organic Hg in molluscs) 190 –5300 (BCF range of inorganic Hg; Slooff et al. 1995) 1750 (geometric mean, OSPAR 1996) Mercury can lead to biomagnification with an increase in concentration in subsequent trophic levels. Mercury, and methylmercury in particular, can also be accumulated to a large extent from food which leads to higher mercury levels under field conditions than expected on the basis of the theoretical BCF-values. This should be taken into account for higher trophic levels (secondary poisoning). 21700 (Sloof et al. 1995) 1600 000 – 6800000 (US-EPA 1997 120000 – 27000000 (US-EPA 2001); 200000 – 78000000 (France 2004)
[5] [5]
[5]
[5] [5]
[10]
[10]
[10] [10] [10]
[10]
[14] [15] [16] [17]
geometric means for methyl mercury,
Substance Data Sheet (21) Mercury and its Compounds Final Version of 15.01. 2005
- 4 -
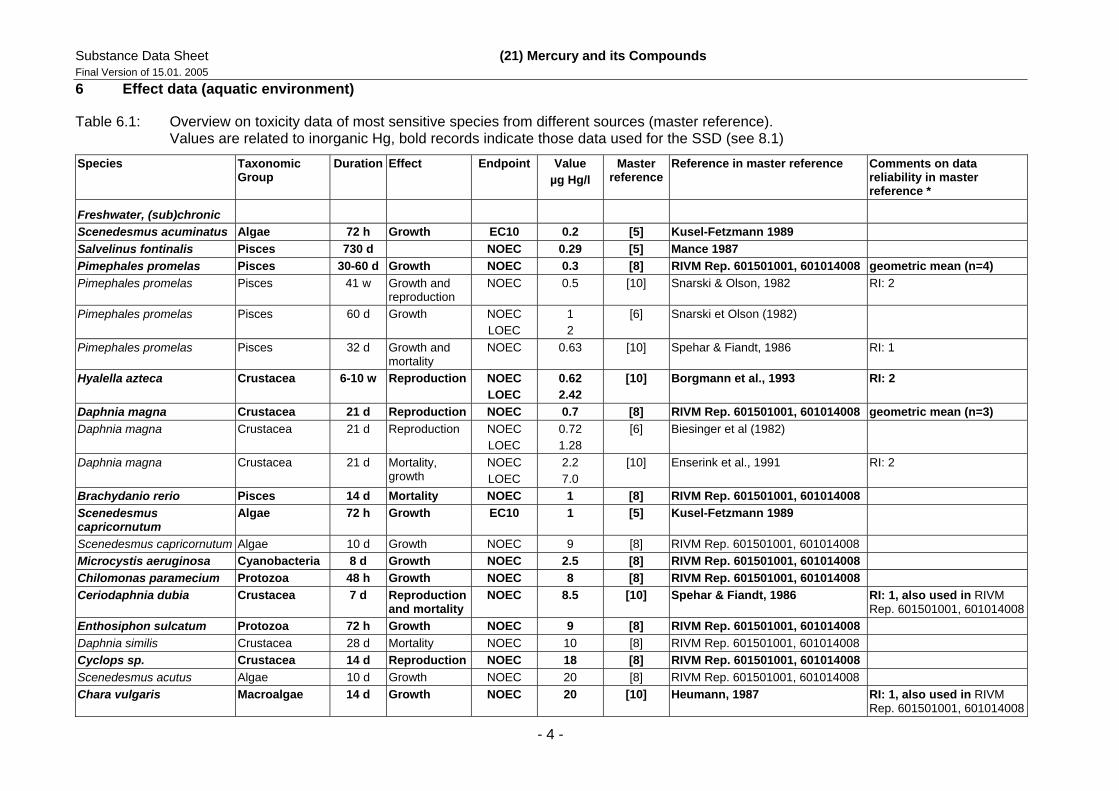
6 Effect data (aquatic environment)
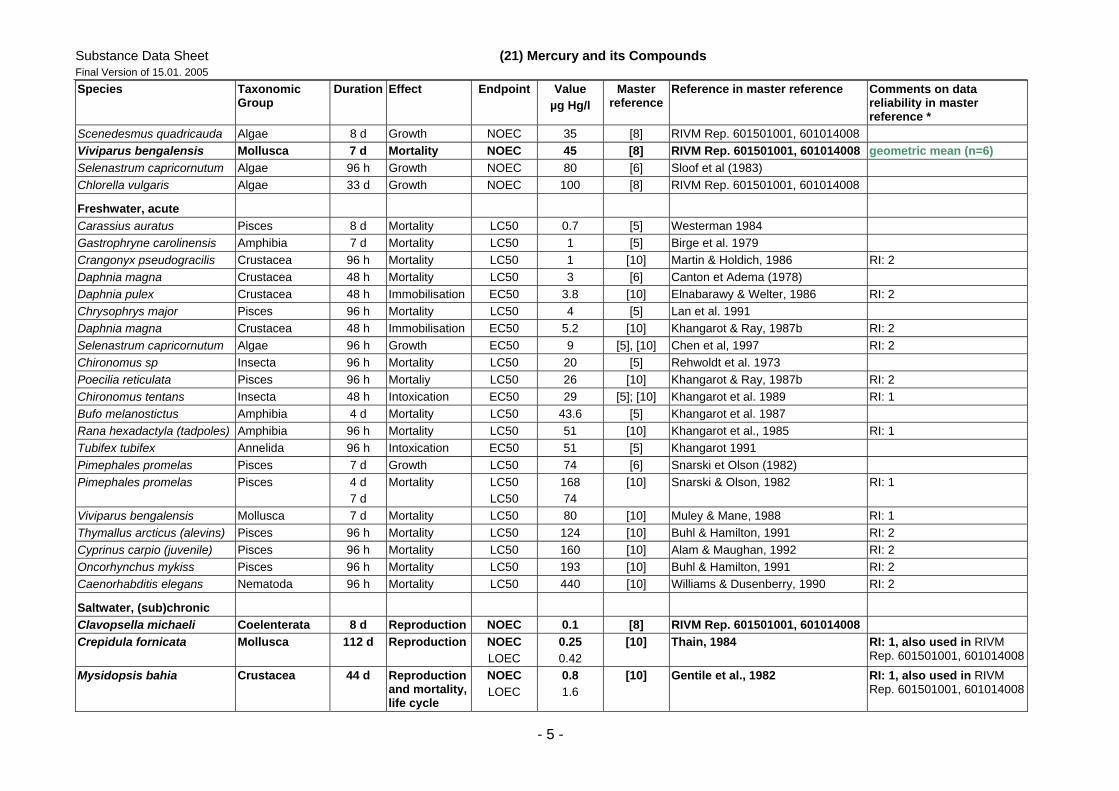
Table 6.1: Overview on toxicity data of most sensitive species from different sources (master reference). Values are related to inorganic Hg, bold records indicate those data used for the SSD (see 8.1) Species Taxonomic
Group Duration Effect Endpoint Value
µg Hg/l Master
referenceReference in master reference Comments on data
reliability in master reference *
Freshwater, (sub)chronic Scenedesmus acuminatus Algae 72 h Growth EC10 0.2 [5] Kusel-Fetzmann 1989 Salvelinus fontinalis Pisces 730 d NOEC 0.29 [5] Mance 1987 Pimephales promelas Pisces 30-60 d Growth NOEC 0.3 [8] RIVM Rep. 601501001, 601014008 geometric mean (n=4) Pimephales promelas Pisces 41 w Growth and
reproduction NOEC 0.5 [10] Snarski & Olson, 1982 RI: 2
Pimephales promelas Pisces 60 d Growth NOEC LOEC
1 2
[6] Snarski et Olson (1982)
Pimephales promelas Pisces 32 d Growth and mortality
NOEC 0.63 [10] Spehar & Fiandt, 1986 RI: 1
Hyalella azteca Crustacea 6-10 w Reproduction NOEC LOEC
0.62 2.42
[10] Borgmann et al., 1993 RI: 2
Daphnia magna Crustacea 21 d Reproduction NOEC 0.7 [8] RIVM Rep. 601501001, 601014008 geometric mean (n=3) Daphnia magna Crustacea 21 d Reproduction NOEC
LOEC 0.72 1.28
[6] Biesinger et al (1982)
Daphnia magna Crustacea 21 d Mortality, growth
NOEC LOEC
2.2 7.0
[10] Enserink et al., 1991 RI: 2
Brachydanio rerio Pisces 14 d Mortality NOEC 1 [8] RIVM Rep. 601501001, 601014008 Scenedesmus capricornutum
Algae 72 h Growth EC10 1 [5] Kusel-Fetzmann 1989
Scenedesmus capricornutum Algae 10 d Growth NOEC 9 [8] RIVM Rep. 601501001, 601014008 Microcystis aeruginosa Cyanobacteria 8 d Growth NOEC 2.5 [8] RIVM Rep. 601501001, 601014008 Chilomonas paramecium Protozoa 48 h Growth NOEC 8 [8] RIVM Rep. 601501001, 601014008 Ceriodaphnia dubia Crustacea 7 d Reproduction
and mortality NOEC 8.5 [10] Spehar & Fiandt, 1986 RI: 1, also used in RIVM
Rep. 601501001, 601014008 Enthosiphon sulcatum Protozoa 72 h Growth NOEC 9 [8] RIVM Rep. 601501001, 601014008 Daphnia similis Crustacea 28 d Mortality NOEC 10 [8] RIVM Rep. 601501001, 601014008 Cyclops sp. Crustacea 14 d Reproduction NOEC 18 [8] RIVM Rep. 601501001, 601014008 Scenedesmus acutus Algae 10 d Growth NOEC 20 [8] RIVM Rep. 601501001, 601014008 Chara vulgaris Macroalgae 14 d Growth NOEC 20 [10] Heumann, 1987 RI: 1, also used in RIVM
Rep. 601501001, 601014008
Substance Data Sheet (21) Mercury and its Compounds Final Version of 15.01. 2005
- 5 -
Species Taxonomic Group
Duration Effect Endpoint Value µg Hg/l
Master reference
Reference in master reference Comments on data reliability in master reference *
Scenedesmus quadricauda Algae 8 d Growth NOEC 35 [8] RIVM Rep. 601501001, 601014008 Viviparus bengalensis Mollusca 7 d Mortality NOEC 45 [8] RIVM Rep. 601501001, 601014008 geometric mean (n=6) Selenastrum capricornutum Algae 96 h Growth NOEC 80 [6] Sloof et al (1983) Chlorella vulgaris Algae 33 d Growth NOEC 100 [8] RIVM Rep. 601501001, 601014008
Freshwater, acute Carassius auratus Pisces 8 d Mortality LC50 0.7 [5] Westerman 1984 Gastrophryne carolinensis Amphibia 7 d Mortality LC50 1 [5] Birge et al. 1979 Crangonyx pseudogracilis Crustacea 96 h Mortality LC50 1 [10] Martin & Holdich, 1986 RI: 2 Daphnia magna Crustacea 48 h Mortality LC50 3 [6] Canton et Adema (1978) Daphnia pulex Crustacea 48 h Immobilisation EC50 3.8 [10] Elnabarawy & Welter, 1986 RI: 2 Chrysophrys major Pisces 96 h Mortality LC50 4 [5] Lan et al. 1991 Daphnia magna Crustacea 48 h Immobilisation EC50 5.2 [10] Khangarot & Ray, 1987b RI: 2 Selenastrum capricornutum Algae 96 h Growth EC50 9 [5], [10] Chen et al, 1997 RI: 2 Chironomus sp Insecta 96 h Mortality LC50 20 [5] Rehwoldt et al. 1973 Poecilia reticulata Pisces 96 h Mortaliy LC50 26 [10] Khangarot & Ray, 1987b RI: 2 Chironomus tentans Insecta 48 h Intoxication EC50 29 [5]; [10] Khangarot et al. 1989 RI: 1 Bufo melanostictus Amphibia 4 d Mortality LC50 43.6 [5] Khangarot et al. 1987 Rana hexadactyla (tadpoles) Amphibia 96 h Mortality LC50 51 [10] Khangarot et al., 1985 RI: 1 Tubifex tubifex Annelida 96 h Intoxication EC50 51 [5] Khangarot 1991 Pimephales promelas Pisces 7 d Growth LC50 74 [6] Snarski et Olson (1982) Pimephales promelas Pisces 4 d
7 d Mortality LC50
LC50 168 74
[10] Snarski & Olson, 1982 RI: 1
Viviparus bengalensis Mollusca 7 d Mortality LC50 80 [10] Muley & Mane, 1988 RI: 1 Thymallus arcticus (alevins) Pisces 96 h Mortality LC50 124 [10] Buhl & Hamilton, 1991 RI: 2 Cyprinus carpio (juvenile) Pisces 96 h Mortality LC50 160 [10] Alam & Maughan, 1992 RI: 2 Oncorhynchus mykiss Pisces 96 h Mortality LC50 193 [10] Buhl & Hamilton, 1991 RI: 2 Caenorhabditis elegans Nematoda 96 h Mortality LC50 440 [10] Williams & Dusenberry, 1990 RI: 2
Saltwater, (sub)chronic Clavopsella michaeli Coelenterata 8 d Reproduction NOEC 0.1 [8] RIVM Rep. 601501001, 601014008 Crepidula fornicata Mollusca 112 d Reproduction NOEC
LOEC 0.25 0.42
[10] Thain, 1984 RI: 1, also used in RIVM Rep. 601501001, 601014008
Mysidopsis bahia Crustacea 44 d Reproduction and mortality, life cycle
NOEC LOEC
0.8 1.6
[10] Gentile et al., 1982 RI: 1, also used in RIVM Rep. 601501001, 601014008
Substance Data Sheet (21) Mercury and its Compounds Final Version of 15.01. 2005
- 6 -
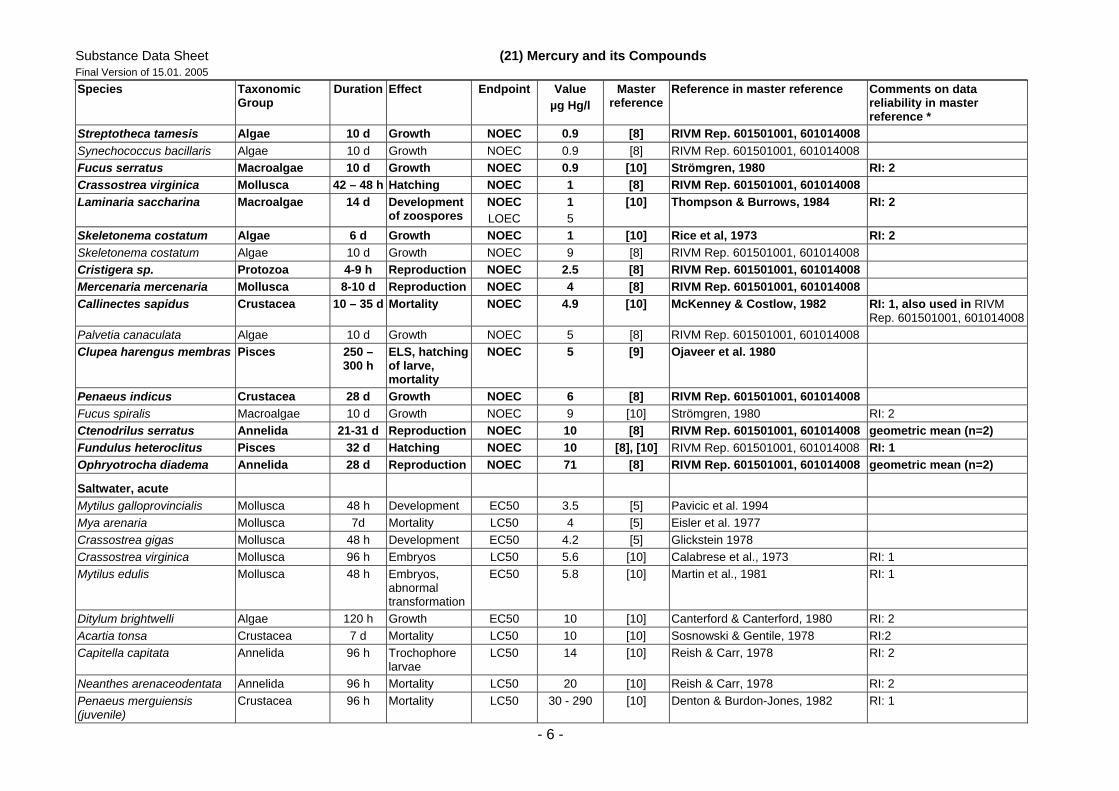
Species Taxonomic Group
Duration Effect Endpoint Value µg Hg/l
Master reference
Reference in master reference Comments on data reliability in master reference *
Streptotheca tamesis Algae 10 d Growth NOEC 0.9 [8] RIVM Rep. 601501001, 601014008 Synechococcus bacillaris Algae 10 d Growth NOEC 0.9 [8] RIVM Rep. 601501001, 601014008 Fucus serratus Macroalgae 10 d Growth NOEC 0.9 [10] Strömgren, 1980 RI: 2 Crassostrea virginica Mollusca 42 – 48 h Hatching NOEC 1 [8] RIVM Rep. 601501001, 601014008 Laminaria saccharina Macroalgae 14 d Development
of zoospores NOEC LOEC
1 5
[10] Thompson & Burrows, 1984 RI: 2
Skeletonema costatum Algae 6 d Growth NOEC 1 [10] Rice et al, 1973 RI: 2 Skeletonema costatum Algae 10 d Growth NOEC 9 [8] RIVM Rep. 601501001, 601014008 Cristigera sp. Protozoa 4-9 h Reproduction NOEC 2.5 [8] RIVM Rep. 601501001, 601014008 Mercenaria mercenaria Mollusca 8-10 d Reproduction NOEC 4 [8] RIVM Rep. 601501001, 601014008 Callinectes sapidus Crustacea 10 – 35 d Mortality NOEC 4.9 [10] McKenney & Costlow, 1982 RI: 1, also used in RIVM
Rep. 601501001, 601014008 Palvetia canaculata Algae 10 d Growth NOEC 5 [8] RIVM Rep. 601501001, 601014008 Clupea harengus membras Pisces 250 –
300 h ELS, hatching of larve, mortality
NOEC 5 [9] Ojaveer et al. 1980
Penaeus indicus Crustacea 28 d Growth NOEC 6 [8] RIVM Rep. 601501001, 601014008 Fucus spiralis Macroalgae 10 d Growth NOEC 9 [10] Strömgren, 1980 RI: 2 Ctenodrilus serratus Annelida 21-31 d Reproduction NOEC 10 [8] RIVM Rep. 601501001, 601014008 geometric mean (n=2) Fundulus heteroclitus Pisces 32 d Hatching NOEC 10 [8], [10] RIVM Rep. 601501001, 601014008 RI: 1 Ophryotrocha diadema Annelida 28 d Reproduction NOEC 71 [8] RIVM Rep. 601501001, 601014008 geometric mean (n=2)
Saltwater, acute Mytilus galloprovincialis Mollusca 48 h Development EC50 3.5 [5] Pavicic et al. 1994 Mya arenaria Mollusca 7d Mortality LC50 4 [5] Eisler et al. 1977 Crassostrea gigas Mollusca 48 h Development EC50 4.2 [5] Glickstein 1978 Crassostrea virginica Mollusca 96 h Embryos LC50 5.6 [10] Calabrese et al., 1973 RI: 1 Mytilus edulis Mollusca 48 h Embryos,
abnormal transformation
EC50 5.8 [10] Martin et al., 1981 RI: 1
Ditylum brightwelli Algae 120 h Growth EC50 10 [10] Canterford & Canterford, 1980 RI: 2 Acartia tonsa Crustacea 7 d Mortality LC50 10 [10] Sosnowski & Gentile, 1978 RI:2 Capitella capitata Annelida 96 h Trochophore
larvae LC50 14 [10] Reish & Carr, 1978 RI: 2
Neanthes arenaceodentata Annelida 96 h Mortality LC50 20 [10] Reish & Carr, 1978 RI: 2 Penaeus merguiensis (juvenile)
Crustacea 96 h Mortality LC50 30 - 290 [10] Denton & Burdon-Jones, 1982 RI: 1
Substance Data Sheet (21) Mercury and its Compounds Final Version of 15.01. 2005
- 7 -
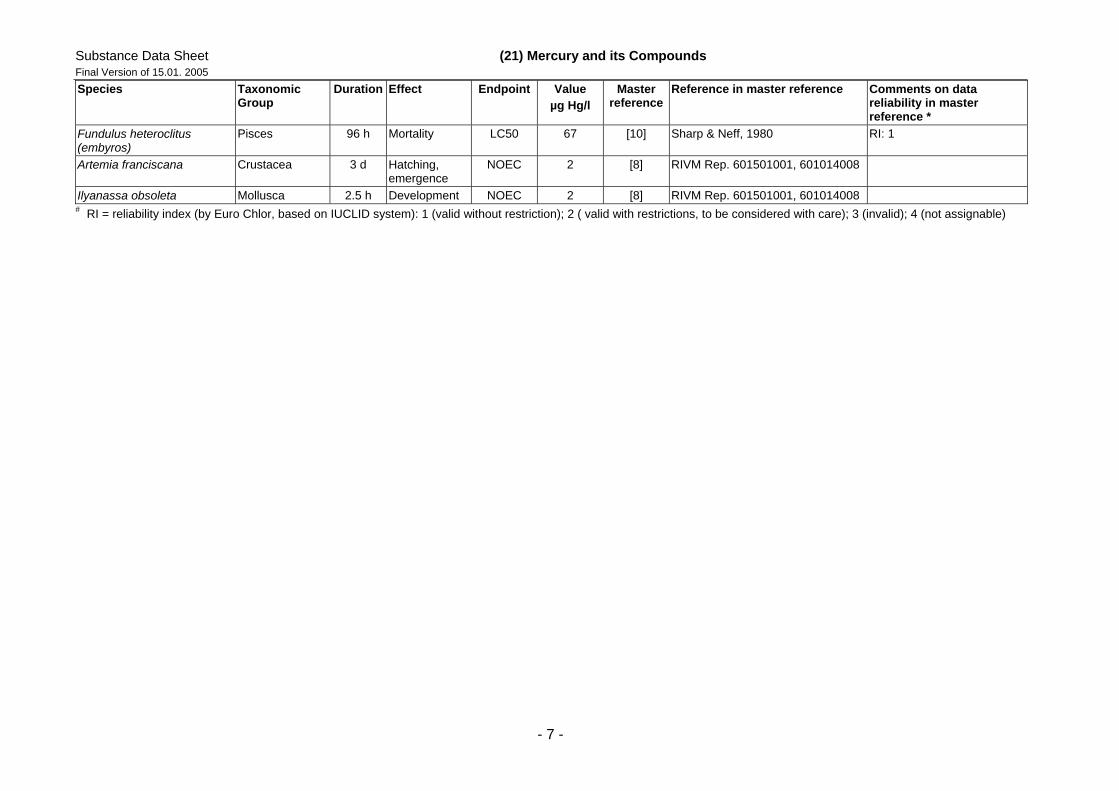
Species Taxonomic Group
Duration Effect Endpoint Value µg Hg/l
Master reference
Reference in master reference Comments on data reliability in master reference *
Fundulus heteroclitus (embyros)
Pisces 96 h Mortality LC50 67 [10] Sharp & Neff, 1980 RI: 1
Artemia franciscana Crustacea 3 d Hatching, emergence
NOEC 2 [8] RIVM Rep. 601501001, 601014008
Ilyanassa obsoleta Mollusca 2.5 h Development NOEC 2 [8] RIVM Rep. 601501001, 601014008 # RI = reliability index (by Euro Chlor, based on IUCLID system): 1 (valid without restriction); 2 ( valid with restrictions, to be considered with care); 3 (invalid); 4 (not assignable)
Substance Data Sheet (21) Mercury and its Compounds Final Version of 15.01. 2005
- 8 -
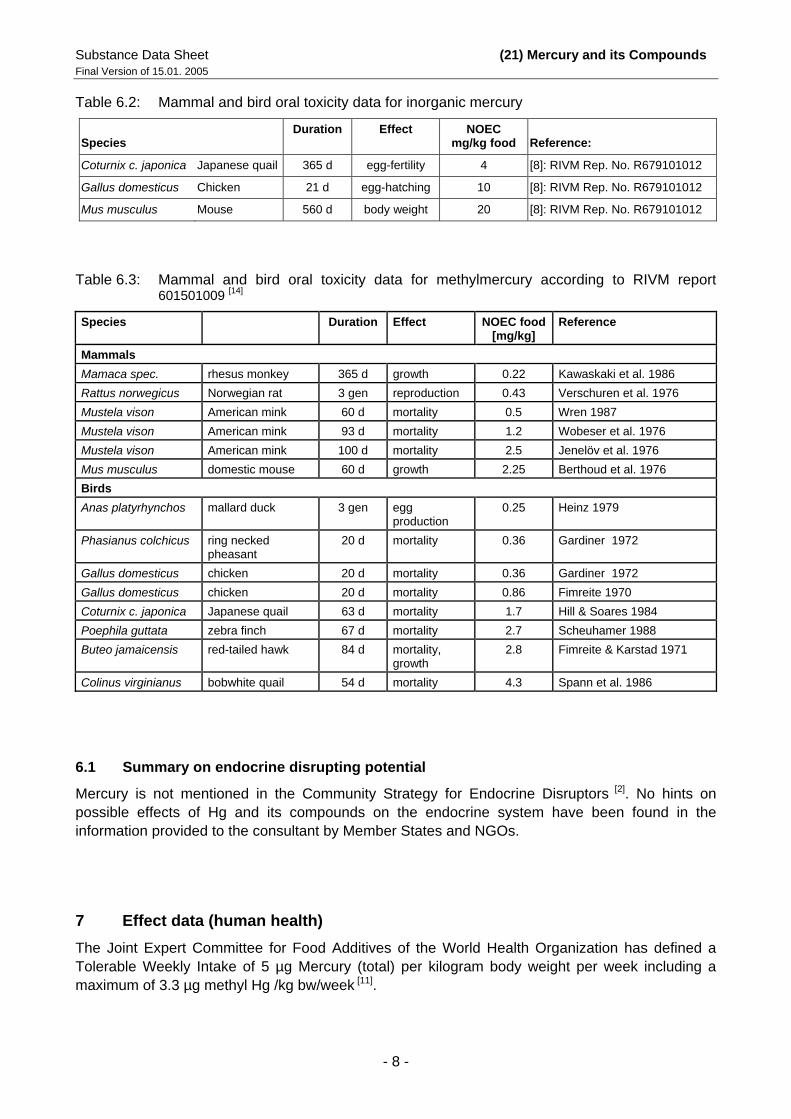
Table 6.2: Mammal and bird oral toxicity data for inorganic mercury
Species Duration Effect NOEC
mg/kg food Reference:
Coturnix c. japonica Japanese quail 365 d egg-fertility 4 [8]: RIVM Rep. No. R679101012
Gallus domesticus Chicken 21 d egg-hatching 10 [8]: RIVM Rep. No. R679101012
Mus musculus Mouse 560 d body weight 20 [8]: RIVM Rep. No. R679101012
Table 6.3: Mammal and bird oral toxicity data for methylmercury according to RIVM report 601501009 [14]
Species Duration Effect NOEC food[mg/kg]
Reference
Mammals Mamaca spec. rhesus monkey 365 d growth 0.22 Kawaskaki et al. 1986 Rattus norwegicus Norwegian rat 3 gen reproduction 0.43 Verschuren et al. 1976 Mustela vison American mink 60 d mortality 0.5 Wren 1987 Mustela vison American mink 93 d mortality 1.2 Wobeser et al. 1976 Mustela vison American mink 100 d mortality 2.5 Jenelöv et al. 1976 Mus musculus domestic mouse 60 d growth 2.25 Berthoud et al. 1976 Birds Anas platyrhynchos mallard duck 3 gen egg
production 0.25 Heinz 1979
Phasianus colchicus ring necked pheasant
20 d mortality 0.36 Gardiner 1972
Gallus domesticus chicken 20 d mortality 0.36 Gardiner 1972 Gallus domesticus chicken 20 d mortality 0.86 Fimreite 1970 Coturnix c. japonica Japanese quail 63 d mortality 1.7 Hill & Soares 1984 Poephila guttata zebra finch 67 d mortality 2.7 Scheuhamer 1988 Buteo jamaicensis red-tailed hawk 84 d mortality,
growth 2.8 Fimreite & Karstad 1971
Colinus virginianus bobwhite quail 54 d mortality 4.3 Spann et al. 1986
6.1 Summary on endocrine disrupting potential
Mercury is not mentioned in the Community Strategy for Endocrine Disruptors [2]. No hints on possible effects of Hg and its compounds on the endocrine system have been found in the information provided to the consultant by Member States and NGOs.
7 Effect data (human health) The Joint Expert Committee for Food Additives of the World Health Organization has defined a Tolerable Weekly Intake of 5 µg Mercury (total) per kilogram body weight per week including a maximum of 3.3 µg methyl Hg /kg bw/week [11].
Substance Data Sheet (21) Mercury and its Compounds Final Version of 15.01. 2005
- 9 -
The U.S.-EPA has derived an Oral Reference Dose (RfD) for methyl-mercury in fish [16]. The RfD is an estimate (with uncertainty spanning perhaps an order of magnitude) of a daily exposure to the human population (including sensitive subgroups) that is likely to be without an appreciable risk of deleterious effects during a lifetime. It hence is comparable with a tolerable daily intake (TDI). The RfD is 0.3 mg methyl-Hg/kg edible fish tissue for a daily fish/fishery product consumption of 17.5 g. EPA strongly recommends to adjust the RfD using local data on fishery product consumption rather than to use the default values.
8 Calculation of quality standards According to section 8.6 of the draft report on the identification of quality standards [4] the added risk approach is used to derive the water quality standards for mercury.
QSwater = Cbackground + MPA
8.1 Maximum permissible addition (MPA) for water There are many long-term no effect and short-term acute toxicity data for a broad range of species from different taxonomic groups available (see table 6.1 for a selection). With regard to long-term/chronic exposure algae, fish and crustaceans appear to be the most sensitive groups in freshwater whereas in saltwater molluscs and coelenterata (e.g. jellyfish) appear to be even more sensitive as the before mentioned groups. However, as there is obviously no difference in the lower limit of the sensitivity range of freshwater and saltwater species, it is suggested to derive the quality standards applicable to freshwater or saltwater environments from the same data set (i.e. the data reported in table 6.1).
The TGD [3] offers the option to support the effects assessment performed with the assessment factor method by a statistical extrapolation method if the database is sufficient for its application. The TGD requires reliable NOECs from chronic/long-term studies for a minimum of 10 (preferably more than 15) different species from at least 8 taxonomic groups. In the mercury database long-term/chronic NOECs are available for 9 different taxonomic groups (freshwater & saltwater together, 7 groups for each of the environments). However, of the minimum species requirement mentioned in section 3.3.1.2 of the TGD, only tests with higher plant species are not available. Since it is known that higher plants are not the group most sensitive to mercury it was deemed reasonable to apply a statistical extrapolation method in order to explore to which extent the results of this method and the standard TGD assessment factor method differ. Details of application and the results of the SSD method are described in section 8.1.1.
According to section 4.46 of the Manual [4] the added risk approach is used to derive the water quality standards for mercury.
QSwater = Cbackground + MPA
Freshwater
Long-term toxicity data as well as short-term acute data are available for many species of 9 different taxonomic groups. The lowest NOEC has been obtained for the marine coelenterate Clavopsella michaeli (0.1 µg/l) but the lowest freshwater toxicity test result is only slightly higher
Substance Data Sheet (21) Mercury and its Compounds Final Version of 15.01. 2005
- 10 -
(0.2 µg/l, EC10 of Scenedesmus acuminatus). The appropriate assessment factor according to the TGD [3] is 10 (long-term toxicity data across at least 3 trophic levels for 3 different taxonomic groups are available and the species for which the lowest acute result has been obtained belongs to the groups for which long-term data are available). Therefore the maximum permissible addition of mercury to the background concentration is calculated as follows:
MPAfreshwater = 0.1 µg/l / AF (10) = 0.01 µg Mercury /l
Transitional, coastal and territorial waters
As there is a comprehensive data base on marine species available it is suggested in accordance with the section on marine risk assessment in the TGD [3] to apply a safety factor of 10 on the lowest reported NOEC. Hence, the suggested quality standard for the saltwater pelagic community is equal to that calculated for freshwater.
MPAsaltwater = MPAfreshwater = 0.01 µg Mercury /l
Maximum permissible addition for transient concentration peaks (MAC-MPA)
The MAC-QS is calculated as Cbackground + MAC-MPA (where MAC-MPA is the maximum permissible addition based on acute toxicity data).
It is suggested to derive the MAC-MPA on the basis of the lowest acute toxicity test available. This is a 8 days test with the Gold fish Carassius auratus. The LC50 reported is 0.7 µg/l. Based on the guidance given in the TGD on the effects assessment for intermittent releases (section 4.4.7 of the Manual [4]) it is suggested to apply a reduced assessment factor of 10 on the selected LC50 in order to derive the MAC-MPA. This appears justified as acute test results are available for a very broad spectrum of freshwater and marine taxonomic groups showing that these groups do not have a higher acute sensitivity to inorganic mercury.
MAC-MPA = 0.7 µg/l / AF (10) = 0.07 µg Mercury /l
8.1.1 Calculation of the maximum permissible addition by statistical extrapolation
The 5-percentile cut-off value (5P-COV) was calculated with the method of Aldenberg & Jaworska
[13] (for details see also sections 4.4.2 and 4.3.4 of the Manual [4]). For the calculation the software package ETX 1.407 was used [11].
The toxicity tests given in bold in table 6.1 were used as input-data. As far as possible the different taxonomic groups have been given equal weight (i.e. the same numbers of toxicity tests per taxonomic group have been included if enough data were available, only one test result per species was used).
Substance Data Sheet (21) Mercury and its Compounds Final Version of 15.01. 2005
- 11 -
The 5P-COVs of the species sensitivity distribution have been calculated for 3 data sets:
1. set of selected freshwater and saltwater NOECs 2. set of selected freshwater NOECs 3. set of selected saltwater NOECs
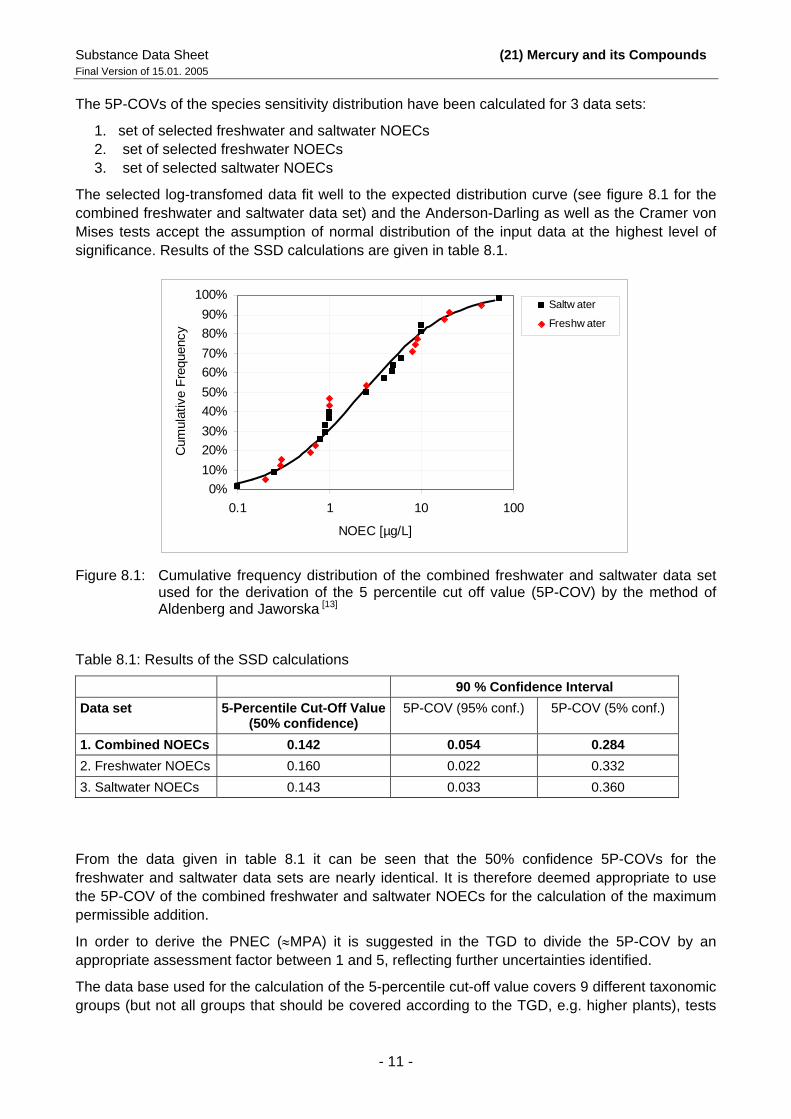
The selected log-transfomed data fit well to the expected distribution curve (see figure 8.1 for the combined freshwater and saltwater data set) and the Anderson-Darling as well as the Cramer von Mises tests accept the assumption of normal distribution of the input data at the highest level of significance. Results of the SSD calculations are given in table 8.1.
0%10%20%30%40%50%60%70%80%90%
100%
0.1 1 10 100
NOEC [µg/L]
Cum
ulat
ive
Freq
uenc
y
Saltw ater
Freshw ater
Figure 8.1: Cumulative frequency distribution of the combined freshwater and saltwater data set
used for the derivation of the 5 percentile cut off value (5P-COV) by the method of Aldenberg and Jaworska [13]
Table 8.1: Results of the SSD calculations
90 % Confidence Interval Data set 5-Percentile Cut-Off Value
(50% confidence) 5P-COV (95% conf.) 5P-COV (5% conf.)
1. Combined NOECs 0.142 0.054 0.284 2. Freshwater NOECs 0.160 0.022 0.332 3. Saltwater NOECs 0.143 0.033 0.360
From the data given in table 8.1 it can be seen that the 50% confidence 5P-COVs for the freshwater and saltwater data sets are nearly identical. It is therefore deemed appropriate to use the 5P-COV of the combined freshwater and saltwater NOECs for the calculation of the maximum permissible addition.
In order to derive the PNEC (≈MPA) it is suggested in the TGD to divide the 5P-COV by an appropriate assessment factor between 1 and 5, reflecting further uncertainties identified.
The data base used for the calculation of the 5-percentile cut-off value covers 9 different taxonomic groups (but not all groups that should be covered according to the TGD, e.g. higher plants), tests
Substance Data Sheet (21) Mercury and its Compounds Final Version of 15.01. 2005
- 12 -
covering the full life cycle or at least sensitive life stages are available for algae, invertebrates and fish. However, results from field studies are not available. The spread between the 5% and the 95 % confidence interval of the SSD is rather small (factor 5 between 5% certainty and 95% certainty). It is therefore suggested to use 3 as assessment factor for the derivation of the MPA.
MPAwater.SSD = 5P-COV (0.142 µg/l) / AF (3) = 0.047 µg Mercury /l
As the MPA based on statistical extrapolation is with more than 95% confidence lower than the concentration that probably could affect 5% of the species it is suggested to derive the final water quality standard based on this MPA.
As the log KpWater-SPM is >3, the QS for water is additionally given as concentration in SPM (see section 4.3.1 of the Manual [4]). The Kp-value reported as mean value in the river Rhine [7] is used as example for the calculation (Kp (mean, Rhine) ≈ 100,000 l/kg):
MPASPM [mg/kg] = MPAwater (0.047 µg Hg /l) * Kp (100,000 l/kg) = 4.7 mg Hg / kg SPM
The partition coefficient Kpwater-SPM is the decisive parameter in the derivation of the local QSSPM. It is, therefore, very important to use a figure that is representative for the spatial unit for which the QSwater is to be transformed to the corresponding QSSPM.
8.1.2 Calculation of the water quality standards
Freshwater and saltwater
The natural Hg background concentration in the river Rhine is used as an example in order to illustrate the calculation of the quality standard. The natural background concentration of "dissolved" mercury in Rhine water is 0.005 µg Hg/l and in suspended sediment the background is 0.2 mg Hg/kg [7].
The example of a quality standard for the Rhine is calculated on the basis of the background concentration in the Rhine and the MPA as calculated in section 8.1.1: QSwater = Cbackground (0.005 µg Hg /l) + MPA (0.047 µg Hg /l) = 0.052 µg Hg /l
For the Rhine as example, the QS for mercury in SPM is therefore calculated as follows: QSSPM = Cbackground (0.2 mg/kg) + MPASPM (4.7 mg/kg) = 4.9 mg Mercury /kg SPM
Quality standard for transient concentration peaks (MAC-QS)
The MAC-QS is calculated on the basis of the background concentration (0.005 µg Hg /l, see section on QS for freshwater and saltwater above) and the MAC-MPA as calculated in section 8.1:
MAC-QS = Cbackground (0.005 µg/l) + MAC-MPA (0.07 µg/l) = 0.075 µg Mercury /l
Substance Data Sheet (21) Mercury and its Compounds Final Version of 15.01. 2005
- 13 -
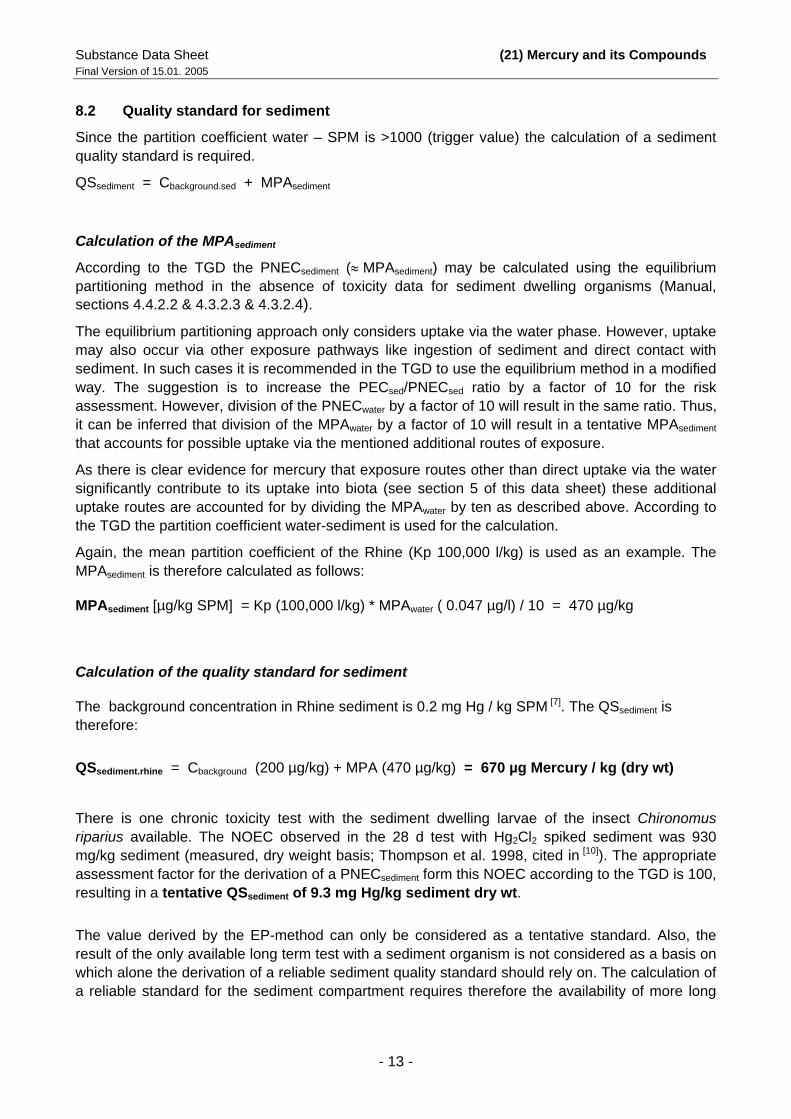
8.2 Quality standard for sediment Since the partition coefficient water – SPM is >1000 (trigger value) the calculation of a sediment quality standard is required.
QSsediment = Cbackground.sed + MPAsediment
Calculation of the MPAsediment
According to the TGD the PNECsediment (≈ MPAsediment) may be calculated using the equilibrium partitioning method in the absence of toxicity data for sediment dwelling organisms (Manual, sections 4.4.2.2 & 4.3.2.3 & 4.3.2.4).
The equilibrium partitioning approach only considers uptake via the water phase. However, uptake may also occur via other exposure pathways like ingestion of sediment and direct contact with sediment. In such cases it is recommended in the TGD to use the equilibrium method in a modified way. The suggestion is to increase the PECsed/PNECsed ratio by a factor of 10 for the risk assessment. However, division of the PNECwater by a factor of 10 will result in the same ratio. Thus, it can be inferred that division of the MPAwater by a factor of 10 will result in a tentative MPAsediment that accounts for possible uptake via the mentioned additional routes of exposure.
As there is clear evidence for mercury that exposure routes other than direct uptake via the water significantly contribute to its uptake into biota (see section 5 of this data sheet) these additional uptake routes are accounted for by dividing the MPAwater by ten as described above. According to the TGD the partition coefficient water-sediment is used for the calculation.
Again, the mean partition coefficient of the Rhine (Kp 100,000 l/kg) is used as an example. The MPAsediment is therefore calculated as follows:
MPAsediment [µg/kg SPM] = Kp (100,000 l/kg) * MPAwater ( 0.047 µg/l) / 10 = 470 µg/kg
Calculation of the quality standard for sediment
The background concentration in Rhine sediment is 0.2 mg Hg / kg SPM [7]. The QSsediment is therefore:
QSsediment.rhine = Cbackground (200 µg/kg) + MPA (470 µg/kg) = 670 µg Mercury / kg (dry wt)
There is one chronic toxicity test with the sediment dwelling larvae of the insect Chironomus riparius available. The NOEC observed in the 28 d test with Hg2Cl2 spiked sediment was 930 mg/kg sediment (measured, dry weight basis; Thompson et al. 1998, cited in [10]). The appropriate assessment factor for the derivation of a PNECsediment form this NOEC according to the TGD is 100, resulting in a tentative QSsediment of 9.3 mg Hg/kg sediment dry wt.
The value derived by the EP-method can only be considered as a tentative standard. Also, the result of the only available long term test with a sediment organism is not considered as a basis on which alone the derivation of a reliable sediment quality standard should rely on. The calculation of a reliable standard for the sediment compartment requires therefore the availability of more long
Substance Data Sheet (21) Mercury and its Compounds Final Version of 15.01. 2005
- 14 -
term tests conducted with benthic organisms. For the time being no reliable QSsediment can be derived.
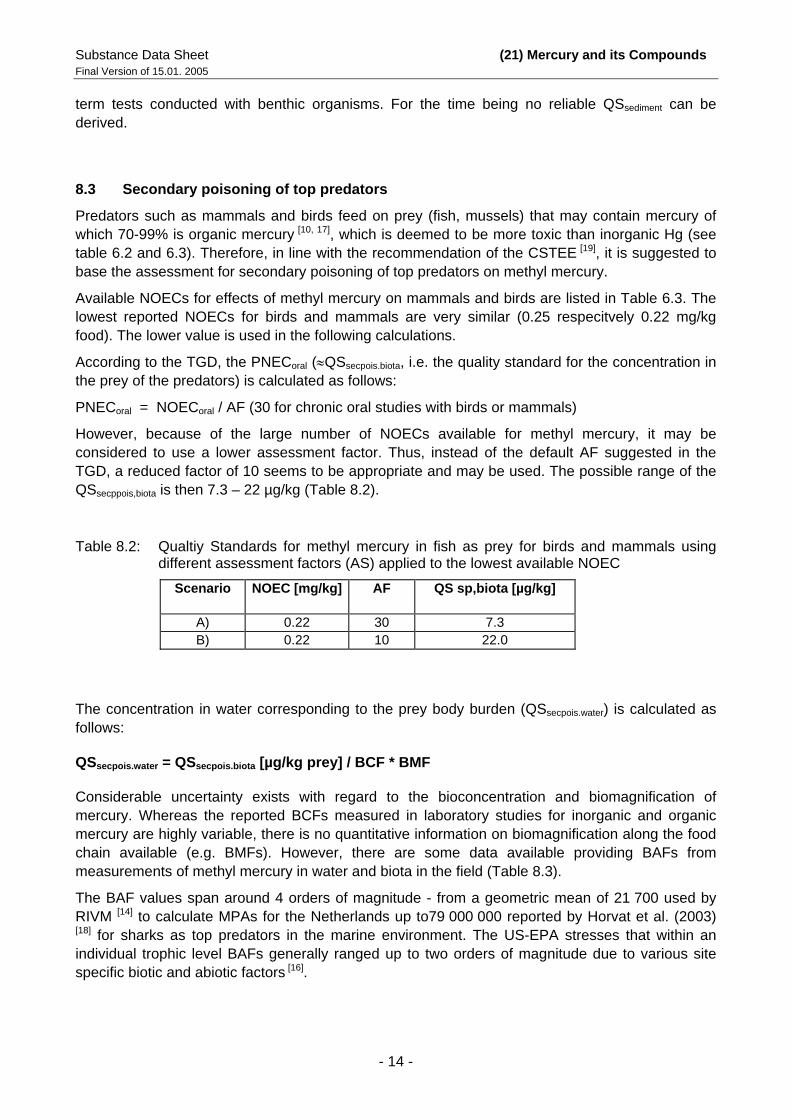
8.3 Secondary poisoning of top predators Predators such as mammals and birds feed on prey (fish, mussels) that may contain mercury of which 70-99% is organic mercury [10, 17], which is deemed to be more toxic than inorganic Hg (see table 6.2 and 6.3). Therefore, in line with the recommendation of the CSTEE [19], it is suggested to base the assessment for secondary poisoning of top predators on methyl mercury.
Available NOECs for effects of methyl mercury on mammals and birds are listed in Table 6.3. The lowest reported NOECs for birds and mammals are very similar (0.25 respecitvely 0.22 mg/kg food). The lower value is used in the following calculations.
According to the TGD, the PNECoral (≈QSsecpois.biota, i.e. the quality standard for the concentration in the prey of the predators) is calculated as follows:
PNECoral = NOECoral / AF (30 for chronic oral studies with birds or mammals)
However, because of the large number of NOECs available for methyl mercury, it may be considered to use a lower assessment factor. Thus, instead of the default AF suggested in the TGD, a reduced factor of 10 seems to be appropriate and may be used. The possible range of the QSsecppois,biota is then 7.3 – 22 µg/kg (Table 8.2).
Table 8.2: Qualtiy Standards for methyl mercury in fish as prey for birds and mammals using different assessment factors (AS) applied to the lowest available NOEC
Scenario NOEC [mg/kg] AF QS sp,biota [µg/kg]
A) 0.22 30 7.3 B) 0.22 10 22.0
The concentration in water corresponding to the prey body burden (QSsecpois.water) is calculated as follows:
QSsecpois.water = QSsecpois.biota [µg/kg prey] / BCF * BMF
Considerable uncertainty exists with regard to the bioconcentration and biomagnification of mercury. Whereas the reported BCFs measured in laboratory studies for inorganic and organic mercury are highly variable, there is no quantitative information on biomagnification along the food chain available (e.g. BMFs). However, there are some data available providing BAFs from measurements of methyl mercury in water and biota in the field (Table 8.3).
The BAF values span around 4 orders of magnitude - from a geometric mean of 21 700 used by RIVM [14] to calculate MPAs for the Netherlands up to79 000 000 reported by Horvat et al. (2003) [18] for sharks as top predators in the marine environment. The US-EPA stresses that within an individual trophic level BAFs generally ranged up to two orders of magnitude due to various site specific biotic and abiotic factors [16].
Substance Data Sheet (21) Mercury and its Compounds Final Version of 15.01. 2005
- 15 -
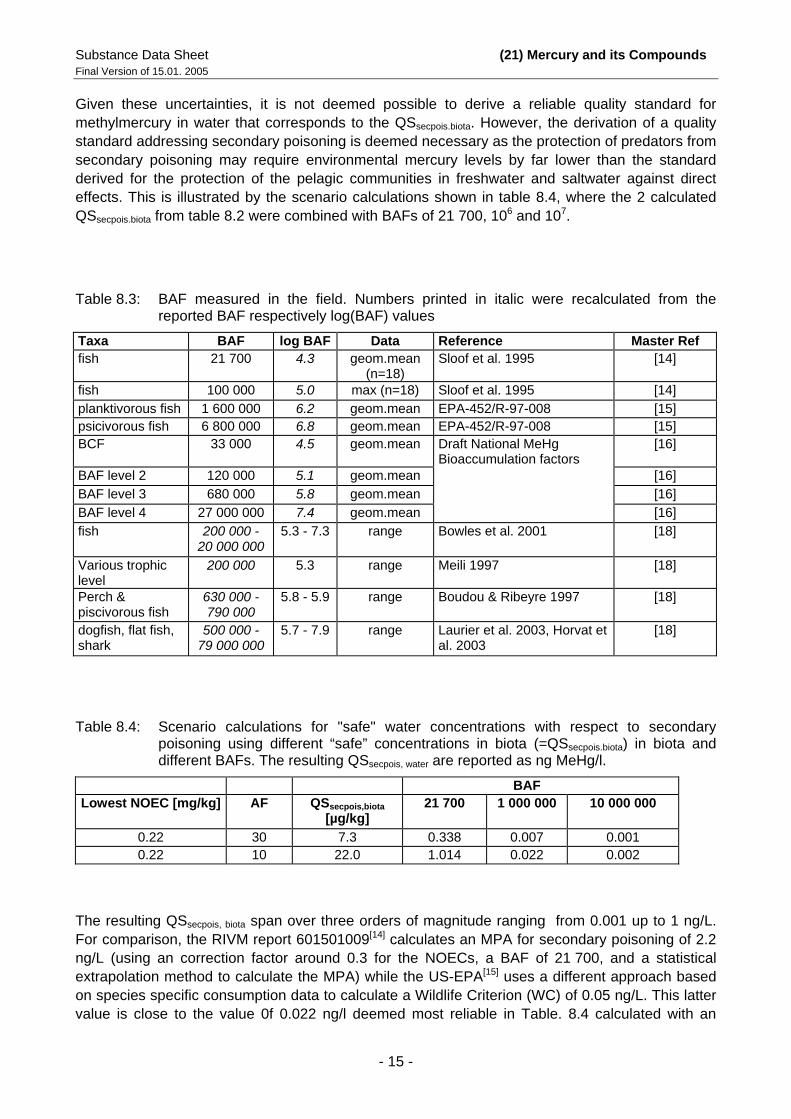
Given these uncertainties, it is not deemed possible to derive a reliable quality standard for methylmercury in water that corresponds to the QSsecpois.biota. However, the derivation of a quality standard addressing secondary poisoning is deemed necessary as the protection of predators from secondary poisoning may require environmental mercury levels by far lower than the standard derived for the protection of the pelagic communities in freshwater and saltwater against direct effects. This is illustrated by the scenario calculations shown in table 8.4, where the 2 calculated QSsecpois.biota from table 8.2 were combined with BAFs of 21 700, 106 and 107.
Table 8.3: BAF measured in the field. Numbers printed in italic were recalculated from the reported BAF respectively log(BAF) values
Taxa BAF log BAF Data Reference Master Ref fish 21 700 4.3 geom.mean
(n=18) Sloof et al. 1995 [14]
fish 100 000 5.0 max (n=18) Sloof et al. 1995 [14] planktivorous fish 1 600 000 6.2 geom.mean EPA-452/R-97-008 [15] psicivorous fish 6 800 000 6.8 geom.mean EPA-452/R-97-008 [15] BCF 33 000 4.5 geom.mean Draft National MeHg
Bioaccumulation factors [16]
BAF level 2 120 000 5.1 geom.mean [16] BAF level 3 680 000 5.8 geom.mean [16] BAF level 4 27 000 000 7.4 geom.mean [16] fish 200 000 -
20 000 000 5.3 - 7.3 range Bowles et al. 2001 [18]
Various trophic level
200 000 5.3 range Meili 1997 [18]
Perch & piscivorous fish
630 000 - 790 000
5.8 - 5.9 range Boudou & Ribeyre 1997 [18]
dogfish, flat fish, shark
500 000 - 79 000 000
5.7 - 7.9 range Laurier et al. 2003, Horvat et al. 2003
[18]
Table 8.4: Scenario calculations for "safe" water concentrations with respect to secondary poisoning using different “safe” concentrations in biota (=QSsecpois.biota) in biota and different BAFs. The resulting QSsecpois, water are reported as ng MeHg/l.
BAF Lowest NOEC [mg/kg] AF QSsecpois,biota
[µg/kg] 21 700 1 000 000 10 000 000
0.22 30 7.3 0.338 0.007 0.001 0.22 10 22.0 1.014 0.022 0.002
The resulting QSsecpois, biota span over three orders of magnitude ranging from 0.001 up to 1 ng/L. For comparison, the RIVM report 601501009[14] calculates an MPA for secondary poisoning of 2.2 ng/L (using an correction factor around 0.3 for the NOECs, a BAF of 21 700, and a statistical extrapolation method to calculate the MPA) while the US-EPA[15] uses a different approach based on species specific consumption data to calculate a Wildlife Criterion (WC) of 0.05 ng/L. This latter value is close to the value 0f 0.022 ng/l deemed most reliable in Table. 8.4 calculated with an
Substance Data Sheet (21) Mercury and its Compounds Final Version of 15.01. 2005
- 16 -
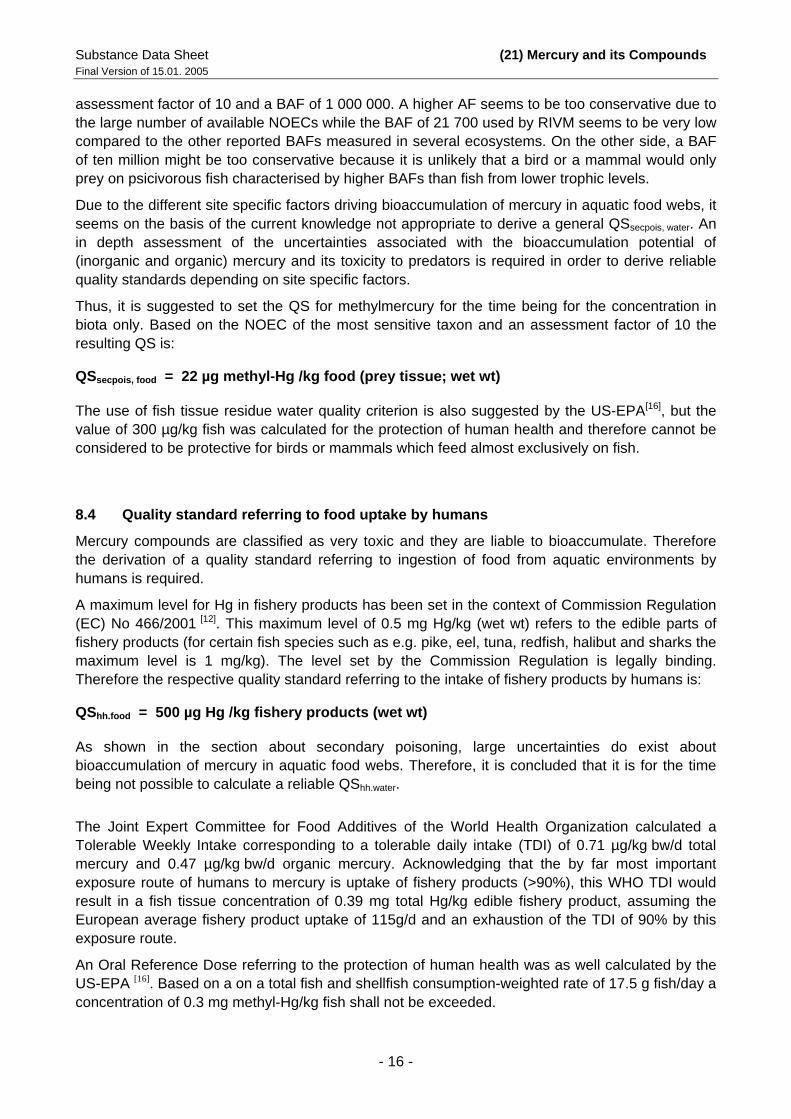
assessment factor of 10 and a BAF of 1 000 000. A higher AF seems to be too conservative due to the large number of available NOECs while the BAF of 21 700 used by RIVM seems to be very low compared to the other reported BAFs measured in several ecosystems. On the other side, a BAF of ten million might be too conservative because it is unlikely that a bird or a mammal would only prey on psicivorous fish characterised by higher BAFs than fish from lower trophic levels.
Due to the different site specific factors driving bioaccumulation of mercury in aquatic food webs, it seems on the basis of the current knowledge not appropriate to derive a general QSsecpois, water. An in depth assessment of the uncertainties associated with the bioaccumulation potential of (inorganic and organic) mercury and its toxicity to predators is required in order to derive reliable quality standards depending on site specific factors.
Thus, it is suggested to set the QS for methylmercury for the time being for the concentration in biota only. Based on the NOEC of the most sensitive taxon and an assessment factor of 10 the resulting QS is:
QSsecpois, food = 22 µg methyl-Hg /kg food (prey tissue; wet wt)
The use of fish tissue residue water quality criterion is also suggested by the US-EPA[16], but the value of 300 µg/kg fish was calculated for the protection of human health and therefore cannot be considered to be protective for birds or mammals which feed almost exclusively on fish.
8.4 Quality standard referring to food uptake by humans Mercury compounds are classified as very toxic and they are liable to bioaccumulate. Therefore the derivation of a quality standard referring to ingestion of food from aquatic environments by humans is required.
A maximum level for Hg in fishery products has been set in the context of Commission Regulation (EC) No 466/2001 [12]. This maximum level of 0.5 mg Hg/kg (wet wt) refers to the edible parts of fishery products (for certain fish species such as e.g. pike, eel, tuna, redfish, halibut and sharks the maximum level is 1 mg/kg). The level set by the Commission Regulation is legally binding. Therefore the respective quality standard referring to the intake of fishery products by humans is:
QShh.food = 500 µg Hg /kg fishery products (wet wt)
As shown in the section about secondary poisoning, large uncertainties do exist about bioaccumulation of mercury in aquatic food webs. Therefore, it is concluded that it is for the time being not possible to calculate a reliable QShh.water.
The Joint Expert Committee for Food Additives of the World Health Organization calculated a Tolerable Weekly Intake corresponding to a tolerable daily intake (TDI) of 0.71 µg/kg bw/d total mercury and 0.47 µg/kg bw/d organic mercury. Acknowledging that the by far most important exposure route of humans to mercury is uptake of fishery products (>90%), this WHO TDI would result in a fish tissue concentration of 0.39 mg total Hg/kg edible fishery product, assuming the European average fishery product uptake of 115g/d and an exhaustion of the TDI of 90% by this exposure route.
An Oral Reference Dose referring to the protection of human health was as well calculated by the US-EPA [16]. Based on a on a total fish and shellfish consumption-weighted rate of 17.5 g fish/day a concentration of 0.3 mg methyl-Hg/kg fish shall not be exceeded.
Substance Data Sheet (21) Mercury and its Compounds Final Version of 15.01. 2005
- 17 -
Compared with the WHO-TWI and the US-EPA RfD, taking account of the fishery product consumption of the avererage European citizen, the EU-Limit value for Hg as fixed in Commission Regulation (EC) No 466/2001 appears quite high.
8.5 Quality standard for drinking water abstraction The imperative A1 value referring to drinking water abstraction by simple treatment is 1 µg Hg/l (Council Directive 75/440/EEC). The drinking water standard (DWS) set in CD 98/83/EC is also 1 µg Hg/l.
The DWS is a limit value never to be exceeded at the tap. The MAC-MPA (ECO) derived for the protection of the freshwater community (0.07 µg/l) is by far lower than the DWS.
8.6 Overall quality standard In its opinion on the mercury quality standard [19], the SCTEE suggested to derive this standard for methyl-mercury in biota tissue. This proposal is appreciated and has been followed in this data sheet.
The maximum permissible addition (respectively quality standards) derived for the protection of the pelagic communities in surface waters may not be low enough to protect predators from secondary poisoning or humans from adverse effects due to the ingestion of fishery products. Reliable water-based quality standards for the latter objectives of protection could not be calculated as considerable uncertainty exists with regard to the bioaccumulation potential of inorganic and organic forms of mercury and the transformation of inorganic mercury into organic species along the trophic levels of the food web. It is therefore suggested to set two quality standards for mercury – one water-based maximum permissible addition (MPA) for protection of aquatic organisms against direct effects of mercury (QSwater = Cbackground + MPA) and one biota-based standard for protection of predators (and humans) against secondary poisoning (QSsecpois.biota). In principle, the QSwater for protection against direct toxicity of mercury is referring to inorganic forms of mercury whereas the QSsecpois.biota is set for methyl-Hg. However, in the light of evidence from various studies that methyl-Hg in water typically amounts to only 1-10% of total Hg [17], total Hg instead of inorganic Hg may be monitored in water.
In order to derive a quality standard for sediment organisms, long term toxicity data for sediment organisms are required.
Substance Data Sheet (21) Mercury and its Compounds Final Version of 15.01. 2005
- 18 -
9 References [1] Report of the Third OSPAR Workshop on Ecotoxicological Assessment Criteria. The Hague: 25-29
November 1996 (Parts I & III). OSPAR Commission 1998, ISBN 0946955794
[2] COM(2001)262 final: Communication from the Commission to the Council and the European Parliament on the implementation of the Community Strategy for Endocrine Disrupters – a range of substances suspected of interfering with the hormone system of humans and wildlife.
[3] Technical Guidance Document on Risk Assessment in Support of Commission Directive 93/67/EEC on Risk Assessment for New Notified Substances and Commission Regulation (EC) No 1488/94 on Risk Assessment for Existing Substances and Directive 98/8/EC of the European Parliament and the Council Concerning the placing of biocidal products on the market. Part II. European Commission Joint Research Centre, EUR 20418 EN/2, © European Communities 2003. Available at the internet-site of the European Chemicals Bureau: http://ecb.jrc.it/existing-chemicals/
[4] Manual of the Methodological Framework Used to Derive Environmental Quality Standards for Priority Substances of the Water Framework Directive. Peter Lepper, Fraunhofer-Institute Molecular Biology and Applied Ecology, 15 November 2004. Available at the internet-site of the European Commission: http://europa.eu.int/comm/environment/water/water-dangersub/pri_substances.htm
[5] Frimmel, FH et al., 2001: Ableitung von Qualitätszielen für Kandidatenstoffe der prioritären Liste für die EU-Wasserrahmenrichtlinie. Projektbericht zum Forschungsvorhaben. Substance data sheet for Quecksilber und Quecksilberverbindungen
[6] Les Etudes des Agences de l'Eau Nº 64: Systéme d'Évaluation de la Qualite de l'Eau des Cours d'Eau. SEQ-Eau (version 1) Annexe A – Grilles de seuils par altération avec justifications (Annexe 4: Classes d'Aptitude Pour Divers Micropollutants, Fonction "Potentialites Biologiques de l'Eau", Mercure - Fiche de Donnees). Agences de l'Eau, Janvier 1999. ISSN 1161-0425F
[7] Schudoma, D et al.; 1994: Ableitung von Zielvorgaben zum Schutz oberirdischer Binnengewässer für die Schwermetalle Blei, Cadmium, Chrom, Nickel, Quecksilber und Zink. Texte 52/94. Umweltbundesamt, Berlin
[8] Excel - database provided by RIVM. Personal communication (e-mail Dr. Dick Sijm, 14 February 2002)
[9] Response of Estonia to request for information relating to quality standards for the Priority List. Submission of data on toxicity, persistence and bioaccumulation(e-mail of 15 May 2001 by Prof. Uuve Kirso, National Institute of Chemical Physics and Biophysics, Tallinn)
[10] EURO CHLOR Risk Assessment for the Marine Environment. OSPARCOM Region: North Sea – Mercury. Draft - Status 26 August 1999
[11] Information provided by EURO CHLOR. Personal communication (e-mail Prof. André Lecloux, 22 June 2001)
[12] Commission Regulation (EC) No 466/2001 of 8 March 2001 setting maximum levels for certain contaminants in foodstuffs. OJ L 077 , 16/03/2001 P. 1 - 13
[13] Aldenberg, T, J Jaworska, 2000: Uncertainty of the hazardous concentration and fraction affected for normal species sensitivity distributions. Ecotoxicology and Environmental Safety 46: 1-18
[14] Smit CE ; Wezel AP van ; Jager T ; Traas TP 2000: Secondary poisoning of cadmium, copper and mercury: implications for the Maximum Permissible Concentrations and Negligible Concentrations in water, sediment and soil RIVM Rapport 601501009, 59 p
[15] US-EPA (1997): Mercury Study - Report to Congress. EPA-452/R-97-003
[16] US-EPA 2001: Water Quality Criterion for the Protection of Human Health: Methylmercury. EPA-823-R-01-001
[17] UNEP. 2002. Global Mercury Assessment. UNEP Chemicals, Geneva, Switzerland, December 2002.
[18] Hg-Quality Standard Proposed by France”. June 2003. Personal communication.
[19] Opinion of the Scientific Committee on Toxicity, Ecotoxicity and the Environment (SCTEE) on “The Setting of Environmental Quality Standards for the Priority Substances included in Annex X of Directive 2000/60/EC in Accordance with Article 16 thereof”, adopted by the CSTEE during the 43rd plenary
Substance Data Sheet (21) Mercury and its Compounds Final Version of 15.01. 2005
- 19 -
meeting of 28 May 2004, European Commission Health & Consumer Protection Directorate General, Brussels. http://europa.eu.int/comm/health/ph_risk/committees/sct/documents/out230_en.pdf
[20] ESIS: European Chemicals Bureau – ESIS (European Substances Information System), January 2005. http://ecb.jrc.it/existing-chemicals/ ⇒ tick ESIS button, then enter CAS or EINECS number of substance.