Embed Size (px)
Citation preview

COMMON IMPLEMENTATION STRATEGY
FOR THE WATER FRAMEWORK DIRECTIVE
(2000/60/EC)
Technical Report - 2009 - 030
Guidance Document No. 23
GUIDANCE DOCUMENT ON EUTROPHICATION ASSESSMENT
IN THE CONTEXT OF EUROPEAN WATER POLICIES
A great deal of additional information on the European Union is available on the Internet.It can be accessed through the Europa server (http://ec.europa.eu).
Luxembourg: Office for Official Publications of the European Communities, 2009
ISBN 978-92-79-12987-2© European Communities, 2009Reproduction is authorised provided the source is acknowledged.
Europe Direct is a service to help you find answers to your questions about the European Union
New freephone number:00 800 6 7 8 9 10 11
Disclaimer:This technical document has been developed through a collaborative programme involving the European Commission, all the Member States, the Accession Countries, Norway and other stakeholders and Non-Governmental Organisations. The document should be regarded as presenting an informal consensus position on best practice agreed by all partners. However, the document does not necessarily represent the official, formal position of any of the partners. Hence, the views expressed in the document do not necessarily represent the views of the European Commission.

Guidance Document on Eutrophication Assessment
Guidance Document May 2009 3
FOREWORD Eutrophication is one of the most important and long lasting water quality problems in the EU. Since at least
two decades, several policies have been adopted to tackle nutrient pollution and its consequences. The Water
Directors, conscious of the challenge and the complexity of the subject, agreed in 2004 to start an activity to
develop guidance on harmonisation of eutrophication assessment. The guidance should cover all water
categories (inland waters, coastal and marine) and all existing European policies, and should be firmly based
on the methodological concepts of the Water Framework Directive.
The activity delivered a first Interim Guidance Document in November 2005 that was endorsed by Water
Directors at their meeting in London. Although the document provided useful guidance both on technical and
on policy relevant concepts, it was recognised that any attempt to harmonise eutrophication classification
criteria should be informed by a number of important projects on-going at the time, notably intercalibration
exercise and some of the projects lead by the Marine Conventions.
The Water Directors agreed at their meeting in Dresden in June 2007 to revise and update the Interim
Guidance Document on Eutrophication. The present Guidance reflects the outcome of this process, led by a
Steering Group chaired by the European Commission and with participation of experts from Finland,
Germany, the Netherlands, Spain and the UK. Consultations were held with the CIS Working Group on
Ecological Status and with the Strategic Co-ordination Group.
The main issues addressed in the guidance document are a unified conceptual framework to understand
eutrophication in all water categories, a conceptual read across EU directives (mainly Water Framework,
Urban Wastewater and Nitrates Directives) and international policies (e.g. OSPAR and HELCOM)
addressing eutrophication and an in-depth understanding of eutrophication in the context of WFD ecological
status assessment. The guidance also includes an overview of current assessment methods and
recommendations for harmonisation of classification criteria.
This document is the result of several years of work by many experts across Europe and it will contribute to
a better understanding of the policies involved in tackling eutrophication and their interactions, improving
harmonisation of assessment methods. In the coming years the guidance should be used and tested and those
experiences should be considered in future developments.
The Water Directors recognise that eutrophication is a complex phenomenon and it may be necessary to
work further on its assessment in the future. However, the publication of the WFD river basin management
plans in 2009 and recent policy developments like the Marine Strategy Framework Directive (2008) and the
Baltic Sea Action Plan (2007) will inevitably move the focus of the attention in the coming years towards
measures to combat eutrophication and its effectiveness. The Water Directors, in close collaboration with the
Marine Directors, stay committed to continue to lead on tackling this important environmental problem.
May 2009

Guidance Document on Eutrophication Assessment
Guidance Document May 2009 4
Guidance Document on Eutrophication Assessment
Guidance Document May 2009 5
TABLE OF CONTENTS
1. Introduction ............................................................................................................................................. 9 1.1. Scope of the activity.......................................................................................................................9 1.2. Understanding eutrophication in its policy context .....................................................................10 1.3. Structure of the document ............................................................................................................11
2. Overall conceptual framework for the assessment of eutrophication ................................................... 11 2.1. The need, requirements and principles of a common conceptual framework..............................11 2.2. Description of the conceptual eutrophication framework............................................................13
3. Overview and common understanding of eutrophication in EC and international policies .................. 19 3.1. Introduction..................................................................................................................................19 3.2. Overview of policy instruments...................................................................................................20 3.3. Concepts and definitions of eutrophication .................................................................................23 3.4. Key terms used in different European policies ............................................................................24 3.5. Overview of classification of water bodies with regard to eutrophication ..................................24 3.6. Assessment results under various policies ...................................................................................26 3.7. Examples of class comparisons....................................................................................................33
4. The WFD concept of ecological status in the context of eutrophication .............................................. 35 4.1. Most sensitive biological quality elements ..................................................................................35 4.2. Role of the normative definitions in the development of ecological assessment methods ..........36 4.3. Shared principles in the normative definitions for the different water categories .......................36 4.4. Description given for abundance and taxonomic composition of aquatic flora...........................36 4.5. The role of general physico-chemical quality elements...............................................................40
5. Overview of current eutrophication assessment methodologies and criteria in European countries ................................................................................................................................................ 40 5.1. Introduction..................................................................................................................................40 5.2. Lakes ...........................................................................................................................................41
5.2.1. Assessment methodologies and criteria used for water quality status classification........ 41 5.2.2. Impact and pressure criteria used in WFD Article 5 risk assessment............................... 43 5.2.3. New WFD-compliant assessment systems ....................................................................... 43
5.3. Rivers ...........................................................................................................................................47 5.3.1. Assessment methodologies and criteria used for water quality status classification........ 47 5.3.2. Impact and pressure criteria used in WFD Article 5 risk assessment............................... 47 5.3.3. New WFD-compliant assessment systems ....................................................................... 48
5.4. Transitional waters.......................................................................................................................50 5.4.1. Assessment methodologies and criteria used for water quality status classification........ 50 5.4.2. Impact and pressure criteria used in WFD Article 5 risk assessment............................... 51 5.4.3. Examples of development of new WFD-compliant assessment systems ......................... 52
Guidance Document on Eutrophication Assessment
Guidance Document May 2009 6
5.5. Coastal waters ..............................................................................................................................54 5.5.1. Assessment methodologies and criteria used for water quality status classification........ 54 5.5.2. Assessment methodologies and criteria used for UWWT and Nitrates Directive
designations ...................................................................................................................... 57 5.5.3. Impact and pressure criteria used in WFD Article 5 risk assessment............................... 57 5.5.4. Examples of development of new WFD-compliant assessment systems ......................... 57
5.6. Marine waters...............................................................................................................................57 5.6.1. Existing assessment methodologies and criteria used for water quality status
classification ..................................................................................................................... 57 5.6.2. Assessment methodologies and criteria used for UWWT and Nitrates Directive
designations ...................................................................................................................... 58 5.6.3. Impact and pressure criteria used in WFD Article 5 risk assessment............................... 58 5.6.4. Examples of development of new WFD-compliant assessment systems ......................... 58 5.6.5. Criteria and standards under the Marine Strategy Framework Directive ......................... 58
6. Harmonisation of classification criteria ................................................................................................ 59 6.1. Use of nutrient standards and best practice in deriving them ......................................................59 6.2. Combining information from different quality elements in the assessment of ecological
status ...........................................................................................................................................63 6.3. The river basin perspective: linking results of inland waters with transitional and coastal
waters ...........................................................................................................................................67 6.4. WFD and marine conventions: coherence of current eutrophication assessment schemes .........67
7. Monitoring – guidance and integration of requirements stemming from various obligations .............. 70 7.1. Introduction..................................................................................................................................70 7.2. Guidance documents ....................................................................................................................71 7.3. Water categories and geographic coverage..................................................................................72 7.4. Selection of monitoring sites .......................................................................................................74 7.5. Selection of quality elements/parameters to be measured ...........................................................74 7.6. Frequency of monitoring..............................................................................................................76 7.7. Monitoring of protected areas ......................................................................................................77 7.8. Harmonisation of monitoring programmes..................................................................................77
7.8.1. Rivers and lakes................................................................................................................ 77 7.8.2. Transitional, coastal and marine waters............................................................................ 79
8. Next steps – links of eutrophication assessment with pressure and impact analysis and programme of measures ........................................................................................................................ 80 8.1. Use of the DPSIR framework ......................................................................................................80 8.2. Steps in the development of measures for a water body (or part of marine area) that is
eutrophic or may become eutrophic in the near future ................................................................80 8.3. Identification of gaps that need to be addressed ..........................................................................81 8.4. Conclusion ...................................................................................................................................82
9. References ............................................................................................................................................. 83

Guidance Document on Eutrophication Assessment
Guidance Document May 2009 7
ANNEX 1: The understanding of eutrophication............................................................................................ 87 1. EU legislation and policies.................................................................................................................... 87
1.1. Water Framework Directive (2000/60/EC)..................................................................................87 1.1.1. Overview of the Water Framework Directive .................................................................. 87 1.1.2. Summary of the Water Framework Directive’s requirements .......................................... 88 1.1.3. Conceptual understanding of eutrophication in the WFD ................................................ 90 1.1.4. Methods specified for assessing eutrophication ............................................................... 90 1.1.5. WFD Guidance documents............................................................................................... 91 1.1.6. Common understanding of Ecological Classification from CIS guidance documents ..... 92
1.2. Urban Waste Water Treatment Directive (91/271/EEC) .............................................................98 1.2.1. Overview of UWWT Directive ........................................................................................ 98 1.2.2. Conceptual understanding of eutrophication .................................................................... 98 1.2.3. Methods specified for assessing eutrophication ............................................................... 99 1.2.4. Relevant Case Law ........................................................................................................... 99
1.3. Nitrates Directive (91/676/EEC)................................................................................................101 1.3.1. Overview of the Nitrates Directive................................................................................. 101 1.3.2. Conceptual understanding of eutrophication .................................................................. 102 1.3.3. Methods specified for assessing eutrophication ............................................................. 102 1.3.4. Relevant Case Law ......................................................................................................... 102
1.4. Habitats Directive (92/43/EEC) .................................................................................................103 1.5. Shellfish Waters Directive (79/923/EEC)..................................................................................103 1.6. Freshwater Fish Directive (78/659/EEC)...................................................................................104 1.7. Bathing Water Directive (2006/7/EC) .......................................................................................104 1.8. Marine Strategy Framework Directive (2008/56/EC)................................................................105 1.9. National Emission Ceilings for Atmospheric Pollutants Directive (2001/81/EC).....................106
2. Overview of work on eutrophication in other international policies................................................... 107 2.1. OSPAR Convention for the Protection of the Marine Environment of the North-East
Atlantic.......................................................................................................................................107 2.1.1. Eutrophication assessment.............................................................................................. 109 2.1.2. Procedures for assessing eutrophication in OSPAR and WFD ...................................... 112 2.1.3. Water body typology ...................................................................................................... 114 2.1.4. Comparison of OSPAR and WFD class boundaries....................................................... 119
2.2. Helsinki Convention on the Protection of the Marine Environment of the Baltic Sea ..............120 2.2.1. Aims of the Helsinki Convention ................................................................................... 120 2.2.2. HELCOM work on eutrophication ................................................................................. 120 2.2.3. HELCOM Monitoring .................................................................................................... 120 2.2.4. Thematic HELCOM eutrophication assessment............................................................. 121 2.2.5. The Baltic Sea Action Plan aims at a Baltic Sea unaffected by Eutrophication............. 123
Guidance Document on Eutrophication Assessment
Guidance Document May 2009 8
2.3. Barcelona Convention for the Protection of the Mediterranean Sea Against Pollution.............124 2.3.1. Aims of the Barcelona Convention and the Mediterranean Action Plan........................ 124 2.3.2. MED POL work on eutrophication................................................................................. 124 2.3.3. Monitoring under MED POL.......................................................................................... 125 2.3.4. Thematic eutrophication assessment .............................................................................. 126 2.3.5. Overview of the state of eutrophication in the Mediterranean Sea................................. 126
2.4. Bucharest Convention on the Protection of the Black Sea Against Pollution ...........................127 2.4.1. Aims of the Bucharest Convention................................................................................. 127 2.4.2. Work on eutrophication .................................................................................................. 127 2.4.3. Monitoring of the Black Sea........................................................................................... 128 2.4.4. The Strategic Action Plan for the Protection and Rehabilitation of the Black Sea ........ 128
3. References in Annex 1 ........................................................................................................................ 128 ANNEX 2: Indicative checklists for water category-specific features of the impact of eutrophication ....... 131 ANNEX 3: List of contributors ..................................................................................................................... 135
Guidance Document on Eutrophication Assessment
Guidance Document May 2009 9
1. INTRODUCTION
1.1. Scope of the activity
1. European policy has consistently identified eutrophication as a priority issue for water protection.
Substantial progress has been made in combating eutrophication but there remain several areas where co-
ordination is necessary to achieve a harmonised result for different policy areas, in particular:
• the harmonisation of assessment methodologies and criteria for agreed eutrophication elements/
parameters/ indicators for rivers, lakes, transitional, coastal and marine waters;
• the use of water type-specific objectives for biological and general physico-chemical elements;
• the co-ordination of monitoring and reporting;
• the harmonisation of models for assessing or predicting anthropogenic or natural nutrient loading
into inland and marine waters based on nutrient sources information or nutrient sources scenarios
(e.g. EUROHARP models);
• the systematic identification of sources of nutrients and possible restoration measures for water
bodies.
2. Thus an activity was initiated under the Common Implementation Strategy of the Water Framework
Directive and the European Marine Strategy to provide guidance on the first three points. Therefore it serves
as a guidance document for the common assessment and monitoring of eutrophication across different
European policies.
3. On the other issues, work may be started subsequently following the finalisation of this guidance. This
may also include work related to:
• developing and harmonising cause-effect models linking nutrient loading to ecological impact in
different water body types and categories.
• identifying the most cost-effective measures to tackle problems induced by nutrient enrichment.
4. There is a general agreement that this activity has to be firmly based on the methodological concept of
the WFD and to explore thereafter to what extent this methodology can be used in the context of other
directives and policies. The final outcome of this activity should be guidance for the purpose of the
implementation of the above-mentioned policies. It should also be useful for the preparation of the River
Basin Management Plans at the national and international level.
Guidance Document on Eutrophication Assessment
Guidance Document May 2009 10
1.2. Understanding eutrophication in its policy context
5. Nutrients in the appropriate amounts (i.e. background levels) are essential to maintain an adequate
primary production, which in turn is essential to support all the other trophic levels in the ecosystem, i.e. to
maintain a healthy structure and functioning. In general, excessive nutrients of anthropogenic origin cause an
increase in plant growth, which in still waters causes increased phytoplankton biomass, which can be
dominated by harmful or toxic species. In rivers, eutrophication may be seen as increased algal growth or
even excessive growth of higher plants, resulting in an imbalance between the processes of plant/algal
production and consumption. The decay of organic matter will lead to a stimulation of microbial
decomposition and oxygen consumption depleting bottom-water oxygen concentrations particularly in
stratified water bodies1. Eutrophication can cause severe increases in plant and algal growth but can also
have adverse effects on species diversity and lead to reduced suitability of the water for human use, e.g.
consumption, recreation and industrial needs.
6. In 1995, the report of the European Environment Agency (EEA) "Europe's Environment: The Dobris
Assessment", identified eutrophication of inland and marine waters as a European wide problem of major
concern. The EEA report (2003) "Europe's water: An indicator-based assessment" reported that progress
was achieved in improving water quality and quantity particularly in the European Union but that many of
Europe’s rivers, lakes, estuaries and coastal waters were still impacted by human activities leading to
eutrophication. The "Fourth Assessment of Europe's Environment"2 (2007) by EEA indicates that
concentrations of phosphorus have generally decreased in rivers and to a lesser extent in lakes in Western
and Central Europe since the 1990s, reflecting the general improvement in wastewater treatment.
Eutrophication remains a problem in all enclosed seas and sheltered marine waters across the pan-European
region. There have been some improvements in the West-European seas, as well as in the North-Western
shelf of the Black Sea, as a result of large cuts in point sources of nutrient pollution from industry and
wastewater by EU15 Member States. However, diffuse nutrient sources, particularly from agriculture,
remain a major obstacle for recovery and need increased control throughout Europe. Eastern European
countries need to both reduce point sources and prevent the export of nutrients to marine waters from further
agricultural expansion and intensification. Furthermore, the recent eutrophication assessment undertaken by
OSPAR has identified eutrophication related problems in certain areas mainly covering estuaries, fjords,
coastal and some offshore areas. The current HELCOM eutrophication assessment comes to comparable
results.
7. It should be emphasised that aquatic systems can show different natural background concentrations of
nutrients, depending on the geology and other characteristics of the catchment, giving rise to different natural
trophic conditions described as oligotrophic (low), mesotrophic (medium) to eutrophic (significant primary
1 Deep water anoxia/hypoxia can also be a purely natural phenomenon in permanently stratified water bodies. 2 http://www.eea.europa.eu/publications/state_of_environment_report_2007_1/

Guidance Document on Eutrophication Assessment
Guidance Document May 2009 11
production). However, in the policy context, eutrophication is widely used to refer to the undesirable effects
of anthropogenic increases in nutrient loads to aquatic ecosystems. The guidance only considers
anthropogenic eutrophication, i.e., resulting from nutrient enrichment caused by human activities. Further
details on concept and definitions are provided in Chapter 3.
8. In case of dealing with artificial or heavily modified water bodies, all references made in the document
to ecological status should be construed as references to ecological potential.
1.3. Structure of the document
9. This document compares how eutrophication is understood, defined and assessed in different EC
directives and other international policies. It develops a generic conceptual framework for the assessment of
eutrophication which includes existing cause-effect relationships in both marine and freshwater ecosystems.
10. The document is structured in two parts (Chapters 2-4 and Chapters 5-8). The first part deals with the
development of a common understanding of the processes involved in eutrophication a) from a technical and
scientific point of view (Chapter 2), b) in the context of different policies (Chapter 3), and c) in the WFD
concept of ecological status with respect to impacts caused by nutrient enrichment (Chapter 4).
11. The second part of the guidance gives an overview of current assessment methods and criteria for
assessing eutrophication in different kinds of waters (Chapter 5), gives guidance on the harmonisation of
classification criteria (Chapter 6), addresses the co-ordination of monitoring requirements stemming from
different policies and obligations (Chapter 7) and discusses the links of eutrophication assessment with the
pressure and impact analysis and the programme of measures (Chapter 8).
2. OVERALL CONCEPTUAL FRAMEWORK FOR THE ASSESSMENT OF EUTROPHICATION
2.1. The need, requirements and principles of a common conceptual framework
12. A fundamental aspect of defining a common monitoring and assessment guideline for the
eutrophication process is identifying a common conceptual framework that can be adapted for specific water
categories. Such a common starting point should capture the commonalities in the process and manifestations
of eutrophication in different water categories, and should also provide the means of linking the "process" of
eutrophication (i.e. a rate process) to the requirements of the WFD for assessing the ecological status of all
surface water bodies.
13. In addition, a common generic conceptual framework valid across all surface water categories would
provide a suitable means for developing category-specific checklists as a basis for the classification
assessment and for specifying monitoring requirements (see Figure 1).

Guidance Document on Eutrophication Assessment
Guidance Document May 2009 12
Figure 1. Schematic diagram for using a conceptual framework to assess eutrophication across different aquatic environments.
14. Assessing eutrophication in specific water categories and types will require water category-specific
and perhaps type-specific monitoring. Several CIS Guidance documents have already addressed some of the
specific monitoring needs (e.g. Monitoring guidance3, COAST guidance document4); however the spatial
and temporal monitoring requirements strongly depend on the seasonality of nutrients, chlorophyll and
oxygen concentrations in different water categories. Specific monitoring requirements to assess
eutrophication are addressed in Chapter 7.
15. A common "all encompassing" conceptual framework should be able to represent generic aspects of
eutrophication which are common in different aquatic environments, but also be detailed enough to be useful
for deriving the aspects which are specific to individual water categories and regions. Aspects of the process
that may be common to all aquatic environments include:
• Nutrient enrichment;
• Enhanced primary production/biomass;
• Algal blooms;
• Changes to taxonomic composition of algae/ plants;
• Effects on light climate and hence on biota;
• Increased fixation of carbon;
• Decreased/increased oxygen levels, possible anoxia and consequent effects on biota;
• Reduced diversity of benthic fauna.
3 Guidance Document No. 7: Monitoring under the Water Framework Directive 4 Guidance Document No. 5: Transitional and Coastal waters – Typology, Reference Conditions and Classification Systems
Generic conceptual framework showing main process and
primary and secondary impacts
river-specific features (checklist)
lake-specific features (checklist)
coastal/transitional/marine-specific features (checklist)
lake type-specific features
river type-specific features
coastal/transitional/marine waters type-specific features
Guidance Document on Eutrophication Assessment
Guidance Document May 2009 13
2.2. Description of the conceptual eutrophication framework
16. There are numerous models of the eutrophication process: both in the scientific literature and in policy
implementation documentation. All the different models link the cause (i.e. nutrients) and effect (e.g.
excessive algal growth) of the eutrophication process. This overarching link has been long implemented in
classification activities using regression models based on water body mass balance and algae element ratios,
particularly in freshwaters (e.g. OECD, 1982; Vollenweider, 1976)5. However, it is now well known that
manifestations of eutrophication may be much more subtle and non-linear in their occurrence (for a review
see Cloern, 2001). Regression between nutrients and biomass for example may not be applicable in all
aquatic environments. Regression models therefore may not always be expected to be used for classification
of water bodies showing non-linear response patterns along the eutrophication gradient. In this perspective a
more comprehensive approach to classification is required, that accounts for the different non-linear
relationships and the different intrinsic manifestations of eutrophication.
17. An example of such an approach is the OSPAR Common Procedure6, described in Annex 1, section
2.1.2. This procedure was developed based on a common conceptual framework of eutrophication.
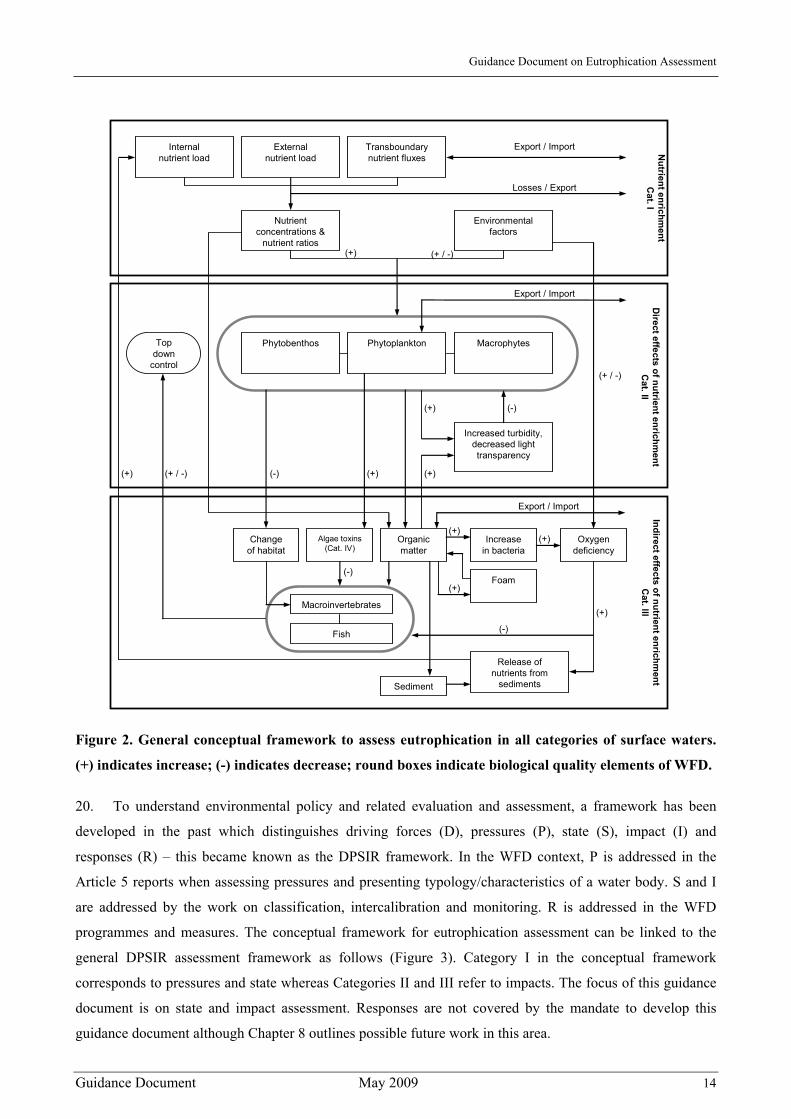
18. Based upon the OSPAR conceptual framework, and taking into account discussions at the
• Joint Workshop on Marine Assessment and Monitoring with emphasis on eutrophication. JRC,
Black Sea Commission and Helsinki Commission (Istanbul, Turkey, 21-22 April 2004); and the
• Eutrophication Workshop on a Common Assessment Methodology. JRC (Ispra, 14-15 September
2004)
the common conceptual framework of eutrophication presented in Figure 2 was developed. This diagram
describes the eutrophication process, the different elements and partial processes involved, and the ecological
impacts which may arise. The effects of hydrological and morphological changes and their potential
influence on eutrophication which play an important role in WFD ecological status assessment and can be an
important factor for eutrophication are not detailed in the diagram, but summarised under "environmental
factors". It is important to understand the complexity of the eutrophication process, not only for the
assessment of ecological status of a water body, but also for planning appropriate mitigation measures; e.g. it
is well known that top-down effects on eutrophication, e.g. through predatory fish, can be quite significant.
This known from freshwater systems, but has recently also been shown for coastal and marine waters.
19. The figure does not cover (use-related) impacts on man, either directly or indirectly, which is part of
what constitutes an undesirable disturbance.
5 The statistical variability in such models may be too large to obtain a precise classification of single water bodies, because they are not sufficiently type-specific. The REBECCA-project has investigated the potential for improving such models by restricting the datasets used for a regression to data from single water body types. For more information see: http://www.rbm-toolbox.net/rebecca/index.php .
6 Common Procedure for the Identification of the Eutrophication Status of the OSPAR Maritime Area
Guidance Document on Eutrophication Assessment
Guidance Document May 2009 14
Internalnutrient load
Externalnutrient load
Transboundarynutrient fluxes
Nutrientconcentrations &
nutrient ratios
Environmentalfactors
Export / Import
Losses / Export
Nutrient enrichm
entC
at. I
(+)
Phytobenthos Phytoplankton Macrophytes
Export / Import
Top down
control
Increased turbidity, decreased light transparency
(-)(+)
(+ / -)
Direct effects of nutrient enrichm
entC
at. II
Changeof habitat
Algae toxins(Cat. IV)
Organicmatter
Increasein bacteria
Foam
Oxygendeficiency
Export / Import
Macroinvertebrates
Fish
(+)(+)
(+)
(+) (+ / -) (-) (+)
(-)
Release ofnutrients from
sedimentsSediment
Indirect effects of nutrient enrichment
Cat. III
(+)
(+)
(-)
(+ / -)
Figure 2. General conceptual framework to assess eutrophication in all categories of surface waters.
(+) indicates increase; (-) indicates decrease; round boxes indicate biological quality elements of WFD.
20. To understand environmental policy and related evaluation and assessment, a framework has been
developed in the past which distinguishes driving forces (D), pressures (P), state (S), impact (I) and
responses (R) – this became known as the DPSIR framework. In the WFD context, P is addressed in the
Article 5 reports when assessing pressures and presenting typology/characteristics of a water body. S and I
are addressed by the work on classification, intercalibration and monitoring. R is addressed in the WFD
programmes and measures. The conceptual framework for eutrophication assessment can be linked to the
general DPSIR assessment framework as follows (Figure 3). Category I in the conceptual framework
corresponds to pressures and state whereas Categories II and III refer to impacts. The focus of this guidance
document is on state and impact assessment. Responses are not covered by the mandate to develop this
guidance document although Chapter 8 outlines possible future work in this area.

Guidance Document on Eutrophication Assessment
Guidance Document May 2009 15
Figure 3. DPSIR assessment framework in the context of eutrophication (EEA, 2001).
21. The eutrophication conceptual framework provides an effective means of identifying the critical
processes that can be adapted to processes specific to different water body categories. However, in order to
provide a link to the subsequent steps of the assessment process (i.e. establishing reference conditions and
classification), holistic checklists have been derived for the different water categories highlighting the critical
processes and variables under the headings of: causative factors, primary or direct effects and secondary or
indirect effects. The level of detail included in the checklist (presented in Table 1) reflects the specificity of
the eutrophication process in rivers, lakes, transitional, coastal and marine waters. The complete checklists
for each water category can be found in Annex 2.

Guidance Document on Eutrophication Assessment
Guidance Document May 2009 16
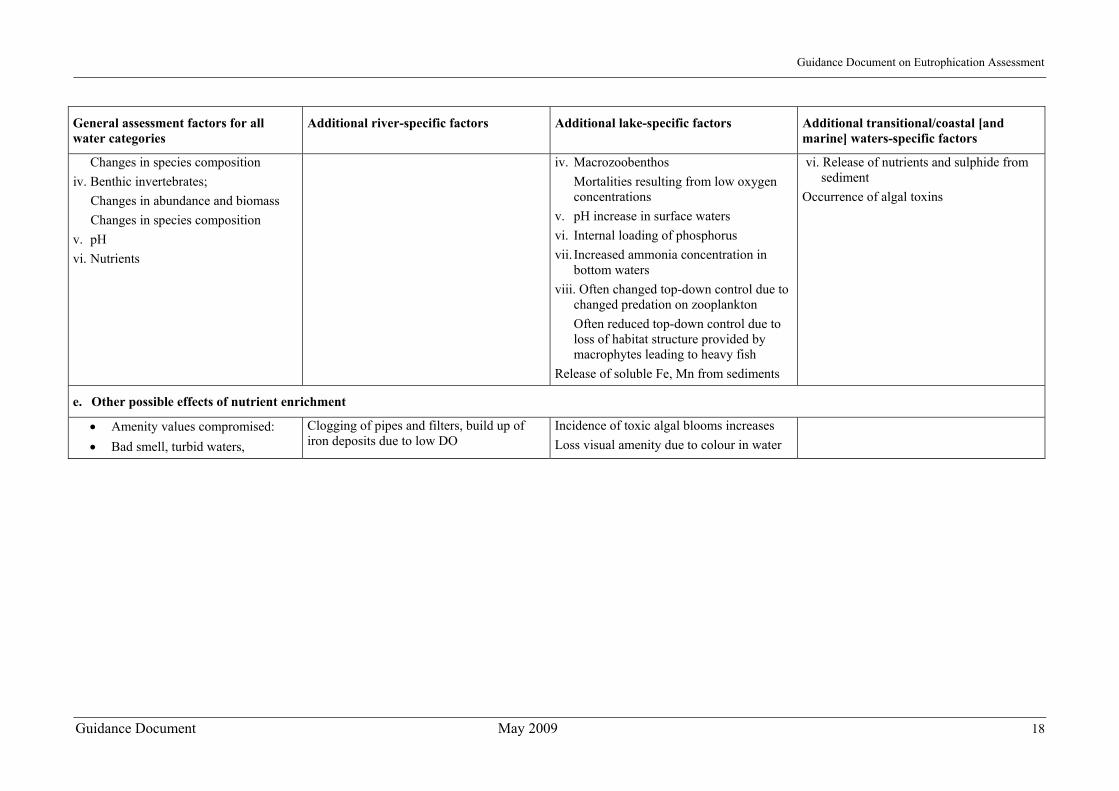
Table 1. Indicative checklist for general and category-specific features of the impact of eutrophication in rivers, lakes, transitional, coastal and marine waters.
General assessment factors for all water categories
Additional river-specific factors Additional lake-specific factors Additional transitional/coastal [and marine] waters-specific factors
a. Causative factors:
The degree of nutrient enrichment: With regard to inorganic/organic nitrogen With regard to inorganic/organic phosphorus With regard to silicon
Taking account of: Sources (differentiating between anthropogenic and natural sources) Increased/upward trends in concentration Elevated concentrations Changed N/P, N/Si, P/Si ratios Changes in nutrient fluxes and nutrient cycles
Riverine, direct and atmospheric inputs internal nutrient loading
Across boundary fluxes, recycling within environmental compartments, riverine, direct and atmospheric inputs and internal loading
b. Supporting environmental factors:
Light availability (irradiance, turbidity, suspended load) Hydrodynamic conditions () Climatic/weather conditions (wind, temperature) Typology factors Other pressures (toxic substances, hydromorphological pressures)
Hydromorphological conditions (current velocity, water flow, substrate type and mobility, water depth, flood frequency, ) Typology factors: alkalinity, colour, size of catchment
Stratification, flushing, retention time, Zooplankton grazing (top-down control) (which may be influenced by other anthropogenic activities) Typology factors: alkalinity, colour, size, depth, share of area shallower than the stratification layer
Upwelling, salinity gradients, Typology factors: e.g. salinity, wave exposure

Guidance Document on Eutrophication Assessment
Guidance Document May 2009 17
General assessment factors for all water categories
Additional river-specific factors Additional lake-specific factors Additional transitional/coastal [and marine] waters-specific factors
c. Direct effects of nutrient enrichment:
i. Phytoplankton; Increased biomass (e.g. chlorophyll a, organic carbon and cell numbers) Increased frequency and duration of blooms Increased annual primary production Shifts in species composition to higher proportion of potentially harmful or toxic species
ii. Macrophytes including macroalgae (such as Characeans); Increased biomass Shifts in species composition Reduced depth distribution until disappearance of macrophytes
iii. Phytobenthos
i. Phytoplankton in parts of rivers with low flow or lake-like structure due to damming
iii. Microphytobenthos; Increased biomass and primary production, increased areal cover on substrate Shifts in species composition from diatoms to chlorophytes and cyanobacteria
i. Phytoplankton; from chrysophytes and diatoms to cyanobacteria and chlorophytes
ii. Macrophytes In very shallow lakes switches occur from macrophytes dominance and phytoplankton dominance Reduction in depth distribution, consequent shift in balance of species
i. Phytoplankton indicator species cells/L (blooms and duration) Shift from diatoms to flagellates
ii. Macrophytes including macroalgae: shift from long-lived species to short-lived species, some of which are nuisance species (Ulva, Enteromorpha) Coverage of areas
d. Indirect effects of nutrient enrichment
i. Organic carbon/organic matter; Increased organic carbon concentrations in water and sediment
ii. Oxygen; Decreased concentrations and saturation percentage Increased frequency of low oxygen concentrations Increased consumption rate
iii. Fish; Changes in abundance
ii. Oxygen; More extreme diurnal variation
iii. Fish; Disruption of migration or movement
iv. Benthic heterotrophic organisms: Increased biomass and areal cover of fungi and bacteria
ii. Oxygen More extreme diurnal variation in surface waters (oversaturation at day and undersaturation at night) Reduction in hypolimnion during stratification periods Occurrence of anoxic zones at the sediment surface ("black spots")
iii. Fish Mortalities resulting from low oxygen concentrations
i. Organic carbon/organic matter; Occurrence of foam and/or slime
ii. Oxygen; Occurrence of anoxic zones at the sediment surface ("black spots")
iii. Fish Mortalities resulting from low oxygen concentrations
iv. Macrozoobenthos Mortalities resulting from low oxygen concentrations
Guidance Document on Eutrophication Assessment
Guidance Document May 2009 18
General assessment factors for all water categories
Additional river-specific factors Additional lake-specific factors Additional transitional/coastal [and marine] waters-specific factors
Changes in species composition iv. Benthic invertebrates;
Changes in abundance and biomass Changes in species composition
v. pH vi. Nutrients
iv. Macrozoobenthos Mortalities resulting from low oxygen concentrations
v. pH increase in surface waters vi. Internal loading of phosphorus vii. Increased ammonia concentration in
bottom waters viii. Often changed top-down control due to
changed predation on zooplankton Often reduced top-down control due to
loss of habitat structure provided by macrophytes leading to heavy fish
Release of soluble Fe, Mn from sediments
vi. Release of nutrients and sulphide from sediment
Occurrence of algal toxins
e. Other possible effects of nutrient enrichment
• Amenity values compromised: • Bad smell, turbid waters,
Clogging of pipes and filters, build up of iron deposits due to low DO
Incidence of toxic algal blooms increases Loss visual amenity due to colour in water
Guidance Document on Eutrophication Assessment
Guidance Document May 2009 19
3. OVERVIEW AND COMMON UNDERSTANDING OF EUTROPHICATION IN EC AND INTERNATIONAL POLICIES
3.1. Introduction
22. Eutrophication is addressed in several EU policies. Nutrient levels to describe the water quality were
introduced in several early pieces of EU water legislation (e.g. Freshwater Fish Directive 78/659/EEC). The
main anthropogenic sources of nutrient loadings were addressed in two directives in 1991: 1) The Urban
Wastewater Treatment Directive (91/271/EEC) addresses the major point sources, in particular the municipal
waste water discharges. 2) The Nitrates Directive (91/676/EEC) deals with diffuse pollution of nitrogen from
agriculture. Both directives define the term "eutrophication". In addition, through the identification of
sensitive areas and compliance with treatment requirements (UWWTD) as well as designation of nitrate
vulnerable zones and application of action programmes (Nitrates Directive), both Directives, respectively,
provide for measures to combat eutrophication. Starting from the 1980s and 1990s, a number of international
conventions addressed eutrophication in marine waters including OSPAR (for the North-East Atlantic),
HELCOM (for the Baltic Sea), the Barcelona Convention (for the Mediterranean Sea) and the Bucharest
Convention (for the Black Sea).
23. In 2000 the Water Framework Directive (2000/60/EC) introduced – amongst other requirements – a
comprehensive ecological status assessment of all surface waters, based on a number of biological,
hydromorphological, chemical and physico-chemical quality elements (cf. Annex V 1.1 and V 1.2). The
WFD provides a basis for a clear and detailed assessment of eutrophication, and provides the potential for a
more consistent and integrated approach to managing nutrient inputs to water taking fully into account the
requirements of previous EU legislation.
24. In addition to these directives, the EU Marine Strategy Framework Directive (2008/56/EC) aims at
achieving or maintaining 'good environmental status' including the minimisation of eutrophication in
Member States' marine waters. Member States are required to develop their marine strategies and identify
measures based upon the initial assessment and their determination of 'good environmental status' for their
water within a harmonised methodological framework.
25. A workshop on eutrophication criteria was hosted by DG Environment, in, Brussels in May 2002. This
considered eutrophication in the context of the WFD, UWWT Directive, the Nitrates Directive and the future
Marine Strategy of the Commission. It launched a process to harmonise existing definitions and criteria for
the assessment of eutrophication. One conclusion of this workshop was a recognised need to move from
definitions to a common understanding of eutrophication, acceptable levels of deviation from reference
conditions and the extent of adverse indirect effects on ecosystems and water use (European Commission
2002b). Since then, the intercalibration has addressed the harmonisation of ecological classification, also
Guidance Document on Eutrophication Assessment
Guidance Document May 2009 20
related to eutrophication. Further workshops have dealt with harmonisation of assessment methods and the
use of nutrient standards in assessing eutrophication:
1) 1st Workshop on Eutrophication, held in Ispra in September 2004,
2) 2nd Workshop on Eutrophication, held in Brussels in September 2005,
3) Nutrient Standards Workshop, held in Zandvoort in October 2007,
4) ECOSTAT Classification Workshop, held in Brussels in March 2008.
26. This chapter considers and compares how eutrophication is understood, defined and assessed in
European Community directives, policies and guidance documents. In addition, the understanding and the
assessment of eutrophication in other regional bodies are presented, in particular in the international marine
conventions OSPAR and HELCOM.
27. An overview of the understanding of eutrophication in EU legislation and policies as well as in a
number of international organisations is provided in Annex 1. This annex was the basis for the following
overview of approaches.
3.2. Overview of policy instruments
28. A number of EC Directives require Member States to monitor parameters relevant to eutrophication
and set ecologically relevant guideline values, however only the UWWT Directive and the Nitrates Directive
have an explicit requirement to assess eutrophication (the former through the exercise to identify "sensitive
areas", i.e. sensitive water bodies, and the latter through identification of "polluted waters" 7 and subsequent
designation of nitrate vulnerable zones). The Water Framework Directive supports both these Directives in
its provisions for protected areas, and, in addition, has an implicit requirement to assess eutrophication when
classifying the Ecological Status of surface water bodies. Unlike the UWWT Directive and the Nitrates
Directive, the WFD stipulates a specific framework for assessing water quality. Eutrophication assessment
criteria and methods have also been developed by several European conventions, including OSPAR and
HELCOM and recently by UNEP/MAP.
29. The requirements of EC directives and other relevant international policies to assess or monitor
eutrophication are summarised in general in Table 2.
7 For the purposes of this guidance the term “polluted waters” is taken, for the sake of brevity, to mean “waters affected by pollution and waters which could be affected by pollution if action is not taken” in line with Article 3 of the Nitrates Directive. Specifically, it refers to waters that are eutrophic or in the near future may become eutrophic if action is not taken, as per the criteria in Annex IA3 of the Directive.

Guidance Document on Eutrophication Assessment
Guidance Document May 2009 21
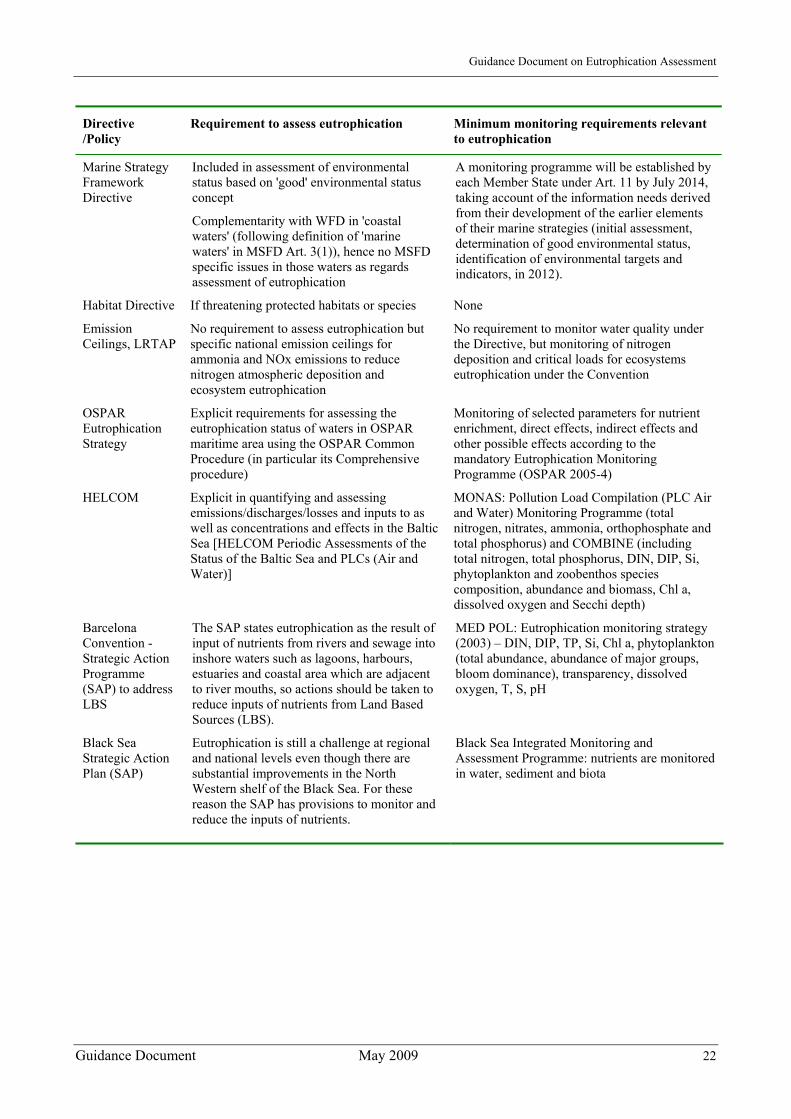
Table 2. General overview of requirements of EC directives and regional conventions regarding eutrophication
Directive /Policy
Requirement to assess eutrophication Minimum monitoring requirements relevant to eutrophication
WFD Included in classification of Ecological Status where nutrient enrichment affects biological and physico-chemical quality elements
Protected Area’s support and upholds requirements of UWWTD and Nitrates Directive
Phytoplankton (6 months), aquatic flora (3 yrs), macroinvertebrates (3 yrs), fish (3 yrs)
Hydromorphological quality elements (Hydrology continuous - 1 month; others 6 years)
Physicochemical quality elements (3 months)
UWWT Directive
In order to identify sensitive areas under Annex IIA(a) criteria (i.e. water bodies that are eutrophic or may become eutrophic in the near future if protective action is not taken)
Review of the existing sensitive areas and designation of new ones at least every 4 years (Article 5(6))
Nitrates Directive
In order to identify "polluted waters" 7 and to designate their catchment area as nitrate vulnerable zones.
For the purpose of designating the nitrate concentrations in freshwaters (surface water and groundwater) should initially be monitored over a period of one year. This monitoring programme should be repeated at least every four years. A review of the eutrophic state of their fresh surface waters, estuaries and coastal waters should be made every four years.
Freshwater Fish Directive
No specific requirements to assess eutrophication, but guideline values for phosphorus are explicitly to reduce the effects of eutrophication
Ammonia, pH and dissolved oxygen (monthly)
Shellfish Water Directive
No specific requirement to assess eutrophication
Dissolved oxygen (monthly) & algal toxins
Dangerous Substance Directive
No specific requirement to assess eutrophication, but requirement on setting quality objectives for phosphorus and for substances which have an adverse effect on the oxygen balance, particularly ammonia and nitrates
No specific requirements
Groundwater Directive
No explicit mention of eutrophication but quality standards are established for nitrates and pesticides and in some cases more stringent threshold values have to be set. A minimum list of pollutants is set up for which MS have to consider establishing threshold values including e.g. ammonium and conductivity
Details of groundwater chemical monitoring are included in WFD Annex V point 2.4, core parameters are: oxygen content, pH value, conductivity, nitrate, ammonium
Bathing Water Directive
As a part of the obligations of the new Bathing Water Directive bathing water profiles have to be established. When the bathing water profile indicates a tendency for proliferation of macro-algae and/or marine phytoplankton, investigations shall be undertaken to determine their acceptability and health risks and adequate management measures shall be taken, including information to the public.
Old Directive: Transparency (fortnightly), pH, dissolved oxygen (when water quality has deteriorated). Nitrates and phosphates, ammonia and nitrogen (Kjeldahl) when there is a tendency towards eutrophication. New Directive: When establishing, reviewing and updating bathing water profiles, adequate use shall be made of data obtained from monitoring and assessments carried out pursuant to Directive 2000/60/EC.
Guidance Document on Eutrophication Assessment
Guidance Document May 2009 22
Directive /Policy
Requirement to assess eutrophication Minimum monitoring requirements relevant to eutrophication
Marine Strategy Framework Directive
Included in assessment of environmental status based on 'good' environmental status concept
Complementarity with WFD in 'coastal waters' (following definition of 'marine waters' in MSFD Art. 3(1)), hence no MSFD specific issues in those waters as regards assessment of eutrophication
A monitoring programme will be established by each Member State under Art. 11 by July 2014, taking account of the information needs derived from their development of the earlier elements of their marine strategies (initial assessment, determination of good environmental status, identification of environmental targets and indicators, in 2012).
Habitat Directive If threatening protected habitats or species None
Emission Ceilings, LRTAP
No requirement to assess eutrophication but specific national emission ceilings for ammonia and NOx emissions to reduce nitrogen atmospheric deposition and ecosystem eutrophication
No requirement to monitor water quality under the Directive, but monitoring of nitrogen deposition and critical loads for ecosystems eutrophication under the Convention
OSPAR Eutrophication Strategy
Explicit requirements for assessing the eutrophication status of waters in OSPAR maritime area using the OSPAR Common Procedure (in particular its Comprehensive procedure)
Monitoring of selected parameters for nutrient enrichment, direct effects, indirect effects and other possible effects according to the mandatory Eutrophication Monitoring Programme (OSPAR 2005-4)
HELCOM Explicit in quantifying and assessing emissions/discharges/losses and inputs to as well as concentrations and effects in the Baltic Sea [HELCOM Periodic Assessments of the Status of the Baltic Sea and PLCs (Air and Water)]
MONAS: Pollution Load Compilation (PLC Air and Water) Monitoring Programme (total nitrogen, nitrates, ammonia, orthophosphate and total phosphorus) and COMBINE (including total nitrogen, total phosphorus, DIN, DIP, Si, phytoplankton and zoobenthos species composition, abundance and biomass, Chl a, dissolved oxygen and Secchi depth)
Barcelona Convention - Strategic Action Programme (SAP) to address LBS
The SAP states eutrophication as the result of input of nutrients from rivers and sewage into inshore waters such as lagoons, harbours, estuaries and coastal area which are adjacent to river mouths, so actions should be taken to reduce inputs of nutrients from Land Based Sources (LBS).
MED POL: Eutrophication monitoring strategy (2003) – DIN, DIP, TP, Si, Chl a, phytoplankton (total abundance, abundance of major groups, bloom dominance), transparency, dissolved oxygen, T, S, pH
Black Sea Strategic Action Plan (SAP)
Eutrophication is still a challenge at regional and national levels even though there are substantial improvements in the North Western shelf of the Black Sea. For these reason the SAP has provisions to monitor and reduce the inputs of nutrients.
Black Sea Integrated Monitoring and Assessment Programme: nutrients are monitored in water, sediment and biota

Guidance Document on Eutrophication Assessment
Guidance Document May 2009 23
3.3. Concepts and definitions of eutrophication
30. It is recognised that different geochemical and hydromorphological conditions are reflected in
different characteristics of water bodies such as different trophic and biological conditions. Thus, the
assessment of eutrophication should consider these issues and assess the deviation from the type-specific
condition. This concept is directly or indirectly addressed in all the relevant policies that aim at controlling
the pressures stemming from human activities with an impact on the natural condition of the ecosystem. For
the purpose of this guidance, the term "eutrophic" is used to refer to this situation, when the natural trophic
status (including the biology) is out of balance because of anthropogenic pressures.
31. This understanding of "anthropogenic" eutrophication corresponds with how the WFD classifies
surface water ecological status in relation to type-specific reference conditions. A pressure (in this case
nutrient inputs) causes an adverse change in biological quality elements (e.g. 'composition, abundance and
biomass of phytoplankton'). This in turn might cause indirect effects on physicochemical quality elements
(e.g. transparency, oxygenation conditions), and other biota (e.g. macroinvertebrates). Water bodies that fail
to achieve Good Ecological Status due to the effects of human induced nutrient enrichment can be
considered to be adversely affected by eutrophication.
32. In the context of this guidance, eutrophication involves adverse ecological changes (an "undesirable
disturbance") and it can apply to waters from anywhere within the trophic spectrum. It should not be
confused with the same term when used in relation to limnological trophic classification, where its meaning
is more limited and not necessarily linked to assessing the extent of ecological change. In that sense, an
oligotrophic water body (e.g. a lake) which deteriorates to mesotrophic would require UWWTD/ND/WFD
designation/action despite the fact that it would not have become "eutrophic" in terms of OECD trophic
status. In contrast a naturally "eutrophic" water body, as measured through OECD classification, would
require no designation or action under the UWWTD/Nitrates Directive/WFD unless its ecological status had
deteriorated, or was at risk of doing so due to nutrient enrichment.
33. These deliberations concur with conclusions from the May 2002 Eutrophication Workshop (European
Commission 2002b) that the definition of eutrophication in the UWWT Directive is adequate as a starting
point for further development of a guidance on the issue of eutrophication assessment, which is as follows:
Definition of eutrophication (cf. Art. 2(11) of the UWWT Directive 91/271/EEC):
Eutrophication is "the enrichment of water by nutrients, especially compounds of nitrogen and/or
phosphorus, causing an accelerated growth of algae and higher forms of plant life to produce an undesirable
disturbance to the balance of organisms present in the water and to the quality of the water concerned".
Guidance Document on Eutrophication Assessment
Guidance Document May 2009 24
3.4. Key terms used in different European policies
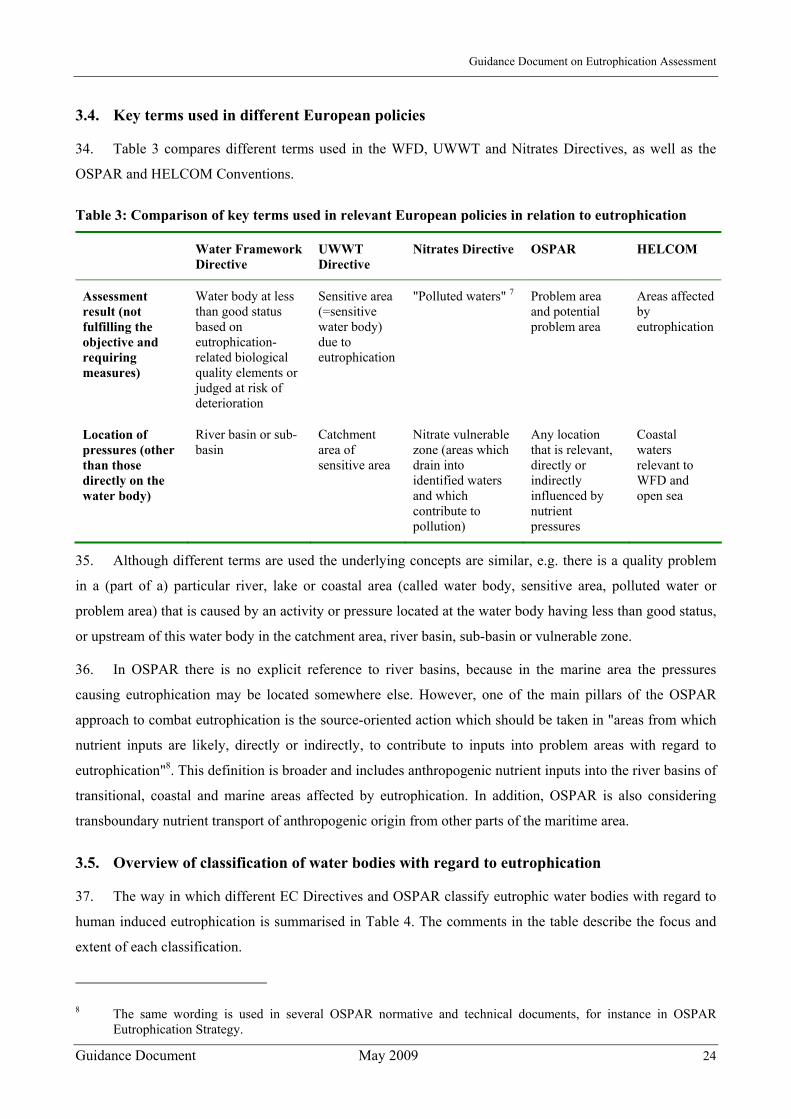
34. Table 3 compares different terms used in the WFD, UWWT and Nitrates Directives, as well as the
OSPAR and HELCOM Conventions.
Table 3: Comparison of key terms used in relevant European policies in relation to eutrophication
Water Framework Directive
UWWT Directive
Nitrates Directive OSPAR HELCOM
Assessment result (not fulfilling the objective and requiring measures)
Water body at less than good status based on eutrophication-related biological quality elements or judged at risk of deterioration
Sensitive area (=sensitive water body) due to eutrophication
"Polluted waters" 7 Problem area and potential problem area
Areas affected by eutrophication
Location of pressures (other than those directly on the water body)
River basin or sub-basin
Catchment area of sensitive area
Nitrate vulnerable zone (areas which drain into identified waters and which contribute to pollution)
Any location that is relevant, directly or indirectly influenced by nutrient pressures
Coastal waters relevant to WFD and open sea
35. Although different terms are used the underlying concepts are similar, e.g. there is a quality problem
in a (part of a) particular river, lake or coastal area (called water body, sensitive area, polluted water or
problem area) that is caused by an activity or pressure located at the water body having less than good status,
or upstream of this water body in the catchment area, river basin, sub-basin or vulnerable zone.
36. In OSPAR there is no explicit reference to river basins, because in the marine area the pressures
causing eutrophication may be located somewhere else. However, one of the main pillars of the OSPAR
approach to combat eutrophication is the source-oriented action which should be taken in "areas from which
nutrient inputs are likely, directly or indirectly, to contribute to inputs into problem areas with regard to
eutrophication"8. This definition is broader and includes anthropogenic nutrient inputs into the river basins of
transitional, coastal and marine areas affected by eutrophication. In addition, OSPAR is also considering
transboundary nutrient transport of anthropogenic origin from other parts of the maritime area.
3.5. Overview of classification of water bodies with regard to eutrophication
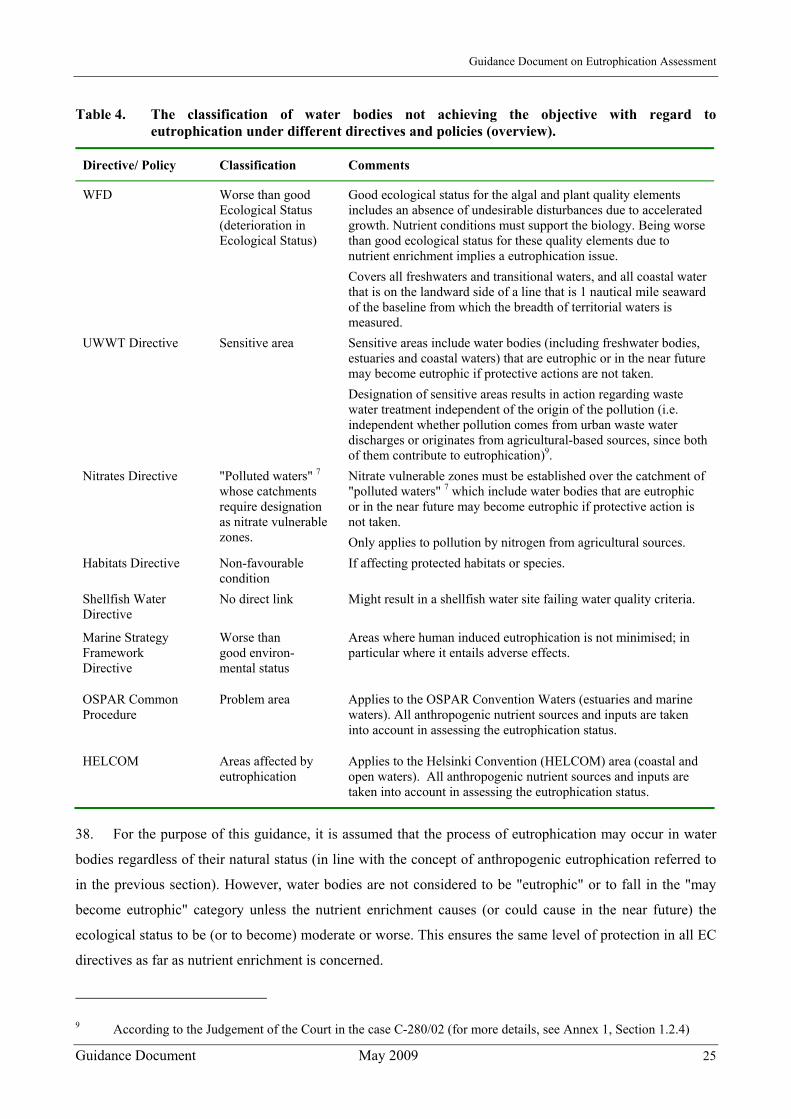
37. The way in which different EC Directives and OSPAR classify eutrophic water bodies with regard to
human induced eutrophication is summarised in Table 4. The comments in the table describe the focus and
extent of each classification.
8 The same wording is used in several OSPAR normative and technical documents, for instance in OSPAR Eutrophication Strategy.
Guidance Document on Eutrophication Assessment
Guidance Document May 2009 25
Table 4. The classification of water bodies not achieving the objective with regard to eutrophication under different directives and policies (overview).
Directive/ Policy Classification Comments
WFD Worse than good Ecological Status (deterioration in Ecological Status)
Good ecological status for the algal and plant quality elements includes an absence of undesirable disturbances due to accelerated growth. Nutrient conditions must support the biology. Being worse than good ecological status for these quality elements due to nutrient enrichment implies a eutrophication issue. Covers all freshwaters and transitional waters, and all coastal water that is on the landward side of a line that is 1 nautical mile seaward of the baseline from which the breadth of territorial waters is measured.
UWWT Directive Sensitive area Sensitive areas include water bodies (including freshwater bodies, estuaries and coastal waters) that are eutrophic or in the near future may become eutrophic if protective actions are not taken. Designation of sensitive areas results in action regarding waste water treatment independent of the origin of the pollution (i.e. independent whether pollution comes from urban waste water discharges or originates from agricultural-based sources, since both of them contribute to eutrophication)9.
Nitrates Directive "Polluted waters" 7 whose catchments require designation as nitrate vulnerable zones.
Nitrate vulnerable zones must be established over the catchment of "polluted waters" 7 which include water bodies that are eutrophic or in the near future may become eutrophic if protective action is not taken. Only applies to pollution by nitrogen from agricultural sources.
Habitats Directive Non-favourable condition
If affecting protected habitats or species.
Shellfish Water Directive
No direct link Might result in a shellfish water site failing water quality criteria.
Marine Strategy Framework Directive
Worse than good environ- mental status
Areas where human induced eutrophication is not minimised; in particular where it entails adverse effects.
OSPAR Common Procedure
Problem area Applies to the OSPAR Convention Waters (estuaries and marine waters). All anthropogenic nutrient sources and inputs are taken into account in assessing the eutrophication status.
HELCOM Areas affected by eutrophication
Applies to the Helsinki Convention (HELCOM) area (coastal and open waters). All anthropogenic nutrient sources and inputs are taken into account in assessing the eutrophication status.
38. For the purpose of this guidance, it is assumed that the process of eutrophication may occur in water
bodies regardless of their natural status (in line with the concept of anthropogenic eutrophication referred to
in the previous section). However, water bodies are not considered to be "eutrophic" or to fall in the "may
become eutrophic" category unless the nutrient enrichment causes (or could cause in the near future) the
ecological status to be (or to become) moderate or worse. This ensures the same level of protection in all EC
directives as far as nutrient enrichment is concerned.
9 According to the Judgement of the Court in the case C-280/02 (for more details, see Annex 1, Section 1.2.4)

Guidance Document on Eutrophication Assessment
Guidance Document May 2009 26
39. From the legal point of view the terms "eutrophic" and "may become eutrophic in the near future" as
used in Nitrates and UWWT directives are similar and require similar consequence, i.e. the designation of
those areas as nitrate vulnerable zones (Nitrates Directive) or identification as "sensitive areas" (UWWT
Directive). However, technically speaking, they reflect different situations. These concepts will be further
addressed in the following sections.
3.6. Assessment results under various policies
40. The analysis and comparison of assessment results is an important starting point for the development
of a harmonised assessment framework. Ultimately, the assessment should lead to a comparable and
consistent conclusion under different policies. In general, the outcome of the assessment is used to determine
whether or not certain measures need to be taken under different policies. At this stage, it is important to
recall two basic principles when interpreting the content of this document:
a. in case that the assessment under different policies leads to a different level of protection the
most stringent requirement shall apply.
b. it is ultimately up to the European Court of Justice (ECJ) to interpret legal requirements of EC
Directives. Recently, the ECJ has interpreted the designation of sensitive areas under the
UWWT Directive in a broad sense (see EJC judgement C-280/02 in section 1.2.4 of Annex 1).
In consequence, the application of this guidance must lead, at least, to the same level of
protection provided by this ruling independent of which EC Directive is applied insofar as the
judgement is relevant to other policies.
41. In Table 5 the WFD ecological status classes are compared with (i) sensitive areas and not sensitive
areas (so called 'normal' areas) (cf. the UWWT Directive), (ii) "polluted waters" 7 requiring designation of
nitrate vulnerable zones (cf. Nitrates Directive), (iii) problem and non-problem areas or potential problem
areas (cf. OSPAR Comprehensive Procedure), and (iv) the terms used in HELCOM. The comparison
considers when action is required to address eutrophication under each directive/policy. As regards the
obligation to identify sensitive areas under UWWT Directive or designate nitrate vulnerable zones under the
Nitrates Directive Table 5 is not applicable to Member States that have chosen to implement the "whole
territory approach" (see paragraphs 52-54 for more information on the whole territory approach).
WFD moderate, poor and bad status, compared with the eutrophication categories
42. As stated in the previous section, the use of the terms "eutrophic" and "in the near future may become
eutrophic" in the Nitrates and UWWT Directives are interchangeable from the legal point of view and both
have similar consequences (identification/designation of nitrate vulnerable zones or of sensitive areas).
However, in order to establish a consistent link with the WFD status classes, they can be interpreted as the
result of different degrees of ecological deviation from reference conditions. The term "eutrophic" can be
identified with a situation where undesirable disturbances are common, whereas the term "in the near future

Guidance Document on Eutrophication Assessment
Guidance Document May 2009 27
may become eutrophic" corresponds with a situation where undesirable disturbances10 are not necessarily
present, but the degree of ecological change is such that they are likely. Therefore, based on the text of
normative definitions for the algal/plant quality elements, moderate status under the WFD corresponds
broadly with the "in the near future may become eutrophic" situation, particularly if there is increasing
nutrient pressure.
43. As the degradation of water quality increases, so does the likelihood of undesirable disturbances, and
from a certain point in the moderate class and beyond into poor and bad, the conditions would correspond
with "eutrophic". The moderate class is interpreted as a transition class between good status, where no
undesirable disturbances are present, and poor or bad, where they are increasingly common and severe. See
Chapter 4.4 (including paragraph 73 and Table 8 on undesirable disturbances) for a more detailed
interpretation of eutrophication in the context of WFD ecological status assessment.
44. In deciding on whether and with what certainty to report a water body as being at less than Good
Ecological Status (in terms of eutrophication) and in determining the appropriate follow-up actions, the
issues covered and guidance given in Chapter 6.2, on (a) dealing with mismatches between nutrients and
biology (paragraphs 188-190) and (b) accounting for uncertainty in eutrophication assessment (paragraphs
198-200), should be considered. These issues are important not only in relation to classification but also in a
policy context in terms of decisions on priorities for control measures (under the WFD and, where relevant,
via identification of waters as sensitive/polluted under UWWT and/or Nitrates Directives) and further
monitoring or other investigations.
WFD good and high status compared with the eutrophication categories
45. Table 5 and paragraphs 41-43 above address the assessment of current status. However, the WFD also
requires Member States to assess the risk of future deterioration of status, linked to the WFD objective of
preventing such deterioration. This means water bodies that are currently in good or even high status and that
may deteriorate in the future due to increasing pressures will need to be part of the Programme of Measures
under the WFD. This forecasting of future breaching of the prevent deterioration principle equates well with
the forecast/estimation of "may become eutrophic in the near future" of the UWWT and Nitrates Directives,
at least if the deterioration may result in a moderate or worse status due to eutrophication. However, at least
until the first WFD River Basin Management Plans are in place in 2009, the time scales of the WFD
objectives and 'the near future' estimation may not necessarily coincide. In order to assess whether
undesirable disturbances are likely to occur, nutrient pressures/concentrations, data on the effects of
eutrophication (e.g. large phytoplankton blooms, mats of green algae, oxygen deficiency) and other
environmental factors that influence eutrophication should be taken into account, for example light
10 On the definition of undesirable disturbances see Annex 1, section 1.2.4 Relevant Case Law. Some examples of significant undesirable disturbances can be found in Chapter 4, Table 8.
Guidance Document on Eutrophication Assessment
Guidance Document May 2009 28
availability/turbidity, hydrodynamic conditions, temperature, etc. (see category-specific checklist in Annex
2). The following WFD activities should be considered:
i. ecological status assessment – whether there is a trend/development in the recent past from high to
good status or in values for individual quality elements that determine eutrophication, indicating
movement towards moderate/poor/bad and thus "eutrophic";
ii. risk assessment to estimate future status and prevent deterioration – using information on expected
change in pressures that are likely to result in a water body becoming eutrophic in the near future
(predictive analysis).
46. The initial results of the Article 5 analysis under WFD will be further refined with the information
from the monitoring networks, and by further characterisation and classification. The status assessment of
water bodies is part of the River Basin Management Plans (RBMP) which are due by December 2009. Along
this process from the Article 5 analysis to the RBMP, increasing certainty will be attained on the evaluation
of future status of water bodies. At any point, designation under UWWT and/or Nitrates Directives must take
place if sufficient certainty is attained that a water body may become eutrophic in the near future.
Summary of links between WFD status and eutrophication categories
47. In summary, it is proposed that in terms of WFD status classification and environmental objectives,
the term "eutrophic" relates to situations where undesirable disturbances are common or severe and equates
primarily to poor or bad status, whereas "in the near future may become eutrophic" of the UWWT and
Nitrates Directives can be interpreted in two complementary ways:
in the context of current status assessment, as corresponding to moderate status (undesirable
disturbances are not necessarily present, but the degree of ecological change is such that they are
likely, particularly if there is increasing nutrient pressure) or,
in the context of future status evaluation especially for waters of high or good status as
corresponding to a risk of breaching the Water Framework Directive prevent-deterioration principle.
48. It is noted that moderate is a transition class between good and poor and that where there is a read
across to UWWT or Nitrates Directives, water bodies can be either in the "may become eutrophic" or
"eutrophic" categories depending on the extent of ecological impacts.
49. As discussed in Chapter 3.6 (paragraph 44) and Chapter 6.2, information on confidence/uncertainty in
classification is important for informing decisions on the appropriate follow-up actions.
50. The interpretation set out in the preceding paragraphs ensures a coherent action against eutrophication
across the various policies. Action requirements under the various Directives should be considered together
in order to produce the final outcome of the RBMP in December 2009. Therefore, whenever pressures

Guidance Document on Eutrophication Assessment
Guidance Document May 2009 29
addressed by UWWT and Nitrates Directives are present, the list of water bodies subject to WFD
Programme of Measures should be coherent with the designation of sensitive areas and polluted waters under
UWWT and Nitrates Directives. It should be recalled that measures under these Directives are part of the
Programme of Measures foreseen in Article 11.3 and Annex VI part A of the WFD.
51. It is worth noting that both sensitive areas under the Urban Waste Water Treatment Directive
91/271/EEC and nitrate vulnerable zones under Directive 91/676/EEC become Protected Areas under Article
6 and Annex IV of the WFD.
52. As regards concrete measures foreseen in the various Directives to combat eutrophication, according
to Art. 5(2) of Directive 91/271/EEC, Member States shall ensure that urban waste water entering collecting
systems shall before discharge into sensitive areas be subject to a more stringent treatment to reduce the
nutrient load, for agglomerations of more than 10,000 p.e.. In addition, in accordance with Art. 5(5),
discharges which are located in the relevant catchment areas of sensitive areas and which contribute to the
pollution of these areas shall also be subject to a more stringent treatment11. Similarly, Art. 5(1) of Directive
91/676/EEC requires Member States to establish action programmes consisting of mandatory measures in
respect to designated nitrate vulnerable zones (Art. 5(4)), as well as additional measures or reinforced actions
if necessary to achieve the objectives (Art. 5(5)).
53. Nevertheless, following Article 5.8 of Directive 91/271/EEC, Member States do not have an
obligation to identify sensitive areas (i.e. sensitive water bodies) if they implement, on their whole territory,
more stringent treatment (Art. 5.2 and 5.3) or apply 75 % reduction of the overall load of total nitrogen and
of total phosphorus entering all urban waste water treatment plants (Art. 5.4).
54. In the same way, following Article 3.5 of Directive 91/676/EEC, Member States shall be exempt from
the obligation to designate specific vulnerable zones, if they establish and apply action programmes referred
to in Article 5 throughout their national territory.
55. Member States may decide to apply the whole territory approach without taking into consideration the
status of water bodies. Therefore, the fact that Member States have chosen to apply in their whole territory
the control measures mentioned in the previous two paragraphs does not prejudge the result of the status
assessment under WFD.
11 See ECJ judgement in §§18 to §§ 20 of the case C-396/00, of 25 April 2002 (Milano case)

Guidance Document on Eutrophication Assessment
Guidance Document May 2009 30
Table 5. Comparison of assessment results under various policies for waters responding to nutrient enrichment (based on the assumption that the WFD classification is the starting point and that the different sources of pollution are relevant).
ASSESSMENT OF CURRENT STATUS
Ecological status
WFD normative definition
UWWT Directive12
Nitrates Directive12
OSPAR HELCOM MSF Directive
High Nearly undisturbed conditions
Non-eutrophic, designation of sensitive area is not required13
Non-eutrophic, not a polluted water 7, designation of nitrate vulnerable zone is not required
Non-problem area
Area not affected by eutrophication
-
Good Slight change in composition, biomass
Non-eutrophic, designation of sensitive area is not required
Non-eutrophic, not a polluted water 7, designation of nitrate vulnerable zone is not required
Non-problem area14
Area not affected by eutrophication
Human induced eutrophication is minimised15
Moderate Moderate change in composition, biomass
Eutrophic or may become eutrophic in the near future, designation of sensitive area is required
Eutrophic or may become eutrophic in the near future, polluted water 7, designation of nitrate vulnerable zone is required
Problem area14
Area affected by eutrophication
Human induced eutrophication is not minimised16
Poor17 Major change in biological communities
Eutrophic, designation of sensitive area is required
Eutrophic, polluted water 7, designation of nitrate vulnerable zone is required
Problem area
Area affected by eutrophication
Human induced eutrophication is not minimised16
Bad Severe change in biological communities
Eutrophic, designation of sensitive area is required
Eutrophic, polluted water 7, designation of nitrate vulnerable zone is required
Problem area
Area affected by eutrophication
Human induced eutrophication is not minimised16
12 If Member States have chosen to apply the whole territory approach, there is no obligation to designate sensitive areas under the UWWT Directive or nitrate vulnerable zones under the Nitrates Directive.
13 In coastal zones, with good water exchange and other conditions described in the Directive 91/271/EEC, Annex II.B, even less sensitive areas can be designated.
14 If insufficient data is available, ‘good’ or ‘moderate’ Ecological Status could correspond to a potential problem area. Nevertheless, in the case of potential problem areas with regard to eutrophication, preventive measures should be taken in accordance with the Precautionary Principle. Furthermore, there should be urgent implementation of monitoring and research in order to enable a full assessment of the eutrophication status of each area concerned within five years of its being characterised as a potential problem area (see OSPAR Strategy to Combat Eutrophication § 3.2b.).
15 Human induced eutrophication is minimised, especially effects thereof, such as losses in biodiversity, ecosystem degradation, harmful algal blooms and oxygen deficiency in bottom waters (MFSD Annex 1 (5))
16 Work on the development of the respective descriptor is under way. 17 Indirect effects of eutrophication (e.g. decline in dissolved oxygen) will be evident at poor Ecological Status.
Guidance Document on Eutrophication Assessment
Guidance Document May 2009 31
56. Table 5 provides a general comparison but has to be interpreted with care. The following aspects
should be considered in more detail, in particular:
a. In general, the designation of many sensitive areas (under the UWWTD), the identification of "polluted waters"7 requiring designation of nitrate vulnerable zones (under the Nitrates Directive), and the first designation of "problem areas" (2003) under the OSPAR Common Procedure has taken place before the WFD entered into force. All existing designations will be unchanged by the WFD independent of the ecological status of the water bodies concerned, although that status will be important in determining what nutrient control measures will be required. Sensitive areas and nitrate vulnerable zones will become protected areas under Article 6 and Annex IV of the WFD. After 2006, any classification of the status of these water bodies under the WFD will not change this designation, but will affect decisions on the range and extent of control measures required to achieve WFD objectives18.
b. After 2006, however, when the monitoring programmes under the WFD will have become operational, the results of the ecological status assessment should be considered in reviews of the identification of "sensitive areas" and the designation of nitrate vulnerable zones in accordance with the UWWT and Nitrates Directives, respectively. Where these directives apply, a complementary approach to eutrophication assessment under the WFD is desirable as these two directives are basic measures under the WFD. In considering any read across from WFD classes to identification of waters as "sensitive" or "polluted" under the UWWT or Nitrates Directives, the advice on checking procedures (paragraph 43 and Chapter 6.2) and accounting for uncertainty in eutrophication assessment (paragraphs 44 and 46 and Chapter 6.2), should be taken into account.
c. Designation of sensitive areas or nitrate vulnerable zones is only necessary when pressures covered by the UWWT or Nitrates Directives are significant (regarding the latter see paragraph 35 of Judgement Case C-293/97). Recent ruling by the Court of Justice helps to interpret this concept of significant contribution (see paragraphs 40, 52, 77 and 87 of Judgement Case C-280/02 and paragraphs 81 to 88 of the Case C-221/03).
d. Water bodies may still be in moderate-bad status for a long time after pressures have been reduced, due to delayed soil leaching/run-off response, internal loading and/or time-lagged response in the biological quality elements. In such cases, the clause on "natural processes" in the exemption of the WFD (Article 4.4 WFD) may be checked to see whether it is applicable. Alternatively, other internal restoration measures (e.g. bio-manipulation or sediment dredging) may be required to speed up the recovery back to good status.
e. Finally, also other criteria (independent from eutrophication of surface water) may lead to designation of nitrate vulnerable zones and identification of sensitive areas (for example high nitrate concentrations in surface and groundwater)19. However, these are not part of the deliberations in this guidance.
18 The requirements on review of sensitive areas and designation of vulnerable zones every four years remains unchanged according to Art. 5(6) of 91/271/EEC and Art. 3(4) of 91/676/EEC.
19 See section A of Annex II of Urban Waste Water Treatment Directive 91/271/EEC, and Section A of Annex I of Nitrate Directive 91/676/EEC.

Guidance Document on Eutrophication Assessment
Guidance Document May 2009 32
57. The pressures causing eutrophication may originate a long way from the water body being affected. In
accordance to UWWT and Nitrates Directives, measures have to be taken in the relevant catchment areas of
sensitive areas and which contribute to the pollution of these areas (Art. 5(5) of Directive 91/271/EEC), or in
all known areas of land which drain into "polluted waters" 7 and which contribute to pollution (Art. 3(1),
3(2) and 5(1) of Directive 91/676/EEC). However, from the WFD perspective, this does not mean that all the
water bodies upstream will need to be classified as less than good status.
58. Moreover, there may be situations where the nutrient pressures on affected water bodies may be
located in another river basin (district) or adjacent areas of the marine waters (e.g. different parts of the
Baltic Sea). This situation mainly occurs in transitional and coastal waters, where nutrient loads and/or
eutrophication effects may be transported from one coast to another (e.g. North Adriatic Sea or German
Bight, parts of the Baltic Sea, etc.) or from estuaries to coastal waters20. The assessments needed in this type
of situation can be complex.
59. In comparing class boundaries used by the WFD and OSPAR it is helpful to describe the criteria for
assessing Ecological Status in terms of primary and secondary impacts of eutrophication; this is done in
Table 6. Environmentally significant undesirable impacts are expected to start at moderate Ecological Status
(see Chapter 4 for more detail). It is proposed that the probability and severity of adverse effects increases
from moderate to bad status.
Table 6. Examples of qualitative criteria for assessing WFD Ecological Status in terms of primary and secondary eutrophication impacts
Ecological Status
WFD normative definition Primary impacts (e.g. phytoplankton biomass)
Secondary impacts (e.g. O2 deficiency)
High Nearly undisturbed conditions None None
Good Slight change in abundance, composition or biomass for relevant biological quality elements
Slight None or only slight
Moderate Moderate change in composition or biomass for relevant biological quality elements
Change in biomass, abundance and composition begins to be environmentally significant, i.e. pollution tolerant species more common.
Occasional impacts from increased biomass
Poor Major change in biological communities
Pollution sensitive species no longer common. Persistent blooms of pollution tolerant species
Secondary impacts common and occasionally severe
Bad Severe change in biological comm. Totally dominated by pollution tolerant species
Severe impacts common
20 Recent European Court of Justice ruling is relevant to interpret this concept. See Annex I, Section 1.2.4.
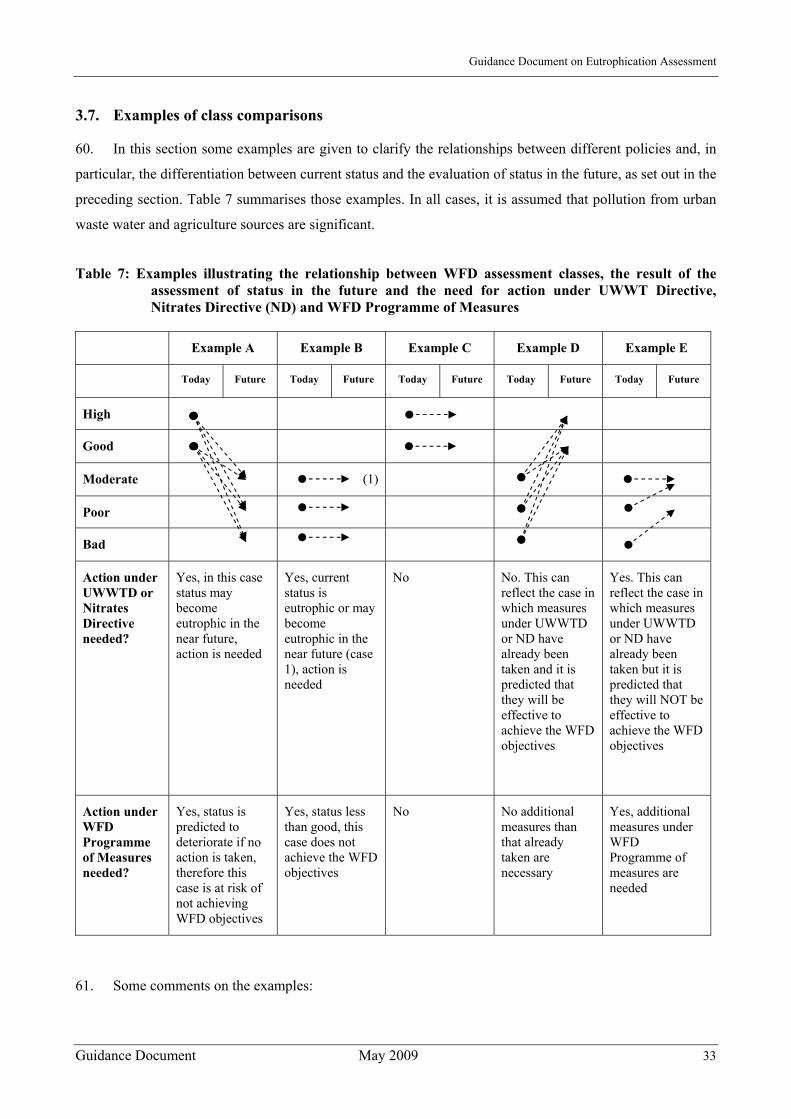
Guidance Document on Eutrophication Assessment
Guidance Document May 2009 33
3.7. Examples of class comparisons
60. In this section some examples are given to clarify the relationships between different policies and, in
particular, the differentiation between current status and the evaluation of status in the future, as set out in the
preceding section. Table 7 summarises those examples. In all cases, it is assumed that pollution from urban
waste water and agriculture sources are significant.
Table 7: Examples illustrating the relationship between WFD assessment classes, the result of the assessment of status in the future and the need for action under UWWT Directive, Nitrates Directive (ND) and WFD Programme of Measures
Example A Example B Example C Example D Example E
Today Future Today Future Today Future Today Future Today Future
High
Good
Moderate (1)
Poor
Bad
Action under UWWTD or Nitrates Directive needed?
Yes, in this case status may become eutrophic in the near future, action is needed
Yes, current status is eutrophic or may become eutrophic in the near future (case 1), action is needed
No No. This can reflect the case in which measures under UWWTD or ND have already been taken and it is predicted that they will be effective to achieve the WFD objectives
Yes. This can reflect the case in which measures under UWWTD or ND have already been taken but it is predicted that they will NOT be effective to achieve the WFD objectives
Action under WFD Programme of Measures needed?
Yes, status is predicted to deteriorate if no action is taken, therefore this case is at risk of not achieving WFD objectives
Yes, status less than good, this case does not achieve the WFD objectives
No No additional measures than that already taken are necessary
Yes, additional measures under WFD Programme of measures are needed
61. Some comments on the examples:
Guidance Document on Eutrophication Assessment
Guidance Document May 2009 34
EXAMPLE A: In this case it is predicted that the status of the water body will deteriorate in the
future. Action is needed under UWWT and Nitrates Directive because the water body "may become
eutrophic in the near future". This water body would also be included in the WFD Programme of
Measures because it is at risk of breaching the prevent deterioration principle.
EXAMPLE B: The water body is eutrophic or it may become eutrophic in the near future (case 1
corresponding to current moderate status). Therefore action is needed under UWWT and Nitrates
Directives and it will also be included in the WFD Programme of Measures as this water body will not
achieve the WFD objective of good status unless action is taken.
EXAMPLE C: This is the case where no eutrophication problem exists today and none is
envisaged for the future. It should be noted that if it is predicted that the water body will deteriorate
from high to good status, action should be taken under WFD Programme of Measures as this water
body would be at risk of breaching the prevent deterioration principle.
EXAMPLE D: In this case it is predicted that the status of the water body will improve and it will
reach good or high status. This can reflect the case in which measures under UWWT and Nitrates
Directives have already been taken and are predicted to be sufficient to achieve WFD objectives. No
further action under WFD is thus necessary.
EXAMPLE E: The last case has also the same starting point as D, but it is not expected that the
measures taken according to the requirement of the Nitrates and UWWT Directives will give sufficient
improvement in order to achieve a non-eutrophic status. This means that this water body has been
identified as a polluted water and/or a sensitive area. WFD assessment would not change this
designation. The WFD assessment results in a "less than good" status in the future as concerns nutrient
enrichment. Additional measures to achieve WFD objectives are necessary under WFD Programme of
Measures.
62. Linked with Example E, it is important to recall that under Article 5.5 of the Nitrates Directive
"Member States shall take, in the framework of the action programmes, such additional measures or
reinforced actions as they consider necessary if, […] it becomes apparent that the measures referred to in
paragraph 4 will not be sufficient for achieving the objectives specified in Article 1". Therefore, in case of
pollution from agricultural sources, the obligation to take additional measures and to review their
effectiveness every four years (Art 5(7)), is already in force. In case of UWWT Directive, according to the
Annex IB.4, more stringent measures must be applied where required to ensure that the receiving waters
satisfy any other relevant Directives, for example the WFD.
63. It is important to note also that measures under UWWT and Nitrates Directives are considered basic
measures in the WFD Programme of Measures, and therefore are minimum requirements to be complied
with (Article 11.3 and Annex VI, Part A of the WFD).
Guidance Document on Eutrophication Assessment
Guidance Document May 2009 35
64. The comparison of assessment results under various policies introduced in the preceding section and
illustrated with the examples in Table 7 ensure a coherent and reinforced action against eutrophication across
different policies.
65. In the examples, a generic "future" scenario is used, deliberately omitting any deadline for
implementation of different directives. Measures under Nitrates and UWWT directives should have already
been taken to combat eutrophication as appropriate. Nevertheless, as stated previously, from 2006 onwards
and for new developments and newly identified problems, the WFD assessment framework may help in the
implementation of these other directives.
4. THE WFD CONCEPT OF ECOLOGICAL STATUS IN THE CONTEXT OF EUTROPHICATION
66. This section summarises the main outcomes of a paper drafted by the Working Group on Ecological
Status (ECOSTAT) under the WFD Common Implementation Strategy, on the interpretation of the WFD
concept of ecological status in the context of eutrophication (the full paper is available as a background
document)21. This paper is based on and further develops the Classification Guidance Document which was
adopted by the Water Directors in November 2003 (see Annex 1, section 1.1.6 for a summary of this
document).
67. The objective of this chapter is to set out a proposed common understanding of the Water Framework
Directive’s normative definitions in the context of nutrient enrichment and eutrophication. Such an
understanding is necessary to underpin the ecological status classification in the context of eutrophication
and thus the intercalibration exercise and the design of monitoring programmes. The proposed understanding
focuses on those key principles of the normative definitions that are relevant across the water categories.
4.1. Most sensitive biological quality elements
68. As a general rule, the aquatic flora will have an earlier response to changes in nutrient conditions than
benthic invertebrates or fish. The relative ‘sensitivity’ of different quality elements of the aquatic flora (e.g.
macrophytes, phytobenthos or phytoplankton) to nutrient enrichment may vary, depending on the water
category, surface water body type, the quality, amount and transport of nutrient loading as well as the
specific environmental conditions such as flow conditions, salinity or turbidity. Furthermore, the most
sensitive quality element or parameter to changes in eutrophication status, be it either in a deterioration or a
recovery situation, will depend on the state of the water body's biological community's development towards
'equilibrium' with the altered pressure status.
21 http://circa.europa.eu/Public/irc/env/wfd/library?l=/framework_directive/thematic_documents/13_eutrophication&vm=detailed&sb=Title

Guidance Document on Eutrophication Assessment
Guidance Document May 2009 36
69. For instance phytoplankton, phytobenthos and macroalgae derive their nutrients from the water
column and, under the right conditions, can colonise, grow and reproduce quickly. As a consequence, they
tend to respond rapidly to changes in nutrient concentrations. However, these quality elements can also be
characteristically highly variable. This may make reliable assessments of their condition difficult.
70. Rooted macrophytes and angiosperms derive their nutrients from sediments or from a combination of
sediments and the water column. Their response to nutrient enrichment tends to be slower than that of
phytoplankton, phytobenthos and macroalgae, and therefore may enable reliable assessments to be achieved
more easily. On the other hand, this relative ‘stability’ means that assessments based solely on macrophytes
and angiosperms may in some situations fail to detect the early onset of eutrophication or the effects of
restoration measures.
4.2. Role of the normative definitions in the development of ecological assessment methods
71. The normative definitions are the basis for identifying suitable boundary values for each of the
indicator parameters. After selecting the metric or metrics to be used to assess the condition of the quality
element, the common interpretation of the normative definition will drive the setting of the boundaries for
each metric. Once a boundary has been set up, the monitoring results can be used to classify the condition of
the quality element.
4.3. Shared principles in the normative definitions for the different water categories
72. The type-specific conditions defined for good and for moderate ecological status in rivers, lakes,
transitional and coastal waters represent equivalent stages in the process of eutrophication in the different
water categories, even if the conditions are sometimes expressed in the Annex V normative definitions using
different wording.
4.4. Description given for abundance and taxonomic composition of aquatic flora
73. The condition of phytoplankton, phytobenthos, and macroalgae would not be consistent with good
status unless there was a negligible probability (i.e. risk) that accelerated algal growth would result in a
significant undesirable disturbance to the aquatic ecosystem (see Figure 4). The condition of macrophytes
and angiosperms would not be consistent with good status unless there was a negligible probability that
accelerated growth of higher forms of plant life would result in a significant undesirable disturbance to the
aquatic ecosystem.

Guidance Document on Eutrophication Assessment
Guidance Document May 2009 37
GOODGOOD
MODERATEMODERATE
POORPOOR
Biomass resulting from accelerated plant growth
Nutrient enrichment
Probability of significant
undesirable disturbances being present as a result of increased plant
biomass
0 %
100 %
Status classes with which
conditions are consistent
Moderately increased compared to reference
conditions
Slightly increased compared to
reference conditions
Major increase compared to
reference conditions
Severity and extent of
undesirable disturbance
Severe disturbances likely
Very minor
Figure 4. The condition of the water body would not be consistent with good status, once phytoplankton biomass, macroalgal cover, average phytobenthic abundance, average macrophytic abundance or angiosperm abundance has reached levels at which the probability of a significant undesirable disturbance to the aquatic ecosystem is no longer negligible.
74. A significant undesirable disturbance is a direct or indirect anthropogenic impact on an aquatic
ecosystem that appreciably degrades the health or threatens the sustainable human use of that ecosystem (see
Table 8). For a water body to be at good status there must be a negligible probability of such disturbances
being present as a result of human activity.
75. Nutrients can sometimes cause changes in the taxonomic composition of plants or algae, without
causing the biomass to increase to a level where it shows secondary impacts on flora, fauna or water quality
in general. These rather subtle effects of eutrophication may occur in oligotrophic lakes in particular (see
Figure 5).
76. The condition of phytoplankton, phytobenthos, macrophytes, macroalgae or angiosperms would not be
consistent with good ecological status where, as a result of anthropogenic nutrient enrichment, changes in the
balance of taxa are likely to adversely affect the functioning or structure of the ecosystem (see Table 9). For
a water body to be at good status there must be a negligible probability of such disturbances to the balance of
organisms being present.

Guidance Document on Eutrophication Assessment
Guidance Document May 2009 38
Table 8. Significant undesirable disturbances that may result from accelerated growth of phytoplankton, macroalgae, phytobenthos, macrophytes or angiosperms (Source: ECOSTAT Paper on classification related to eutrophication22)23
a. Causes the condition of other elements of aquatic flora in the ecosystem to be moderate or worse
(e.g. as a result of decreased light availability due to increased turbidity and shading caused by
increased phytoplankton growth)
b. Causes the condition of benthic invertebrate fauna to be moderate or worse (e.g. as a result of
increased sedimentation of organic matter; oxygen deficiency; release of hydrogen sulphide;
changes in habitat availability)
c. Causes the condition of fish fauna to be moderate or worse (e.g. as a result of oxygen deficiency;
release of hydrogen sulphide; changes in habitat availability)
d. Compromises the achievement of the objectives of a Protected Area for economically significant
species (e.g. as a result of accumulation of toxins in shellfish)
e. Compromises the achievement of objectives for a Natura 2000 Protected Area
f. Compromises the achievement of objectives for a Drinking Water Protected Area (e.g. as a result
of disturbances to the quality of water)
g. Compromises the achievement of objectives for other protected areas, e.g. bathing water.
h. Causes a change that is harmful to human health (e.g. shellfish poisoning; toxins from algal
blooms in water bodies used for recreation or drinking water)
i. Causes a significant impairment of, or interference with, amenities and other legitimate uses of the
environment (e.g. impairment of fisheries)
j. Causes significant damage to material property
77. It is relevant here to introduce the interpretation of the European Court of Justice of the concept of
"undesirable disturbances of the balance of organisms present". A recent Court ruling states that this concept
means species changes involving loss of ecosystem biodiversity, nuisances due to proliferation of
opportunistic macroalgae and severe outbreaks of toxic and harmful phytoplankton (see Annex 1, section
1.2.4).
22 http://circa.europa.eu/Public/irc/env/wfd/library?l=/framework_directive/thematic_documents/13_eutrophication&vm=detailed&sb=Title
23 See also §§18 and 22 of the ECJ judgement for the case C-280/02.
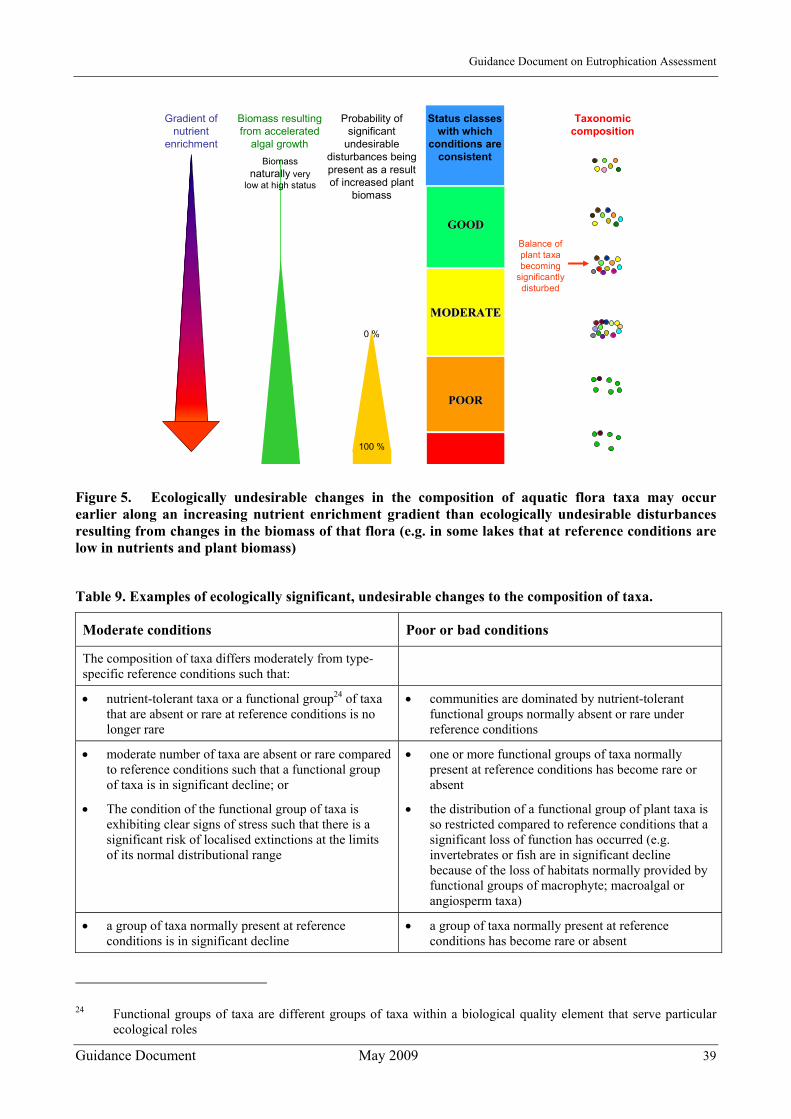
Guidance Document on Eutrophication Assessment
Guidance Document May 2009 39
GOODGOOD
MODERATEMODERATE
POORPOOR
Gradient of nutrient
enrichment
Status classes with which
conditions are consistent
Probability of significant
undesirable disturbances being present as a result of increased plant
biomass
0 %
100 %
Biomass resulting from accelerated
algal growth Biomass
naturally very low at high status
Taxonomic composition
Balance of plant taxa becoming
significantly disturbed
Figure 5. Ecologically undesirable changes in the composition of aquatic flora taxa may occur earlier along an increasing nutrient enrichment gradient than ecologically undesirable disturbances resulting from changes in the biomass of that flora (e.g. in some lakes that at reference conditions are low in nutrients and plant biomass)
Table 9. Examples of ecologically significant, undesirable changes to the composition of taxa.
Moderate conditions Poor or bad conditions
The composition of taxa differs moderately from type-specific reference conditions such that:
• nutrient-tolerant taxa or a functional group24 of taxa that are absent or rare at reference conditions is no longer rare
• communities are dominated by nutrient-tolerant functional groups normally absent or rare under reference conditions
• moderate number of taxa are absent or rare compared to reference conditions such that a functional group of taxa is in significant decline; or
• The condition of the functional group of taxa is exhibiting clear signs of stress such that there is a significant risk of localised extinctions at the limits of its normal distributional range
• one or more functional groups of taxa normally present at reference conditions has become rare or absent
• the distribution of a functional group of plant taxa is so restricted compared to reference conditions that a significant loss of function has occurred (e.g. invertebrates or fish are in significant decline because of the loss of habitats normally provided by functional groups of macrophyte; macroalgal or angiosperm taxa)
• a group of taxa normally present at reference conditions is in significant decline
• a group of taxa normally present at reference conditions has become rare or absent
24 Functional groups of taxa are different groups of taxa within a biological quality element that serve particular ecological roles
Guidance Document on Eutrophication Assessment
Guidance Document May 2009 40
4.5. The role of general physico-chemical quality elements
78. The relative significance of the two most critical eutrophying nutrients, nitrogen and phosphorus, will
vary in different surface water categories and types of surface waters. In transitional and coastal waters
anthropogenic nitrogen enrichment is generally the most important cause of eutrophication, although there
are cases where both nutrients may be limiting, but during different seasons. In freshwaters, generally
phosphorus enrichment is the main cause of eutrophication.
79. If the monitoring results for (a) the biological quality element or elements most sensitive to nutrient
enrichment and (b) the nutrient or nutrients being discharged in significant quantities meet the relevant type-
specific conditions required for good ecological status, the level of nutrient enrichment in the water body will
be consistent with good ecological status.
80. However, if either (a) one of the most sensitive biological quality elements to nutrient enrichment; or
(b) one of the nutrients being discharged in significant quantities do not meet the conditions required for
good ecological status, the ecological status of the water body will be moderate or worse.
81. Further guidance on classification and, in particular, on the role of general physico-chemical quality
elements is provided in CIS Guidance on the Classification of Ecological Status. The guidance describes a
checking procedure aimed at helping to ensure that the good status type-specific levels for nutrient
concentrations are neither more stringent nor less stringent than required to support the achievement of good
status for the type-specific conditions for the biological quality elements and the functioning of the
ecosystem (see also Chapter 6.2 and Annex 1, section 1.1.6).
5. OVERVIEW OF CURRENT EUTROPHICATION ASSESSMENT METHODOLOGIES AND CRITERIA IN EUROPEAN COUNTRIES
5.1. Introduction
82. Eutrophication assessment methodologies and criteria for classification of water quality status have
been used by Member States in particular in the implementation of the Urban Waste Water Treatment and
Nitrates Directives, and in relation to the commitments taken within the marine conventions OSPAR and
HELCOM. Member States have completed the WFD Article 5 risk assessments for which existing
eutrophication assessment criteria were used or newly derived criteria to determine whether surface water
bodies are at risk of failing their environmental objectives in 2015 from eutrophication related pressures.
Since then, new eutrophication-related assessment methodologies and criteria, or some degree of
modification of already existing methods, were developed in the Member States in relation to the
implementation of the requirements of the WFD for the classification of ecological status in lakes, rivers,
coastal and to a lesser extent in transitional waters. These requirements included the choice of the appropriate
indicators, typology of water bodies, reference conditions, and agreement on common principles for setting
Guidance Document on Eutrophication Assessment
Guidance Document May 2009 41
quality class boundaries (see Heiskanen et al., 2004). In addition, some of the methods developed were
subjected to an intercalibration process during the years 2004 to 2007. This process, to a large extent focused
on methods sensitive to eutrophication, has established the value for the boundary between the quality
classes of high and good status, and the value for the boundary between good and moderate status for the
Member State’s biological classification systems ensuring their consistency with the normative definitions
(WFD annex V, section 1.2) and the comparability between Member States.
83. The results of the intercalibration exercise were adopted in Commission Decision 2008/915/EC on 30
October 200825. Technical reports on the Water Framework Directive intercalibration exercise (Carletti and
Heiskanen, in press; Poikane, in press; Van de Bund, in press), one for each water category (i.e. lakes, rivers
and coastal and transitional waters), describe in detail how the intercalibration exercise has been carried out
in each Geographical Intercalibration Group (GIG), including the procedures and criteria that were agreed
for setting reference conditions, to ensure consistency with the normative definitions, and to ensure
comparability of class boundaries between Member States.
84. In several cases, the results of European collaborative research projects were used in the development
of new indicators and/or classification schemes (e.g. Charm, AQEM, STAR, REBECCA, FAME; see
Heiskanen et al., 2005; Hering et al., 2006; Solimini et al., 2006; Pont et al., 2006). In this sense, one of most
supportive projects was REBECCA (2003-2007) which has contributed to development of methodologies
and criteria with a timetable for the project deliverables synchronised to some extent with the timetable for
the intercalibration process.
85. This overview of current eutrophication assessment methodologies and criteria gathers information
provided by Member States during the development of this guidance document and new methodologies and
criteria from the intercalibration exercise and REBECCA project.
86. Sections 5.2 to 5.4 summarise the information available from these sources for lakes, rivers,
transitional, coastal and marine waters, respectively.
5.2. Lakes
5.2.1. Assessment methodologies and criteria used for water quality status classification
87. Many Member States had water quality assessment systems prior to the adoption of the WFD which
already included assessment methods and criteria for eutrophication related parameters. Information collated
in previous syntheses (i.e. Cardoso et al., 2001) and as part of this activity26 indicates that the assessment of
the degree of eutrophication in lakes has been, until the adoption of the WFD, primarily determined through
25 http://eur-lex.europa.eu/LexUriServ/LexUriServ.do?uri=CELEX:32008D0915:EN:NOT 26 see Eutrophication Workshop held in Brussels on the 7-9 September 2005

Guidance Document on Eutrophication Assessment
Guidance Document May 2009 42
the application of nutrient (phosphorus and nitrogen) concentration criteria supplemented with the use of
criteria for indicators of eutrophication direct effects. The most commonly included were the criteria for
chlorophyll a and Secchi depth but occasionally other indicators, such as changes to phytoplankton
composition were also used. A number of other parameters (indicators) were used in some Member States,
although indicators of indirect eutrophication effects (dissolved oxygen concentrations and responses in
benthic invertebrate and fish communities) were not generally used.
88. Some of these water quality assessment schemes recognised the existence of different lake types in
broad terms but many schemes were applied indiscriminately to all lakes in a Member State. However, for
management purposes the assessment was done in relation to a rough estimation of the lake’s natural trophic
status. Thus, with few exceptions these assessment systems are not type-specific in terms of WFD typology
and do not relate to reference conditions.
89. Information of the assessment systems for which information has been shared at the Eutrophication
Workshop (Brussels, 2005) for Norway, Sweden, Finland, Austria, Italy and Hungary showed that the most
commonly used assessment parameters, i.e. chlorophyll a, total phosphorus (TP) and Secchi depth, of most
of these countries’ systems (with exception of the Hungarian) showed relatively good agreement in the
criteria for the best quality classes. For chlorophyll a (summer mean values) the best quality class varies
from < 2 µgl -1 in Norway and Sweden to < 4 µgl -1 in Finland and Austria. For total phosphorus (summer
mean values) the best quality class varied from < 7 µgl -1 in Norway to < 13 µgl -1 in several other countries.
For Secchi depth the best quality class varies from > 6 m to > 3 m between countries. For all these three
basic eutrophication assessment parameters, the between country variation for the best class is roughly a
factor of 2. For the other classes the differences between countries are larger, probably due to both different
class definitions, as well as to real regional differences.
90. The Hungarian system has considerably higher boundary criteria between the quality classes for total
phosphorus and chlorophyll a, which is probably mainly explained by different lake types in Hungary (very
shallow, calcareous) compared to the Northern and Alpine countries (deeper, more siliceous geology). The
Hungarian class I includes values comparable to class III (moderate) of the other countries compiled,
whereas the Hungarian class II compares to class IV or V (poor or bad) in the other countries.
91. For the indirect effect criterion oxygen saturation, the two systems compiled (Hungary and Finland)
show relatively good agreement, with class I having 80-110 % O2 saturation, whereas class V has < 20 % or
< 40 % O2 saturation for the Hungarian and Finnish systems respectively.
92. The two countries, Sweden and Austria that have developed classification systems for phytoplankton
biomass (mgl -1) show remarkably good agreement: Class 2 is <1 mgl -1 and class 5 is > 5 mgl -1.
93. For other assessment criteria the data provided is not sufficient to enable comparisons between
countries.
Guidance Document on Eutrophication Assessment
Guidance Document May 2009 43
94. For additional information on national criteria for eutrophication assessment in the context of the
UWWT and Nitrates Directives see Cardoso et al. (2001).
5.2.2. Impact and pressure criteria used in WFD Article 5 risk assessment
95. In completing the WFD Article 5 risk assessments for eutrophication related pressures, some Member
States have derived pressure and impact criteria to determine whether a lake water body was at risk of not
achieving its environmental objective in 2015. Where used, the pressure criteria have been based on the
presence of point sources of nutrients and/or a proportion of a particular land use (most commonly
agricultural and urban land uses) in the catchment of the lake. One country (Spain) assesses a water body to
be probably at risk if the application of fertilizer is > 25 kg N ha-1 year or if major point sources are present,
such as urban waste water > 2000 PE, unless no impact is documented.
96. For the most part, the impacts were measured based on nutrient concentrations (phosphorus and
nitrogen) with occasional examples of the use of direct effects (chlorophyll a) to supplement them. For the
latter the existing classification systems are used in a way in which lakes in the high or good classes are
assessed as being not at risk, whereas lakes in the poor or bad classes are assessed as being at risk of failing
the WFD objective. One Member State (UK) use the EQR< 0.5 for current phosphorus concentrations
relative to type or site-specific background concentrations to assess water bodies at risk, whereas other (NL)
use, among others, the existing management target value to assess water bodies at risk. The actual cut-off for
TP between at risk and not at risk is comprised within a wide band of concentrations from < 10 µg l-1 to >
100 µg l-1 for the different countries, which is probably related to type differences. For chlorophyll a the only
two Member States who have reported cut-off values (Norway and Spain) both use 8 µg l-1 to say that a
water body is clearly at risk (Norway) or probably at risk (Spain)27. Other impact parameters are too scarcely
used to allow comparisons between countries. Many Member States also evaluate future trends in nutrient
pressures from the catchment as part of their risk assessment. Further details on the parameters used are
provided in the reports provided by the Member States under Article 5 WFD.
5.2.3. New WFD-compliant assessment systems
97. Many Members States have been engaged in the development of new, or refinement of existing,
assessment methods for the eutrophication related biological quality elements required for the assessment of
ecological status under the WFD. The work under the Intercalibration process for lakes has focussed on the
calibration and harmonisation of the national assessments based on phytoplankton and macrophyte responses
to nutrients. Intercalibration metrics (Poikane, in press) used for lakes are: phytoplankton parameters
indicative of biomass - chlorophyll a and total biovolume; phytoplankton parameters indicative of taxonomic
27http://circa.europa.eu/Public/irc/env/wfd/library?l=/framework_directive/thematic_documents/13_eutrophication&vm=detailed&sb=Title

Guidance Document on Eutrophication Assessment
Guidance Document May 2009 44
composition and abundance - Brettum Index, PTSI - Phytoplankton Taxa Lake Index, PTIot - Phytoplankton
Taxa Index, PTIspecies - Phytoplankton Taxa Index, Catalan Index, Med PTI Index, % bluegreens, %
chrysophytes, % diatoms; macrophyte composition (% isoetids, % characeans) and reduction in depth
distribution of macrophytes (Austrian Index Macrophytes for lakes, German Macrophytes Assessment
System, Free Macrophyte Index, Swedish Macrophyte Trophic Index (Ecke), Norwegian Macrophyte
Trophic Index (Mjelde), UK Macrophyte Assessment System: LEAFPACS).
98. The development of these methods and their intercalibration (included the definition and agreement on
reference conditions and collation of data illustrating the metric (=indicator) response to a pressure gradient)
also supported the development of criteria for the eutrophication related supporting physico-chemical
elements such as Secchi depth and nutrients, primarily total phosphorus concentrations.
99. The intercalibration process partially included methods sensitive to the indirect effects of
eutrophication, such as oxygen depletion in bottom waters and fish kills. In several GIGs secondary effects
were used for setting chlorophyll a boundaries, such as oxygen depletion and fish kills.
100. The REBECCA project Work Package 3 (WP3 Lakes) has supported the intercalibration process by
establishing the relationships between nutrient concentrations or an indicator of the trophic condition (e.g.
trophic score) and response variables (= effects indicators, metrics) relating to phytoplankton, macrophytes,
macroinvertebrates and fish (see report on dose-response relationships between biological and chemical
elements in different lake types; Lyche-Solheim, 2007). These results have already, because of the close
collaboration between the REBECCA project and the intercalibration expert groups, where appropriated,
been considered in the intercalibration process. Further details of the REBECCA results can be found in a
review of the literature on these relationships in European lakes based on the knowledge until 2005 (Solimini
et al. 2006), as well as a report on Reference conditions of European Lakes (Lyche-Solheim et al. 2005).
101. The work carried out in recent years within Member States and at the EU level, in research projects
and as part of the intercalibration process, has provided scientifically based and intercalibrated assessment
systems and further understanding of the relationships between biological and supporting physico-chemical
elements of lakes. The results of the intercalibration process, the Ecological Quality Ratios for the high/good
and good/moderate class boundaries (for phytoplankton also the absolute metric values, i.e. chlorophyll a
concentration and biovolume), per Geographic Intercalibration Group (GIG) and lake type, for the
phytoplankton and macrophyte metrics listed above, have now been agreed and included in Annex to the
Commission Decision (Commission Decision 2008/915/EC). The Member States will now need to translate
the values published in the Decision into their national systems with the help of guidelines prepared for this
purpose and available online at:
http://circa.europa.eu/Members/irc/jrc/jrc_eewai/library?l=/intercalibration&vm=compact&sb=Title.
Guidance Document on Eutrophication Assessment
Guidance Document May 2009 45
102. The application of these assessment systems as part of the WFD implementation, including the
collation and analysis of data from WFD monitoring and from research projects, may lead to a review of the
intercalibration results and thus also to changes to the national assessment systems.
103. Another important issue that may lead to a need for revision of the intercalibration results is related to
lack of standardisation of methods for collection of the data used in this first round of the process. Thus, with
maybe the exception of the Northern GIG, where there was already some degree of harmonisation of the
methods, the noise in the data associated to the method is probably an important component of all variance in
the data.
104. Through the intercalibration, all GIGs have now agreed on the good/moderate quality class boundary
for the metrics list above (see paragraph 87), and all but the Mediterranean GIG have agreed on the
high/good quality class boundary for chlorophyll a for a small number of broadly defined lake types, which
are applicable in all the countries sharing the type.
105. The national lake phytoplankton metrics can be roughly divided into taxonomic based and non-
taxonomic based metrics. The use of phytoplankton taxonomic metrics for water quality assessment has a
long tradition, with the first indicators developed in the 40’s and since then numerous indicators were
developed, some of which have been included in the WFD assessment schemes. Yet, a number of new
indicators were developed tailored to address the WFD requirements. Three new phytoplankton trophic
indices (PTI-s) where elaborated for deep subalpine lakes (Salmaso et al., 2006). Another development is the
method adopted in the WFD monitoring scheme in Hungary based on functional groups, i.e. groups with
species frequently found to co-exist and to increase or decrease in number simultaneously are thus given
association identities. The method was first developed by Reynolds et al. (2002) and further developed
Padisák et al. (2003, 2006).
106. Phytoplankton abundance and occurrence of blooms are the parameters for which a taxonomic
determination is not necessarily required. The abundance is measured as the total count of cells and/or
colonies in a unit volume of water or recalculated further into biovolume or biomass. The WFD allows using
chlorophyll a as a surrogate for phytoplankton biomass, and in fact chlorophyll a is still the most frequently
measured phytoplankton metric in lakes. Not all countries have included the bloom occurrence in routine
monitoring as in some areas (e.g. countries belonging to the Alpine GIG) they occur too rarely and
irregularly (if at all). Other non-taxonomy based metrics, like size composition and primary production, are
not considered in lake monitoring schemes.
107. Classification schemes for macrophytes were developed by many Member States. One approach being
followed in Germany (Schaumburg et al., 2004) and England (Willby et al., 2006) is to designate
macrophytes as reference, impacted, or indifferent for specific lake types. The classification of a lake is then
based on the proportions of macrophytes that are indicative of reference and impacted conditions. The
method used in Northern Belgium also incorporates aspects of this approach together with metrics describing

Guidance Document on Eutrophication Assessment
Guidance Document May 2009 46
the diversity of growth forms and changes in abundance (Leyssen et al., 2005). The Dutch method
incorporates information on the percentage cover of submerged macrophytes (for a depth range of 0-3 m),
shoreline emergent vegetation cover and species composition (divided into three indicative groups weighted
by their abundance) (Van der Molen, 2004; Coops et al., 2007). In Sweden assessment is based on taxa
richness and the assignment of a trophic ranking score for different lake types (Swedish EPA, 2007). In
Ireland a multimetric approach is followed incorporating several of the aforementioned parameters as well as
the depth of colonization of macrophytes (Free et al., 2007).
108. Although there appears to be some concordance of assessment approaches across Europe, the methods
used to collect such data are diverse and may in some cases not be fully representative of the pressure impact
(e.g. strong biased towards sampling the shallower areas and not the full representative of macrophyte depth
distribution). Future work needed includes the gathering of an extensive standardized dataset matched with
important environmental parameters, including sediment characteristics, and to further understand the role of
macrophytes in lake ecosystem functioning.
109. Several GIGs have attempted to relate environmental factors like TP and Secchi depth with
chlorophyll a. Such relationships may be used for setting criteria of quality classes for those environmental
factors which is of fundamental importance in lake management. The main approaches followed, with the
support of data and their analysis from the REBECCA project (Table 10), were either based on a percentile
of the reference lakes data set (mostly the 75 %ile for reference sites) or based on regressions between
chlorophyll a and TP compiled for a large number of lakes, or based on both methods. The use of this type of
relationships can be, however, limited. For shallow lakes discontinuous relationships may be present e.g.
between TP and chlorophyll a, and therefore linear regression is not very appropriate. In addition, the TP is
providing generally the best prediction for the maximum chlorophyll a values, because there can be many
biological reasons why not all TP is transferred into phytoplankton biomass.
Table 10. Regression equations for relationships between mean growing season chlorophyll a and TP for lakes categorised by grouped typology factors (Phillips et al, 2008).
Type group Equation R2 p
Low and moderate alkalinity shallow and very shallow lakes
Log10 Chl = -0.528(±0.03) + 1.108(±0.02)Log10 TP
0.81
<0.001
High alkalinity shallow and very shallow lakes
Log10 Chl = -0.306(±0.10) + 0.868(±0.07) Log10 TP
0.52
<0.001
All deep lakes Log10 Chl = -0.286(±0.04) + 0.776(±0.041) Log TP
0.65
<0.001
Guidance Document on Eutrophication Assessment
Guidance Document May 2009 47
5.3. Rivers
5.3.1. Assessment methodologies and criteria used for water quality status classification
110. As for lakes, in most cases Member States water quality assessment systems for rivers, prior to the
adoption of the WFD, included assessment methods and criteria for eutrophication related parameters.
Information collated in previous syntheses (i.e. Cardoso et al., 2001) and as part of this activity (see
Eutrophication Workshop, Brussels 2005) indicates that the assessment of the degree of eutrophication in
rivers to date has been primarily determined through the application of nutrient (phosphorus and nitrogen)
concentration criteria with the occasional supplementary use of metrics indicative of direct effects
(chlorophyll a and changes to phytobenthos and macrophyte communities) and metrics indicative of indirect
effects (e.g. dissolved oxygen concentration and changes to benthic invertebrate communities) criteria. The
most commonly used parameter for rivers is TP concentration and the criteria for excellent water quality are
broadly comparable (0.01 to 0.07 mgl-1 TP; though these include summer mean, annual mean and 90 and 75
%ile values). Criteria for orthophosphate are used in one Member State. Criteria for total nitrogen (TN) and
nitrate are used in 2 Member States and also show good agreement. In all cases existing classification
schemes are river type-specific but were applied to all types of river.
111. For additional information on national criteria for eutrophication assessment in the context of the
UWWT and Nitrates Directives see Cardoso et al. (2001). The most commonly used criterion for designation
of nitrate vulnerable zones is the 50 mgl-1 NO3 value. However, for UWWT sensitive area designation,
phosphorus criteria are used along with further information from metrics indicative of direct effects
(chlorophyll a concentration and phytobenthos and macrophytes community metrics) and from metrics
indicative of indirect effect (changes to the dissolved oxygen regime) in a weight of evidence approach to
determine the case for designation.
5.3.2. Impact and pressure criteria used in WFD Article 5 risk assessment
112. In completing the WFD Article 5 risk assessments for eutrophication related pressures, some Member
States have derived pressure and impact criteria to determine whether a river water body was at risk of not
achieving its environmental objective in 2015. Where used, the pressure criteria have been based on the
presence of point sources of nutrients and/or a proportion of a particular land use (most commonly
agriculture, forestry and untreated wastewater from settlements) in the upstream catchment of the river water
body. For the most part, the impact criteria were based on nutrient concentrations (phosphorus and nitrogen).
The most commonly used impact criteria were TP and orthophosphate. Values for the estimated
good/moderate class boundary used in the Article 5 risk assessments were comparable for similar river types
(i.e. lowland rivers) (0.15 mgl-1 TP and 0.1mgl-1 orthophosphate-P). Criteria for TN and for nitrate were used
in some Member States supplemented with criteria for metrics indicative of indirect effects (dissolved
Guidance Document on Eutrophication Assessment
Guidance Document May 2009 48
oxygen concentrations, benthic invertebrate and phytobenthos metrics). Further details on the criteria used
are provided in the reports provided by the Member States under Article 5 WFD.
5.3.3. New WFD-compliant assessment systems
113. Many Member States have been engaged in the development of new, or refinement of existing,
assessment methods for the eutrophication related biological quality elements required for the assessment of
ecological status under the WFD. For rivers, the eutrophication related biological quality elements are
principally phytobenthos, macrophytes and, where appropriate, phytoplankton and macrozoobenthos. The
development of assessment methods for these elements will necessarily result in the definition of type-
specific reference conditions and class boundary criteria for the classification of ecological status with
respect to these biological quality elements. Also, the development of assessment methods for these
biological quality elements and their intercalibration (as explained above this process included the definition
and agreement on reference conditions and collation of data illustrating the metric response to a pressure
gradient) have resulted, in some cases, in the development of criteria for the eutrophication related
supporting physico-chemical determinands such as nutrients and dissolved oxygen concentrations.
Information collated under this activity on the development of new methods (compare overview of nutrient
standards)28 indicates that preliminary criteria for nutrients (TP, orthophosphate, TN and nitrate) have been
proposed for reference conditions and the good/moderate boundary in a number of Member States.
Additional criteria for chlorophyll a and dissolved oxygen have also been suggested.
114. The REBECCA project Work Package 4 (WP4 Rivers) has supported the intercalibration process by
exploring new tools for assessing eutrophication through the response of phytobenthos metrics to nutrients,
i.e. diatom based techniques, making use of diatoms morphological-functional attributes and biotypes, but
also revaluating existing indexes in a WFD perspective (see report on suitable single and integrated
biological indicators for different pressures in rivers; Friberg, 2007). Further details of the REBECCA WP4
results can be found in a review of the literature on these relationships in European rivers based on the
knowledge until 2004 (Andersen et al. 2004), as well as a report on relations linking pressures, chemistry
and biology in rivers and tools for assessing these linkages (Friberg, 2007).These results have already,
because of a close collaboration between REBECCA researchers and the intercalibration expert groups,
where appropriated, been considered in the intercalibration process.
115. The work under the Intercalibration process has for rivers focussed on benthic invertebrates as
indicators of organic contamination or general degradation. However, four of the five river GIGs, the Alpine,
Central/Baltic, Mediterranean and Northern GIG have successfully intercalibrated phytobenthos metrics
which are primarily eutrophication indicators, thus have also provided criteria for eutrophication related
28http://circa.europa.eu/Public/irc/env/wfd/library?l=/framework_directive/thematic_documents/13_eutrophication&vm=detailed&sb=Title
Guidance Document on Eutrophication Assessment
Guidance Document May 2009 49
supporting physico-chemical elements. The results of the intercalibration process, the Ecological Quality
Ratios for the high/good and good/moderate quality class boundaries, and for the phytobenthos national
classification systems, per GIG and river type have now been agreed and included in Annex to the
Commission Decision (Commission Decision 2008/915/EC). The Member States will now have to translate
the values published in the Decision into their national systems with the help of guidelines prepared for the
purpose.
116. The application of these assessment systems to data to be collected as part of the WFD monitoring
requirements, the analysis of this data and other data collected through research projects may eventually lead
to a review of the intercalibration results in order to improve their quality. Unlike the problems found with
phytoplankton metrics in lakes related to the noise (i.e. highly variable due to different national sampling
procedures) in the data available, the existence and common use of standard methods for sampling of
phytobenthos was responsible for the good quality of the data available which greatly facilitated the
intercalibration exercise.
117. All but the Eastern Continental GIG have agreed on the high/good and good/moderate quality class
boundary for phytobenthos national assessment metrics for a small number of broad river types.
The biological monitoring of water quality in rivers has a long tradition in Europe (see Ziglio et al., 2006 for
a recent review). However, the fulfilment of the WFD's requirements imposed a revision of many old
assessment methods which were either adapted to meet WFD specifications or resulted in the setup of new
classification systems.
118. Annex V of the WFD refers to ‘macrophytes and phytobenthos’ as a single biological element and
identifies four characteristics (taxonomic composition, abundance, likelihood of undesirable disturbances
and presence of bacterial tufts) that need to be considered for the purpose of ecological status assessment.
Most countries decided to develop separate methods for macrophytes and phytobenthos. Some MS included
larger algae such as Cladophora in their macrophyte methods while others included the latter as part of the
phytobenthos. However, most of the countries decided to use diatoms as a representative group for the whole
phytobenthos.
119. The term “phytobenthos” refers to a highly diverse group of organisms (diatoms, filamentous algae,
blue-green, etc.) with heterogeneous growth forms on many different river substrates. For the assessment of
ecological status, diatoms are the most frequently used indicators included in monitoring programs. Almost
all metrics rely on the taxonomic composition of the assemblages, often relating the metric value to the
pressure gradient with weighted averaging like in the Trophic Diatom Index (TDI; Kelly, 2001) or in the
Indice de Polluosensibilité (IPS; Coste in Cemagref, 1981). For example, the TDI relies on the fact that (in
theory) at least the diatom assemblages characteristic of low, moderate and high phosphorus concentrations
can be defined (Kelly, 2001). In practice, there are many other factors that can also influence the
composition of the diatom assemblage, making assessment difficult. The phytobenthos abundance is also

Guidance Document on Eutrophication Assessment
Guidance Document May 2009 50
highly temporally and spatially variable and its assessment, also in relative terms, is problematic. Few
Member States have developed new methods based on the relative abundance of positive and negative
indicator species.
120. Phytoplankton is an important component of riverine food webs in large rivers (Prygiel and Haury,
2006). The short generation time makes this group of organisms highly reactive to changes in flow
conditions, light and nutrients. However, phytoplanktonic biomass is strongly linked to the water residence
time and significant amount of biomass may be reached only in low gradient tracts of large rivers and canals
when the residence time is long enough for algal development (e.g. more than 6 days). Routine monitoring
using phytoplankton is foreseen by those countries where such river types are present in a relevant number
but may be often limited to the measure of chlorophyll a as an indicator of phytoplanktonic biomass.
5.4. Transitional waters
5.4.1. Assessment methodologies and criteria used for water quality status classification
121. Eutrophication is a recognised threat to the ecological status of transitional water bodies as these
accumulate nutrients transported from river systems, from direct inputs from their surrounding catchments
and, in some cases, from coastal waters. The expression of the direct and indirect effects of eutrophication in
response to increasing nutrient inputs is more complicated in many transitional water types due to the
confounding influences of other natural and anthropogenically induced processes. Transitional waters can
support a high degree of anthropogenic activity. Zaldívar et al. (2008) identified this phenomenon and
termed it the ‘transitional water quality paradox’, based on the ‘estuarine water quality paradox’ suggested
by Elliott and Quintino (2007 in Zaldívar et al. 2008) for estuaries, to describe the difficulties in identifying a
pressure-specific signal (such as eutrophication) against a highly variable natural background compounded
by the competing effects of the impacts arising from other pressures.
122. Nevertheless, approaches to eutrophication assessment have been developed for transitional water
bodies. Zaldívar et al. (2008) reviewed these approaches and categorised them into screening methods,
model-based assessments and mixed approaches.
123. Screening methods typically include the consideration of a number of diagnostic physico-chemical and
biological determinands to assign an eutrophication status class. Methods specific to transitional water body
types include those for estuaries, fjords and coastal lagoons. The OSPAR Common Procedure (see Section
2.1.2) is the screening type method most commonly used for transitional waters within the OSPAR
Convention area. The NOAA ASSETS (Assessment of Estuarine Trophic Status) method (see Zaldívar et al.
2008) has been modified for use in Portugal. This method combines measures of pressure (an estimate of net
nutrient load to the water body), state (an assessment of eutrophication status based on indicators of direct
and indirect effects) and response (an assessment of the susceptibility of the estuary to eutrophication) into
an integrated assessment of trophic status. The measure of state comprises metrics for physico-chemical
Guidance Document on Eutrophication Assessment
Guidance Document May 2009 51
(dissolved oxygen) and direct biological response determinands. Methods appropriate for coastal lagoons are
less well developed. The Trophic Index (TRIX) (Vollenweider et al. 1998 in Zaldívar et al. 2008) integrates
measures of chlorophyll a, oxygen saturation, total nitrogen and total phosphorus to provide a value
indicative of trophic status. Zaldívar et al. (2008) indicate that this method is commonly used for coastal
lagoons but is poorly suited to shallow water systems where phytoplankton are not the only component of the
primary producer community responding to increasing nutrient concentrations. The importance of
sedimentary processes in shallow water systems is important with respect both to the mobilisation of nutrient
deposits and the detection of secondary effects of eutrophication. Two indices that exploit sedimentary
responses to oxygen production and respiration include the Benthic Trophic Status Index (BSTI) (Rizzo et al.
1996 in Zaldívar et al. 2008) and the Trophic Oxygen Status Index (TOSI) (Viaroli and Christian 2003 in
Zaldívar et al. 2008). Coastal lagoons dominated by macroalgae as a response to eutrophication demonstrate
different responses to those unimpacted lagoons dominated by seagrasses on the basis of these indices. Both
sediment and water quality variables have been integrated into the lagoon water quality index (LWQI)
(Giordani et al. 2008 in Zaldívar et al. 2008). This index includes metrics for macroalgal and seagrass cover
along with water column metrics for nutrients (DIP, DIN), oxygen saturation and phytoplankton chlorophyll
a.
124. Model-based assessments identified by Zaldívar et al. (2008) tended to be restricted to site-specific
applications that sought to link inputs of nutrients with hydrodynamic and biogeochemical models to provide
predictions of nutrient regimes for transitional water bodies from which the likelihood of eutrophication
effects could be estimated.
125. Mixed or hybrid approaches that combine the use of screening methods with simplified model-based
approaches have the potential to deliver the advantages of a wider degree of applicability and predictive
power (Zaldívar et al. 2008). Two examples of this include the use of the ASSETS tool with an ecological
model in water body definition in estuaries (Ferreira et al., 2008 in Zaldívar et al. 2008) and the combination
of the LWQI with a biogeochemical model and interfaced with a Decision Support System (Mocenni et al.
2008 in Zaldívar et al. 2008).
5.4.2. Impact and pressure criteria used in WFD Article 5 risk assessment
126. The available information for Article 5 related criteria indicates that whenever pressure criteria were
reported these were based mainly on the presence of surface point sources (sewage) of nutrients loads and
surface water run-off. The impact criteria were based mainly on nutrient concentrations and chlorophyll a
(direct effect) and occasionally on dissolved oxygen, macrovegetation, etc (indirect effects).
Guidance Document on Eutrophication Assessment
Guidance Document May 2009 52
5.4.3. Examples of development of new WFD-compliant assessment systems
127. The implementation of the Water Framework Directive has stimulated the development of assessment
methodologies addressing the appropriate eutrophication-related, direct and indirect physico-chemical and
biological determinands.
128. A workshop on Classification of Ecological Status29 held under the auspices of ECOSTAT included a
questionnaire on the quality elements most likely to be used in the classification of status for the common
pressures. For transitional and coastal waters, Member States indicated the phytoplankton, macroalgae and
angiosperm biological quality elements were most likely to be used for the assessment of ecological status in
relation to nutrient pressure and that macroinvertebrates and fish (in transitional waters only) were most
likely to be used in relation to oxygen depletion.
129. Zaldívar et al. 2008 reviewed the methodologies under development for the purposes of WFD status
assessment and intercalibration for each of the biological and supporting physico-chemical quality elements.
130. The assessment of the phytoplankton quality element requires tools to address all aspects of the
normative condition, namely: phytoplankton biomass, composition and bloom frequency. Estimation of
phytoplankton biomass is most commonly undertaken using chlorophyll a concentration as a surrogate.
Methods and class boundary values have been intercalibrated for chlorophyll a for most coastal water body
types but have yet to be developed for transitional water types. Similarly, some work has been undertaken to
develop tools for phytoplankton composition and bloom (Phaeocystis) frequency for coastal water body
types but these have yet to be intercalibrated. These tools are likely to be adapted for use in some transitional
water types in the second phase of intercalibration due for completion in 2011.
131. The assessment of the macroalgae quality elements requires consideration of the composition of
macroalgal communities and the extent of macroalgal cover.
132. A proposed classification tool for macroalgal cover has been developed by Scanlan et al. (2007 in
Zaldívar et al. 2008) based on the relationship between percentage cover and biomass of opportunistic
species of macroalgae such as Ulva and Entermorpha.
133. The angiosperm quality element comprises a requirement for the assessment of taxonomic
composition and abundance. A classification tool called the Ecological Evaluation Index (EEI) based on the
abundance of macroalgae and angiosperms has been proposed by Orfanidis et al. (2001, 2003 in Zaldívar et
al. 2008). This utilises the known shift in community status from one dominated by angiosperms to one
dominated by macroalgae in response to increasing nutrients as a measure of ecological quality.
134. The benthic macroinvertebrate quality element can be useful in the assessment of the indirect effects
of eutrophication. The normative definition requires the assessment of the diversity and abundance of benthic
29 Report on Workshop Setting Nutrient Standards (2007).
Guidance Document on Eutrophication Assessment
Guidance Document May 2009 53
invertebrates and the presence of disturbance sensitive taxa. Zaldívar et al. (2008) identify three indices that
are under consideration for use in the assessment of transitional water benthic invertebrate status.
135. The AMBI index (Borja et al. 2000 in Zaldívar et al. 2008) utilises the known response of benthic
invertebrates inhabiting soft sediments to pollution gradients and the classification of polluted conditions has
been adapted to reflect the status classification of the Water Framework Directive. The BENTIX index
(Simboura and Zenetos 2002 in Zaldívar et al. 2008) has been developed specifically to meet the
requirements of the Water Framework Directive in the Eastern Mediterranean. The approach is similar to
that used for the AMBI index. These tools have been developed for use in coastal water body types but have
the potential to be adapted and used in transitional water body types. The Benthic Ecosystem Quality Index
(BEQI) (Hoey et al. 2007) has been developed and applied in both coastal and transitional water body types
in the Netherlands and Belgium. This index uses the relationship between the density of the number of
species or individuals and increasing sampling area to determine impacts on soft sediment benthic
communities. The ISD index (Reizopoulou and Nicolaidou 2007 in Zaldívar et al. 2008) is a taxonomy free
approach developed specifically for use in coastal lagoons based on the distribution of individual benthic
invertebrate species among biomass classes.
136. The fish quality element can also be useful in the assessment of the indirect effects of eutrophication.
Preliminary work has been undertaken in the North-East Atlantic GIG to develop a tool for fish in
transitional waters and this is due for completion in 2011.
137. The key supporting physico-chemical determinands in relation to eutrophication assessment are those
related to nutrients and to dissolved oxygen.
138. The approach to the development and use of nutrient standards in ecological status classification was
addressed in a workshop organised by the Netherlands in 200730, in a workshop on ecological status
classification in 200831 and through the responses to a questionnaire issued to Member States by the
Eutrophication Steering Group in November 2007.
139. While the workshops did not deal specifically with the issues of setting nutrient standards in
transitional waters, it is clear that all Member States are deriving type-specific nutrient standards for use in
ecological status classification in all water categories. In setting the value of the standard, Member States are
faced with a choice of selecting values anywhere on the spectrum between close to the Good/Moderate
boundary for either most sensitive or the least sensitive water body in the type. The former more
precautionary option has an associated low confidence in the status classification with a high risk of
misclassification. However, the use of such values in practice will allow water managers to control the risk
30 Report on Workshop Setting Nutrient Standards (2007) 31http://circa.europa.eu/Public/irc/env/wfd/library?l=/framework_directive/implementation_conventio/ecological_classi
ficatio/classification_2008-05pd/_EN_1.0_&a=d
Guidance Document on Eutrophication Assessment
Guidance Document May 2009 54
of deterioration and deliver restoration of the water body. The latter less precautionary option, while
providing a status classification with higher associated confidence, is less useful in the control of the risk of
deterioration. Exceedances of nutrient standards will not in themselves determine the ecological status of the
water body. The role of the supporting physico-chemical determinands and the approach to combining these
results with those from the biological quality elements is addressed in the checking procedure detailed in the
CIS Guidance on classification.
140. Based on the responses to the questionnaire on nutrient standards, Member States are in the process of
setting values for forms of nitrogen (DIN and Total-N) and for phosphorus (DIP and Total-P) for transitional
water types as seasonal averages (see compilation of existing nutrient standards, March 200932). The degree
of precaution in the derivation of these standards is not yet clear.
141. While some Member States reported values for dissolved oxygen standards in relation to nutrient
standards in the response to the nutrient standards questionnaire, none were reported for transitional waters.
5.5. Coastal waters
5.5.1. Assessment methodologies and criteria used for water quality status classification
142. Coastal ecosystems receive nutrients either directly from the sources on the coastal line or from rivers
that bring nutrients from their catchments, via sea current transport from distant coastal and marine waters,
and from the atmosphere. The increased nutrient loading from anthropogenic sources has caused
eutrophication of coastal ecosystems, the symptoms of which are excessive accumulation of phytoplankton
biomass, depletion of oxygen in bottom waters, increased frequency of noxious algal blooms, increased
turbidity, deterioration of coastal food webs and reduction of biodiversity.
143. Where coastal eutrophication is an international problem it needs to be tackled by co-ordinated
national and international efforts. This reality is at the origin of the Regional Seas Conventions, which have
started strategies to combat eutrophication already in the late eighties recognising the need for a harmonised
way of assessing the eutrophication status of the nations ‘common’ waters. For more detailed information on
the work on eutrophication by the regional sea conventions see Annex I Section 2 of this guidance.
144. Yet, procedures for assessing eutrophication are different in the different Conventions but in the last
years, in specific after the adoption of the WFD, there has been an effort by all of them to converge their
assessments into WFD compatible assessment systems.
145. Differences in the eutrophication assessment are at least partially explained by the characteristics of
the coastal ecosystems. The extent to which nutrient loads have an affect on coastal ecosystems depend
largely on their physical characteristics: regions of vertical stratification, restricted water exchange and long
32http://circa.europa.eu/Public/irc/env/wfd/library?l=/framework_directive/thematic_documents/13_eutrophication&vm
Guidance Document on Eutrophication Assessment
Guidance Document May 2009 55
residence time, with low tide and low mixing accumulate more nutrients and thus have a higher risk to
eutrophication, while nutrients received in upwelling areas, open coastal areas with high tide or currents are
rapidly diluted and transported to the open sea.
146. The Regional Seas Conventions procedures for the assessment of eutrophication typically include the
measurement of nutrient enrichment, some measurement of direct effects of nutrient enrichment
(phytoplankton chlorophyll a, macrophyte vegetation, and other biological elements) and indirect effects of
nutrient enrichment (dissolved oxygen, algal toxins, macrozoobenthos kills, etc.).
147. Phytoplankton growth is generally considered to be limited by light or one of the major nutrients, (N
or P), in addition to diatoms which are dependent of silica (Si). The optimal DIN:DIP ratio (N/P-ratio) for
phytoplankton growth is 16:1 (based on molar concentrations) and is called the Redfield ratio. Significant
deviations from 16 indicate potential nitrogen or phosphorus limitations to phytoplankton primary
production, which might affect the biological state of the ecosystem, in particular the phytoplankton biomass,
species composition and eventually food web dynamics.
148. While phosphorus is regarded as the main limiting nutrient in freshwaters, marine open waters are
primarily nitrogen-limited. However, as nutrients concentrations increase due to anthropogenic loading, on
average higher N:P ratios, but also lower Si:N ratios are observed in coastal areas which are likely to have
either or both P and Si limitation (e.g. Black Sea (Shtereva et al. 1999); Northern Europe (Jickells 1998,
Turner et al. 2003); some Danish coastal areas (Jørgensen 1996), and Dutch coastal waters (de Jonge et al.
2002)). Thus, the eutrophication phenomena in coastal areas are not only determined by the single nutrients
concentrations but also and even more relevant are the nutrient ratios. The ratio of dissolved inorganic
nitrogen and phosphorus, DIN:DIP is thus a an indicative number for potential nutrient limitations.
149. In coastal waters with many fjords and inlets the level of nutrient concentrations shows the same
pattern as in some transitional waters with reference and actual status concentrations increasing going from
the open coastal part towards the closed bays. National methods for assessing eutrophication in such
sheltered parts of coastal water bodies have been developed based on the assessment of both biological and
physico-chemical quality elements.
150. Transparency of the water column in coastal waters can indirectly reflect the nutrient loading/ nutrient
status. Transparency can be easily measured, directly by measuring the light attenuation through the water
column using light meters or alternatively using a Secchi Disc. Most often Secchi depth is measured as a
proxy of transparency. Increased nutrient loading often lead to increases in phytoplankton biomass in the
water column, which in turn decreases the transparency. In its turn, changes in transparency will affect the
depth of the euphotic zone and thus the depth limits of macrophytes, e.g. sea grasses and macroalgae. Also,
=detailed&sb=Title
Guidance Document on Eutrophication Assessment
Guidance Document May 2009 56
because different species have different light requirements changed transparency therefore also affects
dominance patterns of the vegetation.
151. Phytoplanktonic primary producers are the first organisms to respond to elevated nutrient
concentrations in their environment. Most phytoplankton species respond positively and predictably to
nutrient enrichment in all European coastal areas (Olsen et al. 2001). High phytoplankton biomass results in
increased amount of organic matter to be degraded after sedimentation by bacteria, meso- and macrofauna,
which may lead to hypoxia or anoxia of bottom waters. Long-lasting eutrophication causes recurrent or even
permanent oxygen deficit on bottom layers, leading to self-fertilization in coastal areas that may delay
recovery of the ecological status when external nutrient inputs are reduced. High biomass of phytoplankton
also increases the turbidity.
152. Also, it is generally believed that the frequencies of harmful algal blooms have increased worldwide
due to the increased nutrient input and algal toxins are included in some cases in the eutrophication
assessments. Although a strong causal relationship has not been established, there are indications that
excessive blooms of nuisance algae, such as Phaeocystis spp in at least the southern North Sea, are related to
nutrient loads.
153. Planktonic and opportunistic algae (mostly filamentous species) are generally favoured by high
nutrient concentrations and tend to cast out seagrasses and perennial algae in eutrophic areas. Their increased
biomass shades the perennial vegetation and limits its depth distribution, thereby further accelerating the
decline of the perennial vegetation.
154. Changed dominance patterns of the coastal primary producers from benthic macrophytes to planktonic
algae or from long-lived seagrasses and macroalgae towards opportunistic algae, as a consequence of
increased nutrient concentrations and reduced water transparency, may affect the macrophyte community
functional attributes. Moreover, opportunistic algae grow and decompose faster than perennial species and
may thereby generate a temporal imbalance between oxygen production and consumption increasing the
likelihood of anoxia having negative effects on the ecosystem (benthic invertebrates and fish kills).
155. Marine benthic macrofaunal communities often respond to decreasing oxygen concentrations and
different species show different tolerance against hypoxic conditions. Adverse effects of oxygen deficiency
may occur through different mechanisms. One is direct suffocation of aerobic organisms. Another
mechanism is because oxygen deficiency may alter sediment chemistry, the poisonous element H2S may be
released from the sediments and kill the organisms. From this it is to be expected a progressive change in
diversity and structure of the benthic community in response to decreasing oxygen levels in the critical
range.
Guidance Document on Eutrophication Assessment
Guidance Document May 2009 57
5.5.2. Assessment methodologies and criteria used for UWWT and Nitrates Directive designations
156. There is limited information available from Member States regarding the criteria used for the UWWT
and Nitrates Directive designations. The information available regarding designating sensitive areas under
the UWWTD shows that the designation was based principally on nutrient (DIN and orthophosphate)
concentrations and chlorophyll a concentrations.
5.5.3. Impact and pressure criteria used in WFD Article 5 risk assessment
157. The available information for Article 5 related criteria indicates that whenever pressure criteria were
reported these were based mainly on the presence of surface point sources (sewage) of nutrients loads and
surface water run-off. The impact criteria were based mainly on nutrient concentrations and chlorophyll a
(direct effect) and occasionally on dissolved oxygen, macrovegetation, etc (indirect effects).
5.5.4. Examples of development of new WFD-compliant assessment systems
158. New eutrophication assessment methodologies and criteria have been developed in relation to the
implementation of the WFD and the intercalibration exercise. The boundaries are set based on definitions of
reference criteria and the application of the Boundary Setting Protocol (BSP) to set the high-good and good-
moderate boundaries in line with the normative definitions for status class boundaries for each quality
specified in the WFD.
159. The Coastal intercalibration exercise was carried out within four Geographical Intercalibration Groups
(GIGs): the Baltic Sea, the Black Sea, the Mediterranean Sea and the North-East Atlantic. Common
intercalibration types shared by Member States within each GIG were defined for the intercalibration
exercise. The eutrophication related biological metrics that were subject to intercalibration in at least some
MS coastal types are: benthic invertebrate fauna quality element (all GIGs), metrics and boundaries
representing the phytoplankton quality element (chlorophyll a in all GIGs), metrics representing the
macroalgae and angiosperms quality elements (Baltic, Mediterranean and NE Atlantic GIGs). There is also
work on eutrophication related to supporting physico-chemical determinands including nutrient
concentrations, transparency and dissolved oxygen concentrations.
5.6. Marine waters
5.6.1. Existing assessment methodologies and criteria used for water quality status classification
160. Regarding marine waters, several Member States use water quality assessment methodologies and
criteria related to eutrophication that have been established in the frame of the Marine Conventions. The
existing information on eutrophication assessment (Conventions and national methodologies) shows that, as
in the case of rivers and lakes, eutrophication is determined according to criteria including nutrient
concentration together with direct effects (chlorophyll and other biological parameters) and indirect effects
(dissolved oxygen, organic matter, algal toxins, etc).
Guidance Document on Eutrophication Assessment
Guidance Document May 2009 58
161. The Marine Strategy Framework Directive 2008/56/EC33 is in force since 15 July 2008 and will now
require monitoring and assessment tools in relation to the eutrophication-related components of 'good
environmental status' (which is defined in Art. 3 (4) and (5) of the Directive, and for which further
qualitative descriptors are in Annex I of the Directive) (see below Chapter 5.6.5).
5.6.2. Assessment methodologies and criteria used for UWWT and Nitrates Directive designations
162. There is limited information available from Member States regarding the criteria used for the UWWT
and Nitrates Directive designations. The information available regarding designating sensitive areas under
the UWWTD shows that the designation was based principally on nutrient (DIN and orthophosphate)
concentrations and chlorophyll concentrations.
5.6.3. Impact and pressure criteria used in WFD Article 5 risk assessment
163. The available information for Article 5 related criteria indicates that whenever pressure criteria were
reported these were based mainly on the presence of surface point sources (sewage) of nutrients loads and
surface water run-off. The impact criteria were based mainly on nutrient concentrations and chlorophyll a
(direct effect) and occasionally on dissolved oxygen, macrovegetation, etc (indirect effects).
5.6.4. Examples of development of new WFD-compliant assessment systems
164. Eutrophication related assessment methodologies and criteria are subject to intercalibration for marine
waters. The eutrophication related biological metrics that are subject to intercalibration in at least some
marine water GIGs are: chlorophyll a, phytoplankton, macroalgae, angiosperms and benthic invertebrates.
There is also related work on eutrophication related supporting physico-chemical determinands including
nutrient concentrations, transparency and dissolved oxygen concentrations.
165. At present there is limited information available on progress with these developments.
5.6.5. Criteria and standards under the Marine Strategy Framework Directive
166. Criteria and methodological standards are now (in 2009) under development in fulfilment of MSFD
Art. 9(3) with a view to achieving a common methodological framework for the determination of 'good
environmental status'. This work takes into account the existing methodologies. It starts, as regards
eutrophication, with an examination by the JRC of the applicability of environmental quality elements used
in the assessment of the quality status of coastal waters under the Water Framework Directive to waters on
the seaward side of the limit of those coastal waters, and where applicability might extend, the formulation of
the precise boundary conditions for that applicability (e.g. water depth, light conditions, habitat types). The
eutrophication-related quality elements of the MSFD are mainly Annex I descriptor (5): "Human-induced
33 OJ L 164 of 25 June 2008, p. 19
Guidance Document on Eutrophication Assessment
Guidance Document May 2009 59
eutrophication is minimised, especially adverse effects thereof, such as losses in biodiversity, ecosystem
degradation, harmful algae blooms and oxygen deficiency in bottom waters", but as work on the criteria and
methodological standards develops for all descriptors, the lateral relations with those other descriptors (e.g.
"all elements of marine food webs, (…) occur at normal abundance and diversity (…)") will have to be
evaluated as some of them may also include elements that are strongly influenced by eutrophication.
6. HARMONISATION OF CLASSIFICATION CRITERIA
6.1. Use of nutrient standards and best practice in deriving them
167. Nutrients are supporting physico-chemical quality elements in the assessment of ecological status.
According to the normative definitions in Annex V WFD "nutrient concentrations do not exceed the levels
established so as to ensure the functioning of the ecosystem and the achievement of the values specified […]
for the biological quality elements". Figure 6 (as well as the explanations in Annex 1.1.6) provides an
interpretation of how to apply supporting physico-chemical quality elements in ecological status assessment.
Nutrient standards – as will be explained later – play an important role in the assessment.
168. In the context of preparing this guidance document a questionnaire had been sent to the Member States
to collect information on the definition of nutrient standards, the methodologies used to derive them, as well
as information on the legal status of these standards. At the time of compilation some of the standards were
still under development and did not have a formal status yet. The compilation provides an overview on
nutrient standards in the Member States in March 200934.
169. In the assessment of eutrophication, nutrients particularly support the biological quality assessments of
phytoplankton, macrophytes, macroalgae and phytobenthos. At the boundary between good and moderate
status and below nutrients will provide important information on the status of eutrophication, which is one of
the pieces of basic information needed for setting up the programme of measures.
170. Different water categories have different sensitivities to nutrients: the same nutrient concentration does
not necessarily have the same effect e.g. in small rivers versus lakes, or in freshwaters versus coastal and/or
marine waters. Therefore, when setting nutrient standards it is important to consider the water category and
where necessary the surface water type.
171. In setting nutrient standards one should always consider the objectives and keep in mind that the
nutrient parameters are part of a supporting quality element and consequently that standards for this
parameter are targets to strive for. In general, the primary objective of the WFD is good ecological status and
http://eur-lex.europa.eu/LexUriServ/LexUriServ.do?uri=OJ:L:2008:164:0019:0040:EN:PDF
34http://circa.europa.eu/Public/irc/env/wfd/library?l=/framework_directive/thematic_documents/13_eutrophication&vm=detailed&sb=Title
Guidance Document on Eutrophication Assessment
Guidance Document May 2009 60
thus can not do without an assessment of the biological quality elements. The process of deriving appropriate
nutrient standards should ideally involve:
(a) having a clear view of what good status for biology/ecology looks like;
(b) having an understanding of the relationship between nutrients and the biology/ecology (and the
variability in this);
(c) deciding on the best available techniques for deriving the standards and on the appropriate level of
precaution and summary statistic to be used in defining the standard;
(d) having sufficient and reliable monitoring data for deriving and determining compliance with the
standards.
Methodologies for setting nutrient standards
172. Discussions at a 2007 workshop on nutrient standards in Zandvoort (NL)35 indicated that many
differences exist in the standards derived and the methodologies/assumptions to derive those standards. As
many countries share river basins districts and marine areas, there is a need for harmonisation of methods
and assumptions at the European level, possibly in the same way as is done for ecological standards within
the context of the WFD. Standards will not necessarily be the same in the different Member States, because
they depend on the functioning of the ecosystems and differences across ecoregions and types.
173. In any case, setting of nutrient standards has to be linked with setting of biological boundaries for
ecological status assessment. This can be an iterative process (see also Figure 8 in Annex 1.1.6). It should be
kept in mind that a clear relation between biology and nutrients is less obvious when the status becomes less
than good.
Toolbox to derive nutrient standards
174. Use of empirical data: If monitoring data from the past are available for both biological quality and
nutrient concentrations, standards for nutrients can be set using these data. The most straight forward way is
using a certain percentile of a distribution of nutrient concentrations of sites classified as Good Status for one
or more biological quality element or parameters. This method is very simple and defendable if a sufficient
low percentile is selected in order to ensure the achievement of the biological values. Exclusion of sites
where other environmental factors than nutrients may hamper the biological quality is recommended. A
disadvantage is that the relationship between biology and nutrient concentrations is not tested. Such a test
can show the reliability and the type of the relationship.
35 Final report available at: http://circa.europa.eu/Public/irc/env/wfd/library?l=/framework_directive/implementation_conventio/standards_zandvoort&vm=detailed&sb=Title
Guidance Document on Eutrophication Assessment
Guidance Document May 2009 61
175. A more complex method is the application of regression analysis. In its most simple form, a linear
and one factor relationship between biology and nutrients is assumed. By proper regression analysis and by
plotting, the assumptions on the relationship between nutrients and biology, and the goodness of fit can be
investigated. An appropriate statistical value derived from the regression analysis can be used for setting the
nutrient standards. When the predicted nutrient concentration at G/M boundary value derived from a best fit
relationship, the G/M nutrients concentration will result in about 50 % achievement of the biological value.
By using the percentile distribution of the errors of the linear regression, the level of confidence of
achievement of the biological value can be enhanced to another desired level (reference).
176. The most advanced method is using statistical techniques which relate nutrient concentrations to
more than one environmental factor or may allow different types of relationships, e.g. non-linear. This
method can be recommended in cases where it is clear that nutrients are not the only factor determining the
biological quality, or where relationships are clearly non-linear. The disadvantage is that the development of
standards is more difficult to understand.
177. The level of misclassification between biological quality elements and nutrients can also be used for
setting the G/M boundary for nutrients. This method is more or less iterative and gives direct insight in the
consequences of the defined nutrient standard for classification of sites. The procedure starts with making a
set of potential nutrient standards in small discrete steps, which can be used for making a set of
classifications for each potential nutrient standard for both biological quality elements and nutrients. For
each site the classification results have four possible combinations:
1) biological quality elements are good and nutrients are not good,
2) biological quality elements are good and nutrients are good,
3) biological quality elements are not good and nutrients are good, and
4) biological quality elements are not good and nutrients are not good.
178. If nutrients are related with the biological quality elements, then the fraction of these four
classification combinations are shifting over the potential nutrient standard gradient. If the discrete steps are
small enough, the potential standard can be plotted against the distribution of the four types of classification
results. The standard can now be defined as a contribution of one of these four types of classification
combinations. For example, the nutrient concentration where e.g. 10 % of the classification results of the
biological quality elements are not good and nutrients are not good may be defined as the standard. By using
this definition the tested biological good status value is in about 90 % of the cases ensured by achievement of
the nutrient standard.
179. The methods based on empirical data will not always be applicable for the River Basin Management
Plan 2009 for all types of water, because monitoring data are not available or knowledge about ecological
Guidance Document on Eutrophication Assessment
Guidance Document May 2009 62
relationships is not sufficient or reliable. This can be a reason to use other means of setting nutrient
standards, e.g. using historical data or non-empirical models in combination with expert judgement.
Expert judgement methods:
180. Hindcasting is one means of estimating background levels. Natural background values for rivers can
be deduced from models, assuming pristine conditions (e.g. forested catchments) and not a certain time
period, because the latter reflects different status of eutrophication processes in different areas. Model data
should be validated by comparison with values from remote areas and historical (palaeo-ecological) findings.
Hindcast values are not standards but can be used with expert judgement to decide on standards.
181. Natural background concentrations in the different coastal areas have to be estimated from modelling
or scientifically based assumptions because of the lack of pristine coastal areas. Also, in some areas there is
a large exchange between coastal water and the open sea while in others it is very restricted. This has to be
reflected in the decision on background levels. In setting nutrient standards (good/moderate) the natural
variability should be considered and deviation from background can be used as a method of deriving
standards; e.g. for coastal waters OSPAR, HELCOM and the Baltic GIG chose an acceptable deviation of 50
% above natural background, because this range reflects moderate deviation and variability (also
recommended by CIS guidance documents). The deduction of natural background concentrations should be
based on reproducible scientific methods allowing a harmonisation for larger areas.
Issues to consider in deriving and applying nutrient standards
182. Nutrient standards are in principle type-specific, and within the type waters will slightly differ in their
sensitivity for eutrophication. These sensitivity differences are one of the sources of potential
misclassification. The standards can be chosen to be protective for the eutrophication sensitive bodies or on
the other hand for the more tolerant bodies. This delicate choice is largely an interpretation of the WFD,
Annex V, where good status of nutrients is defined. In principle, the nutrient standards developed for the
type should protect most water bodies from being or becoming eutrophied. However, if the standard is set to
protect the most sensitive water body this will lead to most other water bodies in that type failing the
standard. Furthermore, in some cases ecological knowledge or data is not sufficient to separate the effect of
nutrient concentration on biological quality from those that are not related to nutrient concentration. If other
factors are negatively affecting the quality of the sites involved in the analysis, automatically the standards
are getting more precautionary than necessary. In addition, there may be delayed recovery effects from
measures taken, because the trajectory of recovery may be different than that of deterioration – a so called
hysteresis effect (Scheffer et al. 2001). Long-term trends in the maximum depth of eelgrass in Danish waters
have shown an almost continuous decline, also in recent years despite strong efforts to reduce nutrient inputs
from land. Examining the trajectory of eelgrass depth distribution versus the main pressure, nitrogen inputs,
clearly indicates a lack of recovery. The causal explanation for this is still unclear, but the mechanisms could
Guidance Document on Eutrophication Assessment
Guidance Document May 2009 63
be a combination of lag time in the response, a shifting baseline and a hysteresis effect where recovery can
be anticipated only once the nitrogen input falls below an unknown threshold value.
183. Therefore, for an individual water body, a nutrient standard set to prevent deterioration may be
ineffective at securing restoration. Consequently, choices about the purpose of the standard and the degree of
precaution in setting a nutrient value will affect the likelihood of mismatches in compliance for nutrients and
relevant biological elements (see chapter 6.2 and section 1.1.6 of Annex 1 on checking procedures for
guidance on dealing with mismatches).
184. In conclusion, defining standards for nutrients is a real challenge where legal wordings are translated
into numbers and, even more challenging, with uncertainties about dose-response relationships between
biological and nutrient quality. As a minimum requirement for the first River Basin Management Plan, a
transparent description of the method for deriving the standards is recommended.
185. To account for spatial variation within types, within water bodies or within grouped water bodies the
use of water body-specific versus type-specific standards could be recommendable. This could be
particularly relevant in lakes and transitional waters. In rivers, nutrient standards may be developed for
different sections of the stream due to the different characteristics. Nutrient standards developed for upstream
sections will not necessarily ensure that good ecological status is also achieved in the downstream section,
but the measures taken in the River Basin Management Plan may need to consider reducing nutrient inputs
from upstream sources. Lack of knowledge exists especially on background levels in large rivers, as there are
not many good reference sites.
186. In addition, it is important to take drifting baselines into account that can be an effect of climate
change. A Guidance Document is currently being developed under the Common Implementation Strategy on
how to include effects of climate change in river basin management plans36.
6.2. Combining information from different quality elements in the assessment of ecological status
Use of nutrient standards in classification and how to deal with mismatches between nutrients and
biological quality elements
187. According to the CIS Classification Guidance, a water body may be classified as less than good
ecological status under the WFD, because values for physico-chemical quality elements (in the context of
eutrophication, notably nutrients) exceed levels established so as to ensure the functioning of the ecosystem
and the achievement of the biological quality required for good status (compare Figure 6 and further
explanations given in section 1.1.6 in Annex 1). Scientific understanding of the causal link between the
levels of physico-chemical quality elements in a water body and the condition of the biological quality
Guidance Document on Eutrophication Assessment
Guidance Document May 2009 64
elements is incomplete. Chapter 4 of the CIS Classification Guidance proposes a checking procedure
designed to ensure that the type-specific values established for the general physico-chemical quality elements
are no more or no less stringent than required by the WFD. The checking procedures apply only in relation to
values for the good-moderate status/potential boundaries and where Member States are confident that the
mismatch between the monitoring results for the biological and general physico-chemical quality elements
does not occur as a result of uncertain monitoring. This will usually require evidence that there is a consistent
mismatch from a significant number of water bodies in the type.37 Accordingly it may be appropriate for
Member States to relax the nutrient standards established for a type, subject to specific provisions (see Figure
8 of Annex 1.1.6), if there is evidence from a significant number of water bodies that the nutrient status is
less than good but the biological status is good. The opposite situation, where the biology is not good and the
supporting elements are good, may follow a similar procedure to determine whether the type-specific
nutrient standard is sufficiently tight. It should be noted that adjustments to type-specific nutrient levels will
reduce the extent of mismatches but will not eliminate them. This is because the characteristics of water
bodies within a type are never identical.
188. In some cases it may be more appropriate to revise the status of an individual water body to good if (a)
the nutrients are less than good, (b) the biology complies and the biological assessment is confident and
precise, and (c) delayed impacts are unlikely, rather than revising the type-specific nutrient level.
189. Before revising the status of a water body and/or the nutrient standards, it is considered important to
undertake checks to confirm the absence of biological impacts (including delayed impacts) and of upward
trends in nutrient concentrations. As regards the absence of biological impacts, such checks should be done
using biological assessment methods that are fully WFD-compliant38.
Selection of biological quality elements
190. Chapter 4.1 to 4.3 explain the general concept of using the "most sensitive quality element(s)". For
assessing eutrophication, quite often several biological quality elements may be suitable for this assessment.
Whilst it is inappropriate to take into account elements that are not sensitive to nutrients, there may be a
number of quality elements which are and there is value in a rounded assessment of ecological data. The
indicative checklists in Annex 2 suggest that more than a minimalist approach is needed, and as recognised
in Chapter 4.1, it is not easy to interpret the meaning of “most sensitive” as there are pros and cons of
different plant/algal indicators.
36 Interim title: How to adapt to climate change with regard to water issues and EU water legislation 37 CIS Guidance Doc. No. 13 Overall approach to the classification of ecological status and ecological potential, p. 14 38 The ECOSTAT Classification Workshop (March 2008) recommended to understand the Checking Procedure in this
way.

Guidance Document on Eutrophication Assessment
Guidance Document May 2009 65
191. The relevant sub-sections of Chapter 5 on the development of WFD-compliant assessment systems
provide further information on available classification methods. Further information is also provided in the
report of the ECOSTAT Classification Workshop39.
Effects of variability in space and in time relevant to classification
192. According to the CIS Guidance Document40 on delineation of water bodies "a discrete element of
surface water should not contain significant elements of different status. A water body must be capable of
being assigned to a single ecological status class with sufficient confidence and precision through the
Directive’s monitoring programmes."
193. Nonetheless, spatial variability can be found within types, within water bodies and within grouped
water bodies. A range of different approaches is currently being considered by Member States on how to
deal with such variability. These include taking the average status or the worst status, considering the
extension of the variability, e.g. as a percentage of the water body that is affected. Spatial criteria need to be
developed for classification. A combination of criteria based on lateral extension, water depth and residence
time of a water body and an even distribution of sampling sites have been suggested as a useful approach,
reflecting the fact that water body sizes are variable depending on the way water bodies have been
delineated. Sampling in the surrounding of specified types is often recommended for detection of exchanges
with adjacent areas by currents. Sampling sites should be adequately distributed over the water body if no
steep gradients are observed. In such areas, a certain percentage (e.g. 10 % of the maximum length of the
water body) could be used as the distance between stations. Water bodies should be delineated such that they
are more or less homogeneous, thereby reducing variability within the water body as much as possible. If it
is not possible to further downsize a water body, e.g. in marine areas where there are steep gradients at
frontal systems63, a higher resolution of sampling sites is required. These must be appropriately placed
considerating the relevant physical parameters, such as salinity, temperature and current speed.
194. Grouping of water bodies is important to make best use of available monitoring data and consider
exchange of water masses between adjacent areas. The majority of Member States are using grouping of
water bodies for classification purposes. The same principles mentioned above apply for grouped water
bodies. Grouping may increase variability. This needs to be balanced with the confidence in the monitoring
results. Grouping of water bodies of the same type and the same pressure does not automatically mean that
all water bodies have the same ecological status. Grouping of water bodies is generally quite useful for
assessing ecological status due to diffuse pressures.
39http://circa.europa.eu/Members/irc/env/wfd/library?l=/framework_directive/implementation_conventio/ecological_classificatio/classification_2008-05pd/_EN_1.0_&a=d
40 CIS Guidance Document No. 2: Identification of Water Bodies, p. 9
Guidance Document on Eutrophication Assessment
Guidance Document May 2009 66
195. In coastal waters, spatial gradients of standards, recent concentrations and their difference may also be
related to salinity gradients or upwelling, reflecting dominant mixing and by this distance from main river
sources, river plume extensions and dilution by open sea water. Furthermore, mixing diagrams can be used
for comparisons/assessments, smoothing regional variability caused by hydrodynamics and identifying
outliers for re-investigations. Nutrient gradients from shore to offshore areas are often combined with salinity
gradients if dominant nutrient sources are river freshwater discharges. If such gradients occur, they should
also be reflected by respective gradients of nutrient standards, reflecting mixing (of end-members).
Accounting for uncertainty in eutrophication assessment
196. Uncertainty in classification, particularly for water bodies close to the good-moderate boundary, is an
important issue for river basin management planning. Information on confidence and precision of
classifications is important for informing decisions about the appropriate follow up action. To start with the
acceptable level of confidence and precision should be decided beforehand, and the sampling/monitoring
should be appropriately designed (sampling sites, frequency, sampling and analysis methods, etc.) to be able
to reliably classify the water bodies. Depending on the level of confidence, this information can inform, as
appropriate, decisions on exemptions41, prioritising water bodies for improvement, and/or prioritising further
monitoring and investigation to improve confidence. Being clear on the level of confidence achieved and on
the follow up action where confidence is insufficient to justify expensive measures is considered important:
Appropriate follow-up action in such cases includes (a) further targeted monitoring and assessment to try to
improve confidence and to assess the risk of deterioration, and (b) action to assess the risk of, and prevent
deterioration.
197. A lack of monitoring should not be an excuse for inaction although it is recognised that in the first
cycle of river basin planning, when the new classification tools and monitoring plans have not been in place
for long, uncertainties will be greater than in subsequent cycles. Investigative monitoring should be
introduced as a priority, where needed, to improve the evidence base and inform decisions on programmes of
measures.
198. In water bodies where there is insufficient confidence in the assessment of eutrophication, the
appropriate action will generally be to undertake further monitoring and investigation to improve confidence,
rather than to move to immediate control measures under the WFD or through "read across" to UWWT or
41 See also Section 6 of the Policy Paper "Exemptions to the environmental objectives under the Water Framework Directive; Article 4.4 (extension of deadlines), 4.5 (less stringent objectives) and 4.6 (temporary deterioration)"
http://circa.europa.eu/Members/irc/env/wfd/library?l=/framework_directive/thematic_documents/environmental_objectives/final_policy_44-45-46/_EN_1.0_&a=d
Guidance Document on Eutrophication Assessment
Guidance Document May 2009 67
Nitrates Directive designations. This may apply when, for example, the nutrients appear less than good but
we are not confident that the relevant biological quality elements are less than good. Confidence should then
be improved in the biological assessments and, where necessary, the nutrient thresholds should be reviewed.
In any case, Member States can not wait until all symptoms of eutrophication are present before taking
action. As set out in paragraph 46 in Chapter 3.6, if sufficient certainty is attained that the water body is
likely to become eutrophic in the near future, then protective measures need to be undertaken (application of
the precautionary principle).
6.3. The river basin perspective: linking results of inland waters with transitional and coastal waters
199. The assessment of ecological status in upstream and downstream water bodies is independent from
another, but in terms of management, good ecological status in upstream water bodies does not guarantee
also reaching the environmental objectives downstream. It may be necessary to undertake measures in
upstream areas to reduce nutrient inputs and transport downstream.
200. The management of nutrients in upstream areas should therefore take into account problems with
nutrients downstream, for example in lakes/reservoirs connected to a river, rivers flowing into coastal or
marine waters. Nutrients may also be transported between different coastal waters or marine areas due to
currents or upwelling, and this needs to be taken into account when developing appropriate measures to
mitigate eutrophication. These measures need to be coordinated at the river basin scale as well as between
coastal and marine areas if necessary.
201. The following example from the Rhine River Basin District illustrates how river basin management
can appropriately address measures to mitigate eutrophication at the basin scale. Similar examples are also
available from other river basins, e.g. the Elbe River.
6.4. WFD and marine conventions: coherence of current eutrophication assessment schemes
202. Marine eutrophication has been addressed by marine conventions in Europe since many years. A
considerable body of expertise has been generated for the Baltic Sea (HELCOM) and the North-East Atlantic
(OSPAR), but also in the Mediterranean Sea (MED POL) and the Black Sea (Bucharest Convention)
activities to address eutrophication in a common way have started. The Conventions' eutrophication
combating policies (OSPAR: Eutrophication Strategy, 1998, revised 2003; HELCOM: Ministerial
Declaration 1988, and recently the Baltic Sea Action Plan 2007) have required them to undertake periodic
assessments. In this process, the participating countries have considered a need to ensure an approach that
would be consistent with their obligations under EU instruments, most notably the WFD, but also the Marine
Strategy Framework Directive.
Guidance Document on Eutrophication Assessment
Guidance Document May 2009 68
Reduction of nitrogen discharges: The Example of the Rhine River Basin District
In the process of the production of the first river basin management plan, the Co-ordinating Committee Rhine agreed on a discharge reduction target via the river Rhine into the marine environment for nitrogen of approximately 15-20 % (reference years: 2004/2005/2006). The reduction is considered to be necessary in order to achieve a good ecological status in the coastal waters and the Wadden Sea of the international river basin district of the Rhine.
Within the Co-ordinating Committee Rhine representatives of the Rhine riparian states (Austria, Liechtenstein, Germany, France, Luxembourg, Belgium and the Netherlands), the European Community, for Germany also representatives of the federal states and for Belgium representatives of the Walloon region, are responsible for the international co-ordination of the implementation of the WFD in the international river basin district Rhine. Switzerland declared to support the EC-Member States in the co-ordination of the work. Italy, that covers only a very little part of the Rhine district, agrees with the approach.
Considering the fact that the coastal waters and the Wadden Sea are part of the international Rhine district, an integrated approach respecting upstream-downstream relations is needed. Because the coastal waters (including the Wadden Sea) as part of the international river basin district Rhine are situated in the Dutch territory only, the Co-ordinating Committee Rhine asked the Netherlands to take the initiative for estimating the potential riverine discharge reduction of nitrogen in the fresh water part of the Rhine district in order to achieve the good ecological status in its coastal waters by 2015.
Building on the intercalibrated parameter bloom frequency of Phaeocystis and the partly intercalibrated parameter chlorophyll a, it became clear that especially in the Wadden Sea the good ecological status is not achieved in the present situation. For the coastal and transitional waters the Netherlands have developed objectives for nitrogen concentrations (averaged values of Dissolved Inorganic Nitrogen) that ensures the achievement of the quality element phytoplankton. This objective depends on salinity, and is calculated to a standard at a salinity of 30. Subsequently, this objective is calculated to a concentration in large fresh water rivers. Based on this objective the maximum allowed discharge of nitrogen to the coastal waters and the Wadden Sea is calculated and compared with the current riverine discharge of nitrogen.
The Co-ordinating Committee Rhine did not directly use the Dutch objectives for Nitrogen in terms of concentrations, but accepted it as an indicator of the direction for the restoration measures and as a tool for evaluation of the measures taken. The parties involved will continue to implement their programme of measures in order to reduce the nitrogen load. The ‘polluter pays principle’ and the present EC-policies are put into practice. In addition to this, it has to be kept in mind that other sources than the River Rhine contribute significantly to the nitrogen concentrations in coastal waters as well, e.g. other river basins and atmospheric deposition. It is assumed that the other North Sea riparian states also achieve a reduction of nitrogen discharges.
For the sake of completeness, it is stressed that in line with the WFD the assessment of biological status is limited to the 1 mile zone. Therefore there can be some differences with the assessments made under OSPAR, because OSPAR takes into account the whole North Sea and its delineation of "non-problem areas" and "problem areas" with regard to eutrophication is not fixed to the WFD subdivision of coastal water bodies. In the near future, the Marine Strategy Framework Directive 2008/56/EC may play a role for eutrophication sensitive parameters of coastal states' marine waters (territorial waters and exclusive economic zones, the part of the sea between the territorial water (up to 12 nautical miles) and a max. of 200 nm).
Guidance Document on Eutrophication Assessment
Guidance Document May 2009 69
203. In the North-East Atlantic, a first application of the OSPAR eutrophication assessment procedure was
undertaken by the OSPAR countries of their waters in 2003 and, with a procedure slightly revised in 2005,
repeated in 200842. The background levels used in 2003 had mainly been based on expert judgement. In the
2008 assessment process, a number of OSPAR countries reviewed background levels based on more recent
knowledge. One important driver for the review has been the need to harmonise the assessment methods with
the Water Framework Directive in transitional and coastal waters. The review of background levels has led
in some cases to the update and change of assessment levels used earlier. The 2008 OSPAR assessment
report demonstrates that, although the OSPAR procedure aims to result in a comparable assessment
throughout the Convention area, there are significant differences in the national application of the OSPAR
procedure by the OSPAR countries, in particular in the choice of assessment parameters and assessment
criteria (see report Table 3.2 of the 2008 report42). These differences in the choice of parameters and
assessment methods imply that the OSPAR and WFD assessment outcomes for coastal and transitional
waters are at present not fully interchangeable, and that there is scope for further work to make them fit
together better43.
204. HELCOM has developed a common, harmonised Eutrophication Assessment Tool, called HEAT. This
assessment tool is in full accordance with the requirements for ecological status assessment of WFD and the
relevant guidelines under the CIS process. It is targeted to the assessment of eutrophication in transitional,
coastal and open marine areas.
205. HEAT is a multi-metric indicator based assessment method which is based on the use of reference
conditions and defining an acceptable deviation from them for defining the boundary between good and
moderate status. The assessment results are calculated as Ecological Quality Ratio and presented as one of
five classes (high, good, moderate, bad, and poor). HEAT comprises two assessment steps. The first step is
an interim assessment for specific selected indicators and/or biological quality elements (such as
phytoplankton, submerged aquatic flora, benthic fauna). By a second step, these individual assessment
results are merged into an overall classification using the “one out, all out” principle as laid out in the WFD.
HEAT will be further improved in order to meet the requirements of the Baltic Sea Action Plan and
eutrophication relevant EC directives such as the WFD, Habitats Directive and the MSFD.
206. HEAT has successfully been tested for coastal and marine waters along the Baltic Sea.
42 http://www.ospar.org/documents/dbase/publications/p00372_Second%20integrated%20report.pdf 43 This issue is still on the agenda of the OSPAR Eutrophication Committee.

Guidance Document on Eutrophication Assessment
Guidance Document May 2009 70
7. MONITORING – GUIDANCE AND INTEGRATION OF REQUIREMENTS STEMMING FROM VARIOUS OBLIGATIONS
7.1. Introduction
207. The aim of this chapter is to:
• specify further which aspects in the existing Guidance on Monitoring are relevant for eutrophication
assessment;
• provide guidance on how to harmonise the monitoring in a way to satisfy the requirements in the
different directives and regional conventions dealing with eutrophication.
208. As Section 1.1 of this document indicates, this guidance on monitoring has to be firmly based on the
methodological concept of the Water Framework Directive and to explore thereafter to what extent this
methodology can be used in the context of other directives and policies. For the Water Framework Directive
monitoring networks have to be designed "so as to provide a coherent and comprehensive overview of
ecological and chemical status within each river basin and shall permit classification of water bodies into
five classes consistent with the normative definitions in section 1.2"44. Table 2 (section 3.2) gives a general
overview of the requirements of EC Directives and regional conventions regarding the assessment and
monitoring of eutrophication.
209. Assessing eutrophication in specific water body types may change specific monitoring requirements.
The implementation activities of the Water Framework Directive have already addressed monitoring needs to
a certain degree (e.g. Monitoring guidance document45); however the spatial and temporal monitoring
requirements may differ for critical variables when eutrophication issues are specifically focused on, and the
requirements of specific water types (e.g. to capture the necessary seasonality and flow dependency in
nutrients and of nutrient loads, chlorophyll and oxygen) are considered.
210. Member States had to establish their monitoring programmes for the Water Framework Directive by
22 December 2006. Member States will have integrated monitoring programmes that provide the data and
information which will meet the needs of all the relevant policies, in this case, all those that deal with
eutrophication. For example, where possible, the same monitoring stations, quality elements and sampling
frequencies should be used for Water Framework Directive assessments and also for any assessment required
for other policies e.g. OSPAR.
44 Article 8 WFD 45 Guidance Document No. 7: Monitoring under the Water Framework Directive

Guidance Document on Eutrophication Assessment
Guidance Document May 2009 71
7.2. Guidance documents
211. Monitoring guidance documents or guidelines have been developed for most of the policy drivers
dealing with eutrophication. These have been used in this document and include:
• Common Implementation Strategy Guidance Document No. 7: Monitoring under the Water
Framework Directive, 2003.
• Common Implementation Strategy Guidance Document No. 13: Overall approach to the
classification of ecological status and ecological potential, 2003.
• Urban Waste Water Treatment Directive (91/271/EEC). There is no EU guidance on how the
monitoring of water status/quality46 should be undertaken. There may be national examples
available.
• European Commission. Draft guidelines for the monitoring required under the Nitrates Directive
(91/676/EEC), March 200347.
• HELCOM: Monitoring and Assessment Strategy48 and Manual for Marine Monitoring in the
COMBINE Programme of HELCOM49
• OSPAR (2005): Eutrophication Monitoring Programme, OSPAR Agreement 2005-04.
• UNEP-MAP (2003): Eutrophication monitoring strategy of MEDPOL. UNEP(DEC)/MED
WG.231/14, 30 April 2003.
212. The European Marine Monitoring and Assessment (EMMA) group formed under the European
Commission’s "Thematic Strategy for the Protection and Conservation of the European Marine
Environment" has worked on improving indicators related to eutrophication. The implications of the Marine
Strategy Framework Directive 2008/56/EC50 (MSFD; the Directive that is the legal instrument under this
Strategy) for marine eutrophication assessment are being elaborated in the context of the preparation of
'criteria and methodological standards' that relate to the MSFD Annex I descriptor (5) that "human-induced
eutrophication is minimised, especially adverse effects thereof, such as losses in biodiversity, ecosystem
degradation, harmful algae blooms and oxygen deficiency in bottom waters." A clear synergy with the
existing eutrophication assessment framework is necessary.
213. Also the revision of HELCOM monitoring programmes is underway (MONPRO project). The aim of
the revision is to have a monitoring and assessment framework, which is in line with obligations stemming
46 The Directive gives guidance on the monitoring of the effluents before discharge from the treatment works (Annex 1D of Directive 91/271/EEC).
47 Non statutory guidelines, informally discussed by Member States in the Nitrates Directive Committee, however the text has never been submitted to a formal vote
48 http://www.helcom.fi/groups/monas/en_GB/monitoring_strategy/ 49 http://sea.helcom.fi/Monas/CombineManual2/CombineHome.htm 50 http://eur-lex.europa.eu/LexUriServ/LexUriServ.do?uri=OJ:L:2008:164:0019:0040:EN:PDF
Guidance Document on Eutrophication Assessment
Guidance Document May 2009 72
from various regulations (e.g. WFD, UWWTD, Nitrates Directive) and which foresees the demands from the
Thematic Strategy for the Protection and Conservation of the European Marine Environment
7.3. Water categories and geographic coverage
214. The Water Framework Directive covers all waters, including inland waters (surface water and
groundwater) and transitional and coastal waters up to one sea mile (in terms of monitoring ecological status
and hence eutrophication – and for the chemical status also territorial waters which may extend up to 12 sea
miles) from the territorial baseline of a Member State, independent of the size and the characteristics51. These
waters (water bodies) will need to be included in surveillance, operational or investigative monitoring
programmes. Monitoring of surface freshwaters, estuarine, coastal and marine waters is also required for the
Nitrates Directive. The geographic extent of marine waters included in the requirements of the Urban Waste
Water Treatment Directive is not clear: Annex II (criteria for the identification of sensitive and less sensitive
areas) includes estuaries and coastal waters in terms of sensitive areas, whereas marine water bodies are
included in the criteria for less sensitive areas. Coastal waters are defined as "waters outside the low-water
line or the outer limit of an estuary"52.
215. Monitoring required for Marine Conventions is generally for assessing the state53 of transitional,
coastal and open marine waters.
216. Operational monitoring for the Water Framework Directive will be carried out for all those water
bodies identified as being at risk of failing their environmental objectives (for example, achievement of good
ecological status or good ecological potential, or no deterioration of status). Where this risk is due to nutrient
enrichment and water bodies have been assessed as eutrophic under other policies, these water bodies will
be, or be part of, a sensitive area/water body, or a polluted water or a problem area, respectively, under the
Urban Waste Water Treatment Directive, Nitrates Directive and OSPAR Strategy to Combat Eutrophication
(in waters of overlapping jurisdiction) (see section 3.6). For these water bodies, operational monitoring will
potentially help assess the effectiveness of the measures introduced under those other polices, and help to
decide what further measures may be needed. In waters/water bodies not previously identified as eutrophic
under the other policies but have been identified by the Annex II risk assessments as being at risk due to
nutrient enrichment, operational monitoring could be the basis for deciding a water body is "eutrophic", as
part of its status assessment. Where there is a risk of future deterioration of status (due to increasing nutrient
pressures), operational monitoring could also contribute to the assessments needed as to whether waters
"may become eutrophic" under the other policies. In short, it is anticipated that, depending on the
51 Articles 2 (1), (2) and (3) 52 Article 2.13 53 Some Marine Conventions also require the monitoring of rivers for the estimation of loads entering the marine
environment.

Guidance Document on Eutrophication Assessment
Guidance Document May 2009 73
commonalities between other aspects of monitoring e.g. geographic jurisdiction, quality elements and
frequency, integrated monitoring programmes could be established that will provide the data and information
required for all of the relevant policies dealing with eutrophication.
217. Surveillance monitoring for the Water Framework Directive must be carried out on a sufficient
number of surface water bodies to provide an assessment of the overall surface water status within each
catchment or sub-catchment within the river basin district54. This implies that water bodies across a range of
statuses will be included and in particular those identified as not being at risk of failing their environmental
objectives (good and high status water bodies, no risk of deterioration of status). Where Member States have
identified sensitive and less sensitive areas for the Urban Waste Water Treatment Directive and designated
vulnerable zones for the Nitrates Directive, there is a requirement for Member States to review the
identification of sensitive areas55 and nitrate vulnerable zone(s)56 of their surface waters respectively, at least
every four years. Assuming that this would involve some monitoring57 then it is likely that this would include
those water bodies not previously identified as being sensitive/vulnerable or polluted. Where relevant, in
terms of overlapping geographic jurisdiction of the different policies, it would be expected that the results
from surveillance monitoring (which will include parameters indicative of the quality elements relevant to
eutrophication) could contribute to the review and assessment of non-eutrophic, non-polluted waters and
non-problem areas (the latter as identified in the OSPAR Comprehensive Procedure) (see Table 5, section
3.6). Results from surveillance monitoring might also contribute to the establishment of the extent of nitrate
pollution from agricultural sources in those countries that have established and applied action programmes
throughout their national territory for the Nitrates Directive58. In addition, investigative monitoring might
need to be carried out to get a fuller picture of existing nutrient sources and their impacts on the water
bodies.
54 Annex V.1.3.1 55 For the UWWTD, Member States do not have to identify sensitive areas if they have applied Article 5.8 of
Directive 91/271/EEC. 56 For the Nitrates Directive, monitoring requirements depend on whether Member States establish and apply
action programmes throughout their national territory (Article 3.5) or identify and designate specific vulnerable zones (Article 3.1 and 3.2). Monitoring for the purpose of designating and revising the designation of vulnerable zones (Article 6) does not apply to Member States who establish and apply action programmes throughout their national territory. In the latter case, Member States must monitor their surface waters and groundwater at selected monitoring points to establish the extent of nitrate pollution in their waters from agricultural sources (Article 5.6 first sentence). Those Member States who have designated vulnerable zones must monitor to assess the effectiveness of action programmes (Article 5.6 first sentence), and monitor the nitrate concentration in freshwaters over a period of a year (every 4 years or, under defined circumstances, every 8 years) and to review (every 4 years) the eutrophic state of their fresh surface waters, estuarial and coastal waters (Article 6).
57 Non statutory draft guidelines for the monitoring required under the Nitrates Directive (91/676/EEC), 2003 58 Article 3.5
Guidance Document on Eutrophication Assessment
Guidance Document May 2009 74
7.4. Selection of monitoring sites
218. CIS Guidance No. 7 gives guidance on the selection of monitoring sites for inclusion in surveillance
and operational monitoring for the Water Framework Directive. There is no EU guidance on the number of
monitoring stations that might be appropriate for monitoring the quality of receiving waters under the Urban
Waste Water Treatment Directive. The informal guidance for monitoring under the Nitrates Directive
suggests different station densities for rivers and standing waters, with an increased density inside and at the
borders of polluted waters, and waters deemed to be at risk of eutrophication, and less in areas with low
nutrient pressures.
219. For the OSPAR Eutrophication Monitoring Programme, the spatial coverage of stations should be
greatest in problem and potential problem areas, and least in non-problem areas. In all cases the optimum
station locations are to be determined by each Contracting Party. The HELCOM Combine Manual (for
monitoring) indicates that mapping stations and high-frequency stations are required. Mapping stations are
used to map the winter pool of nutrients, oxygen/hydrogen sulphide in bottom waters and zoobenthos. High
frequency stations are used for pelagic variables and for monitoring water exchange between the various
basins in the Baltic Sea, and between the Baltic Sea and the North Sea. MEDPOL’s eutrophication
monitoring strategy59 requires Contracting Parties to select representative water bodies in marine waters in
order to detect changes over a selected period (e.g. 10 years), and in relation to off-shore fish farms and
coastal lagoons.
7.5. Selection of quality elements/parameters to be measured
220. Annex V, Table 1.1 in the Water Framework Directive, explicitly defines the quality elements that
must be used for the assessment of ecological status (e.g. composition and abundance of phytoplankton).
Quality elements include biological elements and elements supporting the biological elements. These
supporting elements are in two categories: ‘hydromorphological’ and ‘chemical and physicochemical’. CIS
Guidance No. 7 gives as to which quality elements and parameters indicative of the quality elements should
be selected for each type of monitoring60. In addition the key features of each element are described with an
indication of which pressures the elements respond to e.g. nutrient enrichment61. Further guidance on the
meaning of parameters, quality elements and groups of quality elements is given in the guidance on the
overall approach to the classification of ecological status and ecological potential62. The relevant sections in
Chapter 5 give examples of the most widely used indicators.
59 UNEP(DEC)/MED WG.231/14 30 April 2003 60 Guidance document No. 7, Monitoring under the Water Framework Directive, pages 21 and 24 61 Guidance document No. 7, Monitoring under the Water Framework Directive, pages 35 to 73 62 Guidance document No. 13, Overall approach to the Classification of Ecological Status and Ecological Potential,
Paragraph 3.3

Guidance Document on Eutrophication Assessment
Guidance Document May 2009 75
221. Guidance on the selection of quality elements/parameters to be measured for the purpose of the
OSPAR, HELCOM and MEDPOL is also given.
222. At the quality element level there are many similarities between the different policies, particularly for
the biological and physicochemical quality elements that are considered to be indicative of eutrophication.
However, there are some differences in terms of the recommended measured parameters indicative of the
quality elements. More significantly, surveillance and operational monitoring for the Water Framework
Directive requires the monitoring for hydromorphological quality elements: there is no such explicit
requirement in the other relevant policy drivers even though some of these elements are included as
supporting environmental factors in the conceptual framework for eutrophication (see Figure 2 in section
2.2). Hydromorphological quality elements can be relevant in assessing eutrophication, e.g. in impounded
rivers or in lakes with large water level fluctuations.
Use of nutrient monitoring
223. Nutrients are a key factor in eutrophication and, therefore, should be included in monitoring
programmes for the assessment of eutrophication, besides other key parameters such as temperature or
salinity in coastal waters. Basically, two different monitoring concepts can be applied: 1) monitoring of
biological quality element(s) including supporting quality elements, or 2) monitoring of nutrients (and
possibly other physico-chemical quality elements) as a screening tool. Generally, monitoring of nutrients will
be at a higher frequency than for biological quality elements.
224. For screening procedures it has to be considered that nutrients may be transported over long distances,
disconnected to local sources and diluted but steadily enhancing local production. It can also be useful to
monitor organic matter (included partly in total nitrogen and total phosphorus; but also particulate and
dissolved organic carbon may cause eutrophication), because organic matter contains nutrients and is a direct
cause for secondary eutrophication effects (e.g. oxygen deficiency) and may not have been produced locally,
but transported from elsewhere.
225. For a detailed analysis of eutrophication processes all fractions of nutrients (dissolved and particulate,
organic and inorganic forms of nitrogen and phosphorus) should be monitored to allow a better
understanding of the status and the factors explaining the status. Such a detailed analysis can be part of an
investigative monitoring programme. The analysis of total nitrogen and total phosphorus is the basis for
budget calculations and overall assessments. However, for detailed analyses of eutrophication processes
individual parameters are needed.
226. For both types of analyses the often inhomogeneous vertical distribution of particulate organic matter
in the water column has to be considered during monitoring. In stratified water bodies (lakes, transitional and
Guidance Document on Eutrophication Assessment
Guidance Document May 2009 76
coastal waters) and in frontal areas63 (mainly in transitional and coastal waters) nutrients have to be
monitored with a sufficient vertical resolution. Therefore, it is important to adapt the monitoring strategy to
different hydrodynamic regimes.
7.6. Frequency of monitoring
227. Annex V of the Water Framework Directive provides tabulated guidelines in terms of the minimum
monitoring frequencies for all the quality elements. The suggested minimum frequencies are applicable to
both surveillance and operational monitoring and are generally lower than those currently applied in some
countries. More frequent monitoring will most likely be necessary in many cases to achieve a reliable
assessment of the status of the relevant quality element, but also less frequent monitoring is justified when
based on technical knowledge and expert judgment64. Member States are also able to target their monitoring
to particular times of the year to take into account variability due to seasonal factors.
228. The frequency of sampling and the distribution of sampling sites for nutrient monitoring should be set
up in a way that it is possible to detect trends. For high-frequency monitoring the use of automatic measuring
devices and remote sensing tools can be very useful.
229. Monitoring is required over one year, at least once every 4 years for the Nitrates Directive65, and the
sensitivity of waters in general needs to be reviewed every 4 years for the Urban Waste Water Treatment
Directive. The review does not explicitly require monitoring though undoubtedly information from
monitoring would be invaluable in the assessment. For the Nitrates Directive, a minimum of monthly
samples for nitrates analysis is required66; this compares with once every 3 months (for nutrient status) for
the Water Framework Directive.
230. The OSPAR Eutrophication Monitoring Programme defines the minimum requirements for
monitoring and reporting. For areas, including local areas located in wider non-problem areas, identified as
problem or potential problem areas, a sufficient frequency and spatial coverage of all the parameters in the
programme should be monitored and reported each year. For the areas identified as non-problem areas,
results relating to the monitoring of the nutrient assessment parameters (nutrient inputs, winter DIN and DIP
63 Frontal areas are characterised by the occurrence of steep gradients of water density, mostly including salinity gradients. They are formed at the borders of river plumes, coastal water plumes or upwelling water masses with adjacent homogenous mixed water masses.
64 Guidance document No. 7, Monitoring under the Water Framework Directive, section 2.10.2 65 For the purpose of designating and revising the designation of vulnerable zones 66 At stations laid down in the Surface Water for Drinking Directive (75/440/EEC) and/or other sampling stations
representative of surface waters of Member States (Article 6.1.a.i). These stations are used to identify polluted waters based on exceedance or potential exceedance of 50 mg/l nitrate (Annex I.A.1). Annex 1.A.3 also gives "eutrophic" or "may become eutrophic" as other criteria for identifying polluted waters. Though not strictly relevant to the eutrophication criteria (phosphorus is often the limiting nutrient for algal growth in freshwaters), monthly sampling of nitrate at those stations described in Article 6.1.a.i would in practice be useful in the assessment of eutrophication.
Guidance Document on Eutrophication Assessment
Guidance Document May 2009 77
and winter N/P ratio) should be reported once in 3 years. For HELCOM, there are two main monitoring
frequencies recommended: frequent and highly frequent. Frequent sampling ranges from once or twice per
year to 6 to 12 times per year depending on purpose and parameter. Some high frequency stations are
sampled up to 26 times per year or even more often. For the MEDPOL eutrophication monitoring strategy,
the optimal sampling frequency should be chosen by each country according to the parameter variability in
the affected area, and with the objective of detecting a change in concentration over a selected period (e.g. 10
years).
231. A common theme between policies is the acknowledgement that monitoring/sampling may need to be
targeted to particular seasons (e.g. for seas: nutrients in winter, algae in summer) and particular water
bodies/areas (e.g. problem areas, water bodies at risk) and higher sampling frequencies may be needed in
more variable water bodies/areas or during periods of high variability than the minimum frequencies
recommended67.
7.7. Monitoring of protected areas
232. As already described in Section 3.6 of this guidance both sensitive areas under the Urban Waste Water
Treatment Directive and nitrate vulnerable zones under the Nitrates Directive are Protected Areas under
Annex IV of the Water Framework Directive. This means that monitoring programmes established under the
Water Framework Directive will have to take into account any monitoring requirements in the respective
Directives such as the monitoring of nitrate concentrations in freshwaters over a period of a year at least
every 4 years for the Nitrates Directive68.
7.8. Harmonisation of monitoring programmes
233. Member States will wish, where possible, to have integrated and harmonised monitoring programmes
that provide the data and information which will meet the needs of all the relevant policies, in this case, all
those that deal with eutrophication. This section attempts to demonstrate where this should be possible based
on the commonalities of policies in terms of, for example, geographic coverage of waters and the monitoring
requirements as given in Directives/Conventions and any associated guidance/guidelines.
7.8.1. Rivers and lakes
234. For fresh surface water bodies there is potentially a good deal of synergy between policies in terms of
the identification and inclusion of the same water bodies impacted by nutrients, and the quality elements
indicative of eutrophication that are recommended to be monitored. There is also a joint need to review
periodically the status of those water bodies identified as not being impacted by nutrients or at risk of
67 See, for example, for further guidance section 2.10 in CIS Guidance Document No. 7, Monitoring under the Water Framework Directive
Guidance Document on Eutrophication Assessment
Guidance Document May 2009 78
becoming impacted by nutrients: these (or groups of these) may be included in surveillance monitoring for
the Water Framework Directive and be part of the periodic review of waters for the Nitrates Directive and
Urban Waste Water Treatment Directive. Eutrophication assessment is an integral part of the ecological
status assessments under the Water Framework Directive. So the assessments and monitoring to be carried
out for ecological status (and for the objective of preventing deterioration in status) should be a good step
forward towards integration across these three policies with the Water Framework Directive monitoring (and
assessment) schemes meeting the needs for future reviews of sensitive areas and polluted waters (eutrophic).
235. Water bodies impacted by, or at risk from, nutrients will be included in operational monitoring for the
Water Framework Directive (though not all will necessarily be monitored as the representative monitoring of
groups of water bodies is allowed), and they will also be required to be monitored for the Urban Waste
Water Treatment Directive (waters subject to discharges from urban waste water treatment works and direct
discharges from some industries) and for the Nitrates Directive (diffuse sources from agriculture, assessment
of effectiveness of action programmes). Surveillance monitoring for the Water Framework Directive may
include water bodies across the range of statuses from high to bad (where all statuses exist), and therefore
some of the impacted or at risk water bodies (from nutrient enrichment) might also be included: the results
from this monitoring might also contribute to the periodic reviews required for the Urban Waste Water
Treatment and Nitrates Directives.
236. There are synergies between the monitoring required in all water categories for the different policies
in terms of quality elements required for assessing eutrophication particularly in terms of biological quality
and physicochemical quality elements but less so for the hydromorphological quality elements required for
the Water Framework Directive. There are also some differences in terms of the recommended measured
parameters indicative of the quality elements, e.g. HELCOM requires the monitoring of zooplankton in
coastal and marine waters, an element not required by the WFD or other policies. However these difference
may not be significant as long as some common disaggregated parameters such as composition and
abundance of the biological element are measured (at an appropriate taxonomic level) then other related
parameters could be easily derived.
237. There are potential differences in the frequency that monitoring might be undertaken in fresh surface
waters. The review of sensitive areas (including eutrophic state) and less sensitive areas under the Urban
Waste Water Treatment Directive is required at intervals of no more than four years. For the purpose of
designating and revising the designation of vulnerable zones under the Nitrates Directive, monitoring for
nitrate is required at least every four years over one year. It is not yet clear, how Member States will
implement surveillance and operational monitoring programmes for the WFD. A minimum of one year in six
years (or one year in 18 years in exceptional circumstances) is given in the Directive for surveillance
68 Article 6 (a)
Guidance Document on Eutrophication Assessment
Guidance Document May 2009 79
monitoring, with a minimum of one sample per 3 months for nutrient status69 in the years that monitoring is
undertaken for surveillance and operational monitoring. However, an additional requirement of monitoring
for the WFD is the choice of frequencies that will "achieve an acceptable level of confidence and precision"70
in the monitoring results and subsequent assessments. Monthly sampling for nutrients is currently common
practice in many Member States. Therefore, Member States might in practice wish to critically assess their
sampling frequencies for surveillance and operational monitoring in terms of the confidence in the estimates
of status they will provide71, and in terms of the costs of monitoring. In conclusion, it is likely that an
integrated monitoring programme based on the requirements of the Water Framework Directive would be at
a frequency that meets the needs of the other policies dealing with eutrophication.
7.8.2. Transitional, coastal and marine waters
238. Monitoring undertaken for the assessment of eutrophication for Marine Conventions and the Marine
Strategy Framework Directive includes offshore marine waters not required under the Water Framework
Directive. Additional monitoring of coastal and marine waters will, therefore, be required beyond the WFD
in order to assess eutrophication for the other relevant policies. Some policies also require the designation of
specific areas in relation to eutrophication (e.g. polluted water and problem areas). These areas may not
always be the same geographically or in spatial extent and this will have to be borne in mind when
developing a harmonised integrated monitoring programme for eutrophication.
239. HELCOM defines frequent and highly frequent monitoring stations that have recommended sampling
frequencies higher than other geographically relevant policies (i.e. WFD and Nitrates Directive). A common
theme that could be incorporated into a harmonised monitoring programme for transitional, coastal and
marine waters is the recognition that sampling should be targeted to specific times of the year for some of the
elements (e.g. nutrients and chlorophyll). There is also a common theme of ensuring that monitoring results
are fit for purpose and this implies that different frequencies would be required for different elements,
different water categories and different water bodies. As examples: Member States have to achieve
acceptable levels of precision and confidence in the monitoring results and subsequent assessments (Water
Framework Directive); Contracting Parties have to determine optimum sampling frequencies, for example, to
confirm maximum winter nutrient concentrations have been determined (OSPAR) or to detect changes in
concentrations over 10 years (MEDPOL).
69 Minimum monitoring frequencies are also given for the other quality elements in all water categories 70 Annex V.1.3.4, sentence 3. 71 CIS Guidance document No. 7, Monitoring under the Water Framework Directive, section 2.10.4

Guidance Document on Eutrophication Assessment
Guidance Document May 2009 80
8. NEXT STEPS – LINKS OF EUTROPHICATION ASSESSMENT WITH PRESSURE AND IMPACT ANALYSIS AND PROGRAMME OF MEASURES
8.1. Use of the DPSIR framework
240. The DPSIR framework (Figure 3 in Chapter 2) is seen as giving a structure in which the indicators are
presented that are needed to enable feedback to policy makers on environmental quality and the resulting
impact of the political choices made or to be made in the future.
241. Within the DPSIR framework, eutrophication assessment as described in the previous chapters
belongs to the part of "state" and "impact". The outcome of the assessment might result in responses and
measures. In order to be able to formulate the response, there is a need to understand the links between
drivers/pressures, state/impact and the response.
242. The need for a response becomes evident if the result of eutrophication assessment is that a water body
(or part of marine area) is eutrophic or may become eutrophic in the near future. In that case it has to be clear
how the appropriate response/measures will be developed and decided upon to reduce/eliminate
eutrophication in that water body. The objective of the measures should be to move to a situation where a
water body (or part of marine area) is not eutrophic, in order to assist the achievement of the environmental
objectives for a water body. The steps that are necessary to set objectives and to develop measures have been
described in general in the WFD CIS Guidance document "Environmental objectives under the WFD"72.
Below, more specific details are given for the steps to develop measures to combat eutrophication.
8.2. Steps in the development of measures for a water body (or part of marine area) that is eutrophic or may become eutrophic in the near future
Step 1
243. A first step in the development of measures to abate eutrophication in a water body is the assessment
of all the sources that (may) contribute to the nutrient load to a water body. Such an assessment should not be
limited to the sources near the water body itself, as sources upstream may contribute to eutrophication in
downstream water bodies/marine areas (cf. paragraphs 51 and 52 in section 3.6). Also retention processes
(denitrification and sedimentation), atmospheric deposition and re-suspension from sediments can be taken
into account.
Step 2a
244. A further step is to consider the possible (combination of) reduction measures for these sources,
including the effect of those reduction measures on the eutrophication status (= effectiveness of a measure)
and the costs associated to the implementation of those measures (= selecting the most effective measure for
72http://circa.europa.eu/Public/irc/env/wfd/library?l=/framework_directive/guidance_documents/documentn20_mars09p
Guidance Document on Eutrophication Assessment
Guidance Document May 2009 81
the least costs = cost-efficiency). An important question to be answered in this step is the scale at which
measures need to be considered – in other words: what is the expected extent in a catchment of the
impact/effect of the various measures at source.
245. The implementation of existing measures needs to be considered as well in this context – relevant
existing measures in EU context are the Nitrates Directive, the Urban Waste Water Treatment Directive, the
IPPC Directive, the Groundwater Directive, the National Emission Ceilings Directive and the Thematic
Strategy on Air Pollution. Furthermore, the Marine Strategy Framework Directive needs to be considered.
Step 2b
246. Besides measures at source, also measures in (or nearby) the affected water body should be considered
that can result in a reduction of eutrophication. Examples of such measures are alterations of the
morphological characteristics of the water body, e.g. restoration of banks or floodplains, changes to the flow
conditions, other changes to the infrastructure. Also for these types of measures, the extent of achievable
reduction and related costs should be considered and assessed.
Step 3
247. Finally, it has to be decided which (combination of) measures at source and in the water body is most
appropriate and cost-effective to reduce and eliminate eutrophication in a water body or part of marine area.
At this stage, a balanced division of costs between upstream and downstream areas and between the various
sectors has to be decided upon, taken into account the principles of polluter-pays and proportionality. The
quality of the information gathered on the various measures will be crucial in acceptance of the justification
of measures in upstream water bodies/countries where no eutrophication exists but where nutrient loads
contribute to eutrophication in downstream water bodies/marine areas. The mechanism for the decision
making is laid down in the WFD by preparing river basin management plans and agreement on this at the
(international) catchment area level.
8.3. Identification of gaps that need to be addressed
248. A lot of the tools, guidance and mechanisms that are necessary to carry out the steps outlined in the
preceding section are already available.
249. For step 1, the pressures and impact analysis according to Article 5 of the WFD and the drawing up of
a river basin management plan has ideally resulted in an overview and assessment of all the sources.
250. For step 2a, on the establishment of effectiveness and cost-effectiveness of measures and the scale at
which measures need to be considered is subject of the policy summary and background document on cost-
df/_EN_1.0_&a=d
Guidance Document on Eutrophication Assessment
Guidance Document May 2009 82
effectiveness73. The WFD Article 5 analysis already gives indications on the scale by identifying issues/risks
that need to be considered at the international catchment level. Considerations to measures with regard to
agricultural losses of nutrients have been produced by the CIS activity on "Links between WFD and
agriculture"74.
251. Several tools and examples exist or are in development to establish in a quantitative way the link
between measures at sources of nutrients and the expected reduction of eutrophication effects in the fresh
water and marine environment. It concerns flow studies (e.g. in Rhine and Danube catchment, COST
initiative on evaluation of mitigation options for reducing nutrient losses to surface water), retention models
and models for quantification of losses from diffuse sources and discharges from point sources (e.g. OSPAR
HARPNUT guidelines, EUROHARP, COST action 626 European aquatic modelling network),
HARMONICA. The challenge is to embed these tools in a sustainable way and to have the budgets/means to
maintain the systems in the future.
252. In the area of measures in the water body itself (step 2b), available information and experience should
be shared at European level.– a list of examples of such measures might be helpful.
253. For step 3, the results of the CIS Activity on cost-effectiveness deliver a useful framework to assist in
the decision making.
8.4. Conclusion
254. In general, all the necessary tools, guidance and mechanisms are available to develop and decide upon
the measures aiming at elimination of eutrophication in water bodies/catchments/marine areas. The challenge
will be to apply all these tools in practice and to balance these with the implementation of measures in other
policy areas such as agriculture or land-use.
73 http://circa.europa.eu/public/irc/env/wfd/library?l=/framework_directive/thematic_documents/economic_issues/cost_effectiveness&vm=detailed&sb=Title
74 Catalogue of measures for tackling agricultural pollution under the WFD, see http://circa.europa.eu/public/irc/env/wfd/library?l=/framework_directive/thematic_documents/wfd_agriculture&vm=detailed&sb=Title
Guidance Document on Eutrophication Assessment
Guidance Document May 2009 83
9. REFERENCES
1. Andersen, J.M, Dunbar, M. and Friberg N. Eds. (2004). REBECCA WP4 Rivers, Deliverable D6: Report
on existing methods and relationships linking pressures, chemistry and biology in rivers.
2. Cardoso, A.C., Duchemin, J., Magoarou, P. and Premazzi, G. (2001). Criteria for the identification of
freshwaters subject to eutrophication. European Commission, Joint Research Centre.
3. Carletti, A. and Heiskanen A.-S. (in press). Water Framework Directive intercalibration technical report.
Part 3: Coastal and Transitional Waters.
4. Cloern, J.E., 2001. Our evolving conceptual model of the coastal eutrophication problem. Marine
Ecology Progressive Series, vol. 210, pp. 223-253.
5. Coops, H., Kerkum, F. C. M., van den Berg, M. S. and van Splunder, I., 2007. Submerged macrophyte
vegetation and the European Water Framework Directive: assessment of status and trends in shallow,
alkaline lakes in the Netherlands. Hydrobiologia, 584, 395-402.
6. Coste in CEMAGREF, 1982. Etude des méthodes biologiques d'appréciation quantitative de la qualité
des eaux. Rapport Q.E. Lyon A.F. Bassin Rhône-Méditérannée-Corse, 218p.
7. De Jonge, V., M. Elliott, and E. Orive. 2002. Causes, historical development, effects and future
challenges of a common environmental problem: eutrophication. Hydrobiologia 475-476:1-19.
8. European Commission 2002b. Workshop on eutrophication criteria – Summary report. Brussels 28-30
May 2002.
9. European Commission 2005. Thematic Strategy on the Protection and Conservation of the Marine
Environment. COM(2005)504 final
10. European Communities 2008. Commission Decision (2008/915/EC) of 30 October 2008 establishing,
pursuant to Directive 2000/60/EC of the European Parliament and of the Council, the values of the
Member State monitoring system classifications as a result of the intercalibration exercise (notified
under document number C(2008) 6016). O.J. L 332/20, 10/12/2008.
11. European Environment Agency 1995. Europe’s Environment: The Dobris Assessment.
12. European Environment Agency 2001. Eutrophication in Europe’s coastal waters. Topic report 7/2001, 86
p.
13. European Environment Agency 2003. Europe's water: An indicator based assessment. Topic report N0
1/2003, 99 p.
14. European Environment Agency 2007: Europe's environment. The Fourth Assessment.
http://www.eea.europa.eu/publications/state_of_environment_report_2007_1/.
Guidance Document on Eutrophication Assessment
Guidance Document May 2009 84
15. Free, G., Little, R., Tierney, D., Donnelly, K. and Caroni, R., 2007. A reference based typology and
ecological assessment system for Irish lakes. Preliminary investigations. EPA: Wexford. www.epa.ie.
16. Friberg N. (ed.), 2007. REBECCA Work Package 4: Rivers, Deliverable D 13: Report on suitable single
and integrated biological indicators for different pressures in rivers.
17. Heiskanen, A. S., van de Bund, W., Cardoso, A.C. and Noges, P., 2004. Towards good ecological status
of surface waters in Europe – interpretation and harmonisation of the concept. Water Science and
Technology, 49, 169-177.
18. Heiskanen, A.S., Solimini, A.G. and Cardoso, A.C. (2005). REBECCA WP2 Literature review,
Deliverable D4: Linkages between chemical and biological quality of surface waters. Current knowledge
on indicators and methods for Water Framework Directive Ecological Status Assessment. Chapter 1:
Nutrients and eutrophication in lakes.
19. Heiskanen, A-S., Carstensen, J., Gasiūnaitė, Z., Henriksen, P.,Jaanus, A., Kauppila, P., Lysiak-
Pastuszak, E., Sagert, S., 2005. Monitoring strategies for phytoplankton in the Baltic Sea coastal waters.
European Commission, Joint Research Centre: Ispra. EUR 21583 EN.
20. Hering, D., Johnson, R.K., Kramm, S., Schmutz, S., Szoszkiewicz, K., Verdonschot, P.F.M., 2006.
Assessment of European streams with diatoms, macrophytes, macroinvertebrates and fish: a comparative
metric-based analysis of organism response to stress. Freshwater Biology, 51, 1757–1785.
21. Hoey, G., van Drent, J., Ysebaert, T. and Herman, P.M.J. (2007). The benthic ecosystem quality index
(BEQI), intercalibraton and assessment of Dutch coastal and transitional waters for the water frame
directive: Final report. Nijmegen: Radboud University.
22. Jickells, T. D. 1998. Nutrient biogeochemistry of the coastal zone. Science 281:217-222.
23. Jørgensen, B. B. 1996. Case Study – Aarhus Bay. Pages 137-154 in B. B. Jørgensen and K. Richardson,
editors. Eutrophication in Coastal Marine Ecosystems. American Geophysical Union, Washington, DC.
24. Kelly, M.G., 2001. Role of benthic diatoms in the implementation of the Urban Wastewater Treatment
Directive in the River Wear, NE England. Journal of Applied Phycology, 14, 9-18.
25. Leyssen, A., Adriaens, P., Denys, L., Packet, J., Schneiders, A., Van Looy, K. and Vanhecke, L., 2005.
Toepassing van verschillende biologische beoordelingssystemen op Vlaamse potentiële
interkalibatielocaties overeenkomstig de Europese Kaderrichtlijn Water – Partim “Macrofyten”. Rapport
van het Instituut voor Natuurbehoud IN.R.2005.05 in opdracht van VMM: Brussel.
26. Lyche-Solheim et al. (2005). REBECCA WP3 Lakes Deliverable D7: Reference conditions in European
Lakes.
27. Lyche-Solheim et al. (2007). REBECCA WP3 Lakes Deliverable REBECCA D11: Dose-response
relationships between biological and chemical elements in different lake types.

Guidance Document on Eutrophication Assessment
Guidance Document May 2009 85
28. OECD 1982. Eutrophication of Water, Monitoring, Assessment and Control. Paris, 150 p.
29. OSPAR 2005-4. Eutrophication Monitoring Programme
30. OSPAR 2008. Second Integrated Report on the Eutrophication Status of the OSPAR Maritime Area.
31. Padisák, J., Borics, G., Fehér, G., Grigorszky, I., Oldal, I., Schmidt, A. and Zámbóné-Doma, Z., 2003.
Dominant species and frequency of equilibrium phases in late summer phytoplankton assemblages in
Hungarian small shallow lakes. Hydrobiologia, 502, 157–168.
32. Padisák, J., Borics, G., Grigorszky, I. and Soróczki-Pintér, É., 2006. Use of phytoplankton assemblages
for monitoring ecological status of lakes within the Water Framework Directive: the assemblage index.
Hydrobiologia, 553, 1–14.
33. Phillips, G., Pietila¨inen, O.-P., Carvalho, L , Solimini, A., Lyche Solheim, A. and Cardoso, A.C., 2008.
Chlorophyll–nutrient relationships of different lake types using a large European dataset. Aquatic
Ecology, 42(2): 213-226.
34. Poikane, S. (in press). Water Framework Directive intercalibration technical report. Part 2: Lakes
35. Pont, D., Hugueny, B., Beier, U., Goffaux, D., Melcher, A., Noble, R., Rogers, C., Roset, N. and
Schmutz, S., 2006. Assessing the biotic integrity of rivers at the continental scale: a European approach
using fish assemblages. Journal of Applied Ecology, 43, 70-80.
36. Prygiel, J., and Haury, J., 2006. Monitoring methods based on algae and macrophytes. . In: Ziglio, G.,
Flaim, G., Siligardi, M. (Eds.), Biological Monitoring of Rivers. Wiley, 155-170.
37. Reynolds, C. S., Huszar, V., Kruk, C., Naselli-Flores, L. and Melo, S., 2002. Towards a functional
classification of the freshwater phytoplankton. Journal of Plankton Research, 24, 17–428.
38. Salmaso, N., Morabito, G., Buzzi, F., Garibaldi, L., Simona, M. and Mosello, R., 2006. Phytoplankton as
an indicator of the water quality of the deep lakes south of the Alps. Hydrobiologia, 563, 167-187.
39. Schaumburg, J., Schranz, C., Hofmann, G., Stelzer, D., Schneider, S. and Schmedtje, U., 2004.
Macrophytes and phytobenthos as indicators of ecological status in German lakes – a contribution to the
implementation of the Water Framework Directive. Limnologica, 34, 302–314.
40. Scheffer, M., S. Carpenter, J.A. Foley, C. Folke and B. Walker (2001). Catastrophic shifts in ecosystems,
Nature, Vol. 413, Oct. 2001
41. Shtereva, G., S. Moncheva, V. Doncheva, O. Christova, and I. Shterev. 1999. Changes in chemical
parameters in the Bulgarian Black Sea coastal area as an indication of the ecological state of the
environment. Water Science and Technology 39:37-45.
Guidance Document on Eutrophication Assessment
Guidance Document May 2009 86
42. Solimini A.G., Cardoso A.C, Heiskanen A-S. (eds.), 2006a. Indicators and methods for the ecological
status assessment under the Water Framework Directive. European Commission, Joint Research Centre:
Ispra. EUR report 22314.
43. Swedish EPA, 2007. Lakes and watercourses, aquatic plants in lakes. www.internat.naturvardsverket.se.
44. Turner, R. E., N. N. Nancy, D. Justic, and Q. Dortch. 2003. Future aquatic nutrient limitations. Marine
Pollution Bulletin 46:1032-1034.
45. Van de Bund, W. (in press). Water Framework Directive intercalibration technical report. Part 1: Rivers
46. Van der Molen, D.T. (Ed.) (2004). Referenties en concept-maatlatten voor rivieren voor deKaderrichtlijn
Water. STOWA-rapport 2004/43. STOWA, Utrecht. 365p.
47. Vollenweider, R.A. (1976). Advances in defining critical loading levels for phosphorus in lake
eutrophication. Mem. Ist. Ital. Idrobiol., 33:53-83.
48. Willby, N., J. Hilton, J.-A. Pitt & G. Philipps, 2006. Summary of approach used in LEAFPACS for
defining ecological quality of rivers and lakes using macrophyte composition. Interim Report June 2006.
University of Stirling, Stirling.
49. Zaldívar, J.-M., Cardoso, A.C., Viaroli, P., Newton, A., de Wit, R., Ibanez, C., Reizopoulou, S., Somma,
F., Razinkovas, A., Basset, A., Holmer, M. and N. Murray (2008). Eutrophication in transitional waters:
an overview. Transitional Waters Monographs 1(2008), 1-78. http://siba2.unile.it/ses/twm
50. Ziglio, G., Flaim, G., Siligardi, M., 2006. Biological Monitoring of Rivers. Applications and
perspectives. Wiley: Chicester, England
Guidance Document on Eutrophication Assessment
Guidance Document May 2009 87
ANNEX 1: THE UNDERSTANDING OF EUTROPHICATION
1. EU LEGISLATION AND POLICIES
1.1. Water Framework Directive (2000/60/EC)
1.1.1. Overview of the Water Framework Directive
255. The Water Framework Directive (WFD) establishes an integrated and co-ordinated framework for the
sustainable management of water. Its purposes include preventing deterioration of water bodies, promoting
sustainable water use, and ensuring "enhanced protection and improvement of the aquatic environment".
This last point requires that rivers, lakes, estuaries, coastal waters and groundwater achieve and /or maintain
at least ‘good status’ by 2015. For surface waters this requires both Ecological Status and Chemical Status to
be at least ‘good’. Good status will be achieved by implementing a programme of measures as reported in
River Basin Management Plans (Articles 11 and 13), and based on the results of river basin characterisation.
The WFD stipulates detailed procedures for its implementation including the classification and monitoring of
water bodies (see WFD Annex V).
256. Ecological status is derived from Ecological Quality Ratios (EQRs), which reflect the deviation of
observed values from type-specific reference conditions. ‘High’, ‘good’, ‘moderate’, ‘poor’ and ‘bad’
Ecological Status have normative definitions (see Annex V of the WFD) based on the deviation, as a result
of human activity, of quality elements from corresponding type-specific reference conditions. At good
ecological status, the values of biological quality elements (communities of phytoplankton, plants, fish,
macroinvertebrates etc.) should ‘deviate only slightly from those normally associated with the surface water
body type under undisturbed conditions’ (Annex V 1.2). The boundary between good and moderate
ecological status is crucial because it determines when restoration measures need to be taken.
257. The values for the biological quality elements set by Member States for the ‘high’-‘good’ class
boundary and the ‘good’-‘moderate’ class boundary will be compared as part of the intercalibration exercise,
which is further described below.
258. Several directives will coexist with the WFD, including: the UWWT Directive (91/271/EEC), Nitrates
Directive (91/676/EEC), Bathing Water Directive (76/160/EEC), Habitats Directive (Directives 92/43/EEC)
and the Birds Directive (Directive 79/409/EEC). Areas designated under these directives will have the status
of Protected Areas under the WFD (Annex IV), for the protection of their surface water, groundwater or for
the conservation of habitats or species directly depending on water. Several of these directives address
eutrophication, increasing the need for a common framework for eutrophication assessments.
259. Sections of the WFD particularly relevant to assessing eutrophication are: Article 1 a (purpose);
Article 4.1.a.i and ii (Environmental objectives and programmes of measures for surface waters); Article 5
Guidance Document on Eutrophication Assessment
Guidance Document May 2009 88
(Characterisation); Article 6 (Register of Protected areas); Article 7.3 (Drinking Water); Article 8
(Monitoring); Article 10 (The combined approach for point and diffuse sources); Article 11 (Programme of
measures); Annex II (1) (Characterisation), Annex IV.1.iv, (Protected Areas, nutrient-sensitive areas); Annex
V (1) (Assessment of Surface Water Status) and Annex VIII (indicative list of main pollutants).
1.1.2. Summary of the Water Framework Directive’s requirements
260. The term eutrophication is not explicitly defined in the Water Framework Directive. It is defined in
two of the Directives that are to be integrated into the river basin planning process75, Directive 91/271/EEC
and Directive 91/676/EEC.
261. According to Directive 91/271/EEC concerning urban waste water treatment (the UWWT Directive),
eutrophication means "the enrichment of water by nutrients especially compounds of nitrogen or phosphorus,
causing an accelerated growth of algae and higher forms of plant life to produce an undesirable disturbance
to the balance of organisms present in the water and to the quality of the water concerned". Directive
91/676/EEC concerning the protection of waters against pollution caused by nitrates from agricultural
sources (the Nitrates Directive) has an identical definition of eutrophication. However, for the purposes of
the Nitrates Directive, these effects must be caused by the enrichment of water by nitrogen compounds rather
than by nutrients in general.
262. The Water Framework Directive requires Member States to classify the ecological status of surface
water bodies76 into one of five ecological status classes; high, good, moderate, poor or bad ecological status.
The ecological status of a water body is an expression of the quality of the structure and functioning of its
aquatic ecosystem.
263. The Directive provides general qualitative definitions for each ecological status class, and more
detailed qualitative definitions for high, good and moderate ecological status for each surface water category.
264. Among other things, the definitions of each ecological status class describe the extent to which
biological components of the aquatic ecosystem, called biological quality elements, may differ in that class
compared to their reference, or high status, conditions as a result of the effects of human activity.
265. The reference conditions relevant to a particular water body depend on the type of water body. They
are type-specific. This enables the classification system to take account of the natural variety of aquatic
ecosystems across the Community’s different water types.
75 See Article 10; Article 11.3.a; and Article 4.1.c and Annex IV of the Water Framework Directive 76 The status of heavily modified water bodies and artificial water bodies is defined by their ecological potential
rather than their ecological status. When considering such bodies, references to ecological status should be read
as meaning ecological potential.

Guidance Document on Eutrophication Assessment
Guidance Document May 2009 89
266. The Directive requires the Commission to facilitate an intercalibration exercise. This exercise is
designed to ensure that the numeric class boundaries for good ecological status, which have to be set by each
Member State to make the classification scheme operational, are consistent with the Directive’s ‘normative’
definitions and comparable between Member States.
267. The environmental objectives of the Directive require Member States to prevent deterioration of the
status of water bodies. They also require Member States to aim to restore all surface water bodies to good
ecological status, except where doing so would be unfeasible or disproportionately expensive. The
Directive’s ecological status classification scheme is therefore central to water management across the
Community.
268. Nutrient enrichment is one of the many different anthropogenic pressures on water bodies that may
affect their ecological status. As such, management measures may be required to control nutrient enrichment
in order to achieve the objectives of the Directive.
269. The sensitivity of water bodies to nutrient enrichment may vary depending on their physical
characteristics and on the extent of other anthropogenic alterations to them. For example, modifications to
hydrology or morphology may significantly influence whether or not a given concentration of nutrients
causes accelerated growth of algae or higher forms of plant life to produce undesirable disturbances.
Changes to hydromorphology (e.g. residence time of water in lakes) could enable accelerated growth of
algae or higher forms of plant life and thus impact on the ecological status of a water body even in the
absence of further anthropogenic inputs of nutrients.
270. Operational monitoring must be undertaken for water bodies, or groups of water bodies, that are at risk
of failing to achieve the Directive’s objectives. The monitoring data obtained through operational monitoring
must be used to establish the status of those bodies and to assess changes to their status resulting from
management measures.
271. Monitoring must be designed to ensure that an adequate level of confidence and precision in the
classification of ecological status can be achieved. Guideline minimum monitoring frequencies are set out in
the Directive. However, the actual frequencies selected must provide sufficient data for a reliable assessment
of the status of the relevant quality elements.
272. For the purposes of monitoring water bodies at risk because of nutrient enrichment, Member States
must monitor parameters indicative of the biological quality element, or elements, most sensitive to the
effects of nutrient enrichment as well as the nutrients that are being discharged into the water body in
significant quantities77.
77 See Annex V 1.3.2. The term ‘discharge’ in this context is clearly intended to include the direct or indirect introduction into water as a result of human activity of nutrients from point or diffuse sources
Guidance Document on Eutrophication Assessment
Guidance Document May 2009 90
273. Where appropriate, Member States may group water bodies and use representative monitoring to
assess the status of the water bodies in the group78.
1.1.3. Conceptual understanding of eutrophication in the WFD
274. The WFD classifies water bodies in relation to type-specific reference conditions. This enforces the
view of eutrophication as a process, where nutrient enrichment through human activities causes adverse
changes in the aquatic environment, rather than as a particular level of primary production or trophic state.
275. The assessment of eutrophication is strongly implied in the classification of surface water bodies. The
definition of good ecological status for the quality elements ‘Phytoplankton’ and ‘Macrophytes and
Phytobenthos’ uses very similar wording as the definition of eutrophication used in the UWWT and Nitrates
Directives and by OSPAR. For example, good ecological status of lake macrophytes and phytobenthos
requires that ‘…changes do not indicate any accelerated growth of phytobenthos or higher forms of plant life
resulting in undesirable disturbances to the water balance of organisms present in the water or to the physico-
chemical quality of the water.’ (Annex V1.2.2.).79 In other words good status includes an absence of
eutrophication problems.
276. Nutrients, as part of the physicochemical quality element, must be at a level to ensure the functioning
of the ecosystem and the values specified for biological quality elements (i.e. to ensure that the above
definition is met). Specific mention of eutrophication is made in the requirement to estimate the magnitude
of all significant point and non-point source pollution, including ‘substances that contribute to eutrophication
(in particular nitrates and phosphates)’ (Annex II 1.4, Annex VIII).
1.1.4. Methods specified for assessing eutrophication
277. Under the WFD Ecological Status is assessed by using quality elements. Many of these quality
elements are traditionally used for assessing eutrophication, in particular ‘nutrient conditions’ as well as the
‘composition, abundance and biomass of phytoplankton and macrophytes’. At good Ecological Status
biological quality elements should have only slight deviation from type-specific reference conditions.
Corresponding values for nutrients necessary to support the achievement of good ecological status may be
estimated from response curves based on knowledge of the relationships between nutrient concentrations and
the biological quality elements.
278. High nutrient concentrations without any corresponding biological impacts may not necessarily result
in down grading Ecological Status. Thus assessments of eutrophication consistent with the WFD should
78 Guidance on grouping water bodies is provided in the CIS IMPRESS Guidance and the CIS Monitoring Guidance
79 Compared to the UWWT Directive definition:’ The enrichment of water by nutrients, especially compounds of nitrogen and/or phosphorus, causing an accelerated growth of algae and higher forms of plant life to produce an undesirable disturbance to the water balance of organisms present in the water and to the quality of the water

Guidance Document on Eutrophication Assessment
Guidance Document May 2009 91
primarily focus on the biological effects resulting from elevated nutrient levels, taking also into account
possible effect of transboundary transport of nutrients. Measures to reduce nutrient loading may still be
needed (see section 1.1.6 on CIS Classification Guidance for more details) to reduce the impact of the
discharge of nutrients in the area of discharge or elsewhere.
279. The main challenge for Member States is to find quantitative expressions (criteria or metrics) for the
response in abundance and taxonomic composition for the different biological quality elements along the
nutrient gradient, to quantify the impact of increased algal/plant biomass on other organisms and water
quality and to quantify slight, moderate and large deviations from reference conditions, corresponding to
‘good’, ‘moderate’ and ‘poor’ Ecological Status. One challenge will be to obtain monitoring data for the
required parameters from a sufficient number of sites and with a sufficient measurement frequency to ensure
that assessments have sufficient accuracy and precision to differentiate between natural variation and human
impact and to estimate the extent of anthropogenic pollution.
280. The CIS Monitoring Guidance recommends measurement frequencies for each parameter used in the
assessments of Ecological Status. These frequencies are higher than the minimum frequencies specified in
Annex V of the WFD, for many of the parameters relevant to eutrophication, such as phytoplankton and
nutrient parameters (monthly or bi-weekly during growth season in the guidance as opposed to once every
3-6 months in Annex V).
281. The WFD furthermore focuses on managing whole river basins on a European scale, thus a down-
stream water body failing the WFD objective of good status e.g. being eutrophic, may require measures to be
taken, in the entire upstream catchment or even in other river basins including coastal water bodies or
exporting coastal water bodies, even if upstream water bodies meet the objectives (transboundary transport
of nutrients).
282. Further elaboration on the interpretation of ecological status and how to understand the different status
classes is given in Chapter 3.
1.1.5. WFD Guidance documents
283. The following guidance documents for the implementation of the WFD with reference to
eutrophication assessment have been prepared within WFD Common Implementation Strategy (CIS)
working group:
• COAST: WFD CIS Guidance Document No. 5, 2003,
• Intercalibration: WFD CIS Guidance Document No. 6, 2003,
• Monitoring: WFD CIS Guidance Document No. 7, 2003,
• REFCOND: WFD CIS Guidance Document No.10, 2003,
• Classification WFD CIS Guidance Document No. 13, 2003.
concerned’.
Guidance Document on Eutrophication Assessment
Guidance Document May 2009 92
284. These guidance documents contain helpful information assisting guidance on eutrophication
assessment. Key issues mentioned in these documents for ecological classification of eutrophication are
presented in the following section.
1.1.6. Common understanding of Ecological Classification from CIS guidance documents
Introduction
285. The WFD requires the establishment of classification schemes to reflect the Ecological Status or
potential of surface water bodies as measured by the condition of specific biological, hydromorphological
and physico-chemical quality elements. The relevant elements, and the specific conditions required for these
elements in each of the classes of the classification schemes, depend on the surface water category and type
to which the water body belongs, the pressures acting on the water body, and on whether the body is artificial
or heavily modified. In addition the WFD requires Member States to achieve adequate confidence and
precision in classification, and to give estimates of the level of confidence and precision achieved in the
River Basin Management Plans.
286. The purpose of the overall ecological classification guidance is to provide general guidance on the
assessment of Ecological Status and Potential leading to the overall ecological classification of water bodies
for the purposes of the EC Water Framework Directive. The document also provides specific guidance on the
role of the general physico-chemical quality elements in ecological classification. The guidance document
draws on the existing guidance documents REFCOND, COAST, Monitoring, and HMWB&AWB.
Relationship between biological, hydromorphological and physico-chemical quality elements
287. As a basic step the values of the biological quality elements must be taken into account when
assigning water bodies to any of the Ecological Status and Ecological Potential classes. In order to ensure
comparability the results of the biological monitoring systems shall be expressed as ecological quality ratios
for the purposes of ecological classification. The ratio shall be expressed as a numerical value between zero
(worse class) and one (best class).
288. The values of the hydromorphological quality elements must be taken into account when assigning
water bodies to the high Ecological Status class and the maximum Ecological Potential class (i.e. when
downgrading from high Ecological Status or maximum Ecological Potential to good Ecological
Status/Potential). For the other status/potential classes, the hydromorphological elements are required to have
"conditions consistent with the achievement of the values specified for the biological quality elements."
Therefore, the assignment of water bodies to the good, moderate, poor or bad Ecological Status/Ecological
Potential classes may be made on the basis of the monitoring results for the biological quality elements and
also, in the case of the good Ecological Status/Potential the physico-chemical quality elements. This is
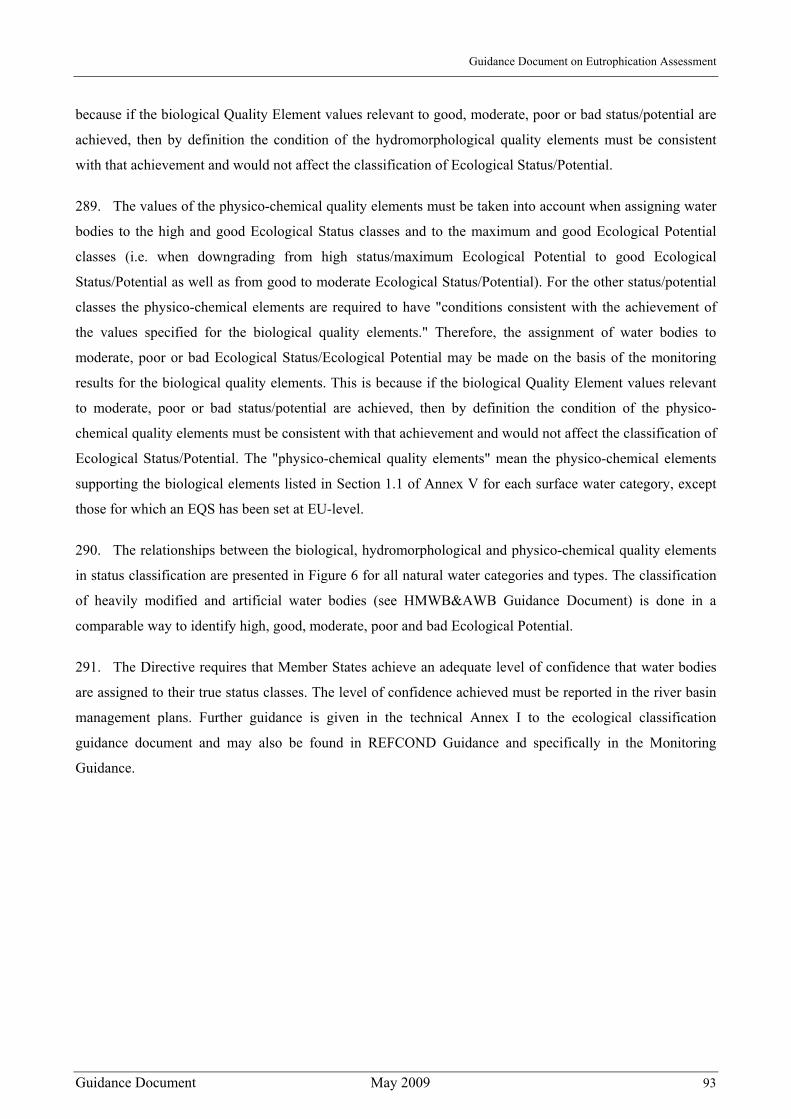
Guidance Document on Eutrophication Assessment
Guidance Document May 2009 93
because if the biological Quality Element values relevant to good, moderate, poor or bad status/potential are
achieved, then by definition the condition of the hydromorphological quality elements must be consistent
with that achievement and would not affect the classification of Ecological Status/Potential.
289. The values of the physico-chemical quality elements must be taken into account when assigning water
bodies to the high and good Ecological Status classes and to the maximum and good Ecological Potential
classes (i.e. when downgrading from high status/maximum Ecological Potential to good Ecological
Status/Potential as well as from good to moderate Ecological Status/Potential). For the other status/potential
classes the physico-chemical elements are required to have "conditions consistent with the achievement of
the values specified for the biological quality elements." Therefore, the assignment of water bodies to
moderate, poor or bad Ecological Status/Ecological Potential may be made on the basis of the monitoring
results for the biological quality elements. This is because if the biological Quality Element values relevant
to moderate, poor or bad status/potential are achieved, then by definition the condition of the physico-
chemical quality elements must be consistent with that achievement and would not affect the classification of
Ecological Status/Potential. The "physico-chemical quality elements" mean the physico-chemical elements
supporting the biological elements listed in Section 1.1 of Annex V for each surface water category, except
those for which an EQS has been set at EU-level.
290. The relationships between the biological, hydromorphological and physico-chemical quality elements
in status classification are presented in Figure 6 for all natural water categories and types. The classification
of heavily modified and artificial water bodies (see HMWB&AWB Guidance Document) is done in a
comparable way to identify high, good, moderate, poor and bad Ecological Potential.
291. The Directive requires that Member States achieve an adequate level of confidence that water bodies
are assigned to their true status classes. The level of confidence achieved must be reported in the river basin
management plans. Further guidance is given in the technical Annex I to the ecological classification
guidance document and may also be found in REFCOND Guidance and specifically in the Monitoring
Guidance.
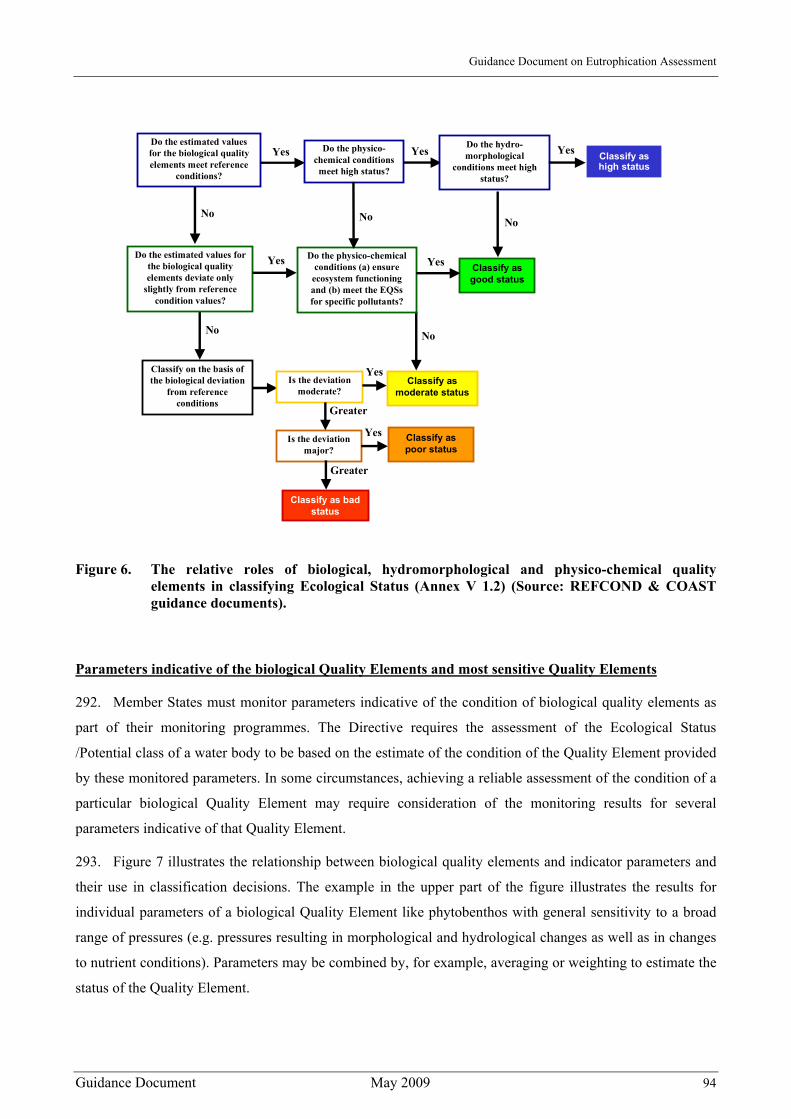
Guidance Document on Eutrophication Assessment
Guidance Document May 2009 94
Classify as moderate status
Classify on the basis of the biological deviation
from reference conditions
Is the deviation moderate?
Yes
No No
Classify as poor status
Is the deviation major?
Yes
Classify as bad status
Greater
Greater
Classify as high status
Do the estimated values for the biological quality elements meet reference
conditions?
Yes Do the physico-chemical conditions
meet high status?
YesDo the hydro-morphological
conditions meet high status?
Yes
Do the estimated values for the biological quality elements deviate only
slightly from reference condition values?
YesClassify as good status
Do the physico-chemical conditions (a) ensure
ecosystem functioning and (b) meet the EQSsfor specific pollutants?
Yes
NoNoNo
Figure 6. The relative roles of biological, hydromorphological and physico-chemical quality elements in classifying Ecological Status (Annex V 1.2) (Source: REFCOND & COAST guidance documents).
Parameters indicative of the biological Quality Elements and most sensitive Quality Elements
292. Member States must monitor parameters indicative of the condition of biological quality elements as
part of their monitoring programmes. The Directive requires the assessment of the Ecological Status
/Potential class of a water body to be based on the estimate of the condition of the Quality Element provided
by these monitored parameters. In some circumstances, achieving a reliable assessment of the condition of a
particular biological Quality Element may require consideration of the monitoring results for several
parameters indicative of that Quality Element.
293. Figure 7 illustrates the relationship between biological quality elements and indicator parameters and
their use in classification decisions. The example in the upper part of the figure illustrates the results for
individual parameters of a biological Quality Element like phytobenthos with general sensitivity to a broad
range of pressures (e.g. pressures resulting in morphological and hydrological changes as well as in changes
to nutrient conditions). Parameters may be combined by, for example, averaging or weighting to estimate the
status of the Quality Element.
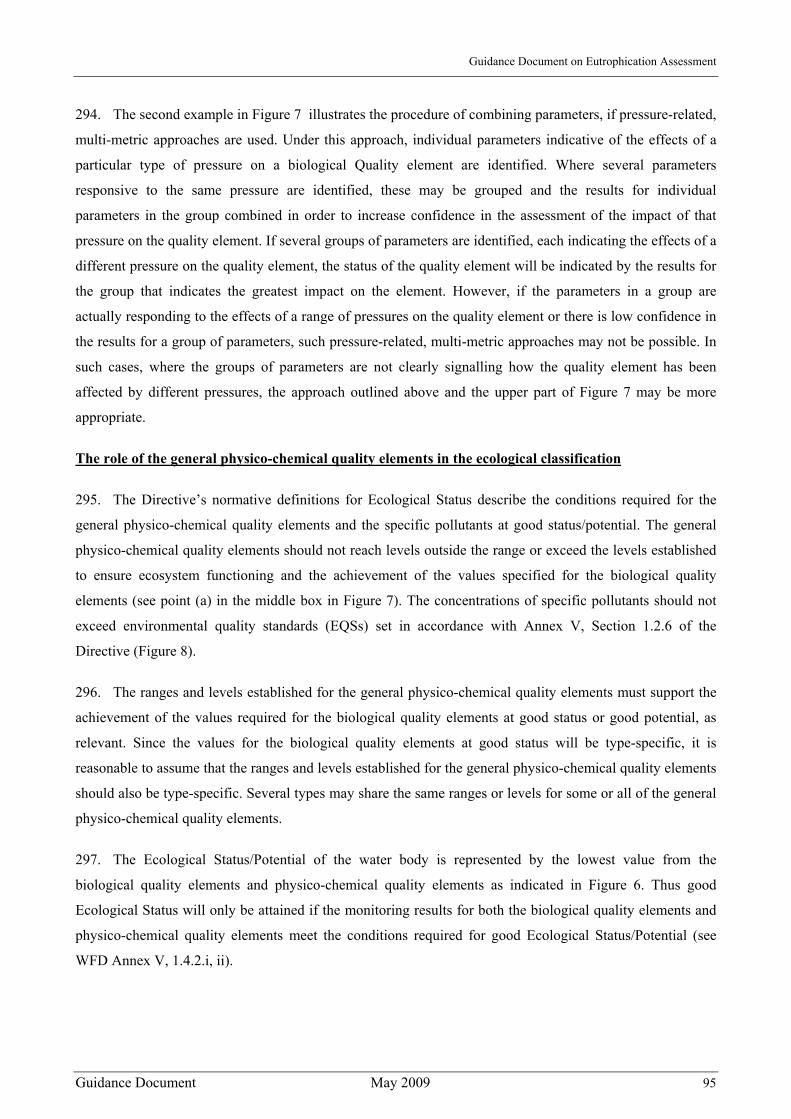
Guidance Document on Eutrophication Assessment
Guidance Document May 2009 95
294. The second example in Figure 7 illustrates the procedure of combining parameters, if pressure-related,
multi-metric approaches are used. Under this approach, individual parameters indicative of the effects of a
particular type of pressure on a biological Quality element are identified. Where several parameters
responsive to the same pressure are identified, these may be grouped and the results for individual
parameters in the group combined in order to increase confidence in the assessment of the impact of that
pressure on the quality element. If several groups of parameters are identified, each indicating the effects of a
different pressure on the quality element, the status of the quality element will be indicated by the results for
the group that indicates the greatest impact on the element. However, if the parameters in a group are
actually responding to the effects of a range of pressures on the quality element or there is low confidence in
the results for a group of parameters, such pressure-related, multi-metric approaches may not be possible. In
such cases, where the groups of parameters are not clearly signalling how the quality element has been
affected by different pressures, the approach outlined above and the upper part of Figure 7 may be more
appropriate.
The role of the general physico-chemical quality elements in the ecological classification
295. The Directive’s normative definitions for Ecological Status describe the conditions required for the
general physico-chemical quality elements and the specific pollutants at good status/potential. The general
physico-chemical quality elements should not reach levels outside the range or exceed the levels established
to ensure ecosystem functioning and the achievement of the values specified for the biological quality
elements (see point (a) in the middle box in Figure 7). The concentrations of specific pollutants should not
exceed environmental quality standards (EQSs) set in accordance with Annex V, Section 1.2.6 of the
Directive (Figure 8).
296. The ranges and levels established for the general physico-chemical quality elements must support the
achievement of the values required for the biological quality elements at good status or good potential, as
relevant. Since the values for the biological quality elements at good status will be type-specific, it is
reasonable to assume that the ranges and levels established for the general physico-chemical quality elements
should also be type-specific. Several types may share the same ranges or levels for some or all of the general
physico-chemical quality elements.
297. The Ecological Status/Potential of the water body is represented by the lowest value from the
biological quality elements and physico-chemical quality elements as indicated in Figure 6. Thus good
Ecological Status will only be attained if the monitoring results for both the biological quality elements and
physico-chemical quality elements meet the conditions required for good Ecological Status/Potential (see
WFD Annex V, 1.4.2.i, ii).
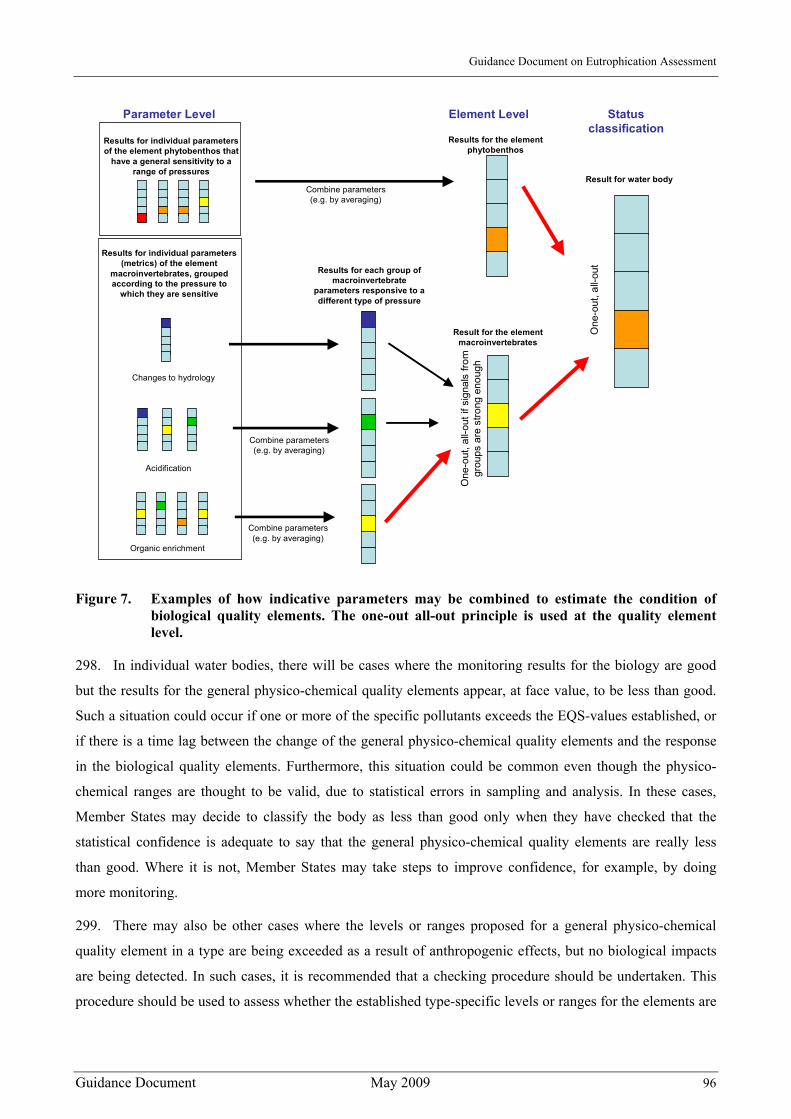
Guidance Document on Eutrophication Assessment
Guidance Document May 2009 96
Results for individual parameters (metrics) of the element
macroinvertebrates, grouped according to the pressure to
which they are sensitive
Acidification
Changes to hydrology
Organic enrichment
Results for each group of macroinvertebrate
parameters responsive to a different type of pressure
Result for the element macroinvertebrates
One
-out
, all-
out i
f sig
nals
from
gr
oups
are
stro
ng e
noug
h
Combine parameters (e.g. by averaging)
Combine parameters (e.g. by averaging)
Result for water body
One
-out
, all-
out
Element LevelParameter Level Status classification
Results for the element phytobenthos
Combine parameters (e.g. by averaging)
Results for individual parameters of the element phytobenthos that
have a general sensitivity to a range of pressures
Figure 7. Examples of how indicative parameters may be combined to estimate the condition of biological quality elements. The one-out all-out principle is used at the quality element level.
298. In individual water bodies, there will be cases where the monitoring results for the biology are good
but the results for the general physico-chemical quality elements appear, at face value, to be less than good.
Such a situation could occur if one or more of the specific pollutants exceeds the EQS-values established, or
if there is a time lag between the change of the general physico-chemical quality elements and the response
in the biological quality elements. Furthermore, this situation could be common even though the physico-
chemical ranges are thought to be valid, due to statistical errors in sampling and analysis. In these cases,
Member States may decide to classify the body as less than good only when they have checked that the
statistical confidence is adequate to say that the general physico-chemical quality elements are really less
than good. Where it is not, Member States may take steps to improve confidence, for example, by doing
more monitoring.
299. There may also be other cases where the levels or ranges proposed for a general physico-chemical
quality element in a type are being exceeded as a result of anthropogenic effects, but no biological impacts
are being detected. In such cases, it is recommended that a checking procedure should be undertaken. This
procedure should be used to assess whether the established type-specific levels or ranges for the elements are
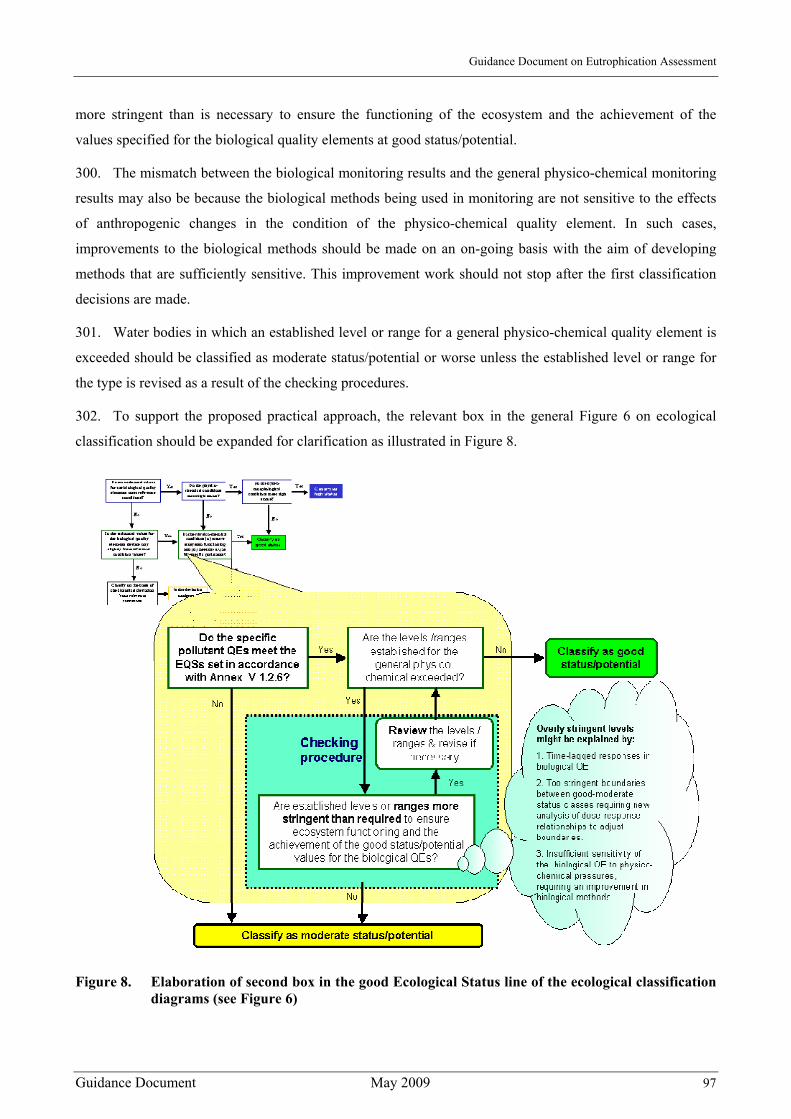
Guidance Document on Eutrophication Assessment
Guidance Document May 2009 97
more stringent than is necessary to ensure the functioning of the ecosystem and the achievement of the
values specified for the biological quality elements at good status/potential.
300. The mismatch between the biological monitoring results and the general physico-chemical monitoring
results may also be because the biological methods being used in monitoring are not sensitive to the effects
of anthropogenic changes in the condition of the physico-chemical quality element. In such cases,
improvements to the biological methods should be made on an on-going basis with the aim of developing
methods that are sufficiently sensitive. This improvement work should not stop after the first classification
decisions are made.
301. Water bodies in which an established level or range for a general physico-chemical quality element is
exceeded should be classified as moderate status/potential or worse unless the established level or range for
the type is revised as a result of the checking procedures.
302. To support the proposed practical approach, the relevant box in the general Figure 6 on ecological
classification should be expanded for clarification as illustrated in Figure 8.
Figure 8. Elaboration of second box in the good Ecological Status line of the ecological classification diagrams (see Figure 6)
Guidance Document on Eutrophication Assessment
Guidance Document May 2009 98
Conclusion
303. The analysis set out in the sections above concludes that the Directive requires the establishment of,
and compliance with, specific values for the physico-chemical quality elements for the high and good
Ecological Status classes as well as for the maximum and good Ecological Potential. For the lower
Ecological Status/Potential classes (i.e. moderate, poor and bad status/potential) it only appears to require the
establishment of, and compliance with, values for the biological quality elements. Where monitoring results
indicate that the condition of the physico-chemical quality elements is worse than good, the status/potential
class assigned to the water body must also be less than good, and should be determined with reference to the
type-specific condition of the biological quality elements.
1.2. Urban Waste Water Treatment Directive (91/271/EEC)
1.2.1. Overview of UWWT Directive
304. The Urban Waste Water Treatment Directive (UWWT Directive) aims to protect the environment
from adverse effects of urban waste water discharges and direct discharges from certain (food processing)
industries. It sets treatment levels on the basis of the agglomeration size and the sensitivity of waters
receiving the discharges.
305. Surface waters must be designated as sensitive areas if, inter alia, they are eutrophic or if they may
become eutrophic in the near future if protective action is not taken (Annex II A(a)). Discharges from
agglomerations of >= 10,000 population equivalent to sensitive areas require more stringent treatment for
nitrogen and/or phosphorus. However, Member States do not have to identify sensitive areas if more
stringent treatment is implemented over the whole of its territory (Article 5 (8)). The designation of sensitive
areas needs to be reviewed at least every four years (Article 5 (6)), and for newly designated sensitive areas
more stringent treatment, with nitrogen and/or phosphorus removal, must be in place within 7 years of their
designation.
306. Sections of the UWWT Directive that particularly refer to eutrophication and surface water monitoring
are: Article 2 (11) which defines eutrophication; Article 5 on the identification of sensitive areas and
treatment requirements; and Annex II, which specifies criteria for identification of sensitive areas.
1.2.2. Conceptual understanding of eutrophication
307. Article 2.(11) of the UWWT Directive defines eutrophication as: "the enrichment of water by
nutrients, especially compounds of nitrogen and/or phosphorus, causing an accelerated growth of algae and
higher forms of plant life to produce an undesirable disturbance to the balance of organisms present in the
water and to the quality of the water concerned".

Guidance Document on Eutrophication Assessment
Guidance Document May 2009 99
308.. This definition implicitly defines eutrophication by the confluence of four criteria80:
• enrichment of water by nutrients;
• accelerated growth of algae and higher forms of plant life;
• an undesirable disturbance to the balance of organisms present in the water
• deterioration of the quality of the water concerned.
309. It focuses more on changes in the aquatic environment rather than a particular state of primary
production. It can apply to waters of any natural trophic state if their ecology or water quality has been
adversely affected or is at risk due to nutrients from urban waste water discharges. The term "anthropogenic"
eutrophication can be used to make this distinction clear.
1.2.3. Methods specified for assessing eutrophication
310. The UWWT Directive does not specify any methods or guideline values for assessing eutrophication81,
which results in Member States developing their own assessment systems and criteria, and may consequently
lead to different levels of protection of their water bodies.
311. Several Member States82 have developed criteria based on the three elements in the definition: nutrient
enrichment, algae or plant life growth and other undesirable effects (e.g. oxygen depletion).
312. When designating sensitive areas, consideration should be given to which nutrient should be reduced
by further treatment.
- "Discharges to lakes and streams reaching lakes/reservoirs/closed bays with poor water exchange.
Whereby accumulation may take place, should have removal of phosphorus unless it can be
demonstrated that the removal will have no effect on the level of eutrophication. Where the discharges
from large agglomerations are made, the removal of nitrogen may be also considered" (Annex II A (a,
i)).
- "Discharges to estuaries, bays and coastal waters with poor water exchange or receiving large
quantities of nutrients should have removal of phosphorus and /or nitrogen unless it can be
demonstrated that the removal will have no effect on the level of eutrophication" (Annex II A (a, ii)).
1.2.4. Relevant Case Law
313. The European Court of Justice (ECJ) is dealing with cases brought by the European Commission
against several Member States, which address the designation of sensitive areas. The Court has recently ruled
on a case brought against France (decision number C-280/02, ECJ judgement on 23/09/2004)83.
80 See also §§ 18 of the ECJ judgement for the case C-280/02 81 Surface freshwaters intended for the abstraction of drinking water must have nitrate levels less than 50 mg
NO3/l, but this is well above concentrations likely to cause eutrophication.
Guidance Document on Eutrophication Assessment
Guidance Document May 2009 100
314. It is related to the breach of the Directive requirements in relation to non-designation of sensitive areas
and lack of infrastructure for 130 agglomerations discharging into sensitive areas. The ECJ ruling addresses
the following points:
a. Broader interpretation of purposes of Directive 91/271/EEC (which is based on the legal base of
the Directive, i.e. Article 130s (now Article 175 EC) in order to achieve the objectives of Article
130r (now Article 174 EC)). It was stated that:
• The objective pursued by Directive 91/271 goes beyond the mere protection of aquatic
ecosystems and attempts to conserve man, fauna, flora, soil, water, air and landscapes from
any significant harmful effects of the accelerated growth of algae and higher forms of plant
life resulting from discharges of urban waste water.
• "undesirability must also be considered to be established where there are significant
harmful effects not only on fauna and flora but also on man, the soil, water, air or
landscape" (pt. 22 of the judgement).
• undesirable disturbances of the balance of organism present in the water are: "species
changes involving loss of ecosystem biodiversity, nuisances due to proliferation of
opportunistic macro algae and sever outbreaks of toxic or harmful phytoplankton" (pt. 23).
b. Important guidance on component parts of definition of "eutrophication" by
• clearly defining that eutrophication is characterised by the confluence of four main criteria
and extensively explaining the meaning of those criteria.
• stating that "for there to be eutrophication, there must be a cause and effect relationship
between enrichment by nutrients and the accelerated growth of algae and higher forms of
plant life on the one hand and, on the other hand, between the accelerated growth and an
undesirable disturbance of the balance of organisms present in the water and to the quality
of the water concerned" (pt. 19).
• highlighting that criterion "deterioration of water quality" means not only deterioration of
the quality of the water which produces harmful effects for ecosystems but also
"deterioration of the colour, the appearance, taste or odour of the water or any change
which prevents or limits water use such as tourism, fishing, fish farming, clamming and
shellfish farming, abstraction of drinking water or cooling of industrial installations." (pt.
24)
82 e.g. UK, Ireland, Portugal. 83 http://curia.eu.int/jurisp/cgi-bin/form.pl?lang=en
Guidance Document on Eutrophication Assessment
Guidance Document May 2009 101
c. Need to decouple duty to designate sensitive areas from whether or not agglomerations with
more than 10 000 population equivalents exist in catchment (pt. 69), but also considering that
(according to pts. 40, 52, 69, 77, 87)
• it is not important to define what percentage of pollution goes from urban waste water
discharges or from agricultural pollution since both of them may contribute to
eutrophication of water body as 91/271/EEC and 91/676/EEC are complimentary. When
urban wastewater discharges involve in combination to nitrate flows of agricultural origin,
Member States have to designate water body in question as being as a sensitive area in
accordance with the directive 91/271/EEC
• the significance of a nutrient loading to a water body should be not only importance of the
percentage of that nutrient input but also of the absolute amount of nutrient in tonnes . The
decision of its importance in the overall nutrient budget has to be taken on case-by-case
basis.
315. It is evident that the interpretation of the European Court of Justice must be used as minimum
requirement for the level of protection in environmental laws of the European Communities. The
interpretation of terms and criteria in this and related judgements must be used as benchmarks for any
assessment method applied under any EC Directive applicable to eutrophication. In particular, the outcome
of the intercalibration exercise and the guidance provided by this document in relation to the WFD
classification must meet, at least, the obligations that can be derived from this judgement.
1.3. Nitrates Directive (91/676/EEC)
1.3.1. Overview of the Nitrates Directive
316. The Nitrates Directive (91/676/EC) aims to reduce water pollution from nitrates stemming from
agricultural sources and to prevent such pollution occurring in the future. The Directive requires Member
States to set up water monitoring programmes, to identify waters affected by pollution or that could be
affected by pollution if no action is taken, to designate vulnerable zones (areas that drain into identified
waters), to establish action programmes for designated vulnerable zones (in order to reduce and/or prevent
further pollution) and to establish codes of good agricultural practices. The codes are to be applied by
farmers on a mandatory basis within vulnerable zones and implemented on a voluntary basis outside those
zones. Member States can opt to apply action programmes throughout their national territory and are in this
case exempted from the obligation to identify specific vulnerable zones.
317. Vulnerable zones cover all land draining to identified waters, including natural freshwater lakes, other
freshwater bodies, estuaries, coastal waters and marine waters which are eutrophic or may become so in the
near future if protective action is not taken (Annex I of the directive).
Guidance Document on Eutrophication Assessment
Guidance Document May 2009 102
318. In order to designate and revise nitrate vulnerable zones, the eutrophic state of surface freshwaters,
estuaries and coastal waters needs to be reviewed and reported every four years (Article 6).
319. Sections of the Nitrates Directive that refer to eutrophication and surface water monitoring are: Article
2(i), which defines eutrophication; Article 3, on the identification of polluted waters and designation of
Vulnerable Zones; Article 5(6) on the monitoring programmes for the purpose of assessing the effectiveness
of action programmes; Article 6, on water monitoring for the purpose of the first designation and revision of
nitrate vulnerable zones; and Annex 1, which specifies criteria for identifying polluted waters.
1.3.2. Conceptual understanding of eutrophication
320. The Nitrates Directive has the same definition of eutrophication as the UWWT Directive except that it
only relates to nitrogen compounds.
1.3.3. Methods specified for assessing eutrophication
321. The Nitrates Directive does not specify any methods or guideline values for assessing eutrophication,
which has resulted in Member States developing their own assessment criteria, and may result in different
levels of protection of their water bodies. However the European Commission has developed a draft
monitoring guidance that includes some preliminary elements for setting eutrophication criteria.
1.3.4. Relevant Case Law
322. Three rulings of the European Court of Justice (ECJ) address specifically the issue of eutrophication
and designation of nitrates vulnerable zones under the Nitrates Directive, the Judgement of 27 June 2002 in
case C 258/00 Commission v France, the Judgement 11 March 2004 in case C 396/01 Commission v Ireland,
and the judgement of 22 September 2005 in case C 221/03 Commission v Belgium.
323. In these cases, the Commission considered that the designation of nitrate vulnerable zones made by the
Member State concerned did not adequately take account of the criterion of eutrophication in identification
of polluted waters and designation of nitrate vulnerable zones, as required by Annex I.A of the Directive. In
the cases related to France and Ireland it was argued by the Member State concerned that the obligation to
identify waters and designate nitrate vulnerable zones in the context of the Nitrates Directive did not arise as
phosphorus was the main factor causing eutrophication. The ECJ rejected this line of argument. For instance,
paragraph 45 of ruling in the case concerning France, stated that "restricting the scope of the Directive to
exclude certain categories of waters owing to the supposedly fundamental role of phosphorus in the pollution
of those waters is incompatible with both the logic and the objective of the Directive". This Case Law
indicated that it is contrary to the Directive to take a restrictive approach in relation to the criterion
concerning eutrophication.
In the case related to Belgium, the Member State argued that Wallonia only makes a small contribution to
Eutrophication of the North Sea and for this should not be considered for designation of vulnerable zones.

Guidance Document on Eutrophication Assessment
Guidance Document May 2009 103
The ECJ rejected this argument by among others stating '(…), it must be observed that, according to a
document supplied by the Belgian Government, Walloon agriculture contributes 19 % of the total nitrogen in
the Meuse basin and 17 % of the total nitrogen in the Escaut basin. Those two rivers cross the Walloon
Region and drain into the North Sea. It must be pointed out that, although minor, those contributions are by
no means insignificant' (paragraph 86 of the ruling).
1.4. Habitats Directive (92/43/EEC)
324. The Habitats Directive (92/43/EEC) requires Member States to designate Special Areas of
Conservation (SACs) (Article 4.4) and Special Protection Areas (SPAs) (Articles 12 and 13) for habitats of
plants and animals listed in Annexes I-IV of the directive. For the habitats and species of selected sites,
measures must be implemented to maintain or restore to ‘a favourable condition’ (i.e. Favourable
Conservation Status). The Conservation Status must be monitored for all habitats and species of Community
interest, and this is not restricted to Natura 2000 sites. The monitoring of habitats can focus on ‘typical
species’.
325. The Conservation Status of a species means the sum of the influences acting on the species concerned
that may affect the long-term distribution and abundance of its populations (Article 1 (i)). Although not
explicitly mentioned in the Directive, the impact of point and diffuse pollution by nutrients on water quality
is an important part of conservation status in aquatic habitats.
326. The Habitats Directive does not specify any methods for assessing eutrophication. However
eutrophication is relevant to the Habitats Directive to the extent that it might affect protected species and
habitats. Nutrient enrichment leading to eutrophication can have significant detrimental effects on specific
aquatic species and habitats. For example, excessive growth of benthic algae from elevated phosphorus can
threaten the habitat for the pearl mussel. More generally, changes in water quality can also help explain
trends in biodiversity.
1.5. Shellfish Waters Directive (79/923/EEC)
327. The Shellfish Waters Directive seeks to protect and improve shellfish waters in order to support
shellfish life and growth and thus to improve the high quality of shellfish products for consumption. The
Directive sets physical, chemical and microbiological water quality requirements that designated shellfish
waters must either comply with or endeavour to meet. The Shellfish Water Directive will be repealed by the
WFD by 2013.
328. The Shellfish Water Directive does not require an assessment of eutrophication per se, however
Article 6 does require a number of parameters to be monitored to check the quality required for shellfish
waters. Some of these parameters are relevant to assessments of eutrophication – in particular dissolved
oxygen and saxitoxins (produced by dinoflagellates).

Guidance Document on Eutrophication Assessment
Guidance Document May 2009 104
329. The Annex of the Shellfish Water Directive requires that dissolved oxygen saturation is monitored
monthly, with a minimum of one sample representative of low oxygen conditions on the day of sampling.
However where major daily variations are suspected, a minimum of two samples should be taken in a day;
95-percent of the samples should be greater than 70 percent saturation. There are standards and monitoring
frequencies specified for saxitoxin.
330. These standards are set to protect shellfish waters and shellfish populations against pollution. They are
absolute and apply regardless of whether the values reflect human induced impacts or naturally poor but
undisturbed conditions.
1.6. Freshwater Fish Directive (78/659/EEC)
331. The purpose of the Freshwater Fish Directive (78/659/EEC) is to protect or improve the quality of
running or standing freshwaters capable of sustaining fish populations. It sets physical and chemical water
quality objectives for salmonid waters and cyprinid waters. Member States must designate salmonid waters
and cyprinid waters and ensure they meet the quality objectives. The Freshwater Fish Directive will be
repealed by the WFD by 2013.
332. There is no direct requirement for an assessment of eutrophication in the Directive. However,
standards are set to safeguard waters capable of supporting fish life from the harmful consequences resulting
from the discharge of pollutant substances into waters (including the reduction of the number of fish
belonging to a certain species). To enable the designated waters to comply with the Directive, Article 6 does
require that designated waters are sampled at a minimum frequency and that the waters comply with the
quality objectives set by the Member States (Article 3). Many of the parameters specified in Annex 1 of the
directive are relevant to eutrophication, for example mandatory minimum values are set for ammonia and
dissolved oxygen, and guideline values are specified for total phosphorus. The values set for phosphorus are
expressed as indicative in order to reduce eutrophication.
1.7. Bathing Water Directive (2006/7/EC)
333. The EU Bathing Water Legislation seeks to protect the environment and public health, by reducing the
pollution of bathing waters and protecting such waters from further deterioration. Bathing waters are
classified as all surface freshwater and seawater, where bathing is authorised by competent authorities of
Member Sates and is not prohibited.
334. Physical, chemical and microbiological parameters applicable to bathing waters are set by the
Directive and all necessary measures taken to ensure that the quality of the bathing water conforms to the
limit values (see Article 3 and Annex). Some concept of type-specific reference conditions is included in
Article 8 of the Directive through the ability to derogate the Directive requirements where deviation from the
prescribed value is caused by exceptional weather or geographic conditions (for certain parameters) or by
natural enrichment of certain substances.

Guidance Document on Eutrophication Assessment
Guidance Document May 2009 105
335. The old Bathing Waters Directive (76/160/EEC) does not require a direct assessment of
eutrophication. However, there is a requirement to monitor several parameters relevant to the assessment of
eutrophication, i.e. transparency (fortnightly) and dissolved oxygen, when the quality of the water has
deteriorated. Furthermore, samples must be collected for ammonia, nitrates and phosphate, and nitrogen
(Kjeldahl) when there is a tendency towards eutrophication of the water.
336. Directive 76/160/EEC was revised and updated through the new Bathing Water Directive 2006/7/EC.
The new Directive is based on scientific knowledge on protecting health and the environment, as well as
environmental management experience, provides better and earlier information for citizens about the quality
of their bathing waters, and moves from simple sampling and monitoring of bathing waters to bathing quality
management. The new Directive is fully integrated into the Water Framework Directive.
337. The new Directive does not maintain the monitoring requirements of the old Directive. It requires only
monitoring of microbiological parameters: Intestinal enterococci and Escherichia coli, but there is a link to
eutrophication parameters, in particular in Article 8 and 9 of the Directive:
• Art. 8: When the bathing water profile indicates a potential for cyanobacterial proliferation84,
appropriate monitoring shall be carried out to enable timely identification of health risks. When
cyanobacterial proliferation occurs and a health risk has been identified or presumed, adequate
management measures shall be taken immediately to prevent exposure, including information to
the public.
• Art. 9: When the bathing water profile indicates a tendency for proliferation of macro-algae and/or
marine phytoplankton, investigations shall be undertaken to determine their acceptability and
health risks and adequate management measures shall be taken, including information to the
public.
338. The new Directive repeals the old Directive (from 31 December 2014) but at present Member States
are free to use both Directives.
1.8. Marine Strategy Framework Directive (2008/56/EC)
339. The Marine Strategy Framework Directive 2008/56/EC (MSFD) establishes a framework within
which Member States shall take the necessary measures to achieve or maintain ‘Good Environmental
Status’(GES) in the marine environment by the year 2020 at the latest. GES is defined according to Article
3(5) as “the environmental status of marine waters where these provide ecologically diverse and dynamic
oceans and seas which are clean, healthy and productive within their intrinsic conditions, and the use of the
marine environment is at a level that is sustainable, thus safeguarding the potential for uses and activities by
current and future generations.”
84 Cyanobacterial proliferation’ means an accumulation of cyanobacteria in the form of a bloom, mat or scum.
Guidance Document on Eutrophication Assessment
Guidance Document May 2009 106
340. The Member States shall pursue this objective through the progressive elaboration of strategies for
their marine waters. Further, GES shall be determined at the level of the marine region or subregion
(specified in MSFD Article 4) on the basis of eleven qualitative ‘descriptors’ specified in MSFD Annex 1.
341. The descriptor 5 regards eutrophication, which is described as: “Human-induced eutrophication is
minimised, especially adverse effects thereof, such as losses in biodiversity, ecosystem degradation, harmful
algae blooms and oxygen deficiency in bottom waters.”
342. Further, the Directive Annex III (Table 2 ‘Pressures and Impacts’) includes two pressures (i.e. nutrient
and organic enrichment) that need to be considered in the determination of GES and that influence
compliance with the eutrophication descriptor.
343. The implementation of the MSFD is at a start and one of the main aspects of the work in the first
phase will be the development of criteria and methodological standards for the descriptors of GES (July 2010
in accordance with Article 9(3)).
344. It is particularly important that this work consider the links, overlap and synergies with existing
policies and Directives. A most important link is expected with the Water Framework Directive (WFD).
Indeed the concept of Good Environmental Status in the Marine Directive is very similar to that of the Good
Ecological Status in the WFD, and the marine Directive explicitly recognizes the need to develop approaches
in accordance with the WFD. This is particularly relevant for the eutrophication.
1.9. National Emission Ceilings for Atmospheric Pollutants Directive (2001/81/EC)
345. The Emission Ceilings Directive (2001/81/EC) aims to limit atmospheric emissions of acidifying and
eutrophying pollutants and ozone precursors in order to improve the protection of the environment and
human health. The protection will be against the adverse effects of acidification, eutrophication and ground
level ozone. The long-term objectives of the Directive are to establish national emission ceilings aiming at
avoiding exceedances of critical loads and levels85 and to protect all people against recognised health risks
from air emissions.
346. The Emissions Ceilings Directive covers atmospheric emissions from Member States which arise as a
result of human activity. It is expected that Member States will lower their annual national emissions of
acidifying and eutrophying substances (i.e. sulphur dioxide, nitrogen oxides and ammonia) to levels not
greater than those laid down in Annex I by 2010 (Article 4 and 5). Meeting these objectives is expected to
result in a reduction of water and soil eutrophication by deposition of nitrogen.
347. There is no direct requirement for an assessment of eutrophication in the Directive. However, the
Directive does refer to the quantitative relationship between the emission levels of pollutants and levels of
85 The concept of critical load and level is defined in the Working Group on Effects under the LRTAP Convention, see: http://www.unece.org/env/wge/definitions.htm
Guidance Document on Eutrophication Assessment
Guidance Document May 2009 107
eutrophication. This is based on the exceedance of critical loads at which level the pollutants have a
significant adverse effect on the environment, in this instance causing eutrophication, acidification and the
formation of ground level ozone.
348. Following the adoption of the Thematic Strategy on air pollution in September 2005, new objectives
for eutrophication, acidification, ozone and health have been defined to be met in 2020. The NEC Directive
will be reviewed accordingly in 2006. The objective for what concerns eutrophication is a reduction of 43 %
of the ecosystems in which the critical loads are exceeded as to compare to 2000 situation.
2. OVERVIEW OF WORK ON EUTROPHICATION IN OTHER INTERNATIONAL POLICIES
349. The control of eutrophication is addressed by a number of international and regional conventions,
agreements and policies. These include OSPAR, HELCOM, PARCOM, the Barcelona Convention, the
Bucharest Convention, UNECE-LRTAP as well as several river basin conventions such as the Rhine, the
Elbe, and the Danube Protection Convention. These are briefly described in Table 11. The rest of this section
focuses on the approach taken by the marine conventions.
2.1. OSPAR Convention for the Protection of the Marine Environment of the North-East Atlantic
Aims of the OSPAR Convention
350. OSPAR is the mechanism by which 15 governments of the Western coasts and catchments of Europe,
together with the European Community, cooperate to protect the marine environment of the North-East
Atlantic. The mission is to conserve marine ecosystems and safeguard human health in the Convention Area
by preventing and eliminating pollution; by protecting the marine environment from adverse effects of
human activities and by contributing to the sustainable use of the seas. OSPAR's work is organised under six
strategies, applying the ecosystem approach. There are obvious synergies between the objectives and
measures taken in the context of OSPAR and those of the Water Framework Directive. The geographical
scope of OSPAR is, however, broader, as it covers the whole maritime area.
The OSPAR Eutrophication Strategy
351. The OSPAR Eutrophication Strategy sets the objective to combat eutrophication in the OSPAR
maritime area, in order to achieve and maintain by 2010 a healthy marine environment where eutrophication
does not occur. The strategy builds on long-standing commitments of OSPAR Contracting Parties to achieve
a substantial reduction at source, in the order of 50 % compared to 1985, in inputs of phosphorus and
nitrogen into areas where these inputs are likely, directly or indirectly, to cause pollution (see also PARCOM
Recommendations 88/286, 89/487 and 92/788).
86 http://www.ospar.org/v_measures/get_page.asp?v0=pr88-02e.doc&v1=4
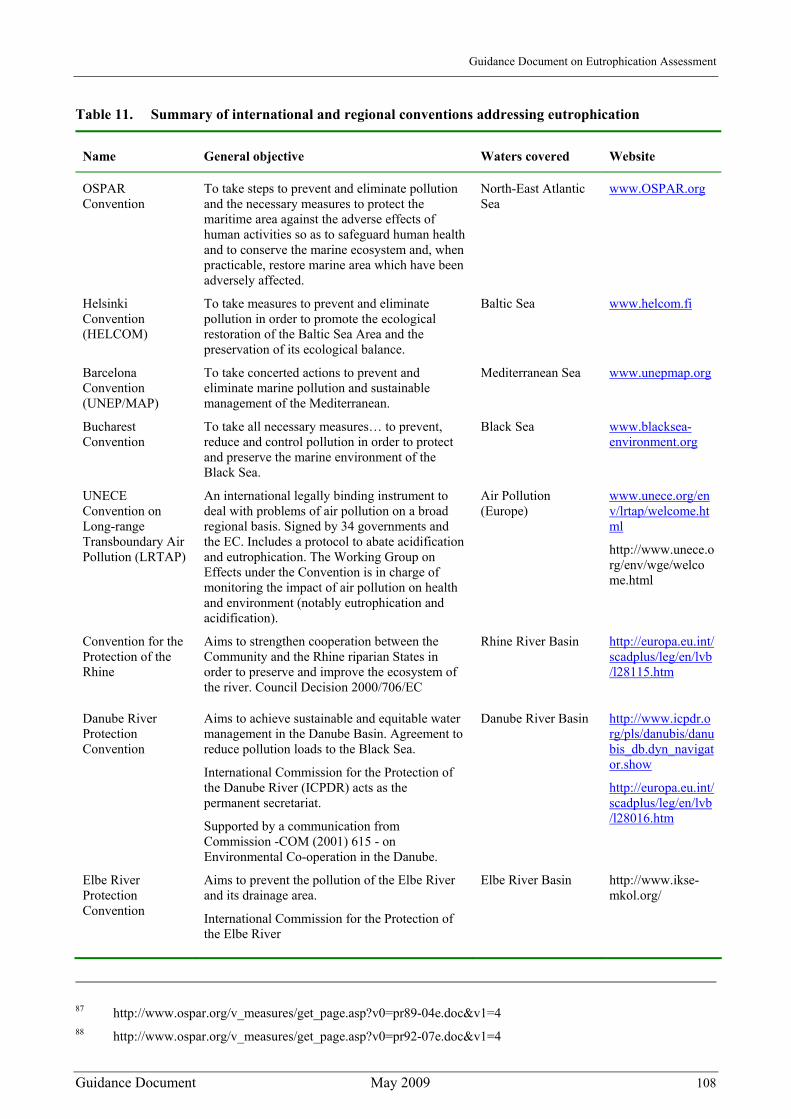
Guidance Document on Eutrophication Assessment
Guidance Document May 2009 108
Table 11. Summary of international and regional conventions addressing eutrophication
Name General objective Waters covered Website
OSPAR Convention
To take steps to prevent and eliminate pollution and the necessary measures to protect the maritime area against the adverse effects of human activities so as to safeguard human health and to conserve the marine ecosystem and, when practicable, restore marine area which have been adversely affected.
North-East Atlantic Sea
www.OSPAR.org
Helsinki Convention (HELCOM)
To take measures to prevent and eliminate pollution in order to promote the ecological restoration of the Baltic Sea Area and the preservation of its ecological balance.
Baltic Sea www.helcom.fi
Barcelona Convention (UNEP/MAP)
To take concerted actions to prevent and eliminate marine pollution and sustainable management of the Mediterranean.
Mediterranean Sea www.unepmap.org
Bucharest Convention
To take all necessary measures… to prevent, reduce and control pollution in order to protect and preserve the marine environment of the Black Sea.
Black Sea www.blacksea-environment.org
UNECE Convention on Long-range Transboundary Air Pollution (LRTAP)
An international legally binding instrument to deal with problems of air pollution on a broad regional basis. Signed by 34 governments and the EC. Includes a protocol to abate acidification and eutrophication. The Working Group on Effects under the Convention is in charge of monitoring the impact of air pollution on health and environment (notably eutrophication and acidification).
Air Pollution (Europe)
www.unece.org/env/lrtap/welcome.html
http://www.unece.org/env/wge/welcome.html
Convention for the Protection of the Rhine
Aims to strengthen cooperation between the Community and the Rhine riparian States in order to preserve and improve the ecosystem of the river. Council Decision 2000/706/EC
Rhine River Basin http://europa.eu.int/scadplus/leg/en/lvb/l28115.htm
Danube River Protection Convention
Aims to achieve sustainable and equitable water management in the Danube Basin. Agreement to reduce pollution loads to the Black Sea.
International Commission for the Protection of the Danube River (ICPDR) acts as the permanent secretariat.
Supported by a communication from Commission -COM (2001) 615 - on Environmental Co-operation in the Danube.
Danube River Basin http://www.icpdr.org/pls/danubis/danubis_db.dyn_navigator.show
http://europa.eu.int/scadplus/leg/en/lvb/l28016.htm
Elbe River Protection Convention
Aims to prevent the pollution of the Elbe River and its drainage area.
International Commission for the Protection of the Elbe River
Elbe River Basin http://www.ikse-mkol.org/
87 http://www.ospar.org/v_measures/get_page.asp?v0=pr89-04e.doc&v1=4 88 http://www.ospar.org/v_measures/get_page.asp?v0=pr92-07e.doc&v1=4
Guidance Document on Eutrophication Assessment
Guidance Document May 2009 109
352. PARCOM recommendation 89/4 deals with the set up of national action plans to reach the aims set out
in PARCOM Recommendations 88/2. PARCOM recommendation 92/7 dealt with the implementation of
appropriate reduction measures in the agricultural sector.
353. The implementation of the Eutrophication Strategy takes place within the framework of obligations
and commitments of the various Contracting Parties under international agreements. This includes EC
legislation to reduce nutrient discharges and emissions, including the Nitrates Directive, Urban Waste Water
Treatment Directive, the Water Framework Directive and the Marine Strategy Framework Directive.
354. To assist Contracting Parties in identifying these areas in a consistent way and to periodically assess
the eutrophication status of the OSPAR maritime area and progress made towards the Strategy's objective,
OSPAR developed a common harmonised assessment framework: the Common Procedure for the
Identification of the Eutrophication Status of the OSPAR Maritime Area (Agreement 2005-3).
Eutrophication monitoring
355. OSPAR's respective assessment work is supported by monitoring under the Eutrophication Monitoring
Programme and by monitoring to estimate waterborne and atmospheric inputs of nutrients to the OSPAR
maritime area under the RID (Riverine Inputs and Direct Discharges) Study and the CAMP (Comprehensive
Atmospheric Monitoring Programme) monitoring programme.
2.1.1. Eutrophication assessment
356. OSPAR has developed a harmonised assessment of eutrophication through the Common Procedure to
identify the regions of the OSPAR Marine Area in which the recommendations mentioned above apply.
OSPAR defines "eutrophication" as the enrichment of water by nutrients causing an accelerated growth of
algae and higher forms of plant life to produce an undesirable disturbance to the balance of organisms
present in the water and to the quality of the water concerned, and therefore refers to the undesirable effects
resulting from anthropogenic enrichment by nutrients as described in the OSPAR Common Procedure.
357. The Common Procedure consists of an initial screening procedure (a "one-off broad-brush approach")
to identify obvious non-problem areas, followed by the application of the Comprehensive Procedure to
identify whether other waters should be classified as (potential) problem areas or non-problem areas with
respect to eutrophication. The Comprehensive procedure is applied as an iterative process, with periodic
reassessments and feedback from its application being used to refine the procedure. The screening procedure
has been finalised in 2004.
358. The Comprehensive Procedure (COMPP) consists of a set of assessment criteria that are linked to
form a holistic assessment of eutrophication status (OSPAR Commission 2005-3). It is based on a conceptual
Guidance Document on Eutrophication Assessment
Guidance Document May 2009 110
framework of the eutrophication process and a checklist of qualitative parameters for a holistic assessment.
The widely used uniform assessment procedure with respect to yearly trends and elevated concentrations of
DIN and DIP in winter, and silicate in salinity gradient (riverine influenced) waters is as follows:
a. Mixing diagrams and salinity-specific background concentrations:
In marine coastal waters with salinity gradients yearly trends in winter nutrient concentrations are
assessed by plotting the winter nutrient concentrations of each year in relation to the respective
measured salinity values ("mixing diagrams"). In winter, defined as period when algal activity is
lowest, DIN and DIP (but also silicate) show a conservative behaviour and, therefore, a good linear
relationship with salinity (decreasing concentration with increasing salinity from coast to offshore).
b. Trends and increased concentrations compared with salinity-specific background concentrations:
In order to compensate for differences in salinity at the various locations and during the various years,
nutrient concentrations are normalised for salinity. This is done by calculating the winter nutrient
concentration at a given salinity (e.g. 30) from the mixing diagram of a particular year. The salinity
normalised nutrient concentration (with 95 % confidence interval) is plotted in relation to the
respective year in order to establish trends in the winter nutrient concentrations and the assessment
level (compared with background concentration).
359. The conceptual framework and these categories take into account interactions and cause and effect
relationships. The conceptual framework is further discussed in section 2.2 along side a modified version of
the COMPP holistic checklist.
360. Harmonised quantitative criteria linking assessment parameters have been developed for a sub-group
of the checklist, as shown in Table 12. The results of this assessment are combined using a matrix to
distinguish problem areas from non-problem areas, as shown in Table 13.
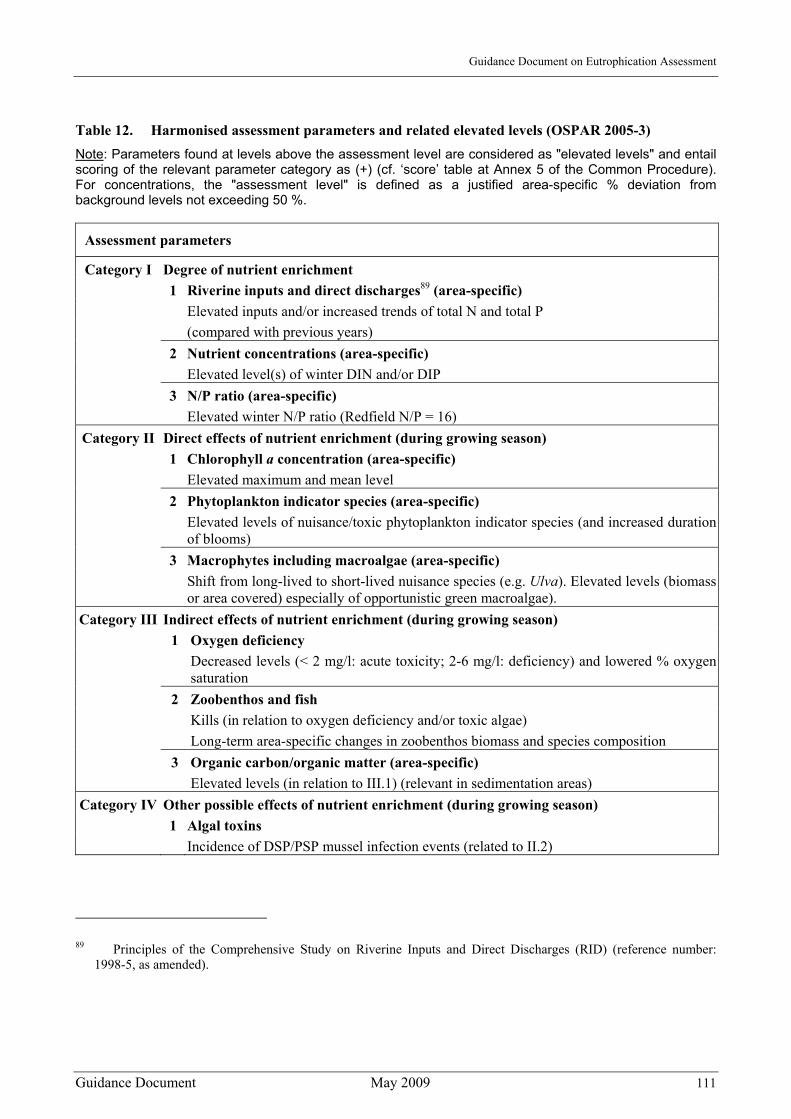
Guidance Document on Eutrophication Assessment
Guidance Document May 2009 111
Table 12. Harmonised assessment parameters and related elevated levels (OSPAR 2005-3) Note: Parameters found at levels above the assessment level are considered as "elevated levels" and entail scoring of the relevant parameter category as (+) (cf. ‘score’ table at Annex 5 of the Common Procedure). For concentrations, the "assessment level" is defined as a justified area-specific % deviation from background levels not exceeding 50 %.
Assessment parameters
Category I Degree of nutrient enrichment 1 Riverine inputs and direct discharges89 (area-specific)
Elevated inputs and/or increased trends of total N and total P (compared with previous years) 2 Nutrient concentrations (area-specific) Elevated level(s) of winter DIN and/or DIP 3 N/P ratio (area-specific) Elevated winter N/P ratio (Redfield N/P = 16)
Category II Direct effects of nutrient enrichment (during growing season) 1 Chlorophyll a concentration (area-specific)
Elevated maximum and mean level 2 Phytoplankton indicator species (area-specific) Elevated levels of nuisance/toxic phytoplankton indicator species (and increased duration
of blooms) 3 Macrophytes including macroalgae (area-specific) Shift from long-lived to short-lived nuisance species (e.g. Ulva). Elevated levels (biomass
or area covered) especially of opportunistic green macroalgae). Category III Indirect effects of nutrient enrichment (during growing season)
1 Oxygen deficiency Decreased levels (< 2 mg/l: acute toxicity; 2-6 mg/l: deficiency) and lowered % oxygen
saturation 2 Zoobenthos and fish Kills (in relation to oxygen deficiency and/or toxic algae)
Long-term area-specific changes in zoobenthos biomass and species composition 3 Organic carbon/organic matter (area-specific)
Elevated levels (in relation to III.1) (relevant in sedimentation areas) Category IV Other possible effects of nutrient enrichment (during growing season)
1 Algal toxins Incidence of DSP/PSP mussel infection events (related to II.2)
89 Principles of the Comprehensive Study on Riverine Inputs and Direct Discharges (RID) (reference number: 1998-5, as amended).
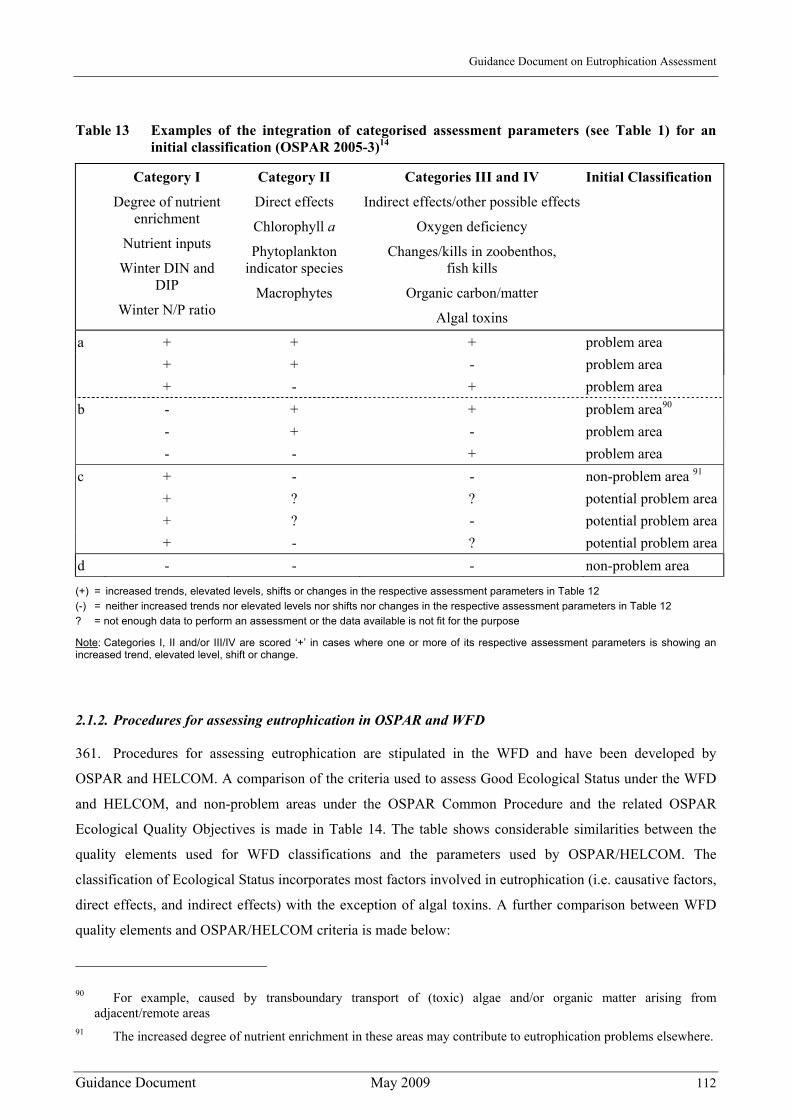
Guidance Document on Eutrophication Assessment
Guidance Document May 2009 112
Table 13 Examples of the integration of categorised assessment parameters (see Table 1) for an initial classification (OSPAR 2005-3)14
Category I
Degree of nutrient enrichment
Nutrient inputs
Winter DIN and DIP
Winter N/P ratio
Category II
Direct effects
Chlorophyll a
Phytoplankton indicator species
Macrophytes
Categories III and IV
Indirect effects/other possible effects
Oxygen deficiency
Changes/kills in zoobenthos, fish kills
Organic carbon/matter
Algal toxins
Initial Classification
+ + + problem area + + - problem area
a
+ - + problem area - + + problem area90 - + - problem area
b
- - + problem area + - - non-problem area 91
+ ? ? potential problem area+ ? - potential problem area
c
+ - ? potential problem aread - - - non-problem area
(+) = increased trends, elevated levels, shifts or changes in the respective assessment parameters in Table 12 (-) = neither increased trends nor elevated levels nor shifts nor changes in the respective assessment parameters in Table 12 ? = not enough data to perform an assessment or the data available is not fit for the purpose
Note: Categories I, II and/or III/IV are scored ‘+’ in cases where one or more of its respective assessment parameters is showing an increased trend, elevated level, shift or change.
2.1.2. Procedures for assessing eutrophication in OSPAR and WFD
361. Procedures for assessing eutrophication are stipulated in the WFD and have been developed by
OSPAR and HELCOM. A comparison of the criteria used to assess Good Ecological Status under the WFD
and HELCOM, and non-problem areas under the OSPAR Common Procedure and the related OSPAR
Ecological Quality Objectives is made in Table 14. The table shows considerable similarities between the
quality elements used for WFD classifications and the parameters used by OSPAR/HELCOM. The
classification of Ecological Status incorporates most factors involved in eutrophication (i.e. causative factors,
direct effects, and indirect effects) with the exception of algal toxins. A further comparison between WFD
quality elements and OSPAR/HELCOM criteria is made below:
90 For example, caused by transboundary transport of (toxic) algae and/or organic matter arising from adjacent/remote areas
91 The increased degree of nutrient enrichment in these areas may contribute to eutrophication problems elsewhere.
Guidance Document on Eutrophication Assessment
Guidance Document May 2009 113
Phytoplankton – the WFD requires ‘composition, abundance and biomass of phytoplankton’ for all
water body categories with exception of rivers. OSPAR has identified area-specific phytoplankton
indicator species as an important element of composition, has set abundance thresholds for these
species; OSPAR and HELCOM have defined area-specific reference conditions and thresholds for
chlorophyll a, as an operational indicator of phytoplankton biomass. Furthermore, HEAT uses water
transparency as an assessment criterion for the eutrophication status.
Aquatic flora – the WFD requires the assessment of the ‘composition and abundance of other aquatic
flora’ for all water body categories. OSPAR and HELCOM have agreed that shifts in species
composition and aerial coverage of macrophytes/macroalgae should be assessed at an area-specific
level (e.g. for the OSPAR Wadden Sea area or beaches and shallow waters of the Baltic Sea).
Assessments seek to distinguish long-lived from short-lived nuisance species. In addition, HEAT is
considering limited depth distribution of submerged aquatic flora as an effect of eutrophication.
Benthic invertebrate fauna – the WFD requires the assessment of the ‘composition and abundance of
benthic invertebrate fauna’ for all water body categories. OSPAR has not developed this criterion in
depth for the time being, and simply seeks to distinguish long-term changes in zoobenthos species
composition. However, these changes can also be caused by other factors like bottom trawling which
may have an overriding effect compared with eutrophication effects. Kills of benthic fauna due to
anoxia events and toxic phytoplankton (if caused by eutrophication) are used as more qualitative
(descriptive) assessment criteria for assessing (non)occurrence of these events without any quantitative
consideration. HEAT is evaluating the composition of animal communities living on the sea floor as a
yardstick for eutrophication such as increasing organic enrichment of sediments.
Fish – the WFD requires the assessment of the ‘composition, abundance and age structure of fish
fauna’ for all water body categories with exception of coastal waters. OSPAR is considering the
criterion of fish kills due to anoxia events and toxic phytoplankton caused by eutrophication. It is used
as a more qualitative (descriptive) criterion for assessing (non)occurrence of these events without any
quantitative consideration.
Other elements – the WFD requires also the assessment of hydromorphological and physico-chemical
quality elements supporting the biological quality elements. OSPAR and HELOM have developed
thresholds for nutrients (OSPAR and HELCOM: winter DIN and DIP concentrations, HELCOM:
annual means for TN and TP; OSPAR winter N:P ratios), and for oxygen. OSPAR and HELCOM also
take into account possible trends in riverine loads and direct nutrient inputs to the maritime area in the
assessment. OSPAR recognises a set of supporting environmental elements but these are not used in
the same way as in the WFD.
362. Assessments under the WFD cover all types of pressures, whereas the OSPAR COMPP and HEAT are
focused on the impact of nutrient enrichment. A further difference between OSPAR COMPP, HEAT and the

Guidance Document on Eutrophication Assessment
Guidance Document May 2009 114
WFD is the methodology by which the various elements are integrated in the final assessment. The WFD and
HEAT compare the deviation of recent monitoring data from type-specific reference conditions to calculate
an EQR, and base the Ecological Status on the quality element with the worst status (one-out all-out
principle). The OSPAR COMPP uses area-specific/historical reference levels for each criterion and has an
additive process across the four categories (causative factors, direct effects, indirect effects and other
possible effects) to integrate the results of the parameters considered. The result is – as for the WFD – driven
by the worst result within each category (nutrient enrichment, direct effects, and indirect effects). The initial
outcome might be reviewed, taking into account the influence of environmental factors.
2.1.3. Water body typology
363. The OSPAR, HELCOM and WFD methods to assess eutrophication are based on recognition of
differences between different types of waters. Typology forms the basis for classifications under the WFD
since reference conditions for the biological elements are type-specific. Two systems for typing are
prescribed and Member States must apply one of them. OSPAR has developed a procedure to derive a
Characterisation of the OSPAR Convention area:
364. In order to enable area-specific reference conditions to be established, there might be a need for
Contracting Parties to carry out an analysis of the relevant characteristics ("typology") for their parts of the
OSPAR maritime area. Relating thereto, further relevant information can be found in the Quality Status
Reports for the North Sea and the whole OSPAR maritime area (QSR 1993 and QSR 2000).
365. For transitional (e.g. estuarine) and coastal waters falling under the regime of the Water Framework
Directive, the respective typology could be used also for the application of the Common Procedure. When
carrying out the characterisation, Contracting Parties should focus on the overall purpose of the Common
Procedure to identify the eutrophication status of various parts of the OSPAR maritime area.
366. If Contracting Parties see a need to (further) divide their waters outside the area of jurisdiction of the
Water Framework Directive, the factors such as
a. salinity gradients and regimes, b. depth, c. mixing characteristics (such as fronts, stratification), d. transboundary fluxes, e. upwelling, f. sedimentation, g. residence time/retention time, h. mean water temperature (water temperature range), i. turbidity (expressed in terms of suspended matter), j. mean substrate composition (in terms of sediment types), and k. typology of offshore waters
can assist in the characterisation.
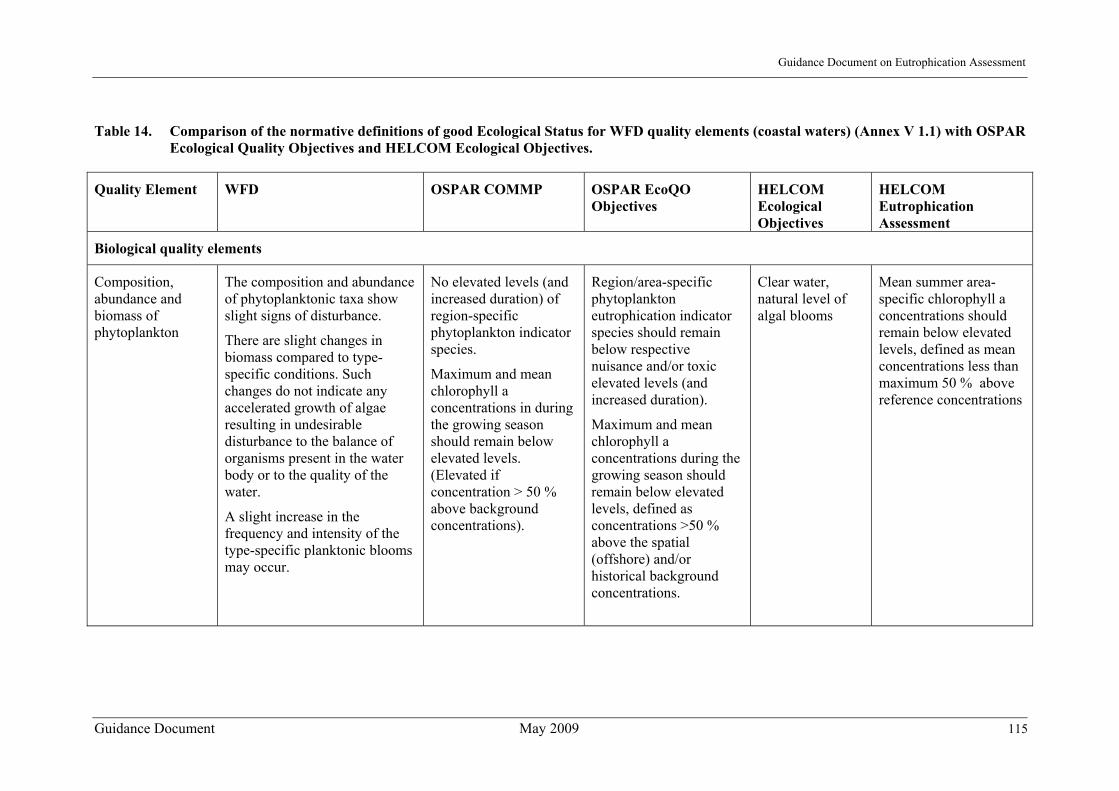
Guidance Document on Eutrophication Assessment
Guidance Document May 2009 115
Table 14. Comparison of the normative definitions of good Ecological Status for WFD quality elements (coastal waters) (Annex V 1.1) with OSPAR Ecological Quality Objectives and HELCOM Ecological Objectives.
Quality Element WFD OSPAR COMMP OSPAR EcoQO Objectives
HELCOM Ecological Objectives
HELCOM Eutrophication Assessment
Biological quality elements
Composition, abundance and biomass of phytoplankton
The composition and abundance of phytoplanktonic taxa show slight signs of disturbance.
There are slight changes in biomass compared to type-specific conditions. Such changes do not indicate any accelerated growth of algae resulting in undesirable disturbance to the balance of organisms present in the water body or to the quality of the water.
A slight increase in the frequency and intensity of the type-specific planktonic blooms may occur.
No elevated levels (and increased duration) of region-specific phytoplankton indicator species.
Maximum and mean chlorophyll a concentrations in during the growing season should remain below elevated levels. (Elevated if concentration > 50 % above background concentrations).
Region/area-specific phytoplankton eutrophication indicator species should remain below respective nuisance and/or toxic elevated levels (and increased duration).
Maximum and mean chlorophyll a concentrations during the growing season should remain below elevated levels, defined as concentrations >50 % above the spatial (offshore) and/or historical background concentrations.
Clear water, natural level of algal blooms
Mean summer area-specific chlorophyll a concentrations should remain below elevated levels, defined as mean concentrations less than maximum 50 % above reference concentrations

Guidance Document on Eutrophication Assessment
Guidance Document May 2009 116
Quality Element WFD OSPAR COMMP OSPAR EcoQO Objectives
HELCOM Ecological Objectives
HELCOM Eutrophication Assessment
Composition and abundance of aquatic flora
(macroalgae and angiosperms)
Most disturbance-sensitive macroalgal and angiosperm taxa associated with undisturbed conditions are present.
The level of macroalgal cover and angiosperm abundance show slight signs of disturbance.
Macrophytes including macroalgae: no shifts from long-lived to short-lived nuisance species (e.g. Ulva, Enteromorpha). No reduced depth distribution.
- Natural distribution and occurrence of plants
Depth distributions of bladderwrack and eelgrass close to those of undisturbed conditions (maximum – 25 % deviation from reference conditions)
Composition and abundance of benthic invertebrate fauna,
The level of diversity and abundance of invertebrate taxa is slightly outside the range associated with the type-specific conditions.
Most of the sensitive taxa of the type-specific communities are present.
No kills in zoobenthos due to oxygen deficiency and/or toxic algae)
No long term changes in zoobenthos species composition.
There should be no kills in benthic animal species as a result of oxygen deficiency and/or toxic phytoplankton species.
Natural distribution and occurrence of animals, natural oxygen levels
Regional diversity of benthic invertebrates is within the natural variability for the assessed region
Composition, abundance and age structure of fish (T)
The abundance of the disturbance-sensitive species shows slight signs of distortion from type-specific conditions attributable to anthropogenic impacts on physicochemical or hydromorphological quality elements.
No kills in fish due to oxygen deficiency and/or toxic algae).
There should be no kills in benthic animal species as a result of oxygen deficiency and/or toxic phytoplankton species.
- -
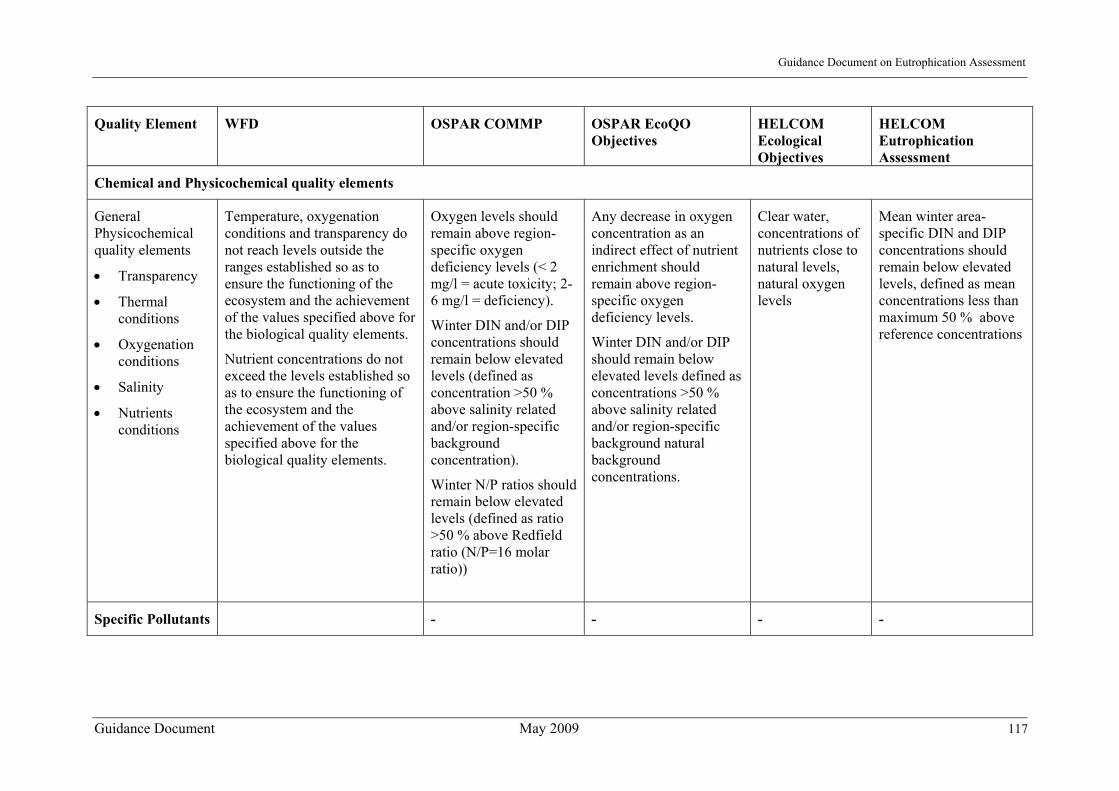
Guidance Document on Eutrophication Assessment
Guidance Document May 2009 117
Quality Element WFD OSPAR COMMP OSPAR EcoQO Objectives
HELCOM Ecological Objectives
HELCOM Eutrophication Assessment
Chemical and Physicochemical quality elements
General Physicochemical quality elements
• Transparency
• Thermal conditions
• Oxygenation conditions
• Salinity
• Nutrients conditions
Temperature, oxygenation conditions and transparency do not reach levels outside the ranges established so as to ensure the functioning of the ecosystem and the achievement of the values specified above for the biological quality elements.
Nutrient concentrations do not exceed the levels established so as to ensure the functioning of the ecosystem and the achievement of the values specified above for the biological quality elements.
Oxygen levels should remain above region-specific oxygen deficiency levels (< 2 mg/l = acute toxicity; 2-6 mg/l = deficiency).
Winter DIN and/or DIP concentrations should remain below elevated levels (defined as concentration >50 % above salinity related and/or region-specific background concentration).
Winter N/P ratios should remain below elevated levels (defined as ratio >50 % above Redfield ratio (N/P=16 molar ratio))
Any decrease in oxygen concentration as an indirect effect of nutrient enrichment should remain above region-specific oxygen deficiency levels.
Winter DIN and/or DIP should remain below elevated levels defined as concentrations >50 % above salinity related and/or region-specific background natural background concentrations.
Clear water, concentrations of nutrients close to natural levels, natural oxygen levels
Mean winter area-specific DIN and DIP concentrations should remain below elevated levels, defined as mean concentrations less than maximum 50 % above reference concentrations
Specific Pollutants - - - -
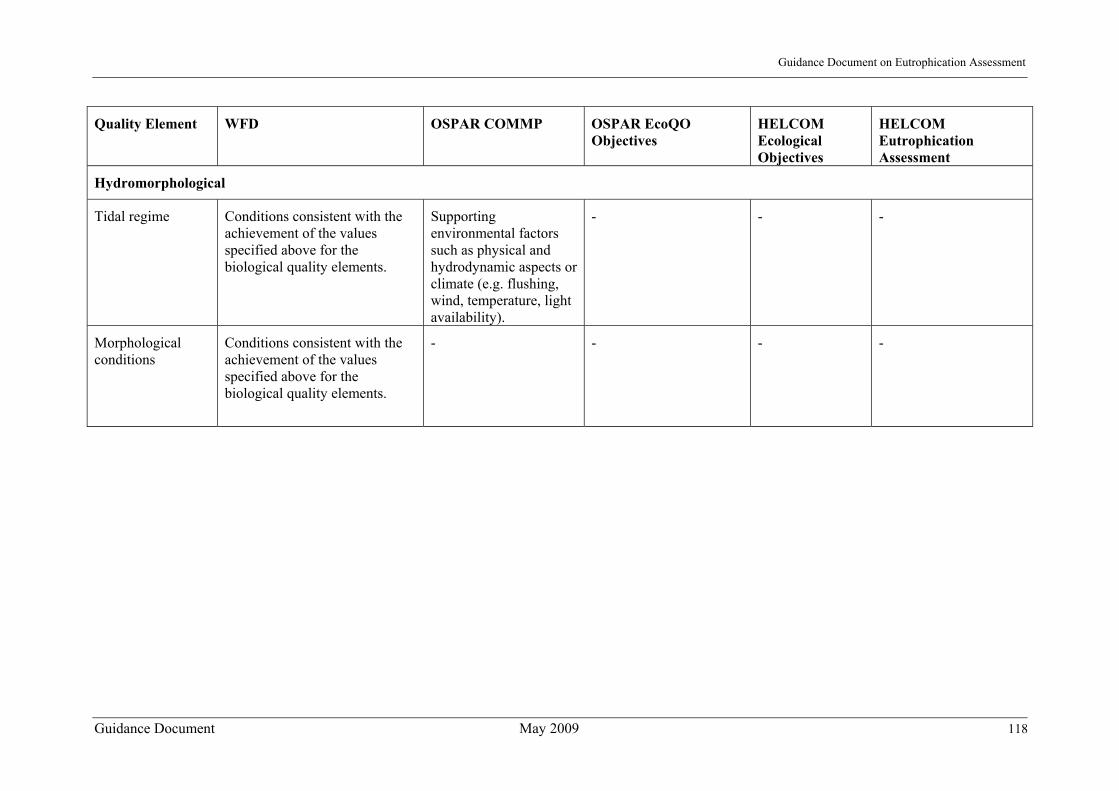
Guidance Document on Eutrophication Assessment
Guidance Document May 2009 118
Quality Element WFD OSPAR COMMP OSPAR EcoQO Objectives
HELCOM Ecological Objectives
HELCOM Eutrophication Assessment
Hydromorphological
Tidal regime Conditions consistent with the achievement of the values specified above for the biological quality elements.
Supporting environmental factors such as physical and hydrodynamic aspects or climate (e.g. flushing, wind, temperature, light availability).
- - -
Morphological conditions
Conditions consistent with the achievement of the values specified above for the biological quality elements.
- - - -
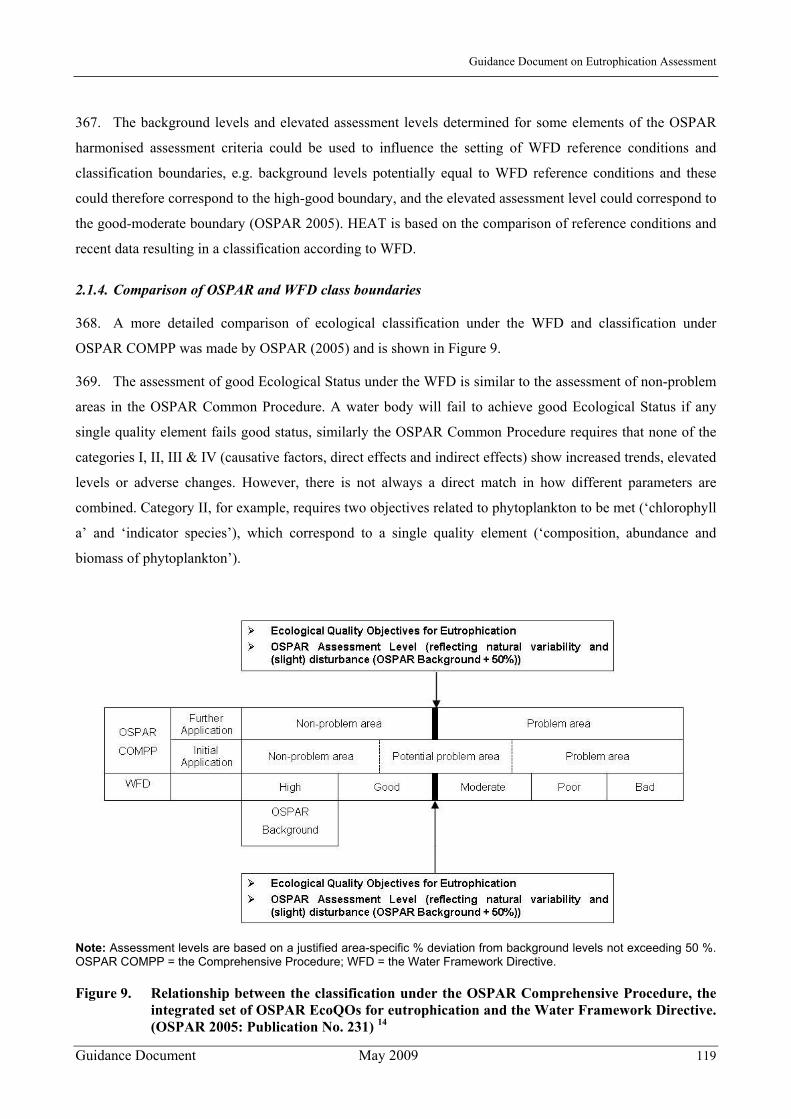
Guidance Document on Eutrophication Assessment
Guidance Document May 2009 119
367. The background levels and elevated assessment levels determined for some elements of the OSPAR
harmonised assessment criteria could be used to influence the setting of WFD reference conditions and
classification boundaries, e.g. background levels potentially equal to WFD reference conditions and these
could therefore correspond to the high-good boundary, and the elevated assessment level could correspond to
the good-moderate boundary (OSPAR 2005). HEAT is based on the comparison of reference conditions and
recent data resulting in a classification according to WFD.
2.1.4. Comparison of OSPAR and WFD class boundaries
368. A more detailed comparison of ecological classification under the WFD and classification under
OSPAR COMPP was made by OSPAR (2005) and is shown in Figure 9.
369. The assessment of good Ecological Status under the WFD is similar to the assessment of non-problem
areas in the OSPAR Common Procedure. A water body will fail to achieve good Ecological Status if any
single quality element fails good status, similarly the OSPAR Common Procedure requires that none of the
categories I, II, III & IV (causative factors, direct effects and indirect effects) show increased trends, elevated
levels or adverse changes. However, there is not always a direct match in how different parameters are
combined. Category II, for example, requires two objectives related to phytoplankton to be met (‘chlorophyll
a’ and ‘indicator species’), which correspond to a single quality element (‘composition, abundance and
biomass of phytoplankton’).
Note: Assessment levels are based on a justified area-specific % deviation from background levels not exceeding 50 %. OSPAR COMPP = the Comprehensive Procedure; WFD = the Water Framework Directive.
Figure 9. Relationship between the classification under the OSPAR Comprehensive Procedure, the integrated set of OSPAR EcoQOs for eutrophication and the Water Framework Directive. (OSPAR 2005: Publication No. 231) 14
Guidance Document on Eutrophication Assessment
Guidance Document May 2009 120
2.2. Helsinki Convention on the Protection of the Marine Environment of the Baltic Sea
2.2.1. Aims of the Helsinki Convention92
370. The Helsinki Convention aims to protect the marine environment of the Baltic Sea from all sources of
pollution, and to restore and safeguard its ecological balance. The Helsinki Commission operates through
intergovernmental co-operation and is the governing body of the "Convention on the Protection of the
Marine Environment of the Baltic Sea Area" (known as the Helsinki Convention).
2.2.2. HELCOM work on eutrophication
371. The control of eutrophication is a major priority of HELCOM. It is widely acknowledged that
excessive amounts of nutrients are entering the semi-enclosed Baltic Sea and disturbing the ecological
balance of the fragile sea. Under certain hydrological and environmental conditions this leads to algal
blooms, oxygen depletion and occasionally fish kills (e.g. 2002 in the Belt Sea and 2003 in the Gulf of
Gdansk). In many coastal regions the perennial algal belts have been reduced and partly replaced by short-
lived filamentous algal species.
372. Since mid 1980, HELCOM has adopted several HELCOM Recommendations to reduce the load of
nutrients and oxygen consuming substances from point and non-point sources in the Baltic Sea catchment. In
addition the 1988 HELCOM Ministerial Declaration sets goals for all Contracting Parties to reduce their
anthropogenic waterborne nutrient loading by 50 % between 1987 and 1995. Furthermore, in 1992, the
Baltic Sea Joint Comprehensive Environmental Action Programme (JCP) was established to facilitate and
monitor the elimination of the 162 most polluting sources within the Baltic Sea catchment area – known as
"hot-spots". By March 2008 sufficient abatement measures were taken in half of them (83) and they
consequently were eliminated from the list of hot spots.
2.2.3. HELCOM Monitoring
373. The HELCOM monitoring system consists of several complementary programmes, The Pollution
Load Compilation programmes (PLC-Air and PLC-Water) quantify inter alia emissions of nutrients to the air
(nitrogen), discharges and losses to inland surface waters, and the resulting air and waterborne inputs to the
sea. The COMBINE programme assesses nutrients and certain eutrophication effects in the marine
environment, including examination of trends.
374. Pollution Load Compilations are periodically carried out in order to compile:
a. Total loads of nutrients on an annual basis (from rivers and coastal areas as well as point
sources and diffuse sources discharging directly to the Baltic Sea); and
92 For further information see: http://www.helcom.fi/groups/monas/en_GB/monas_main/

Guidance Document on Eutrophication Assessment
Guidance Document May 2009 121
b. Waterborne discharges from point sources and losses from non-point pollution sources as well
as natural background losses into inland surface waters within the catchment area of the Baltic
Sea located within the borders of the Contracting Parties.
375. These are reported every six year starting in 1987 (PLC-1). The latest report (PLC-4, HELCOM 2004)
covers the period 1994 - 2000 for riverine loads and both point and non-point sources in the Baltic Sea
catchment area for the year 2000. The next report, PLC-5 will be based on data collected up to 2006 and
finalised in 2009. This main objective of the PLC-5 report is to:
• quantify and describe the waterborne discharges from point sources and losses from non-point
pollution sources as well as the quantified natural background losses into inland surface waters
(source oriented approach) within the catchment area of the Baltic Sea
• quantify and describe the loads (from rivers, unmonitored and coastal areas as well as point sources)
discharging directly to the Baltic Sea (load oriented approach);
• evaluate changes in the pollution load since 1994;
• explain to which extent changes are caused by human activities or natural variations; and
• overall evaluate the significance of various water protection measures applied in the Baltic Sea
catchment area to reduce the pollution load from land-based sources.
376. This information is required to assess the effectiveness of measures taken to reduce eutrophication in
the Baltic Sea catchment area as well as to interpret and evaluate the environmental status and related
changes in coastal waters and the open sea.
377. Comprehensive HELCOM assessments were published every five years. For the purpose of an
eutrophication assessment, background concentrations of nutrients in the open marine environment are used
as one of the criteria for assessments. Ecological Quality Objectives (EcoQOs) for eutrophication have been
developed.
2.2.4. Thematic HELCOM eutrophication assessment
378. HELCOM MONAS launched the project "Development of tools for a thematic eutrophication
assessment (HELCOM EUTRO)" which aims at a Baltic Sea wide harmonisation of eutrophication
assessment criteria and procedures including the establishment of reference conditions for different parts of
the Baltic Sea in 2004. The project was based on monitoring data produced within the COMBINE
programme, other national monitoring and research data, and they cover both, coastal areas and the open sea.
The project developed a "HELCOM Eutrophication Assessment Tool" (HEAT).
379. During a second phase of this project "Towards an integrated thematic assessment of eutrophication in
the Baltic Sea" the integrated HELCOM thematic assessment of the eutrophication status of the Baltic Sea
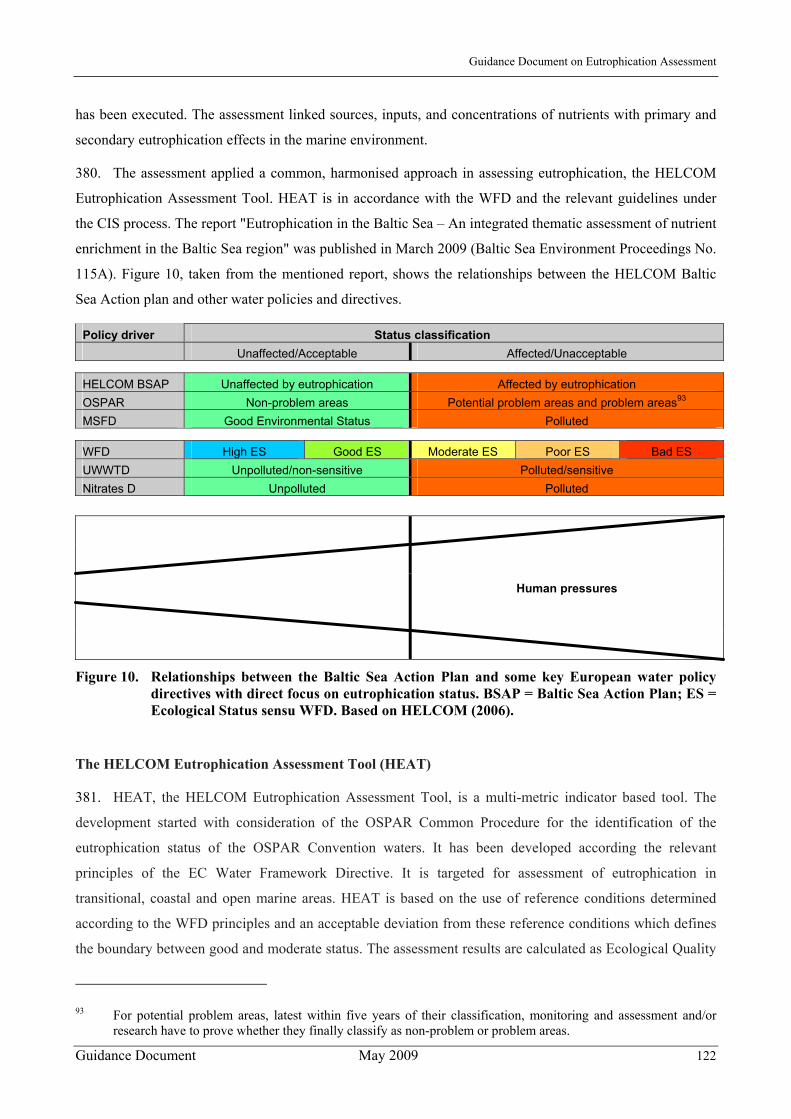
Guidance Document on Eutrophication Assessment
Guidance Document May 2009 122
has been executed. The assessment linked sources, inputs, and concentrations of nutrients with primary and
secondary eutrophication effects in the marine environment.
380. The assessment applied a common, harmonised approach in assessing eutrophication, the HELCOM
Eutrophication Assessment Tool. HEAT is in accordance with the WFD and the relevant guidelines under
the CIS process. The report "Eutrophication in the Baltic Sea – An integrated thematic assessment of nutrient
enrichment in the Baltic Sea region" was published in March 2009 (Baltic Sea Environment Proceedings No.
115A). Figure 10, taken from the mentioned report, shows the relationships between the HELCOM Baltic
Sea Action plan and other water policies and directives.
Policy driver Status classification Unaffected/Acceptable Affected/Unacceptable
HELCOM BSAP Unaffected by eutrophication Affected by eutrophication OSPAR Non-problem areas Potential problem areas and problem areas93 MSFD Good Environmental Status Polluted
WFD High ES Good ES Moderate ES Poor ES Bad ES UWWTD Unpolluted/non-sensitive Polluted/sensitive Nitrates D Unpolluted Polluted
Human pressures
Figure 10. Relationships between the Baltic Sea Action Plan and some key European water policy directives with direct focus on eutrophication status. BSAP = Baltic Sea Action Plan; ES = Ecological Status sensu WFD. Based on HELCOM (2006).
The HELCOM Eutrophication Assessment Tool (HEAT)
381. HEAT, the HELCOM Eutrophication Assessment Tool, is a multi-metric indicator based tool. The
development started with consideration of the OSPAR Common Procedure for the identification of the
eutrophication status of the OSPAR Convention waters. It has been developed according the relevant
principles of the EC Water Framework Directive. It is targeted for assessment of eutrophication in
transitional, coastal and open marine areas. HEAT is based on the use of reference conditions determined
according to the WFD principles and an acceptable deviation from these reference conditions which defines
the boundary between good and moderate status. The assessment results are calculated as Ecological Quality
93 For potential problem areas, latest within five years of their classification, monitoring and assessment and/or research have to prove whether they finally classify as non-problem or problem areas.
Guidance Document on Eutrophication Assessment
Guidance Document May 2009 123
Ratio and presented as one of five classes (high, good, moderate, bad, poor). HEAT comprises two
assessment steps. The first step is an interim assessment for specific selected indicators and/or biological
quality elements (such as phytoplankton, submerged aquatic flora, benthic fauna). By a second step, these
individual assessment results are merged into an overall classification using the “one out, all out” principle as
laid out in the WFD. HEAT will further be improved in order to meet the requirements of the Baltic Sea
Action Plan and eutrophication relevant EC directives such as the WFD, Habitats Directive and the MSFD.
382. HEAT has successfully been tested for coastal and marine waters along the Baltic Sea. It was applied
in 189 areas (163 in coastal waters and 16 in open sea areas). Only 13 (11 coastal areas and 2 open basins)
were considered unaffected by eutrophication.
2.2.5. The Baltic Sea Action Plan aims at a Baltic Sea unaffected by Eutrophication
383. At the HELCOM Ministerial Meeting in Krakow in November 2007, all HELCOM Member States
signed the Baltic Sea Action Plan (BSAP). It has four segments: eutrophication, biodiversity, hazardous
substances and maritime issues. The eutrophication segment states “the overall goal of HELCOM is to have
a Baltic Sea unaffected by eutrophication”. The aim is to reach HELCOM's vision for good environmental
status in the Baltic Sea by achieving five ecological quality objectives to describe the characteristics of a
Baltic Sea, which is unaffected by eutrophication:
• Concentrations of nutrients close to natural levels,
• Clear water,
• Natural level of algal blooms,
• Natural distribution and occurrence of plants and animals,
• Natural oxygen levels.
384. In order to make these objectives operational, indicators with target values, reflecting good ecological
and environmental status of the marine Baltic environment, have been agreed upon. Clear water was chosen
as the primary ecological objective with water transparency as the indicator.
385. For the achievement of the overall goal the Contracting Parties agreed on the principle of identifying
maximum allowable inputs of nutrients. They further agreed on the need to reduce the nutrient inputs and
that the reductions needed shall be fairly shared by all Baltic Sea countries.
386. In the Baltic Sea there are long time series for some measurements (salinity, temperature,
transparency). This provides modellers with excellent reference data, and a number of models describe the
Baltic Sea dynamics. Related to eutrophication the Baltic Sea, the MARE NEST model is a marine physical
bio-geo-chemical model for the seven sub-basins (Bothnian Bay, Bothnian Sea, Gulf of Finland, Baltic
proper, Gulf of Riga, Danish Straits and Kattegat) in the Baltic Sea. This model is linked to a model of the
catchment area and to an economic model. HELCOM used the MARE NEST model to derive the figures on
maximum allowable nutrient inputs and the needed reductions for waterborne inputs for each sub-basin and
Guidance Document on Eutrophication Assessment
Guidance Document May 2009 124
to determine the respective country-wise nutrient reduction requirements which are laid out in the
eutrophication segment of the Baltic Sea Action Plan. These data are provisional due to the best available
knowledge at that time and the state of national nutrient data deliveries for the preparation of the BSAP. The
figures are currently under revision. This process comprises the update of the available data on nutrients
from Contracting Parties (e.g. by the 5th HELCOM Pollution Load Compilation and EMEP data an
atmospheric nitrogen), and a further improvement of MARE NEST, e.g. by incorporation of more indicators
in addition to water transparency.
2.3. Barcelona Convention for the Protection of the Mediterranean Sea Against Pollution
2.3.1. Aims of the Barcelona Convention and the Mediterranean Action Plan
387. The Mediterranean Action Plan (MAP) was adopted by 16 Mediterranean countries and the European
Community in 1975. In 1976 these Parties adopted the Convention for the Protection of the Mediterranean
Sea Against Pollution (Barcelona Convention). Seven Protocols have completed the initial MAP legal
framework intended to address different aspects of the environmental conservation in the Mediterranean
Sea.94 In 1995 Phase II of the MAP Programme and at the same time an amended version of the Barcelona
Convention were adopted.
388. The assessment and control of marine pollution, the protection of the environment through prevention
and reduction of pollution and, as far as it is feasible, the elimination of pollution, are amongst the main
objectives of the Convention.
2.3.2. MED POL work on eutrophication
389. Within the MAP structure, the MED POL Programme is the pollution assessment and control
component. It is responsible for the work related to the implementation of the protocols dealing with
pollution from land-based activities and sources95, dumping96 and hazardous wastes.97 MED POL assists
Mediterranean countries in the formulation and implementation of pollution monitoring programmes,
including pollution control measures and action plans to eliminate pollution from land-based sources
94 Institutional and legal information and texts on the Mediterranean Action Programme, the Barcelona Convention and the Protocols cand be found at: http://www.unepmap.org/index.php
95 Protocol for the Protection of the Mediterranean Sea against Pollution from Land-Based Sources and Activities,
accessible at: http://195.97.36.231/dbases/webdocs/BCP/ProtocolLBS96_eng_P.pdf
96 Protocol for the Prevention of Pollution in the Mediterranean Sea by Dumping from Ships and Aircrafts,
accessible at: http://195.97.36.231/dbases/webdocs/BCP/ProtocolDumping76_Eng.pdf
97 Protocol on the Prevention of Pollution of the Mediterranean Sea by Transboundary Movements of Hazardous
Wastes and their Disposal, accessible at:
http://195.97.36.231/dbases/webdocs/BCP/ProtocolHazardousWastes96_eng.pdf

Guidance Document on Eutrophication Assessment
Guidance Document May 2009 125
390. Activities carried out within the programme have contributed to improving the information on the
presence of nutrients in the Mediterranean. Many activities have taken place over different phases, according
to the recommendations and decisions of the Parties to the Convention. They encompassed for instance the
upgrading of technical facilities, the development of national monitoring projects or the construction of a
data base on nutrient values that are available for a number of Mediterranean countries.
2.3.3. Monitoring under MED POL
391. The MED POL Programme has been responsible of the preparation of an indicator-based monitoring
strategy on eutrophication,98 finally endorsed by the Conference of the Parties in 2003. The MED POL
Strategy of Eutrophication Monitoring in Mediterranean coastal waters uses a stepwise approach:
1. The first step of the implementation of the strategy in the short-term is the classification of the sites
to be monitored within individual pilot projects, as being eutrophic or sensitive to eutrophication.
Three different site typologies were proposed to provide a common approach for the selection of
sites (an affected marine site together with a reference site, an off-shore fish farm and a coastal
lagoon). In addition, the concerned countries would make use of other general criteria such as
representativity, sensitiveness to eutrophication phenomena and availability of basic information on
the main hydromorphological parameters as well as associated historical records of ecological events
and socio-economical trends in land use.
The monitoring parameters adopted were selected as to fulfil the minimum necessary scientific
requirements and also to support the state indicators developed by the European Environment
Agency as well as the TRIX index. A number of parameters to be monitored were also specified:
• Temperature (C°) Dissolved oxygen (mg/L, %) • PH Chlorophyll a (µg/L) • Transparency Total Nitrogen (N µmole/L) • Salinity (psu) • Nitrate (NO3-N µmole/L, µg/L) • Orthophosphate (PO4-P µmole/L, µ g/L) • Ammonium (NH4-N µmole/L, µg/L) • Total phosphorus (P µmole/L, µg/L) • Nitrite (NO2-N µmole/L, µg/L) • Silicate (SiO2 µmole/L) • Phytoplankton (total abundance, abundance of major groups, bloom dominance)
Minimum requirements as regards the sampling strategy, frequency and spatial coverage were also defined.
98 The details of the programme and the background evaluation can be found in the document UNEP(DEC)/MED WG.231/14, accessible at: http://195.97.36.231/acrobatfiles/03WG231_14_eng.pdf
Guidance Document on Eutrophication Assessment
Guidance Document May 2009 126
2. For a medium/long term strategy the development of new biological parameters/indicators of
eutrophication was proposed. It was needed to introduce biological parameters both for the
phytoplankton population dynamics and for the benthic component of the coastal ecosystem.
In addition, the importance of historical data to reconstruct the story of the site and support the
assessment and management of the area according to integrated coastal zone management
approaches, recommended their collection and assessment, although was not considered mandatory.
392. The implementation of this strategy was revised in 200599.
2.3.4. Thematic eutrophication assessment
393. The Trophic Index TRIX, the assessment method adopted in the MEDPOL Programme, is defined by
a linear combination of the logarithms of four state variables: chlorophyll a (ChA), oxygen as absolute
percent deviation from saturation (aD%O), mineral nitrogen (min N) and total phosphorus (TP)
(Vollenweider et al., 1998). The TRIX Index is a numeric expression which provides a direct measure of
trophic levels, it works as a multimetric index, and moreover it offers the advantage of utilising, as
components, environmental variables directly measured and routinely collected, and it is an index in
compliance with WFD requirements. TRIX has also been applied to the assessment of transitional waters
(for more information, see Chapter 5.4.1 of this Guidance).
394. The TRIX Index has been tested in different areas of the Mediterranean Sea, e.g. in the Adriatic and
the Tyrrhenian Sea (Giovanardi & Vollenweider, 2004).
2.3.5. Overview of the state of eutrophication in the Mediterranean Sea
395. In 2007, MED POL presented an overview of the state of eutrophication in the Mediterranean
Sea.100 The information came from the responses from Mediterranean countries to a relevant questionnaire,
the results of pilot projects carried out within the Monitoring Strategy, and a literature survey. All this
information is used to present drivers and pressures related to eutrophication as well as eutrophication state
and impact (DPSIR approach) in the Mediterranean by region or country. Remote sensing data are also used.
396. On the basis of the information received through the questionnaires, it was concluded that very few
countries follow the MED POL monitoring strategy and that most countries prefer to follow their own
monitoring strategies and assessment methods. Following this conclusion, the challenge for the MED POL
and the countries is the harmonization of the monitoring strategies and assessment methods on a basin-wide
scale.
99 See document UNEP(DEC)/MED WG.282/3, accessible at: http://195.97.36.231/acrobatfiles/05WG282_3_eng.pdf
100 See document UNEP(DEPI)/MED WG.321/Inf.6, accessible at: http://195.97.36.231/acrobatfiles/07WG321_Inf6_eng.pdf
Guidance Document on Eutrophication Assessment
Guidance Document May 2009 127
397. The Conference of the Parties in 2008 endorsed the MED POL proposal to continue eutrophication
monitoring, building upon the strategies developed and tested in the initial phase through pilot projects. The
strategies would be re-evaluated and if necessary modified after further implementation.
2.4. Bucharest Convention on the Protection of the Black Sea Against Pollution
2.4.1. Aims of the Bucharest Convention101
The Convention on the Protection of the Black Sea Against Pollution was signed in Bucharest on 21 April
1992 and ratified by all six legislative assemblies of the Black Sea countries (Bulgaria, Georgia, Romania,
the Russian Federation, Turkey and Ukraine) in the beginning of 1994. The basic objective of the
Convention is to prevent, reduce and control the pollution in the Black Sea in order to protect and preserve
the marine environment and to provide the legal framework for cooperation. One of the main specific
objectives is to reduce and control the pollution from land-based sources.
2.4.2. Work on eutrophication
The decrease in the importance of agriculture as an economic powerhouse of the region has been clearly
shown by decreasing trends in livestock numbers and a shift from major livestock farms to smaller-scale or
subsistence-level farming. However, indicators suggest that this decline in agricultural productivity may
have bottomed-out, so a gradual re-intensification of agricultural practices my begin in the near future.
Direct discharges from large municipal/industrial plants to the Sea are equivalent to only a small proportion
of nutrients discharged to the Sea via rivers, of which the Danube is by far the most important. Available
information also suggests that atmospheric deposition of nitrogen to the Sea may be of a similar order of
magnitude to river loads, but there is considerable uncertainty over the data used, with a clear need for
updating and harmonisation of monitoring protocols.
Based on the data reported by the Black Sea coastal states and the results presented in the 2007 Black Sea
Transboundary Diagnostic Analysis, it is suggested that more than 80 % of the river-borne inorganic
nitrogen load and around 50 % of the river-borne phosphate load enters the Sea from the Danube. However,
the Danube has by far the most rigorous nutrient loads monitoring programme of all rivers, and it is likely
that nutrient loads from other rivers are under-estimated by comparison. The importance of freshwater
nutrient inflows to the Sea of Azov could not be estimated because of a lack of data for the Kerch Strait.
Between 1996 and 2005 there has been no evidence of a change in river-borne DIN loads to the Sea, albeit
with a moderate (15 %) decrease in river-borne PO4-P loads over the same period. However, the level of
confidence associated with the PO4-P lead decrease is very low, due to the large inter-annual variability.
101 For further information see: http://www.blacksea-commission.org/OfficialDocuments/Convention_iframe.htm

Guidance Document on Eutrophication Assessment
Guidance Document May 2009 128
2.4.3. Monitoring of the Black Sea
In the frame of the Black Sea Integrated Monitoring and Assessment Programme nutrients are monitored in
water, sediment and biota.
2.4.4. The Strategic Action Plan for the Protection and Rehabilitation of the Black Sea
The first Strategic Action Plan for the Rehabilitation and Protection of the Black Sea was signed in Istanbul
on 31 October 1996, and amended in 2002. Based on the existing cooperation and the previous action plan, a
new Strategic Action Plan for the Environmental Protection and Rehabilitation of the Black Sea was adopted
in Sofia, Bulgaria on 17 April 2009. It focuses on concerted action to assist in the continued recovery of the
Black Sea and describes the policy actions required to meet the major environmental challenges now facing
the Sea, and includes a series of management targets. Ecosystem Quality Objectives (EcoQOs) have been
developed as long-term management objectives. One of these objectives is to reduce eutrophication.
3. REFERENCES IN ANNEX 1
1. European Communities, 1975. Council Directive 75/440/EEC of 16 June 1975 concerning the quality
required of surface water intended for the abstraction of drinking water in the Member States. OJ L194,
25/07/1975.
2. European Communities, 1976. Council Directive 76/160/EEC of 8 December 1975 concerning the
quality of bathing water. OJ No. L31/1. 5/2/76.
3. European Communities, 1978. Council Directive 78/659/EEC of 18 July 1978 on the quality of
freshwaters needing protection or improvement in order to support fish life. OJ L 222, 14/08/1978.
4. European Communities, 1979a. Council Directive 79/923/EEC of 30 October 1979 on the quality
required of shellfish waters. OJ L 281/47, 10/11/79.
5. European Communities, 1979b. Directive 79/409/EEC of the European Parliament and of the Council on
the conservation of wild birds. OJ L 103/ 43.
6. European Communities, 1991a. Directive 91/271/EEC. Council Directive of 21 May 1991 concerning
urban waste water treatment. O.J. L135/40 vol. 30/5/91.
7. European Communities, 1991b. Directive 91/676/EEC of the European Parliament and of the Council
Directive concerning the protection of waters against pollution caused by nitrates from agricultural
sources. OJ L375/1.
8. European Communities, 1992. Directive 92/43/EEC of the European Parliament and of the Council of 21
May 1992 on the conservation of natural habitats and of wild fauna and flora. OJ L 206/ 7.
Guidance Document on Eutrophication Assessment
Guidance Document May 2009 129
9. European Communities, 2000: Directive 2000/60/EC of the European Parliament and of the Council of
23 October 2000 establishing a framework for Community action in the field of water policy. O.J. L327
vol.43.22/12/2000.
10. European Communities, 2001. Directive 2001/81/EC of the European Parliament and of the Council of
23 October 2001 on national emission ceilings for certain atmospheric pollutants. O.J. L 309/22,
27/11/2001. .
11. European Communities, 2003a. WFD CIS Guidance Document No. 5. Transitional and coastal waters –
typology, reference conditions, and classification systems.
http://forum.europa.eu.int/Public/irc/env/wfd/library
12. European Communities, 2003b. WFD CIS Guidance Document No. 6. Towards a guidance on
establishment of the intercalibration network and the process on the intercalibration exercise.
http://forum.europa.eu.int/Public/irc/env/wfd/library
13. European Communities, 2003c. WFD CIS Guidance Document No. 7. Monitoring under the Water
Framework Directive. http://forum.europa.eu.int/Public/irc/env/wfd/library.
14. European Communities, 2003d. WFD CIS Guidance Document No. 10. Rivers and lakes – Typology,
reference conditions and classification systems. http://forum.europa.eu.int/Public/irc/env/wfd/library
15. European Communities 2005. WFD CIS Guidance Document No. 13. Overall Approach to the
Classification of Ecological Status and Ecological Potential.
http://forum.europa.eu.int/Public/irc/env/wfd/library
16. European Environment Agency 1995. Europe’s Environment: The Dobris Assessment.
17. Giovanardi, F. and A. Vollenweider (2004): Trophic conditions of marine coastal waters: experience in
applying the Trophic Index TRIX to two areas of the Adriatic and Tyrrheninan seas. – J. Limnol., 63(2):
199-218, 2004
18. HELCOM, 2002. Environment of the Baltic Sea Area 1994 – 1998. Balt. Sea Environ. Proc. No. 82B,
ISSN: 0357-2994
19. HELCOM, 2004. The Fourth Baltic Sea Pollution Load Compilation. Balt. Sea Environ. Proc. No. 93,
ISSN: 0357-2994
20. Oslo and Paris Commissions 1993. North Sea Quality Status Report 1993. London, 1993, ISBN 1-
872349-06-4
21. OSPAR Commission 2000. Quality Status Report 2000. London, ISBN 0 946956 52 9
22. OSPAR Commission 2001. Harmonised assessment criteria and their respective assessment levels in the
Comprehensive Procedure.

Guidance Document on Eutrophication Assessment
Guidance Document May 2009 130
23. OSPAR Commission 2003a. Draft starting point for the further development of the Common Procedure
for the identification of the eutrophication status of the OSPAR Maritime Area. Meeting of the
Eutrophication Committee (EUC) London, 8-12 December 2003.
24. OSPAR Commission 2003b. OSPAR Integrated Report 2003 on the Eutrophication Status of the OSPAR
Maritime Area Based upon the First Application of the Comprehensive Procedure, ISBN 1-904426-25-5.
25. OSPAR Commission 2005a. Common Procedure for the Identification of the Eutrophication Status of
the OSPAR Maritime Area. OSPAR Agreement 2005-3.
26. OSPAR Commission 2005b. Synergies between the OSPAR Comprehensive Procedure, the integrated
set of OSPAR Ecological Quality Objectives (EcoQOs) for eutrophication and the EC Water Framework
Directive, Publication No. 231, ISBN 1-904426-73-5.
27. Vollenweider, R.A., F. Giovanardi, G. Montanari & A. Rinaldi (1998): Characterization of the trophic
conditions of marine coastal waters, with special reference to the NW Adriatic Sea: Proposal for a
trophic scale, turbidity and generalized water quality index. Environmetrics, 9: 329-357
Guidance Document on Eutrophication Assessment
Guidance Document May 2009 131
ANNEX 2: INDICATIVE CHECKLISTS FOR WATER CATEGORY-SPECIFIC FEATURES OF THE IMPACT OF EUTROPHICATION
398. The following tables are the complete water category-specific checklists developed during the
Eutrophication Workshop in Ispra in September 2004.
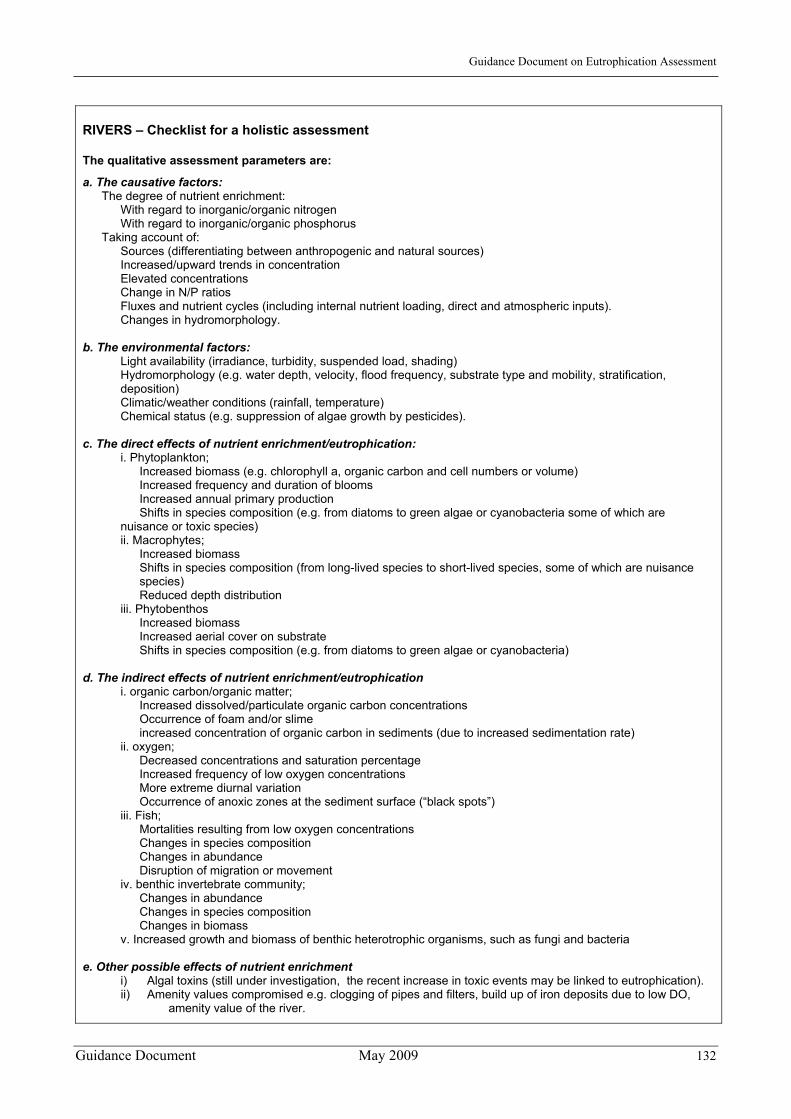
Guidance Document on Eutrophication Assessment
Guidance Document May 2009 132
RIVERS – Checklist for a holistic assessment
The qualitative assessment parameters are:
a. The causative factors: The degree of nutrient enrichment:
With regard to inorganic/organic nitrogen With regard to inorganic/organic phosphorus
Taking account of: Sources (differentiating between anthropogenic and natural sources) Increased/upward trends in concentration Elevated concentrations Change in N/P ratios Fluxes and nutrient cycles (including internal nutrient loading, direct and atmospheric inputs). Changes in hydromorphology.
b. The environmental factors: Light availability (irradiance, turbidity, suspended load, shading) Hydromorphology (e.g. water depth, velocity, flood frequency, substrate type and mobility, stratification, deposition) Climatic/weather conditions (rainfall, temperature) Chemical status (e.g. suppression of algae growth by pesticides).
c. The direct effects of nutrient enrichment/eutrophication: i. Phytoplankton; Increased biomass (e.g. chlorophyll a, organic carbon and cell numbers or volume) Increased frequency and duration of blooms Increased annual primary production Shifts in species composition (e.g. from diatoms to green algae or cyanobacteria some of which are nuisance or toxic species) ii. Macrophytes; Increased biomass Shifts in species composition (from long-lived species to short-lived species, some of which are nuisance
species) Reduced depth distribution iii. Phytobenthos Increased biomass Increased aerial cover on substrate Shifts in species composition (e.g. from diatoms to green algae or cyanobacteria)
d. The indirect effects of nutrient enrichment/eutrophication i. organic carbon/organic matter; Increased dissolved/particulate organic carbon concentrations Occurrence of foam and/or slime increased concentration of organic carbon in sediments (due to increased sedimentation rate) ii. oxygen; Decreased concentrations and saturation percentage Increased frequency of low oxygen concentrations More extreme diurnal variation Occurrence of anoxic zones at the sediment surface (“black spots”) iii. Fish; Mortalities resulting from low oxygen concentrations Changes in species composition Changes in abundance Disruption of migration or movement iv. benthic invertebrate community; Changes in abundance Changes in species composition Changes in biomass v. Increased growth and biomass of benthic heterotrophic organisms, such as fungi and bacteria
e. Other possible effects of nutrient enrichment i) Algal toxins (still under investigation, the recent increase in toxic events may be linked to eutrophication). ii) Amenity values compromised e.g. clogging of pipes and filters, build up of iron deposits due to low DO,
amenity value of the river.
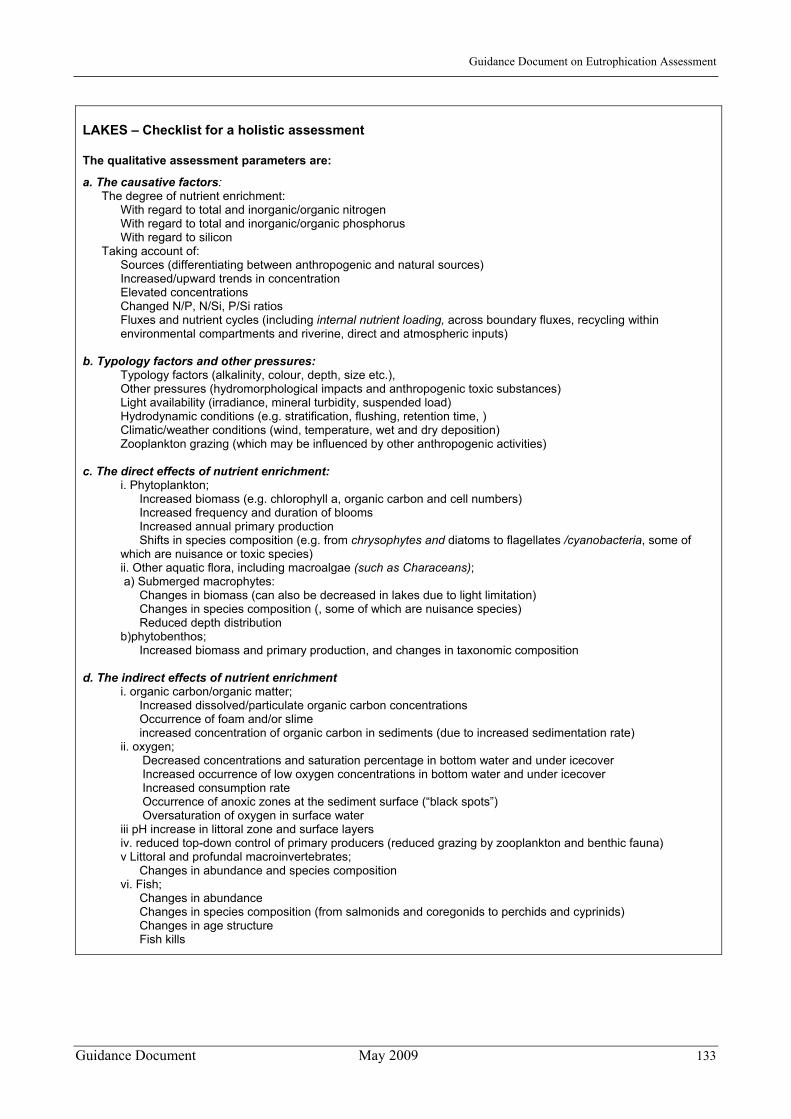
Guidance Document on Eutrophication Assessment
Guidance Document May 2009 133
LAKES – Checklist for a holistic assessment
The qualitative assessment parameters are:
a. The causative factors: The degree of nutrient enrichment:
With regard to total and inorganic/organic nitrogen With regard to total and inorganic/organic phosphorus With regard to silicon
Taking account of: Sources (differentiating between anthropogenic and natural sources) Increased/upward trends in concentration Elevated concentrations Changed N/P, N/Si, P/Si ratios Fluxes and nutrient cycles (including internal nutrient loading, across boundary fluxes, recycling within environmental compartments and riverine, direct and atmospheric inputs)
b. Typology factors and other pressures: Typology factors (alkalinity, colour, depth, size etc.), Other pressures (hydromorphological impacts and anthropogenic toxic substances) Light availability (irradiance, mineral turbidity, suspended load) Hydrodynamic conditions (e.g. stratification, flushing, retention time, ) Climatic/weather conditions (wind, temperature, wet and dry deposition) Zooplankton grazing (which may be influenced by other anthropogenic activities)
c. The direct effects of nutrient enrichment: i. Phytoplankton; Increased biomass (e.g. chlorophyll a, organic carbon and cell numbers) Increased frequency and duration of blooms Increased annual primary production Shifts in species composition (e.g. from chrysophytes and diatoms to flagellates /cyanobacteria, some of which are nuisance or toxic species) ii. Other aquatic flora, including macroalgae (such as Characeans); a) Submerged macrophytes: Changes in biomass (can also be decreased in lakes due to light limitation) Changes in species composition (, some of which are nuisance species) Reduced depth distribution b)phytobenthos; Increased biomass and primary production, and changes in taxonomic composition
d. The indirect effects of nutrient enrichment i. organic carbon/organic matter; Increased dissolved/particulate organic carbon concentrations Occurrence of foam and/or slime increased concentration of organic carbon in sediments (due to increased sedimentation rate) ii. oxygen;
Decreased concentrations and saturation percentage in bottom water and under icecover Increased occurrence of low oxygen concentrations in bottom water and under icecover Increased consumption rate Occurrence of anoxic zones at the sediment surface (“black spots”) Oversaturation of oxygen in surface water
iii pH increase in littoral zone and surface layers iv. reduced top-down control of primary producers (reduced grazing by zooplankton and benthic fauna) v Littoral and profundal macroinvertebrates; Changes in abundance and species composition vi. Fish; Changes in abundance Changes in species composition (from salmonids and coregonids to perchids and cyprinids) Changes in age structure Fish kills
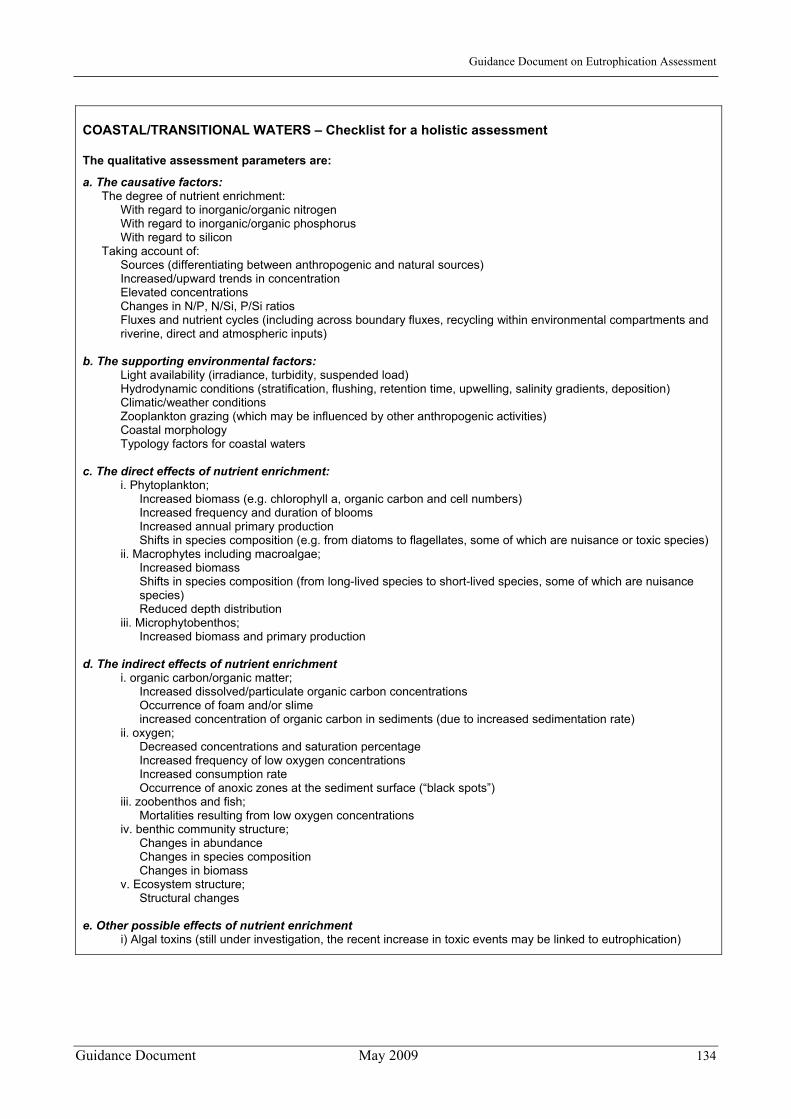
Guidance Document on Eutrophication Assessment
Guidance Document May 2009 134
COASTAL/TRANSITIONAL WATERS – Checklist for a holistic assessment
The qualitative assessment parameters are:
a. The causative factors: The degree of nutrient enrichment:
With regard to inorganic/organic nitrogen With regard to inorganic/organic phosphorus With regard to silicon
Taking account of: Sources (differentiating between anthropogenic and natural sources) Increased/upward trends in concentration Elevated concentrations Changes in N/P, N/Si, P/Si ratios Fluxes and nutrient cycles (including across boundary fluxes, recycling within environmental compartments and riverine, direct and atmospheric inputs)
b. The supporting environmental factors: Light availability (irradiance, turbidity, suspended load) Hydrodynamic conditions (stratification, flushing, retention time, upwelling, salinity gradients, deposition) Climatic/weather conditions Zooplankton grazing (which may be influenced by other anthropogenic activities) Coastal morphology Typology factors for coastal waters
c. The direct effects of nutrient enrichment: i. Phytoplankton; Increased biomass (e.g. chlorophyll a, organic carbon and cell numbers) Increased frequency and duration of blooms Increased annual primary production Shifts in species composition (e.g. from diatoms to flagellates, some of which are nuisance or toxic species) ii. Macrophytes including macroalgae; Increased biomass Shifts in species composition (from long-lived species to short-lived species, some of which are nuisance
species) Reduced depth distribution iii. Microphytobenthos; Increased biomass and primary production
d. The indirect effects of nutrient enrichment i. organic carbon/organic matter; Increased dissolved/particulate organic carbon concentrations Occurrence of foam and/or slime increased concentration of organic carbon in sediments (due to increased sedimentation rate) ii. oxygen; Decreased concentrations and saturation percentage Increased frequency of low oxygen concentrations Increased consumption rate Occurrence of anoxic zones at the sediment surface (“black spots”) iii. zoobenthos and fish; Mortalities resulting from low oxygen concentrations iv. benthic community structure; Changes in abundance Changes in species composition Changes in biomass v. Ecosystem structure; Structural changes
e. Other possible effects of nutrient enrichment i) Algal toxins (still under investigation, the recent increase in toxic events may be linked to eutrophication)

Guidance Document on Eutrophication Assessment
Guidance Document May 2009 135
ANNEX 3: LIST OF CONTRIBUTORS
Members of the Steering Group
Country/Organisation Name E-mail Finland Heikki Pitkänen [email protected] Germany Ulrich Claussen [email protected] Netherlands Jeannette Plokker
Marcel van den Berg [email protected] [email protected]
United Kingdom Simon Leaf [email protected] Spain Carmen Coleto [email protected] EEA Steve Nixon [email protected] JRC Mark Dowell
Ana Cristina Cardoso Guido Premazzi
[email protected] [email protected] [email protected]
DG Environment Joachim D’Eugenio Jorge Rodriguez Romero Ursula Schmedtje Sophie Breul-Busson Violeta Vinceviciene Liliana Cortellini Gert Verreet Michel Sponar Anne Teller Duncan Johnstone Jeroen Casaer Agnieska Romanowicz Luisa Samarelli
Joachim.D’[email protected] [email protected] [email protected] [email protected] [email protected] [email protected] [email protected] [email protected] [email protected] [email protected] [email protected] [email protected] [email protected]
Technical Secretariat (on behalf of DG ENV)
Ian Codling Anne-Lyche Solheim Kalliopi Pagou
[email protected] [email protected] [email protected]
Experts nominated by Water Directors for the eutrophication activity
Country Name E-mail Austria Veronika Koller-Kreimel [email protected] Belgium Kor Van Hoof
Michael Kyramarios [email protected] [email protected]
Bulgaria Teneva Nevyana Violetta Roiachka
[email protected] [email protected]
Cyprus Marina Argyrou [email protected] Czech Republic Katerina Sysalova [email protected] Greece Alex Lascaratos [email protected] Denmark Jens Brogger Jensen
Jesper Andersen [email protected] [email protected]
Estonia Külli Kangur [email protected] Finland Heikki Pitkänen
Seppo Rekolainen [email protected] [email protected]
France Jean-Paul Rivaud Pierre-Jean Martinez
[email protected] [email protected]
Germany Volker Mohaupt Joachim Voss Ulrich Claussen
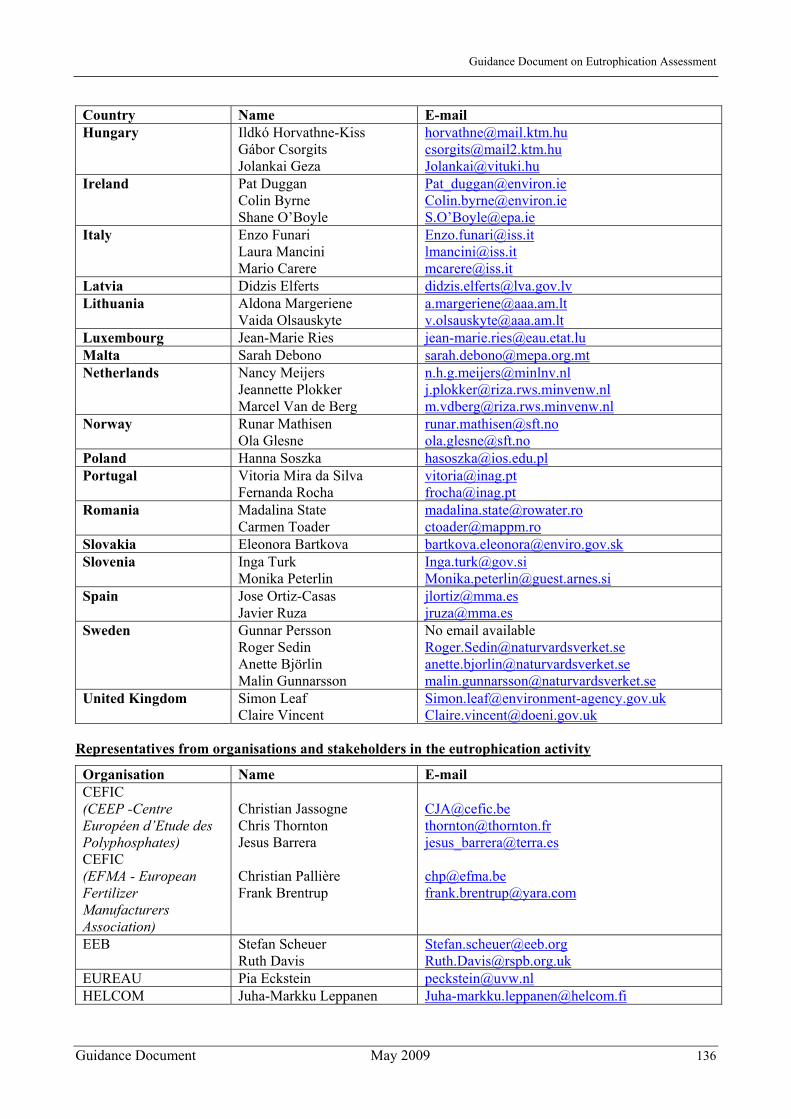
Guidance Document on Eutrophication Assessment
Guidance Document May 2009 136
Country Name E-mail Hungary Ildkó Horvathne-Kiss
Gábor Csorgits Jolankai Geza
[email protected] [email protected] [email protected]
Ireland Pat Duggan Colin Byrne Shane O’Boyle
[email protected] [email protected] S.O’[email protected]
Italy Enzo Funari Laura Mancini Mario Carere
[email protected] [email protected] [email protected]
Latvia Didzis Elferts [email protected] Lithuania Aldona Margeriene
Vaida Olsauskyte [email protected] [email protected]
Luxembourg Jean-Marie Ries [email protected] Malta Sarah Debono [email protected] Netherlands Nancy Meijers
Jeannette Plokker Marcel Van de Berg
[email protected] [email protected] [email protected]
Norway Runar Mathisen Ola Glesne
[email protected] [email protected]
Poland Hanna Soszka [email protected] Portugal Vitoria Mira da Silva
Fernanda Rocha [email protected] [email protected]
Romania Madalina State Carmen Toader
[email protected] [email protected]
Slovakia Eleonora Bartkova [email protected] Slovenia Inga Turk
Monika Peterlin [email protected] [email protected]
Spain Jose Ortiz-Casas Javier Ruza
[email protected] [email protected]
Sweden Gunnar Persson Roger Sedin Anette Björlin Malin Gunnarsson
No email available [email protected] [email protected] [email protected]
United Kingdom Simon Leaf Claire Vincent
[email protected] [email protected]
Representatives from organisations and stakeholders in the eutrophication activity
Organisation Name E-mail CEFIC (CEEP -Centre Européen d’Etude des Polyphosphates) CEFIC (EFMA - European Fertilizer Manufacturers Association)
Christian Jassogne Chris Thornton Jesus Barrera Christian Pallière Frank Brentrup
[email protected] [email protected] [email protected] [email protected] [email protected]
EEB Stefan Scheuer Ruth Davis
[email protected] [email protected]
EUREAU Pia Eckstein [email protected] HELCOM Juha-Markku Leppanen [email protected]

KH-80-09-749-EN
-N