Embed Size (px)
Citation preview

COMMODITY PRICE OUTLOOK
TABLE A 1. COMMODITY PRICES AND PRICE PROJECTIONS IN CONSTANT 1990 DOLLARS
Commodity
Energy Petroleum
Coal Natural gas. US Natural gas, Eur.
Food Coffee (other milds)
Coffee (robusta) Cocoa ·
Tea
Sugar .
Beef Shrimp
Bananas Oranges
Rice Wheat Maize Grain sorghum
Fats and oils
Unit
$tbbl $/mt $/mmbtu
$/mmbtu
CJ1<g CJ1<g CJ1<g CJ1<g
$/mt
CJ1<g CJ1<g $/mt
$/mt
$/mt
$/Tnt $/mt
$/Tnt
Palm oil $/mt
Coconut oil $/mt
Ground nut oil $/mt
Soybean oil $/mt
Soybeans $/mt
Copra $/mt
Groundnut meal $/mt
Soybean meal $/mt
Nonfood agriculture Cotton CJ1<g jute $/mt
Rubber CJ1<g Tobacco $/mt
Timber Logs ( meranti) $/m3
Logs (sapelli) $/ml
Sawnwood $/ml
Metals and minerals Copper $/mt
Tin CJ1<g Nickel $/mt
Aluminum $/mt
Lead $/mt
Zinc $/mt
1970
4.82
0.68
457 364 269 437
323 520
1,108 659 670
504 219 233 207
1,037 1,584 1,510 1,142
466 897
407 411
252 1,092
162 4,290
148 171 699
5,634 1,465
11,348 2,153 1,212 1,176
1980
51.23 59.89
2.15 4.72
1985
39.62 67.93
3.57 5.39
1990
22.88 41.80
1.70 2.55
Actual
/991
18.95 40.59
1.46 3.04
482 471 197 183
451 386 118 105 362 329 127 117
3 I 0 289 203 180
878 130 277 193
384 3-14 256 260
1,421 1,529 1,079 1,129
527 551 541 547
543 581 531 510
571 287 271 287
240 198 136 126
I~ 164 109 I~
1n I~ 104 100
811 936
1,194 829
412 629
334 364
284 428 198
3,162
271 350 551
3,032 2,331 9,058 2.466 1,259 1,057
730 860
1,319 834
327 563
208 229
192 850 Ill
3,807
199 253 448
2,066 1,682 7,142 1,517
570 1,141
290 337 964 447
247 231
185 209
182 408
86 3,392
177 344 533
2,662 609
8,864 1,639
811 1,513
332 424 874 444
234 280
147 193
164 370
81 3,424
196 309 540
2,288 547
7,978 1,274
545 1,093
1992
17.84 38.07
1.66 2.40
1993
15.85 35.77 2.00 2.51
1994
14.50 33.30
1.75 2.23
132 147 302
88 109 239 103 105 127
188 175 167
187 208 244
230 246 213 I ,027 . 1,072 1,193
444 417 401
459 407 375
251 222 244
142 132 137 98 96 98 96 93 95
369 542 572 402
221 357
146 192
120 300
81 3,226
196 311 569
2,139 572
6,566 1,176
508 1,163
356 424 696 452
240 278
158 196
121 257 78
2,537
367 292 714
1,801 528
4,983 1,072
383 906
482 554 933 562
230 381
154 176
161 272 103
2,409
283 301 749
2,106 499
5,786 1,348
500 911
Iron ore $/mt 39.23 39.03 38.72 30.80 32.52 29.65 26.49 23.25
Gold
Silver
Fertilizers Phosphate rock Urea TSP DAP Potassium chloride'
.• Not avaJ\able.
$Aoz c/toz
$/mt
$/mt $/Tnt $/mt
$/mt
143 845
706 2,867
44 65 193 309 169 251 215 309 126 161
463 895
49 199 177 246 122
384 482
41 157 132 171 98
354 395
42 168 130 169 107
Note: Computed from unrounded data and deflated by MLN(1990= 100). Forecast as of july 27, 1995.
a. Also known as muriate of pot!Sh. So!rce: World Bank, lntemational Economics Department, Commodity Policy and Analysis Unit
322 369
39 132 113 136 lOS
339 405
31 101 lOS 122 101
350 482
30 135 121 158 96
/995
14.95 34.16
1.37 2.27
Short-tenn projections
/996
14.44 33.49
1.51 2.22
1997
14.42 33.78
1.57 2.18
292 259 218
236 194 163 124 129 133
137 138 144
226 185 191 171 183 186
1,144 1,130 1,121 343 369 372
380 381 386
262 255 255
143 138 119 98 95 92 95 92 89
487 512 794
. 529
214 318
137 162
179 299 145
2,161
229 290 641
2,523 478
6,843 1,580
521 905
434 481 622 481
226 285
160 180
143 314 138
2,135
232 297 645
2,222 472
6,765 1,469
SIS 908
379 486 593 445 .
223 272
158 181
139 288 124
2,134
239 307 659
1,998 480
5,933 1,376
511 906
23.02 23.86 23.90
342 444
356 363 452 461
30 31 31 159 146 132 121 116 117
165 151 153 99 97 96 ---
Long-term projections
2000
14.65 33.93
1.70 2.04
2005
14.86 33.86
1.87 2.00
187 185 140 131 135 139 158 149
220 235 291 280
1,105 1,051 374 367
406 403
244 233 112 105 93. 86
91 84
322 599 588 434
233 420
167 196
138 280 115
2,028
255 320 694
1,830 577
7,502 1,774
616 1,188
284 489 450 400
248 344
187 224
144 275 117
2,012
287 337 726
1,753 584
7,687 1,728
555 1,092
26. 11 25.43
364 371 450 447
32 32 134 137 118 115 153 153 98 99
36 COMMODITY MARKETS AND THE DEVELOPING COUNTRIES

TABLE A2. COMMODITY PRICES AND PRICE PROJECTIONS IN CURRENT DOLLARS
Commodity
Energy Petroleum Coal· Natural gas, US Natural gas, Eur.
Food Coffee (<:(her milds) Coffee (robusta) Cocoa Tea
Sugar Beef Shrimp Bananas Oranges
Rice Wheat Maize Grain sorghum
Fats and oils Palm oil Coconut oil Groundnut oil Soybean oil
Soybeans Copra
Groundnut meal Soybean meal
Nonfood agriculture Cotton Jute Rubber Tobacco
Timber Logs ( meranti) Logs (sapell~ Sawnwood
Metals and minerals Copper Tin Nickel Aluminum Lead Zinc
Iron ore
Gold Silver
Fertilizers Phosphate rock Urea TSP DAP Potassium chloride'
.. Not avaJiable.
Unit
$tbbl $/mt $/mmbtu $/mmbtu
CJ1<g CJ1<g CJ1<g CJ1<g
$Ant CJ1<g CJ1<g $/mt $/mt
$/mt $/mt $/mt $/mt
$/mt $/mt $/mt $/mt
$/mt $/mt
$/mt $/mt
CJ1<g $/mt CJ1<g $/mt
$/mt CJ1<g $Ant $Ant $/mt $/mt
$/mt
$.koz c.koz
$/mt $/mt $/mt $/mt $/mt
1970
1.21
0.17
liS 91 68
110
81 130 278 165 168
126 55 58 52
260 397 379 286
117 225
102 103
63 274
41 1,076
37 43
175
1,413 367
2,846 S40 304 295
9.84
36 177
II 48 43 54 32
Actual
1980
36.87 43.10
1.55 3.40
1985 1990
27.18 46.60
2.45 3.70
22.88 41.80
1.70 2.55
347 323 197 324 265 118 260 225 127 223 198 203
632 90 277 276 215 256
I ,023 I ,049 I ,079 379 378 541 391 398 531
411 197 271 173 136 136 125 112 109 129 103 104
584 674 859 597
296 453
240 262
205 308 142
2,276
195 252 396
2,182 1,677 6,519 1,775
906 761
SOl 590 905 572
224 386
143 157
132 583 76
2,612
136 174 307
1,417 1,154 4,899 1,041
391 783
290 337 964 447
247 231
185 209
182 408
86 3,392
177 344 533
2,662 609
8,864 1,639
811 1,513
1991
19.37 41.SO
1.49 3. 11
/992 /993 1994
19.02 40.60
1.77 2.56
16.84 38.00
2.12 2.67
15.89 36.48
1.92 2.44
187 141 156 331 107 94 116 262 120 110 112 140 184 200 186 183
198 200 221 267 266 246 262 233
1,155 1,095 1,139 1,308 560 473 443 439 521 489 433 411
293 268 235 268 129 151 140 ISO IW 104 1m 100 I~ 100 ~ 104
339 433 894 454
240 286
ISO 197
168 378
83 3,500
200 316 553
2,339 560
8,156 1,302
558 1,117
394 578 610 429
236 380
156 204
128 320 86
3,440
210 331 607
2,281 610
7 ,001 1,254
541 1,240
378 450 739 480
255 295
168 208
128 273
83 2,695
390 310 758
1,913 561
5,293 1,139
406 962
528 608
1,023 616
252 417
168 192
176 298 113
2,639
310 330 821
2,307 546
6,340 1,477
548 998
28.09 26.56 30.80 33.25 31 .62 28.14 25.47
608 2,064
47 222 180 222 116
318 614
34 136 121 169 84
384 482
41 157 132 171 98
362 404
43 172 133 173 109
344 394
42 140 121 145 112
360 430
33 107 112 129 107
384 528
33 148 132 173 106
Note: Computed h-om unrounded data and deflated by MLN(I990= 100). Forecast as of july 27, 1995. a. Also known as muriate of potash. Source: World Bank, International Economics Department, Commodity Policy and Analysis Un~.
AUGUST 1995
COMMODITY PRICE OUTLOOK
Short-term
projections
1995 1996 1997
17.SO 40.00
1.60 2.66
17.25 17.50 40.00 41.00
1.80 1.90 2.65 2.65
342 309 265 276 232 198 145 154 162 160 165 175
265 221 232 200 219 226
I ,340 I ,350 I ,360 402 441 452 445 455 469
307 305 309 167 165 144 115 113 112 112 110 109
570 600 930 620
2SO 372
160 190
210 3SO 170
2,530
268 340 750
2,954 560
8,013 I ,850
610 1,060
SIB 575 743 575
270 340
191 215
171 375 165
2,550
277 355 770
2,654 564
8,080 1,755 .
615 1,085
460 590 720 540
271 330
192 220
169 350 ISO
2,590
290 373 800
2,425 582
7,200 1,670
620 1,099
26.95 28.50 29.00
400 520
35 186 142 193 116
425 440 540 560
37 38 174 160 139 142 180 186 I 16 I 17
I..Dng-term projections
2000 2005
19.00 44.00 2.20 2.65
21.SO 49.00
2.70 2.90
243 268 181 190 175 201 205 215
286 340 377 405
I ,433 I ,521 485 531 527 583
316 337 146 152 121 125 118 122
418 m 762 563
302 545
217 254
179 363 149
2,630
330 415 900
2,373 748
9,728 2,300
799 1,541
411 708 651 579
359 498
271 324
208 398 169
2,912
415 487
1,050
2,536 845
11,123 2,500
803 1,580
33.85 36.80
472 537 584 647
41 46 174 198 153 166 198 221 127 143
37

COMMODITY PRICE OUTLOOK
TABLE A3. WEIGHTED INDEX OF COMMODITY PRICES IN CURRENT DOLLARS AND IN CONSTANT 1990 DOLLARS 1990=100
Year
1980
1985
1990 1991 1992 1993 1994 1995 1996 1997
2000
2005
1980
1985
1990 1991 1992 1993 1994 1995 1996 1997
2000
2005
Petroleum
161 .1
118.8
100.0 84.7 83.1 73.6 69.4 76.5 75.4 76.5
83.0
94.0
223.8
173.2
100.0 82.8 78.0 69.3 63.4 65.3 63.1 63.0
64.0
64.9
Nonfuel commo
dities (100.0)
126.3
91.7
100.0 95.5 92.1 91.6
111.9 121.5 116.9 112.8
123.2
136.9
175.4
133.6
100.0 93.4 86.4 86.2
102.1 103.7 97.8 93.0
95.0
94.6
Total (69.1)'
138.9
100.5
100.0 97.9 94.4 99.1
123.7 130.3 125.4 121 .2
128.4
143.8
192.9
146.5
100.0 95.7 88.6 93.3
112.9 111.3 104.9 99.8
99.0
99.4
Agriculture
Food
Total Grains Fats and oils Other (12.4)' (29.4)' (6. 9)' (I 0.1 )'
---=---'--'---'-
139.2
86.3
100.0 99.2
100.0 98.6
106.8 I 10.2 108.9 107.6
119.2
130.7
193.4
125.9
100.0 97.0 93.8 92.8 97.5 94.1 91 .2 88.6
91.6
90.3
134.3
89.2
100.0 101.7 101.7 93.6
102.1 113.8 112.6 108.5
112.5
118.0
186.5
130.0
100.0 99.5 95.4 88.2 93.1 97.2 94.2 89.4
86.8
81 .6
Current dollars
148.6
113.0
100.0 104.5 111.7 II 1.5 126.0 128.3 129.3 125.4
135.7
152.7
134.3
62.9
100.0 93.4 89.5 90.7 93.8 93.4 90.2 92.4
109.5
119.8
Canstont 1990 dollars
206.4
164.8
100.0 102.2 104.8 105.0 115.0 109.6 108.2 103.3
104.6
105.5
186.5
91.7
100.0 91.3 84.0 85.4 85.6 79.7 75.5 76.1
84.5
82.8
Beverciges (16.9)'
185.1
165.3
100.0 93.8 79.4 84.9
150.4 154.3 143.4 130.4
127.1
140.0
257.1
241.0
100.0 91.8 74.5 79.9
137.3 131.8 120.0 107.4
98.0
96.8
Row materials
Tatal Timber (22.8)' (9.3)'
104.3
70.8
100.0 99. 1 98.3
110.3 125.8 138.4 133.3 131.9
141.0
163.5
144.9
103.3
100.0 97.0 92.2
103.8 114.8 118.2 111 .6 108.6
108.7
113.0
79.0
59.1
100.0 104.2 114.5 152.4 156.6 142.1 146.0 151.8
171 .1
201 .8
109.7
86. 1
100.0 102.0 107.4 143.5 142.9 121.3 122.2 125.1
13 1.9
139.5
Metals and
minerals (28. 1)'
95.1
70.2
100.0 88.9 86.2 74.0 84.6
101 .9 97.6 93.4
111.8
121.3
132.1
102.3
100.0 87.0 80.8 69.6 77.2 87.0 81.6 77.0
86.2
83.8
Fertilizers (2.7)'
128.9
89.0
100.0 102.4 95.8 83.7 93.4 99.9
100.3 102.6
11 0.6
121.9
179.0
129.8
100.0 100.2 89.9 78.8 85.2 85.3 83.9 84.5
85.3
84.2
Note: Rgures for 1995-2005 ate pro,ectJoos. We1ghts used are the """rage 1987-S9 expon values lor low- and mJCidle-1nc~ ~onom.es. Forecast as of july 27, 1995. a. Percentage share of commodity group in nonfuel index. Source: World Bank, International Economics Department, Commodity Policy and Analysis Unit.
38
TABLE A4. INFLATION INDICES FOR SELECTED YEARS
G-5 MlN index' US GDP deflator G-5 GDP/GNP deflator"
Year 1990~ I 00 % change 1990= I 00 % change 1990= I 00 % change ---------- ~~--------------~--------------~ 1980
1985
1990 1991 1992 1993 1994 1995 1996 1997
2000
2005
71.98 63.33 63.99
68.61
100.00 102.23 106.64 106.24 109.58 117. 11 119.45 121.38
129.69
144.72
-{).95
5.65 2.23 4.31
-{).37 3. 14 6.87 2.00 1.62
2.23
2.22
83.38
100.00 103.80 106.7 1 109.00 111.30 114.75 I 18. 19 121.38
132.64
152.72
5.66
4.42 3.80 2.81 2.15 2. 11 3.10 3.00 2.70
3.00
2.86
67.57
100.00 104.73 111 .04 115.01 I 17.49 120.46 123.46 126.50
137.01
156.29
1.09
6.47 4.73 6.03 3.58 2. 15 2.53 2.49 2.46
2.70
2.67
G-7 CPI'-
1990=1 00 % change
63.13
64.96
100.00 . 104.62 110. 11 110.09 112.51 115.46 II 8.58 121.82
. 132.18
151.99
0.57
9.52 4.62 5.24
-{).01 2.20 2.62 2.70 2.73
2.76
2.83 --------------------------
Note: For 1985, 1990, 2000. and 2005, the average annual growth rates lor the penod Slalt>ng w1lh the year shown above. Rgures for 1993-94 are prClVISIOOOI estimates, except the US GDP deflator, which is actual; all figures lor 1995-2005 are projections. Forecast as of May 3, 1995. a. Un~ llalue index in US dollar terms of manufactures exported from the G-5 countries (France; Germany. japan. the Un~ Kingdom, and the United States), weighted proportionally to the COlrl!ries' exports to the developing countries. b. Aggregate inclex of GDP/GNP deflators in US dollar terms lor the G-5 countries, using SDR-based moving weights. c. Aggregate consumer price index in US dollar terms lor the G-7 countries (Canada. France, Germany.ltaly, japan, the Un~ Kingdom, and the Un~ States). weighted by the countries' 198B-90 average GDP/GNP in current US dollars. Source: G-5 MLN index, G-5 GDP/GNP deflator, and G-7 CPI: World Bank. US GDP deflator: US Department of Commerce.
COMMODITY MARKETS AND THE DEVELOPING COUNTRIES

COMMODITY PRICE OUTLOOK
TABLE AS. COMMODITY PRICE PROBABILITY DISTRIBUTIONS IN CONSTANT 1990 DOLLARS
7C!t6 probabllrty diSUibuoon
Commodity Unit 1995 1996 1997 2000
Energy Petroleum $,/bbl 11.74-18.15 I 0.67-18.21 I 0.30-18.54 9.21-19.97 Coal $/mt 27.32-40.99 26. 12-40.85 25.54-42.02 23.56--44.30 Natural gas, US $/mmbtu 1.07-1.67 1.09-1.93 1.11-2.02 1.08-2.31 Natural gas, Eur. $/mmbtu 1.88-2.69 1.63-2.82 1.52-2.82 1.31-2.82
Food Coffee (other milds) ¢JI<g 237-383 194-349 157-305 127-281 Coffee (robusta) ¢JI<g 190-308 146-262 118-229 95--209 Cocoa ¢JI<g 116-135 107-156 107-166 98-186 Tea ¢JI<g 130-146 123-152 125--161 130-190
Sugar (world) $/mt 196-258 151-212 157-229 162-276 Beef ¢JI<g 162-210 147-239 140-240 204-436 Shrimp ¢JI<g I ,030-1 ,407 904-1,469 840-1,569 807-1,713 Bananas $/mt 309-377 303-435 298-447 285-463 Oranges $/mt 326-433 312-450 309-464 301-549
Rice $/mt 220-304 194-322 183-331 159- 354 Wheat $/mt 120-165 105--174 85--154 73-155 Maize $/mt 87-109 76-114 70-116 65--126 Grain sorghum $/mt 85--106 73-110 68-113 64-123
Fats and oils Palm oil $/mt 435--593 371-563 297-531 225-483 Coconut oil $,tnt 487~30 385--626 365--681 419-898 Groundnut oil $,tnt 715--977 497-809 445-830 412-882 Soybean oil $/mt 47~52 385--626 33~23 3~51
Soybeans $/mt 201-263 181-294 167-312 1.63-349 Copra $/mt 286-413 228-398 204-408 29~72
Groundnut meal $/mt 123-168 128-208 119-222 117-251 Soybean meal $/mt 146-200 144-234 136-251 137- 294
Nonfood agriculture Cotton ¢JI<g 161-197 117-169 111- 167 105--171 Jute $/mt 269-329 257-370 231-346 213-347 Rubber ¢JI<g 126-162 111-158 99-145 83-139 Tobacco $/mt I ,944-2,376 1,751-2,519 I ,707-2,561 1,541-2,514
Timber Logs (meranti) $/ml 202-257 190-283 190-301 183-354 Logs ( sapelli) $/ml 269-316 243-363 244-387 230-445 Sawn wood $/ml 593~96 528-787 524-830 499-965
Metals and minerals Copper $/mt 2, 195- 2,876 I ,838-2,547 I ,639-2,397 I ,317-2,287 Tin ¢JI<g 430-526 401-543 388-571 433-721 Nickel $/mt 5,713-7,971 5,539-8,262 4857-7,245 5,626-9,376 Aluminum $/mt 1,471- 1,725 I ,203-1,795 I ,093-1,732 I ,275--2,467 Lead $/mt 469-573 438-592 41~ 463-771 Zinc $/mt 815-996 m-1.045 733- 1,078 891- 1,485
Iron Ore $/mt 22-24 20-27 19-28 20-32
Gold $/toz 287-396 270-448 261-468 250-478 Silver ¢/toz 364-515 344-570 332-595 3~00
Fertilizers Phosphate rock $/mt 25--35 24-39 23-41 21-44 Urea $/mt 133-184 111-184 95--171 87-188 TSP $/mt 102-141 88-147 84-152 77-1 65 DAP $/mt 138-191 115--190 110-199 99-214 Potassium chloride' $/mt 83- 115 74-122 69- 125 64-135 Nore: ForeG!Stasoljuly27, 1995. a. Also known as muriate of potash. Source: World Bank, International Economics Department, Commodity Policy and lvlalysis Unit.
AUGUST 1995 39
COMMODITY PRICE OUTLOOK
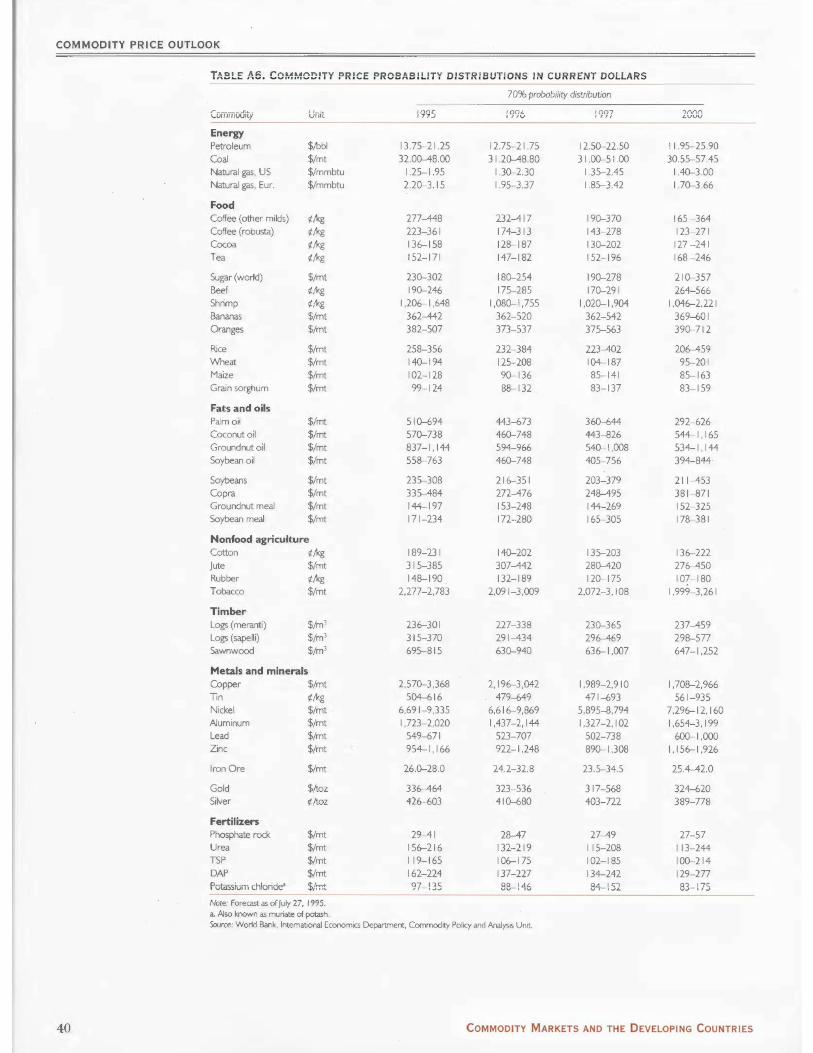
TABLE A6. COMMODITY PRICE PROBABILITY DISTRIBUTIONS IN CURRENT DOLLARS
70% probability distribution
Commodity Unit 1995 1996 1997 2000
Energy Petroleum $ibbl 13.75--21.25 12.75--21.75 12.50--22.50 11.95--25.90 Coal $/mt 32.~8.00 31.2~8.80 31.00--51.00 30.55--57.45 Natural gas, US $/mmbtu 1.25-1.95 1.30-2.30 1.35--2.45 1.40-3.00 Natural gas, Eur. $/mmbtu 2.20-3.15 1.95--3.37 1.85--3.42 1.70-3.66
Food Coffee (other milds) ¢Acg 277-448 232--417 190-370 165-364 Coffee (robusta) ¢Acg 223-361 174-313 143-278 123-271 Cocoa !tftcg 136--158 128-187 130-202 127-241 Tea !tftcg 152-171 147-182 152-196 168-246
Sugar (world) $/mt 230-302 180-254 190-278 210-357 Beef !tftcg 190-246 175--285 170-291 264-566 Shrimp !tftcg 1,206--1,648 1,080-1,755 1,020-1,904 1,046--2,221
· Bananas $/mt 362-442 362-520 362-542 369-{,01 Oranges $/mt 382-507 373-537 375--563 390-712
Rice $/mt 258-356 232-384 223--402 206--459 Wheat $/mt 140-194 125--208 104-187 95-201 Maize $/mt 102-128 90-136 85--141 85-163 Grain sorghum $/mt 99-124 88-132 83-137 83-159
Fats and oils Palm oil $/mt 510-<>94 443-<>73 360-<>44 292-626 Coconut oil $/mt 570-738 460-748 443-826 544-1,165 Groundnut oil $/mt 837- 1' 144 594-966 540-1,008 534-1,144 Soybean oil $/mt 558-763 460-748 405--756 394-844
Soybeans $/mt 235--308 216--351 203-379 211--453 Copra $/mt 335--484 272--476 248--495 381-871 Groundnut meal $/mt 144-197 153-248 144-269 152- 325 Soybean meal $/mt 171-234 172-280 165-305 178-381
Nonfood agriculture Cotton ¢Acg 189-231 140-202 135--203 136--222 jute $/mt 315--385 307-442 28~20 276--450 Rubber ¢Acg 148-190 132-189 120-175 107-180 Tobacco $/mt 2,277- 2,783 2,091-3,009 2,072-3,108 1,999- 3,261
Timber Logs ( meranti) $1m3 236--301 227-338 230-365 237--459 Logs (sapelli) $1m3 315--370 291--434 296--469 298-577 Sawnwood $1m3 695--815 630-940 636--1,007 647-1,252
Metals and minerals Copper $/mt 2,570-3,368 2,196--3,042 1,989- 2,910 I ,708-2,966 Tin ¢Acg 504-<>16 479-{,49 471-<>93 561-935 Nickel $/mt 6,691-9,335 6,616--9,869 5,895-8,794 7,296--12,160 Aluminum $/mt 1,723-2,020 1,437-2,144 I ,327-2,1 02 1,654-3,1 99 Lead $/mt 549-<>71 523-707 502-738 600-1,000 Zinc $/mt 954-1,166 922-1,248 890-1,308 1,1 56--I ,926
Iron Ore $/mt 26.0-28.0 24.2- 32.8 23.5--34.5 25.4--42.0
Gold $t\oz 336--464 323-536 317-568 324-<>20 Silver ¢/toz 426--603 410-<>80 403- 722 389- 778
Fertilizers Phosphate rock $/mt 29--41 28--47 27--49 27- 57 Urea $/mt I 56--216 132-219 115- 208 113-244 TSP $/mt 119- 165 106--175 102- 185 100--214 DAP $/mt 162- 224 137- 227 134-242 129- 277 Potassium chloride" $/mt 97- 135 88-146 84-152 83- 175
Note: Forecast as of july 27, I 995. a. Also known as muriate of potash. Source: World Bank, International Economics Department, Commodity Policy and Analysis Unit
40 COMMODITY MARKETS AND THE DEVELOPING COUNTRIES
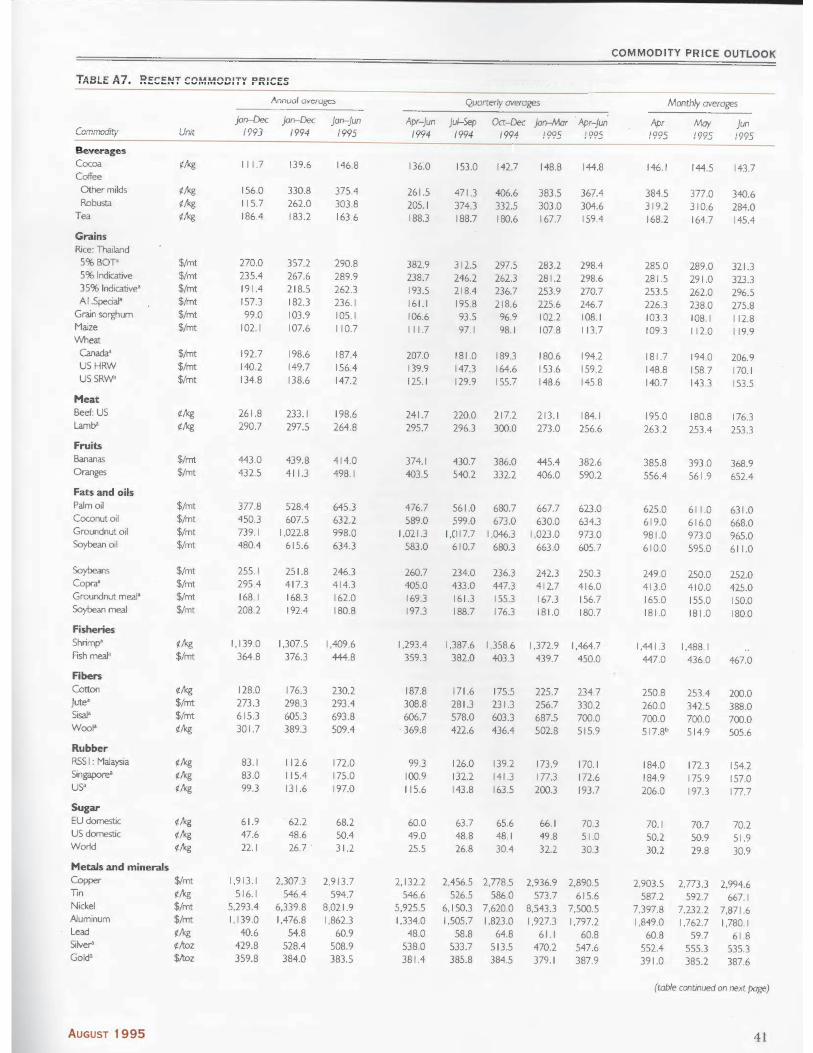
TABLE A7. RECENT COMMODITY PRICES
Annual averages
jan-Dec jan-Dec )an-jun Commodity Unit 1993 1994 1995
--~---------------------- -----Beverages Cocoa Coffee Othermilds Robusta
Tea
Grains Rice: Thailand 5%BOT• 5% Indicative 35% Indicative' AI .Special"
Grain sorghum Maize Wheat
Canada' USHRW USSRW'
Meat Beef: US Lamb'
Fndts Bananas Oranges
Fats and oils Palm oil Coconut oil Groundnut oil Soybean oil
Soybeans Copra• Groundnut meal' Soybean meal
Fisheries Shrimp" Fish meal"
Fibers Cotton jute' Sisal' Wool'
Rubber RSS I : Malaysia Singapore'
us• Sugar
$/mt $/mt $/mt $frnt $/mt $/mt
$/mt $/mt $/mt
$/mt $/mt
$/mt $frnt $/mt $/mt
$/mt $,Tnt $/mt $/mt
¢M, $Am
¢M, $/mt $/mt ¢M,
EU domestic ¢M, US domestic ¢M, World ¢M,
Metals and minerals Copper $/mt Tin ¢M, Nickel $,Tnt Aluminum $Am Lead ¢M, Silver' ¢/t!Jz Gold' $/t!Jz
AUGUST 1995
111.7
156.0 115.7 186.4
270.0 235.4 191.4 157.3 99.0
102.1
192.7 140.2 134.8
261.8 290.7
443.0 432.5
377.8 450.3 739.1 480.4
255.1 295.4 168.1 208.2
139.6
330.8 262.0 183.2
357.2 267.6 218.5 182.3 103.9 107.6
198.6 149.7 138.6
233. 1 297.5
439.8 411 .3
528.4 607.5
I ,022.8 615.6
251.8 417.3 168.3 192.4
146.8
375.4 303.8 163.6
290.8 289.9 262.3 236.1 105.1 110.7
187.4 156.4 147.2
198.6 264.8
414.0 498.1
645.3 632.2 998.0 634.3
246.3 414.3 162.0 180.8
I , 139.0 I ,307.5 I ,409.6 364.8 376.3 444.8
128.0 273.3 615.3 301.7
83.1 83.0 99.3
61.9 47.6 22.1
1,913.1 516.1
5,293.4 1,139.0
40.6 429.8 359.8
176.3 298.3 605.3 389.3
112.6 115.4 131 .6
. 62.2 48.6 26.7 .
2,307.3 546.4
6.339.8 1,476.8
54.8 528.4 384.0
230.2 293.4 693.8 509.4
172.0 175.0 197.0
68.2 50.4 31.2
2,913.7 594.7
8,021.9 1,862.3
60.9 508.9 383.5
QJ.Jarterly averages
Apr-jun jui-Sep Oct-Dec )an--Mar Apr-Jun 1994 1994 /994 1995 1995
136".0
261.5 205.1 188.3
382.9 238.7 193.5 161.1 106.6 111 .7
207.0 139.9 125.1
241.7 295.7
374. 1 403.5
476.7 589.0
1,021.3 583.0
260.7 405.0 169.3 197.3
153.0 142.7
471.3 406.6 374.3 332.5 188.7 180.6
312.5 246.2 218.4 195.8 93.5 97.1
181 .0 147.3 129.9
220.0 296.3
297.5 262.3 236.7 218.6 96.9 98.1
189.3 164.6 155.7
217.2 300.0
148.8 144.8
383.5 367.4 303.0 304.6 167.7 159.4
283.2 281.2 253.9 225.6 102.2 107.8
180.6 153.6 148.6
213.1 273.0
298.4 298.6 270.7 246.7 108.1 113.7
194.2 159.2 145.8
184.1 256.6
430.7 386.0 445.4 382.6 540.2 332.2 406.0 590.2
561.0 599.0
1,017.7 610.7
234.0 433.0 161.3 188.7
680.7 673.0
I ,046.3 680.3
236.3 447.3 155.3 176.3
667.7 630.0
I ,023.0 663.0
242.3 412.7 167.3 181.0
623.0 634.3 973.0 605.7
250.3 416.0 156.7 180.7
I ,293.4 I ,387.6 I ,358.6 I ,372.9 I ,464.7 359.3 382.0 403.3 439.7 450.0
187.8 308.8 606.7
. 369.8
99.3 100.9 115.6
60.0 49.0 25.5
2,132.2 546.6
5,925.5 1,334.0
48.0 538.0 381.4
171.6 281.3 578.0 422.6
175.5 231.3 603.3 436.4
126.0 139.2 132.2 141.3 143.8 163.5
63.7 48.8 26.8
2,456.5 526.5
6,150.3 1,505.7
58.8 533.7 385.8
65.6 48.1 30.4
2,778.5 586.0
7,620.0 1,823.0
64.8 513.5 384.5
225.7 256.7 687.5 502.8
173.9 177.3 200.3
66.1 49.8 32.2
2,936.9 573.7
8,543.3 1,927.3
61.1 470.2 379.1
234.7 330.2 700.0 515.9
170.1 172.6 193.7
70.3 51.0 30.3
2,890.5 615.6
7,500.5 1,797.2
60.8 547.6 387.9
COMMODITY PRICE OUTLOOK
Monthly averages
Apr /995
146.1
384.5 319.2 168.2
285.0 281.5 253.5 226.3 103.3 109.3
181.7 148.8 140.7
195.0 263.2
May 1995
jun 1995
144.5 143.7
377.0 340.6 310.6 284.0 164.7 145.4
289.0 291 .0 262.0 238.0 108.1 112.0
194.0 158.7 143.3
180.8 253.4
321.3 323.3 296.5 275.8 112.8 119.9
206.9 170.1 153.5
176.3 253.3
385.8 393.0 368.9 556.4 561.9 652.4
625.0 619.0 981 .0 610.0
249.0 413.0 165.0 181.0
611 .0 616.0 973.0 595.0
250.0 410.0 155.0 181 .0
I ,441.3 I ,488.1
631.0 668.0 965.0 611.0
252.0 425.0 150.0 180.0
447.0 436.0 467.0
250.8 260.0 700.0 517.8b
184.0 184.9 206.0
70. 1 50.2 30.2
2,903.5 587.2
7,397.8 1,849.0
60.8 552.4 391 .0
253.4 342.5 700.0 514.9
172.3 175.9 197.3
70.7 50.9 29.8
2,773.3 592.7
7,232.2 1.762.7
59.7 555.3 385.2
200.0 388.0 700.0 505.6
154.2 157.0 ln.7
70.2 51.9 30.9
2,994.6 667.1
7,871 .6 1,780.1
61.8 535.3 387.6
(table continued on next page)
41

COMMODITY PRICE OUTLOOK
TABLE A7. RECENT COMMODITY PRICES ( CONTINUED)
Annual averages Q}Jorterly averages
jan-Dec jan-Dec jan-jun Apr-jun ju!-Sep Oct-Dec Jan-Mar Apr-jun
Commodity Umt /993 1994 1995 1994 1994 /994 1994 /995
Zinc Iron ore Steel
¢tl<g $/mt
96.2 28.1
99.8 25.5
105.3 27.0
94.8 25.5
96.7 I 10.8 107.0 103.6 25.5 25.5 27.0 27.0
Rebar' $/mt $/mt $ftnt $ftnt
348.8 395.8 375.8 470.0
322.5 371.7 402.9 511.7
378.3 396.7 435.0 543.3
313.3 373.3 400.0 510.0
310.0 328.3 346.7 410.0
Wire rod' Hr coilsheet' Cr coilsheet'
366.7 356.7 366.7 426.7 410.0 410.0 416.7 453.3 516.7 .520.0 526.7 560.0
Energy Crude oil · Spot, average' Brent'
Dubai' West Texas lnt'
Natural gas Europe• us•
Coal Australia' us•
Tmber Logs Cameroon' Malaysia
Sawnwood Ghana• Malaysia
Plywood' Wood pulp'
Fertilizers Phosphate rock Urea• TSP DAP' Potassium chloride'
$Jbbl $tbbl $tbbl $Jbbl.
$/mmbtu $/mmbtu .
$/mt $/mt
$/ml $/ml ¢/sheet $/mt
$/mt $/mt $/mt $ftnt $/mt
16.8 17.0 14.9 18.6
2.7 2.1
31.3 38.0
310.3 389.8
530.7 758.3 661.4 423.9
33.0 106.8 111.9 129.1 107.4
15.9 15.8 14.7 17.2
2.4 1.9
32.3 36.5
330.3 307.5
618.5 821.0 602.0 552.5
33.0 147.9 132.1 172.8 105.7
17.7 17.5 16.7 18.8
2.7 1.6
38.3 40.8
343.2 275.7
649.9 750.2 622.4 772.8
35.0 209.8 146.6 205.9 116.6
16.2 16.0 14.8 17.7
2.4 2.0
31.5 35.8
319.6 338.1
606.2 849.5 637.9 513.9
33.0 136.0 131 .7 171.4 103.5
17.0 16.5 16.8 16.5 15.8 15.3 18.5 17.6
2.5 2.6 1.7 1.6
33.1 34.1 35.4 37.0
345.4 349.2 316.2 273.0
627.3 654.1 874.3 792.2 615.7 560.2 578.1 679.9
33.0 33.0 151.3 183.7 132.5 138.2 175.7 181.6 104. 1 110.1
World Bank commodity price indices for low- and middle-income countries ( 1990= I 00) .Agriculture 99.1 123.7 135.7 I 16.5 137.9 133.3
Food 98.6 106.7 113.0 102.8 105.8 110.8
Cereals 93.6 102.1 107.7 96.6 95.4 101.9
Fats and oils I 11 .5 126.0 133.1 122.7 126. 1 135.9
Other food 90.7 93.9 99.6 89.9 95.1 95.3
Beverages 84.9 150.4 166.4 126.2 201.5 177.8
.Agricultural raw materials 110.3 125.8 142.1 127.0 132.2 129.5
limber 152.4 156.6 142.7 163.5 165.9 149.3
Otherrawmaterials 81.5 104.8 141.7 102.1 109.1 115.9
Metals and minerals {exd. steel) 74.0 84.6 101 .9 79.3 86.6 98.5
Steelproducts 91.4 92.7 104.1 · 91 .2 92.7 94.6
Fertilizers 83.7 93.4 I 02.2 93.1 93.6 96.3
Nonfuel commodities (exd. steel) 91.6 111.9 125.2 105.4 122.2 122.5
Petroleum, crude 73.6 69.4 77.2 70.7 74.4 72. I
Note: Pnces as of july 6, 1995 .
.. Not available. a. Not included in index. b. Average fOr less than period indiated.
c. Included in the petroleLm index but not in the nonfuel index. d. Estrnate. Source: World Bank. lntematiooal Economics Department, Commodity Policy and Analysis Un~.
17.2. 16.9 16.4 18.2
2.7 1.5
37.7 41 .2
340.7 261.1
651 .1 753.5 602,2 736.3
35.0 224.3 145.8 215.0 114.8
18.1 18.1 17.0 19.3
2.7 1.6
38.9 40.5
345.8 290.4
648.7 746.9 642.5 809.3
35.0 195.3 147.5 196.8 118.3
136.4 134.9 113.4 112.6 104.9 110.4 135.1 131.1 100.4 98.7 169.2 163.7 141.9 142.3 142.1 143.2 141.8 141.6 103.6 100.2 98.4 109.8
101.7 102.6 126.3 124.2 75.1 79.3
Monthly averages
Apr /995
106.1 27.0
410.0 420.0 440.0 550.0
18.6 18.7 17.4 19.9
2.7 1.6
37.1 41 .5
350.6 300.9
653.1 730.8 665.1 813.0
35.0 212.Qd 147.5 205.9 117.5
137.5 111.2 104.4 131 .0 98.7
170.5 147.2 141.4 151 .2 101.0 107.6 102.6 126.3 81.5
May /995
jun /995
103.6 10 1.0 27.0 27.0
410.0 410.0 430.0 430.0 450.0 470.0 560.0 570.0
18.4 17.4 18.4 17.4 17.3 16.2 19.6 18.5
2.7 2.7 1.6 1.6
38.8 40.8 40.0 40.0
341.0 345.8 . 289.7 280.6
645.5 647.7 750.8 759.1 635.4 627.0 807.5 807.5
35.0 35.0 194.Qd I 80.Qd 147.5 147.5 192.7 191 .9 118.5 119.0
136.4 130.8 111.5 115.2 108.8 118.2 129.6 132.6 98.2 99.3
167.1 153.5 145.7 134.0 143.8 144.5 146.9 126.8 97.7 101 .9
109.6 112.3 102.6 102.6 124.6 121 .9 80.5 75.9
42 COMMODITY MARKETS AND THE DEVELOPING COUNTRIES