Embed Size (px)
Citation preview
8/2/2019 Commodity Markets and Futures Prices Section2 4
http://slidepdf.com/reader/full/commodity-markets-and-futures-prices-section2-4 1/12
Revaluation Versus Devaluation:
A Study of Exchange-Rate Changes
W illiam R. Folks, Jr. and Stanley R. Stansell
The purpose of this study is to determine whether the technique of linear
discriminant analysis can assist in exchange-risk m anage m ent. Specifically,
a discriminant function, using readily available or estimable macro-
economic values is developed which will classify countries into two dis
tinct groups: 1) countries whose currency value (relative to the value of
the dollar) will decrease by 5 percent or more over a two-year period,
and 2) coun tries whose curren cy value will no t show such a decrease.The authors believe that such a discriminant function, if reasonably ac
curate, is valuable in corporate exchange-risk management. Under normal
operating conditions, U.S.-based corporations with direct investments
overseas generally have an excess of assets over liabilities that are ex
posed to the risk of currency changes. Thus, a reduction in foreign-cur
rency values causes, at least for accounting purposes, a loss in the value
of exposed assets. Numerous strategies for adjusting the exchange-riskposture of the firm exist but require some warning for effective use. Some
projection of the extent of currency-rate change is also required to pre
vent adoption of exchange-adjustment strategies which may prove more
costly than the losses they were designed to prevent.
The authors hope that the discriminant function developed below will
provide an early warning of impending downward exchange-rate changes.
Armed with this warning, corroborated possibly by local sources, non-
statistically based projections, and other information, the exchange-risk manager can then provide closer surveillance of the currency under
suspicion, take long-range steps to adjust the exchange-risk posture of
the firm, and develop contingency plans for short-term measures should
the decrease in currency value become imm inent.
Will iam R. Folks , J r . i s a facul ty member a t the Univers i ty of South Carol ina and
Stanley R. Stanse l l i s a facul ty member a t the Univers i ty of Houston. This paper
was wr i t t en in 1973 .
© The Chicago Mercantile Exchange, 1979
www.cmegroup.com
8/2/2019 Commodity Markets and Futures Prices Section2 4
http://slidepdf.com/reader/full/commodity-markets-and-futures-prices-section2-4 2/12
144 SECTIO N 2 : FORW ARD -PRICING EFFICIENCY
In subsequent sections, the term "devaluing" countries or currencies
describes those currencies (relative to the dollar) th at lose 5 or more
percent of their value. Classification of a currency in this category does
no t necessarily m ean t ha t a formal dev aluation (notification to the International Monetary Fund of a change in par value or central rate) has
occurred. A loss in value may occur if the country elects to float its cur
rency vis-a-vis the dollar, and if that currency subsequently floats down
ward by 5 or more percent. Alternately, a revaluation of the dollar would
place a currency in the "devaluing" group, if that country did not match
the revaluation by one of its own . These d iverse methods of adju sting rela
tive currency value have led the authors to define a devaluing country as:one where die direct exchange rate (dollar value of one unit of foreign
currency) at the end of a two-year period is 95 or less percent of the direct
exchange rate at the beginning of the period. Market rates, ratiier than
par values, are used throughout. This criteria has been used to check all
significant rates where the country involved engaged in multiple-rate
practices.
Two years was selected as the classification time period in order to meet
the following conflicting goals: 1) the time period over which the pre
diction is made must be short enough to be of use to the manager, and
2) the time period must also be long enough to reduce obscuring effects
of political and speculative inputs on the actual timing of the devalua
tion. While a government intent on fighting devaluation of a currency
may fight a rearguard action for several years, an inability to correct the
basic economic factors which cause currency weakness must lead to ex
change-rate changes.Although the choice of a 5-percent change in currency value as die
method of classification might appear arbitrary, in a floating exchange-
rate situation as is now current, the authors feel that a 5-percent change
in value over a two-year period is a good estimate of a significant change
in currency value. Any change smaller than this amount may not merit
the surveillance inclusion that a devaluing country might indicate. In
addition, the International Monetary Fund's last arrangement for fixed
rates before the February, 1973 dollar devaluation allowed exchange-rate
bands of 4V& percent. Thus a 5-percent change would require formal
notification to the Fund. In the event of a return to a fixed-rate system
with periodic adjustments a nd a wider ban d (the crawling p eg ), use of
5-percent as a measure of exchange-rate changes would indicate approxi
mately those countries for which the peg adjustment would be necessary
over a two-year period.
© The Chicago Mercantile Exchange, 1979
www.cmegroup.com
8/2/2019 Commodity Markets and Futures Prices Section2 4
http://slidepdf.com/reader/full/commodity-markets-and-futures-prices-section2-4 3/12
Exchange-Rate Changes 145
DESIGN OF THE STUDY
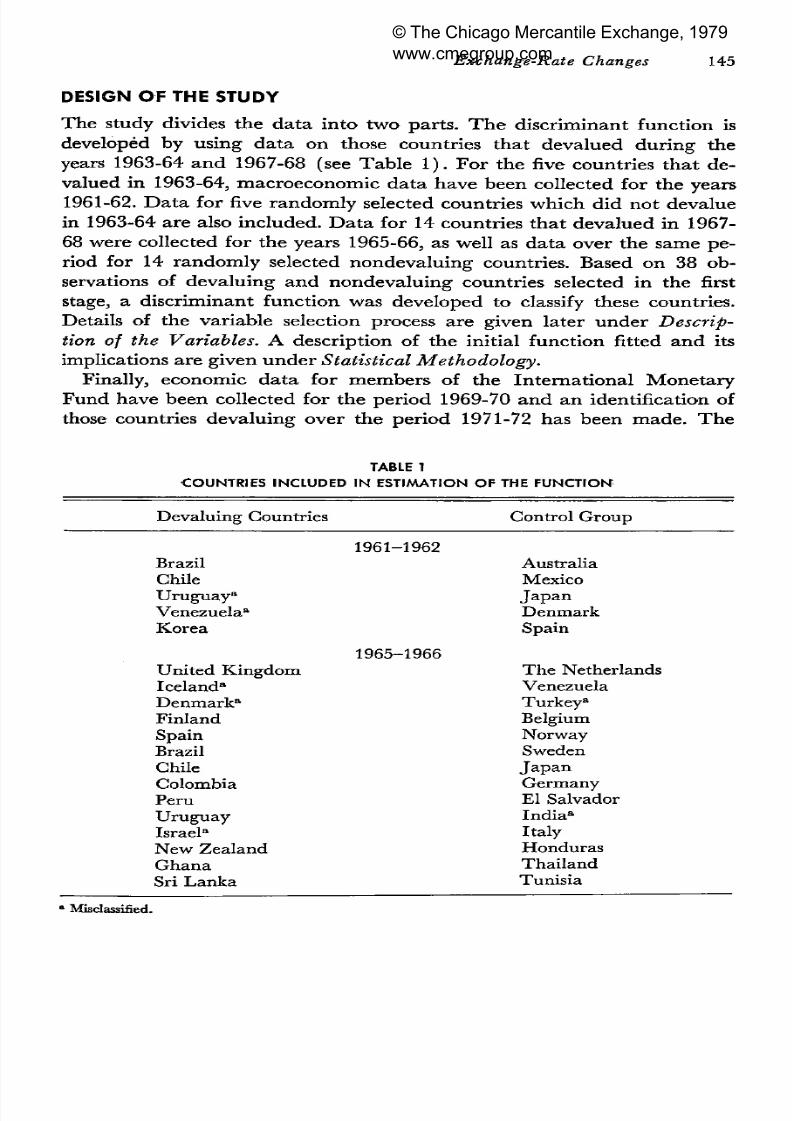
The study divides the data into two parts. The discriminant function is
developed by using data on those countries that devalued during theyears 1963-64 and 1967-68 (see Table 1). For the five countries that de
valued in 1963-64, macroeconomic data have been collected for the years
1961-62. Data for five randomly selected countries which did not devalue
in 1963-64 are also included. Data for 14 countries that devalued in 1967-
68 were collected for the years 1965-66, as well as data over the same pe
riod for 14 randomly selected nondevaluing countries. Based on 38 ob
servations of devaluing and nondevaluing countries selected in the first
stage, a discriminant function was developed to classify these countries.Details of the variable selection process are given later under Descrip
tion of the Variables. A description of the initial function fitted and its
implications are given under Statistical Methodology.
Finally, economic data for members of die International Monetary
Fund have been collected for the period 1969-70 and an identification of
those countries devaluing over the period 1971-72 has been made. The
TABLE 1
COUNTRIES INCLUDED IN ESTIMATION OF THE FUNCTION
Devaluing Countries Control Group
1961-1962BrazilChileUr ugua y3
Venezuela0
Korea
AustraliaMexicoJ a p a n
DenmarkSpain
1965-1966United KingdomIceland"
Denmark"
Finland
SpainBrazilChileColombiaPeruUru g u ay
Israel"New ZealandG h a n a
Sri Lanka
The NetherlandsVenezuelaTurkey"Belgium
NorwaySwedenJ a p a n
GermanyEl SalvadorIndia"
ItalyHondurasThai land
Tunisia
• Misclassified.
© The Chicago Mercantile Exchange, 1979
www.cmegroup.com
8/2/2019 Commodity Markets and Futures Prices Section2 4
http://slidepdf.com/reader/full/commodity-markets-and-futures-prices-section2-4 4/12
146 SE CT ION 2: FORWARD-PRICING E FFICIE NCY
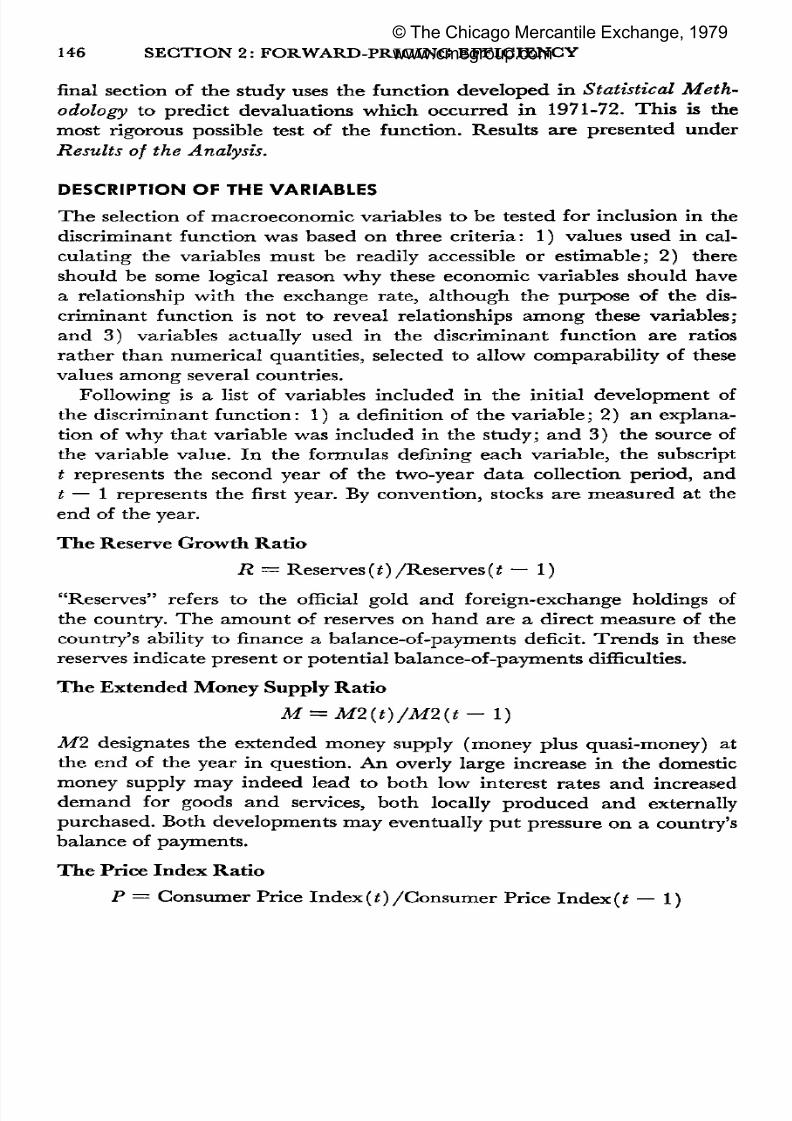
final section of the study uses the function developed in Statistical Meth
odology to predict devaluations which occurred in 1971-72. This is the
most rigorous possible test of the function. Results are presented under
Results of the Analysis.
DESCRIPTION OF THE VARIABLES
The selection of macroeconomic variables to be tested for inclusion in the
discriminant function was based on three criteria: 1) values used in cal
culating die variables must be readily accessible or estimable; 2) there
should be some logical reason why these economic variables should have
a relationship with the exchange rate, although the purpose of the discriminant function is not to reveal relationships among these variables;
and 3) variables actually used in the discriminant function are ratios
rather than numerical quantities, selected to allow comparability of these
values among several countries.
Following is a list of variables included in the initial development of
the discriminant func tion: 1) a definition of the va riab le; 2) an explana
tion of why tha t variable was included in the study; a nd 3) the source ofthe variable value. In the formulas defining each variable, the subscript
t represents the second year of the two-year data collection period, and
t — 1 represen ts the first year. By convention , stocks are m easu red at the
end of the year.
Th e Reserve Growth Ra tio
R = Reserves (t) /Reserves (t — 1)
"Reserves" refers to the official gold and foreign-exchange holdings of
the country. The amount of reserves on hand are a direct measure of the
country's ability to finance a balance-of-payments deficit. Trends in tiiese
reserves ind icate prese nt or po ten tial balance-of-paym ents difficulties.
Th e Extended M oney Supply Rat io
M = M2(t)/M2(t- 1)
Ml designates the extended money supply (money plus quasi-money) at
the end of the year in question. An overly large increase in the domestic
money supply may indeed lead to both low interest rates and increased
demand for goods and services, both locally produced and externally
purchased. Both developments may eventually put pressure on a country's
balance of payments.
T h e Price Index R atio
P = Consumer Price Index(t)/Consumer Price Index(r — 1)
© The Chicago Mercantile Exchange, 1979
www.cmegroup.com
8/2/2019 Commodity Markets and Futures Prices Section2 4
http://slidepdf.com/reader/full/commodity-markets-and-futures-prices-section2-4 5/12
Exchange-Rate Changes 147
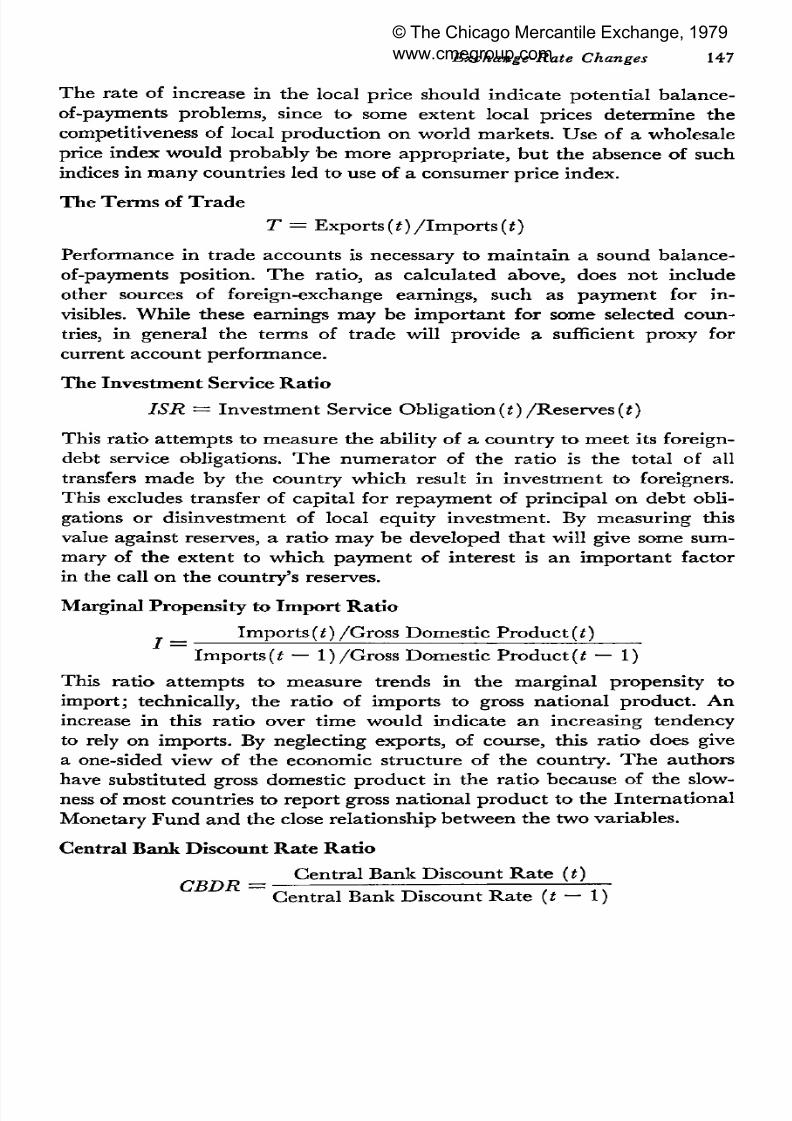
The rate of increase in the local price should indicate potential balance-
of-payments problems, since to some extent local prices determine the
competitiveness of local production on world markets. Use of a wholesale
price index would probably be more appropriate, but the absence of such
indices in many countries led to use of a consumer price index.
The Terms of Tr ad e
T = Exports (t) / I m por t s (t)
Performance in trade accounts is necessary to maintain a sound balance-
of-payments position. The ratio, as calculated above, does not include
other sources of foreign-exchange earnings, such as payment for invisibles. While these earnings may be important for some selected coun
tries, in general the terms of trade will provide a sufficient proxy for
current account performance.
Th e Investment Service Ra tio
ISR = Investment Service Obligation(t) /Reserves(t)
This ratio attempts to measure the ability of a country to meet its foreign-debt service obligations. The numerator of the ratio is the total of all
transfers made by the country which result in investment to foreigners.
This excludes transfer of capital for repayment of principal on debt obli
gations or disinvestment of local equity investment. By measuring this
value against reserves, a ratio may be developed that will give some sum
mary of the extent to which payment of interest is an important factor
in the call on the country's reserves.
Marginal Propensity to Im po rt R atio
_ Imports (£) /Gro ss Dom estic Product(t)
Imports(t — 1)/Gro ss Domestic Product(t — 1)
This ratio attempts to measure trends in the marginal propensity to
import; technically, the ratio of imports to gross national product. An
increase in this ratio over time would indicate an increasing tendency
to rely on imports. By neglecting exports, of course, this ratio does givea one-sided view of the economic structure of the country. The authors
have substituted gross domestic product in the ratio because of the slow
ness of most countries to report gross na tiona l produ ct to the Inte rna tion al
M onetary Fun d a nd the close relationship between th e two variables.
Central Bank Discount R ate Ra tio
Central Bank Discount Rate (t)CBDR =
Central Bank Discount Rate (t — 1)
© The Chicago Mercantile Exchange, 1979
www.cmegroup.com
8/2/2019 Commodity Markets and Futures Prices Section2 4
http://slidepdf.com/reader/full/commodity-markets-and-futures-prices-section2-4 6/12
148 SECTION 2 : FORW ARD -PRICING EFFICIENCY
Short-term money market rates may have an important influence on the
cross-border speculative and nonspeculative short-term capital move
ments. A frequently adopted device of currency defense is an increase
in the discount rate, as well as other monetary measures designed totighten the money supply and attract foreign capital. Thus, die discount
rate ratio serves as a proxy for the direction of change of money-market
rates.
STATISTICAL METHODOLOGY
The statistical technique employed here involves the use of multiple
discriminant analysis (hereafter, MDA). This approach has been used:to predict bankruptcy (Altaian, 1968); to predict bank capital adequacy
(Dince, 1972); in consumer credit evaluation (Myers and Forgy, 1963);
and in various manufacturing and financial institutions for predictive
purposes (Myers an d Forgy, 1963 ; W alter, 19 59).
MDA allows an observation to be classified into one of several a priori
groups based on the characteristics of that observation. This study classi
fies coun tries into tw o groups — those wh ich ha ve h ad significant down
ward exchange-rate changes relative to the dollar, and those which have
not had such changes. The two groups are distinguished by qualitative
differences, but the characteristics of the group must be quantifiable in
order to use the MDA technique. In this study, various ratios of publicly
available economic data are calculated to provide the test characteristics
of each grou p. W e would like to select tha t set of variables (ratios) which
is most similar within groups, yet wh ich best d iscriminates betw een groups.
MDA then derives the linear combination of characteristics that bestdiscriminates between these groups (i.e., between devaluing and nonde
valuing countries). The entire characteristic profile and its interactions
are considered by MDA, which is an obvious advantage when the number
of characteristics is large. (Variables are sometimes very important in a
multivariate analysis when they would be insignificant in a univariate
analysis.)
Once the coefficients of the characteristics (in this case, the ratios)are obtained from a set of observations, a composite score (usually called a
Z score) is calculated and employed as a dividing point between the two
groups. Alternatively, the posterior probabilities of falling into a given
group can be calculated. This latter technique is employed here. If the
assumptions of the analysis are met, and if the characteristics employed
are such that they, in fact, discriminate between the groups, the coefficients
can then be applied to other data in a predictive fashion. The BMD07M
stepwise discriminant analysis prog ram is used to construct the function.
© The Chicago Mercantile Exchange, 1979
www.cmegroup.com
8/2/2019 Commodity Markets and Futures Prices Section2 4
http://slidepdf.com/reader/full/commodity-markets-and-futures-prices-section2-4 7/12
Exchange-Rate Changes 149
RESULTS OF THE ANALYSIS
The macroeconomic ratios described under Description of the Variables
were calculated on the 38 countries listed in Table 1 to provide a dataset from which the discriminant function is estimated. (The 1961-62
period and the 1965-66 period are assumed to be similar enough to com
bine samples from these periods.) Since the purpose of the mode l is to
predict over an entirely different time period, observations from the 1961-
62 period are combined witii those from 1965-66 to eliminate special
factors which might have prevailed in only one period. As a precautionary
measure, five control-group countries were selected from the 1961-62
period and 14 from the 1965-66 period to m atc h the n um ber of dev aluingcountries available during these respective periods.
Since relatively few countries devalue their currency, and since ade
qua te data sets exist for even fewer countries, Ta ble 1 includes in die set
of devaluing countries three (Brazil, Chile, and Uruguay) which de
valued twice — once in the 1961-62 period, and again in the 1965-66 pe
riod. Also included in the control group, are two countries (Spain and
Venezuela) which had devalued during other time periods. Japan isincluded in the control group twice, once in each time period. These
overlaps result from both the scarcity of devaluing countries and from the
random-selection process. Including the same country twice in the same
group probably spuriously increases within-group homogeneity, while in
cluding the same country in both groups (even when data are drawn
from different time periods) probably reduces between-group differences.
Were die model explanatory in nature, these criticisms would be valid.
Th e crucial test of this model lies in its pred ictive capab ilities.
Using MDA, the discriminant function is estimated from data defined
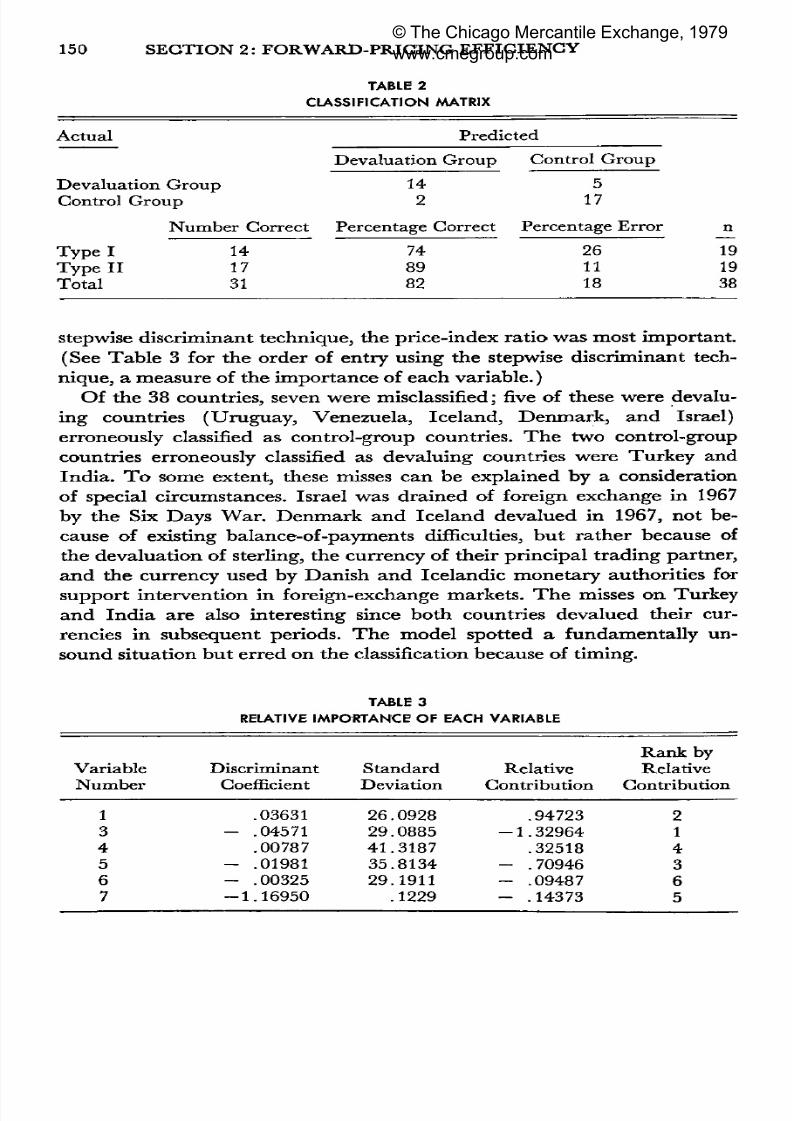
previously. The classification matrix is presented in Table 2. The model
correctly classifies 82 percent of the sample. The Type I error is large,
approximately 26 percent, while the Type II error is significantly smaller
at 11 percent. Eitiier error, however, is considerably less than expected by
chance (since both groups are of equal size, we would expect a .50 proba
bility of being classified into either group), and is probably less than thoseincurred by the majority of foreign-exchange m anag ers.
The model produced an F of 3.07 witii 6 and 31 degrees of freedom,
significant at the 5-percent level. This tends to indicate that the model
has significant discriminatory power, although results are biased.
The only variable not included from the original set is the money-
supply ratio. This is somewhat surprising; possibly the effects of money-
supply changes are adequately measured by other variables such as the
price-index ratio. In terms of order of entry into the function using the
© The Chicago Mercantile Exchange, 1979
www.cmegroup.com
8/2/2019 Commodity Markets and Futures Prices Section2 4
http://slidepdf.com/reader/full/commodity-markets-and-futures-prices-section2-4 8/12
150 SE CT ION 2 : FORWA RD-PRICING E FFICIE NCY
TABLE 2
CL ASSIF ICAT IO N M AT RIX
Actua l
Devaluat ion GroupControl Group
Number Correct
Ty pe I 14Type II 17Total 31
Predicted
Devaluat ion Group
14
2
Percentage Correct
748982
Control Group
517
Percentage Error
261118
n
191938
stepwise discriminant technique, the price-index ratio was most important.
(See Table 3 for the order of entry using the stepwise discriminant tech
nique, a measure of the im portan ce of each variable.)
Of the 38 countries, seven were misclassified; five of these were devalu
ing countries (Uruguay, Venezuela, Iceland, Denmark, and Israel)
erroneously classified as control-group countries. The two control-groupcountries erroneously classified as devaluing countries were Turkey and
India. To some extent, these misses can be explained by a consideration
of special circumstances. Israel was drained of foreign exchange in 1967
by the Six Days War. Denmark and Iceland devalued in 1967, not be
cause of existing balance-of-payments difficulties, but rather because of
the devaluation of sterling, the currency of their principal trading partner,
and the currency used by Danish and Icelandic monetary authorities for
support intervention in foreign-exchange markets. The misses on Turkey
and India are also interesting since botii countries devalued their cur
rencies in subsequent periods. The model spotted a fundamentally un
sound situation but erred on the classification because of timing.
TABLE 3
RELATIVE IMPORTANCE OF EACH VARIABLE
VariableN u m b e r
1345
67
DiscriminantCoefficient
.03631- .04571
.00787- .01981
- .00325- 1 . 1 6 9 5 0
StandardDeviation
26.092829 .088541.318735.8134
29.1911.1229
RelativeContribution
.94723- 1 . 3 2 9 6 4
.32518- .70946
- .09487- .14373
Rank by
RelativeContribution
21
4
3
65
© The Chicago Mercantile Exchange, 1979
www.cmegroup.com
8/2/2019 Commodity Markets and Futures Prices Section2 4
http://slidepdf.com/reader/full/commodity-markets-and-futures-prices-section2-4 9/12
Exchange-Rate Changes 151
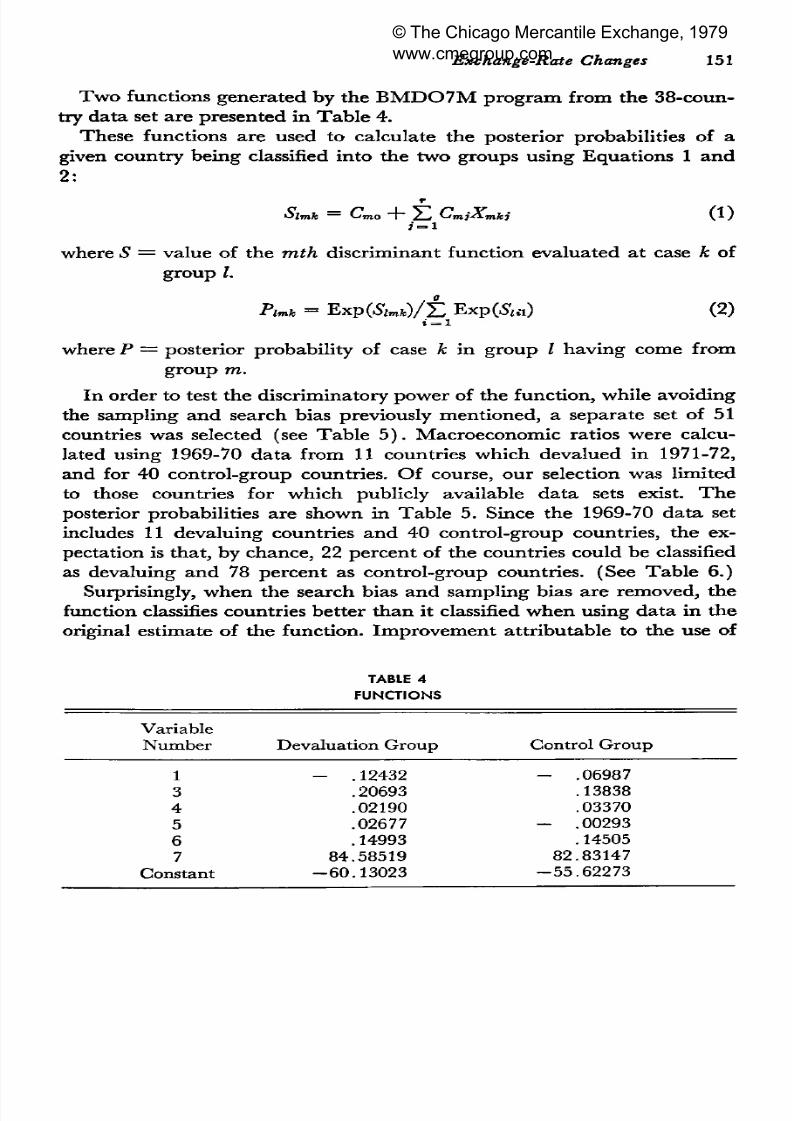
Two functions generated by the BMD07M program from the 38-coun-
try data set are presented in Tab le 4.
These functions are used to calculate the posterior probabilities of a
given country being classified into the two groups using Equations 1 and
2:
r
Oimt=
C m o "T~ 2-i (-'mjXmki ( 1 )J = l
where S = value of the mth discriminant function evaluated at case k of
group I.
P lm k = Exp(Slmh)/± ExpOS,*) (2)i = l
where P = posterior probability of case k in group I having come from
group m.
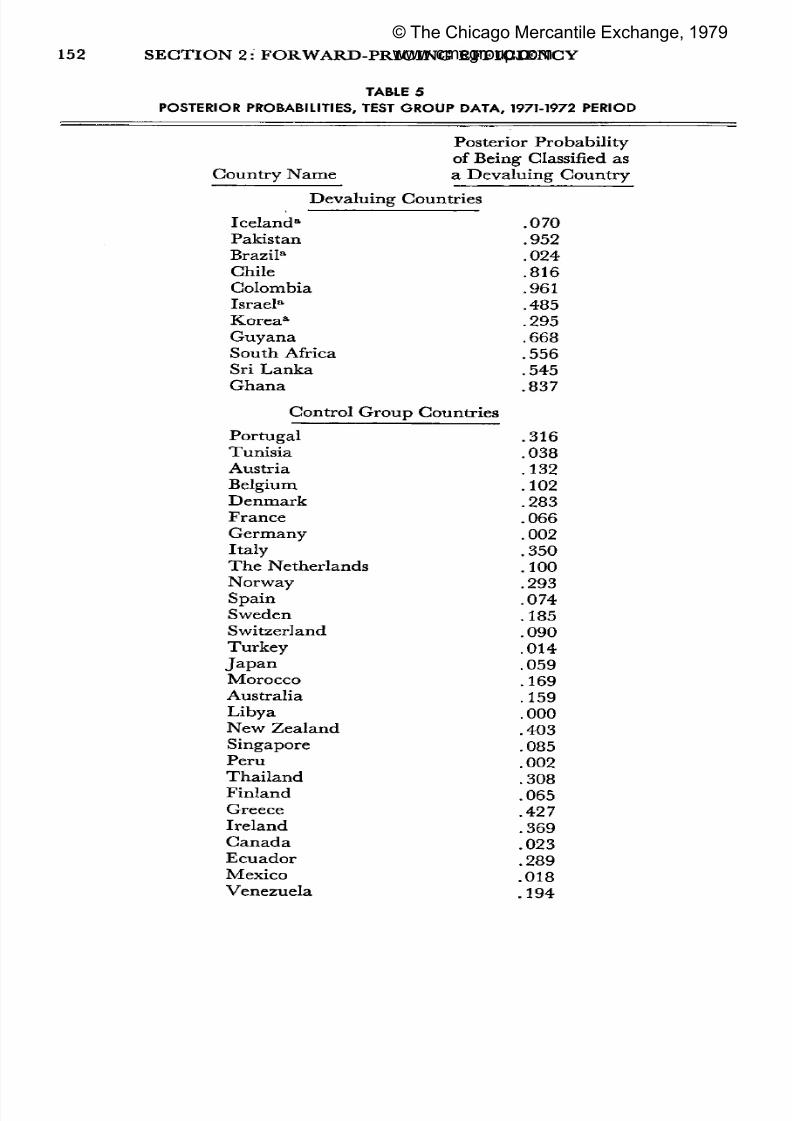
In orde r to test the discriminatory power of die function, while avoiding
die sampling and search bias previously mentioned, a separate set of 51
countries was selected (see Table 5). Macroeconomic ratios were calculated using 1969-70 data from 11 countries which devalued in 1971-72,
and for 40 control-group countries. Of course, our selection was limited
to those countries for which publicly available data sets exist. The
posterior probabilities are shown in Table 5. Since the 1969-70 data set
includes 11 devaluing countries and 40 control-group countries, the ex
pectation is that, by chance, 22 percent of the countries could be classified
as devaluing and 78 percent as control-group countries. (See Table 6.)
Surprisingly, when the search bias and sampling bias are removed, thefunction classifies countries better than it classified when using data in the
original estimate of the function. Improvement attributable to the use of
TABLE 4
FUNCTIONS
VariableN u m b e r
134567
Constant
Devaluat ion Group
- .12432.20693.02190.02677.14993
84.58519- 6 0 . 1 3 0 2 3
Control Group
- .06987.13838.03370
- .00293.14505
82.83147- 5 5 . 6 2 2 7 3
© The Chicago Mercantile Exchange, 1979
www.cmegroup.com
8/2/2019 Commodity Markets and Futures Prices Section2 4
http://slidepdf.com/reader/full/commodity-markets-and-futures-prices-section2-4 10/12
152 SECTIO N 2 : FORW ARD -PRICING EFFICIENCY
TABLE 5
POSTERIOR PROB ABILIT IES, TEST GR OU P DA TA , 1971-1972 PERIOD
Posterior Probabilityof Being Classified asCountry Name
Devaluing
Iceland"PakistanBrazil"Chile
ColombiaIsrael"Korea"Gu y an a
South AfricaSri LankaG h a n a
Control Grot:
PortugalTunisiaAustriaBelgium
DenmarkFranceGermany
ItalyThe Netherlands
NorwaySpainSwedenSwitzerlandTurkey
JapanMoroccoAustraliaLibya
New ZealandSingaporePeruThai landFinlandGreeceIrelandCan ad aEcuador
MexicoVenezuela
a Devaluing Country
Countries
.070
.952
.024
.816
.961.485
.295
.668
.556
.545
.837
ip Countries
.316
.038
.132
.102
.283
.066
.002
.350
.100
.293
.074
.185
.090
.014
.059
.169
.159
.000
.403.085
.002
.308
.065
.427
.369
.023
.289
.018.194
© The Chicago Mercantile Exchange, 1979
www.cmegroup.com
8/2/2019 Commodity Markets and Futures Prices Section2 4
http://slidepdf.com/reader/full/commodity-markets-and-futures-prices-section2-4 11/12
Exchange-Rate Changes 153
TABLE 5 (cont.)
Count ry Name
I ran"J o r d a n
EgyptChinaEl SalvadorHonduras"Jam a ica"Mauri t iusPhilippines
SyriaUnited Kingdom
Posterior Probability
of Being Classified asa Devaluing Country
1.000.400
.419
.025
.221
.981
.646.016
.008
.334
.485
a
Misclassif ied.
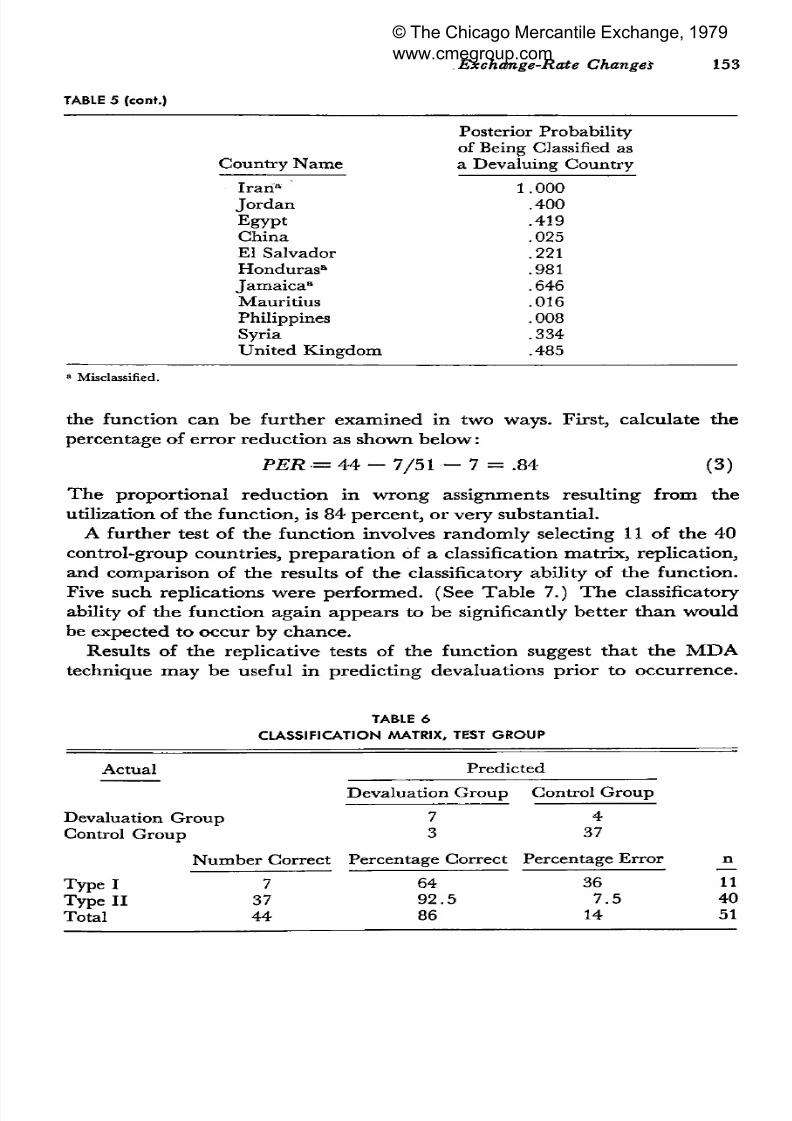
the function can be further examined in two ways. First, calculate the
percentage of error red uction as shown below :PER = 44 - 7/5 1 — 7 = .84 (3)
The proportional reduction in wrong assignments resulting from the
utilization of the function, is 84 percent, or very substan tial.
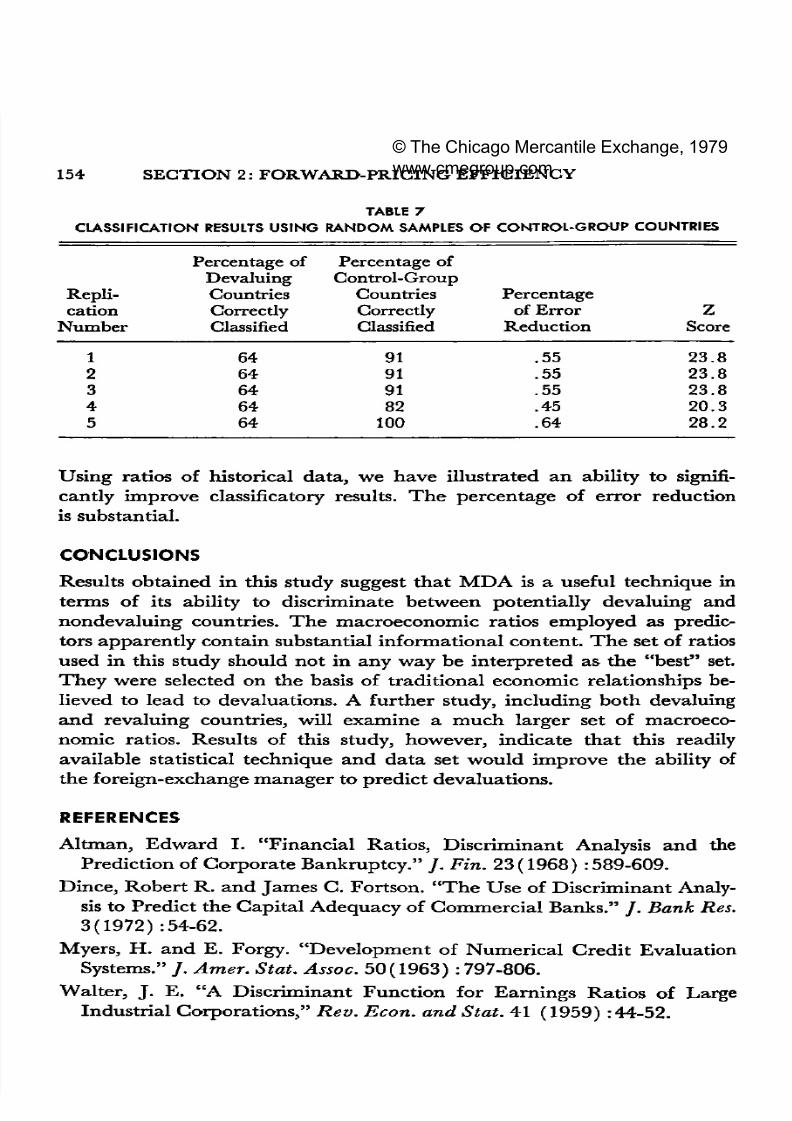
A further test of the function involves randomly selecting 11 of the 40
control-group countries, preparation of a classification matrix, replication,
and comparison of die results of the classificatory ability of the function.
Five such replications we re perform ed. (See Ta ble 7.) T he classificatoryability of the function again appears to be significantly better than would
be expected to occur by chanc e.
Results of the replicative tests of the function suggest that the MDA
technique may be useful in predicting devaluations prior to occurrence.
TABLE 6
CL ASSIF ICAT IO N M AT RIX , T EST G R O U P
Actual Predicted
Devaluation G roup Control Grou p
Devaluation G rou p 7 4Control G rou p 3 37
N um ber Correct Percentage Correct Percentage Error
Type I 7 64 36Type II 37 92 .5 7 .5Total 44 86 14
n
114051
© The Chicago Mercantile Exchange, 1979
www.cmegroup.com
8/2/2019 Commodity Markets and Futures Prices Section2 4
http://slidepdf.com/reader/full/commodity-markets-and-futures-prices-section2-4 12/12
154 SECTION 2 : FORW ARD -PRICING EFFICIENCY
TABLE 7
CLASSIFICATION RESULTS USING RANDOM SAMPLES OF CONTROL-GROUP COUNTRIES
Repli cation
N u m b e r
1
23
45
Percentage ofDevaluingCountriesCorrecdyClassified
646464
6464
Percentage ofControl-Group
CountriesCorrecdyClassified
919191
82100
Percentageof Error
Reduct ion
.55
.55
.55
.45
.64
ZScore
23 .823 .82 3 .8
2 0 .328.2
Using ratios of historical data, we have illustrated an ability to signifi
cantly improve classificatory results. The percentage of error reduction
is substantial.
CONCLUSIONS
Results obtained in this study suggest that MDA is a useful technique in
terms of its ability to discriminate between potentially devaluing and
nondevaluing countries. The macroeconomic ratios employed as predic
tors apparently contain substantial informational content. The set of ratios
used in this study should not in any way be interpreted as the "best" set
They were selected on the basis of traditional economic relationships be
lieved to lead to devaluations. A further study, including both devaluingand revaluing countries, will examine a much larger set of macroeco
nomic ratios. Results of this study, however, indicate that this readily
available statistical techniq ue an d da ta set wou ld improve the ability of
the foreign-exchange ma nag er to predict devaluations.
REFERENCES
Altaian, Edward I. "Financial Ratios, Discriminant Analysis and thePrediction of Corp orate Bank ruptcy." / . Fin. 23 (1968) : 589-609.
Dince, Rob ert R. and Jam es C. Fortson. " T h e Use of Discriminant Analy
sis to Predict the C apital A dequacy of Com mercial B anks." /. Bank Res.
3(1 97 2) : 54-62.
Myers, H. and E. Forgy. "Development of Numerical Credit Evaluation
Systems." / . Amer. Stat. Assoc. 50 (19 63 ): 797-806.
Walter, J. E. "A Discriminant Function for Earnings Ratios of LargeIndustrial Corporations," Rev. Econ. and Stat. 41 (1959):44-52.
© The Chicago Mercantile Exchange, 1979
www.cmegroup.com