Embed Size (px)
Citation preview
COMMODITY BOOMS AND THEIR IMPACTS
ON THE WESTERN AUSTRALIAN ECONOMY:
THE IRON ORE CASE
by
Qiang Ye State Development Strategies Division
Western Australian Department of Industry and Resources
Abstract
Western Australia is a resource-rich province. Since 1890s, the resources booms have played a key role in the development of the State’s economy. In the last a few years, Western Australia’s resources industry continued to enjoy exceptional conditions created by strong international demand for commodities. This paper is aimed to examine the likely impact of this commodity boom in the iron ore sector on the Western Australian economy using a general equilibrium approach. The modelling results indicate that the Western Australian economy will benefit from the expansion in iron ore exports and investment in terms of rising consumption and employment, although at the industry level there will be losers as well as winners.
*I would like to thank Professor Ken Clements, Dr Grant Coble-Neal and Ms Dianne Forde for their helpful comments and suggestions. I am also grateful to Dr Don Flint for providing me with some valuable data. This study is a contribution to the ARC Linkage Project “Exchange Rates and Commodity Prices” of the Economic Research Centre, The University of Western Australia. The views expressed here are those of the author and do not necessarily represent those of the Department of Industry and Resources.
2
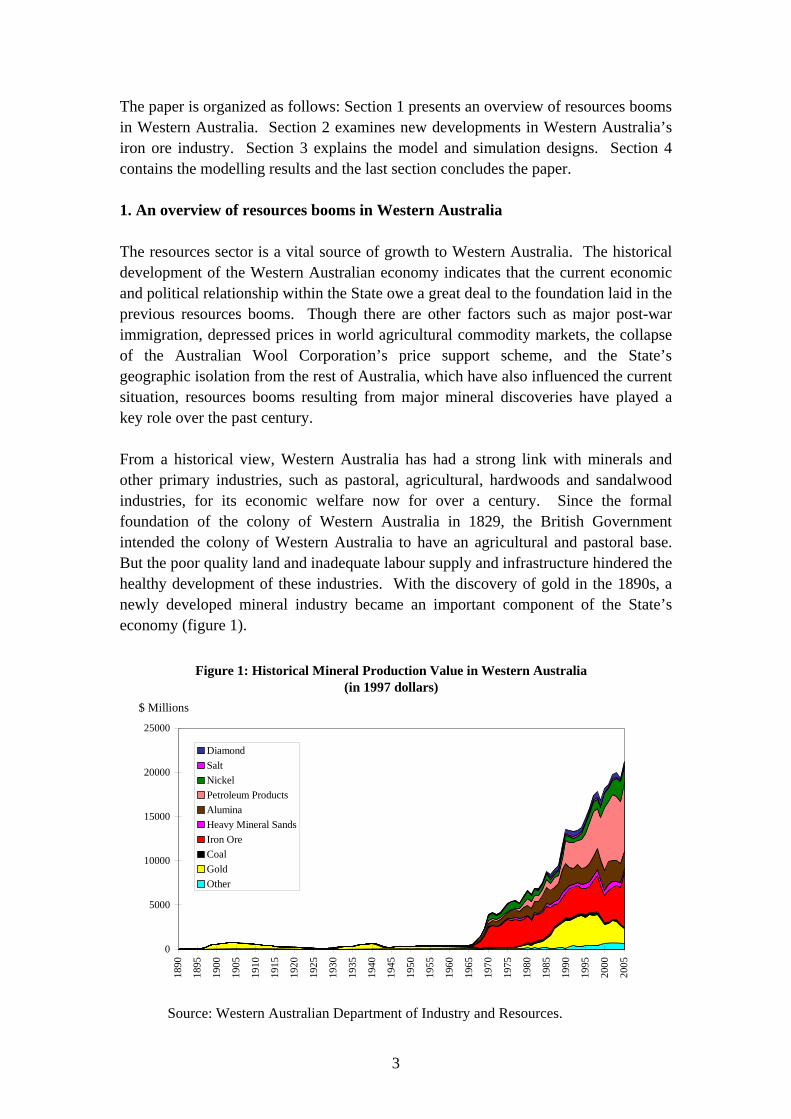
Introduction Western Australia is a resource-rich province and among the world’s major producers of heavy mineral sands, iron ore, diamonds, alumina, nickel and liquefied natural gas (LNG). Western Australia has significant world market shares for a range of strategic minerals. In 2005 for example, Western Australia accounted for 54% of world tantalum production, 32% of zircon, 26% of rutile, 18% of iron ore, 17% of alumina, 15% of nickel, 8% of LNG and 7% of gold (table 1).
Table 1: Western Australian share of world production for 2005 (by quantity)
Commodity Share (%)
Tantalum 54 Zircon 32 Rutile 26 Ilmenite 18 Iron ore 18 Diamonds (mainly industrial grade) 18 Alumina 17 Nickel 15 LNG (seaborne trade) 8 Gold 7 Salt 5
Source: Western Australian Department of Industry and Resources, ABARE and USGS. The resources sector which consists of the mining and petroleum industries has long played an important role in the Western Australian economy. In 2004, the resources sector accounted for around one quarter of gross state product and around 80% of the State’s merchandise exports. In 2004-05, capital expenditure on mining equalled 56.5% of total Western Australia capital expenditure. Total commodity sales reached $33.2 billion, generating $1.26 billion of mining and petroleum royalties. In the last a few years, Western Australia’s resources sector continued to enjoy exceptional conditions created by strong international demand for commodities. This paper aims to examine the impact of this commodity boom, specifically the iron ore resources boom, on the Western Australian economy using a general equilibrium approach.1
1 Previous studies on the economy-wide impacts of resources projects in Western Australia include Adams (2004), Clements and Greig (1994), Clements et al. (1996), Layman (2004) and Ye (1998).
3
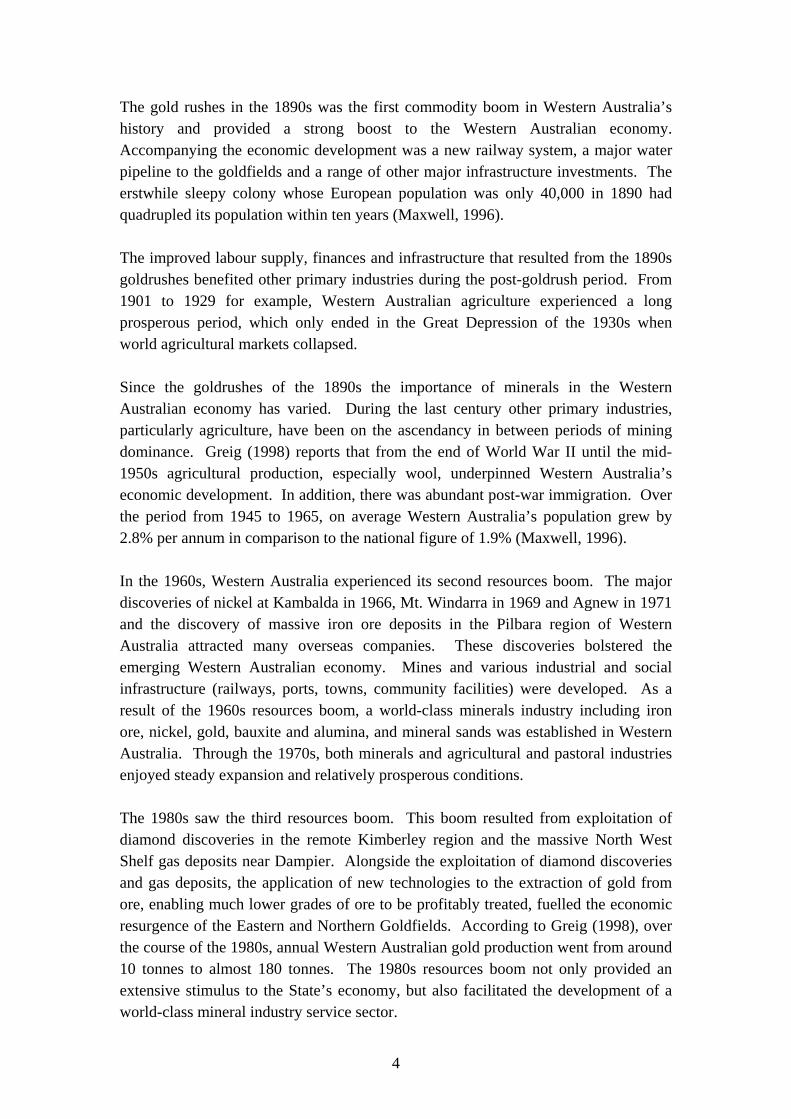
The paper is organized as follows: Section 1 presents an overview of resources booms in Western Australia. Section 2 examines new developments in Western Australia’s iron ore industry. Section 3 explains the model and simulation designs. Section 4 contains the modelling results and the last section concludes the paper. 1. An overview of resources booms in Western Australia The resources sector is a vital source of growth to Western Australia. The historical development of the Western Australian economy indicates that the current economic and political relationship within the State owe a great deal to the foundation laid in the previous resources booms. Though there are other factors such as major post-war immigration, depressed prices in world agricultural commodity markets, the collapse of the Australian Wool Corporation’s price support scheme, and the State’s geographic isolation from the rest of Australia, which have also influenced the current situation, resources booms resulting from major mineral discoveries have played a key role over the past century. From a historical view, Western Australia has had a strong link with minerals and other primary industries, such as pastoral, agricultural, hardwoods and sandalwood industries, for its economic welfare now for over a century. Since the formal foundation of the colony of Western Australia in 1829, the British Government intended the colony of Western Australia to have an agricultural and pastoral base. But the poor quality land and inadequate labour supply and infrastructure hindered the healthy development of these industries. With the discovery of gold in the 1890s, a newly developed mineral industry became an important component of the State’s economy (figure 1).
Figure 1: Historical Mineral Production Value in Western Australia(in 1997 dollars)
0
5000
10000
15000
20000
25000
1890
1895
1900
1905
1910
1915
1920
1925
1930
1935
1940
1945
1950
1955
1960
1965
1970
1975
1980
1985
1990
1995
2000
2005
$ Millions
DiamondSaltNickelPetroleum ProductsAluminaHeavy Mineral SandsIron OreCoalGoldOther
Source: Western Australian Department of Industry and Resources.
4
The gold rushes in the 1890s was the first commodity boom in Western Australia’s history and provided a strong boost to the Western Australian economy. Accompanying the economic development was a new railway system, a major water pipeline to the goldfields and a range of other major infrastructure investments. The erstwhile sleepy colony whose European population was only 40,000 in 1890 had quadrupled its population within ten years (Maxwell, 1996). The improved labour supply, finances and infrastructure that resulted from the 1890s goldrushes benefited other primary industries during the post-goldrush period. From 1901 to 1929 for example, Western Australian agriculture experienced a long prosperous period, which only ended in the Great Depression of the 1930s when world agricultural markets collapsed. Since the goldrushes of the 1890s the importance of minerals in the Western Australian economy has varied. During the last century other primary industries, particularly agriculture, have been on the ascendancy in between periods of mining dominance. Greig (1998) reports that from the end of World War II until the mid-1950s agricultural production, especially wool, underpinned Western Australia’s economic development. In addition, there was abundant post-war immigration. Over the period from 1945 to 1965, on average Western Australia’s population grew by 2.8% per annum in comparison to the national figure of 1.9% (Maxwell, 1996). In the 1960s, Western Australia experienced its second resources boom. The major discoveries of nickel at Kambalda in 1966, Mt. Windarra in 1969 and Agnew in 1971 and the discovery of massive iron ore deposits in the Pilbara region of Western Australia attracted many overseas companies. These discoveries bolstered the emerging Western Australian economy. Mines and various industrial and social infrastructure (railways, ports, towns, community facilities) were developed. As a result of the 1960s resources boom, a world-class minerals industry including iron ore, nickel, gold, bauxite and alumina, and mineral sands was established in Western Australia. Through the 1970s, both minerals and agricultural and pastoral industries enjoyed steady expansion and relatively prosperous conditions. The 1980s saw the third resources boom. This boom resulted from exploitation of diamond discoveries in the remote Kimberley region and the massive North West Shelf gas deposits near Dampier. Alongside the exploitation of diamond discoveries and gas deposits, the application of new technologies to the extraction of gold from ore, enabling much lower grades of ore to be profitably treated, fuelled the economic resurgence of the Eastern and Northern Goldfields. According to Greig (1998), over the course of the 1980s, annual Western Australian gold production went from around 10 tonnes to almost 180 tonnes. The 1980s resources boom not only provided an extensive stimulus to the State’s economy, but also facilitated the development of a world-class mineral industry service sector.
5
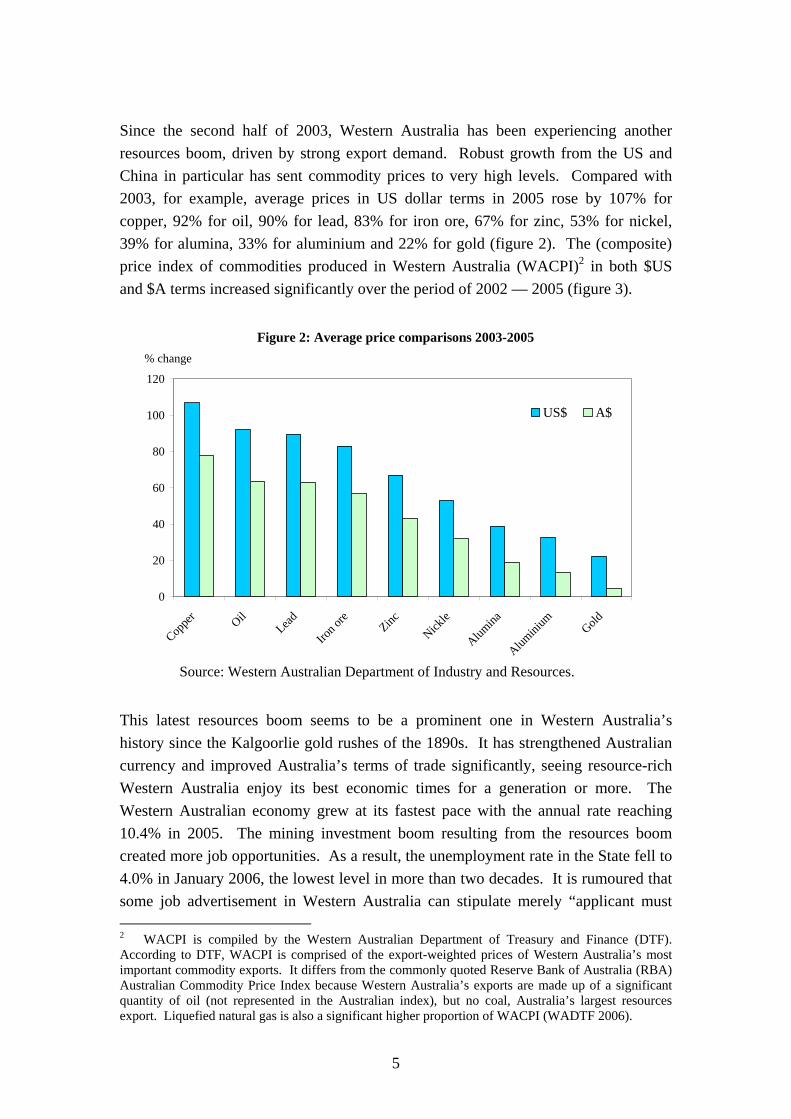
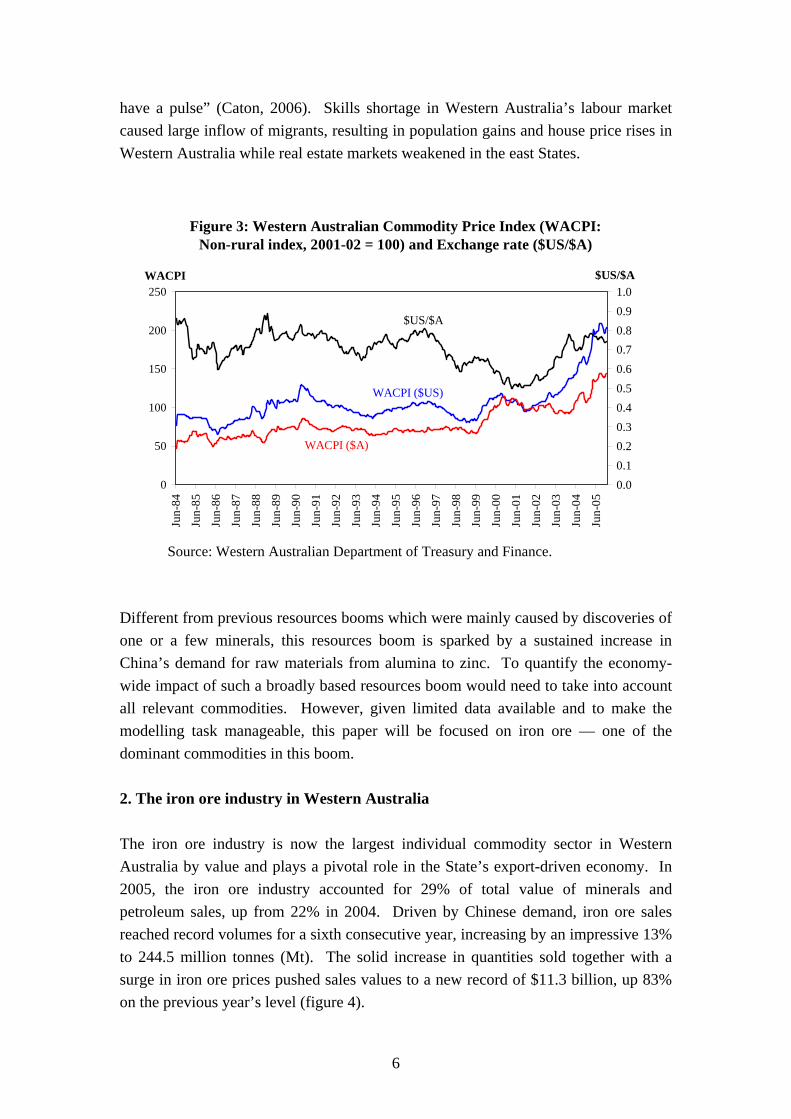
Since the second half of 2003, Western Australia has been experiencing another resources boom, driven by strong export demand. Robust growth from the US and China in particular has sent commodity prices to very high levels. Compared with 2003, for example, average prices in US dollar terms in 2005 rose by 107% for copper, 92% for oil, 90% for lead, 83% for iron ore, 67% for zinc, 53% for nickel, 39% for alumina, 33% for aluminium and 22% for gold (figure 2). The (composite) price index of commodities produced in Western Australia (WACPI)2 in both $US and $A terms increased significantly over the period of 2002 — 2005 (figure 3).
Figure 2: Average price comparisons 2003-2005
0
20
40
60
80
100
120
Coppe
r OilLead
Iron o
reZinc
Nickle
Alumina
Alumini
um Gold
% change
US$ A$
Source: Western Australian Department of Industry and Resources.
This latest resources boom seems to be a prominent one in Western Australia’s history since the Kalgoorlie gold rushes of the 1890s. It has strengthened Australian currency and improved Australia’s terms of trade significantly, seeing resource-rich Western Australia enjoy its best economic times for a generation or more. The Western Australian economy grew at its fastest pace with the annual rate reaching 10.4% in 2005. The mining investment boom resulting from the resources boom created more job opportunities. As a result, the unemployment rate in the State fell to 4.0% in January 2006, the lowest level in more than two decades. It is rumoured that some job advertisement in Western Australia can stipulate merely “applicant must 2 WACPI is compiled by the Western Australian Department of Treasury and Finance (DTF). According to DTF, WACPI is comprised of the export-weighted prices of Western Australia’s most important commodity exports. It differs from the commonly quoted Reserve Bank of Australia (RBA) Australian Commodity Price Index because Western Australia’s exports are made up of a significant quantity of oil (not represented in the Australian index), but no coal, Australia’s largest resources export. Liquefied natural gas is also a significant higher proportion of WACPI (WADTF 2006).
6
have a pulse” (Caton, 2006). Skills shortage in Western Australia’s labour market caused large inflow of migrants, resulting in population gains and house price rises in Western Australia while real estate markets weakened in the east States.
Figure 3: Western Australian Commodity Price Index (WACPI: Non-rural index, 2001-02 = 100) and Exchange rate ($US/$A)
0
50
100
150
200
250
Jun-
84
Jun-
85
Jun-
86
Jun-
87
Jun-
88
Jun-
89
Jun-
90
Jun-
91
Jun-
92
Jun-
93
Jun-
94
Jun-
95
Jun-
96
Jun-
97
Jun-
98
Jun-
99
Jun-
00
Jun-
01
Jun-
02
Jun-
03
Jun-
04
Jun-
05
WACPI
0.00.10.20.30.40.50.60.70.80.91.0
$US/$A
$US/$A
WACPI ($US)
WACPI ($A)
Source: Western Australian Department of Treasury and Finance.
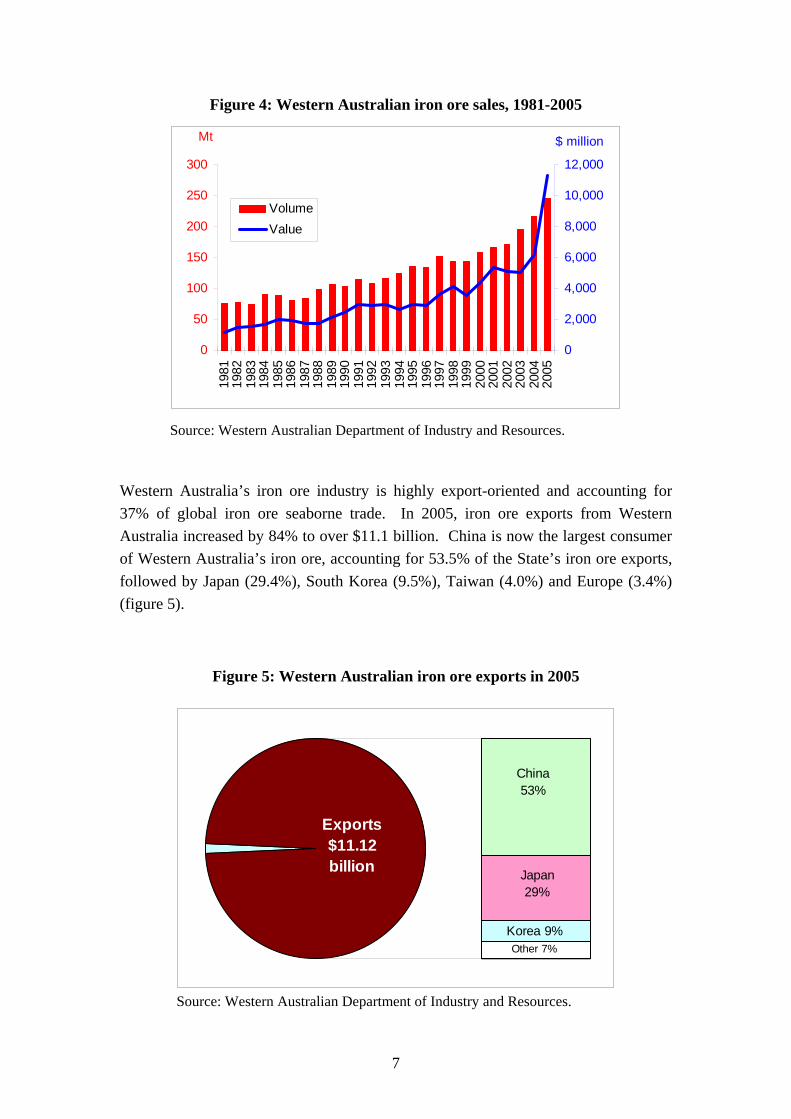
Different from previous resources booms which were mainly caused by discoveries of one or a few minerals, this resources boom is sparked by a sustained increase in China’s demand for raw materials from alumina to zinc. To quantify the economy-wide impact of such a broadly based resources boom would need to take into account all relevant commodities. However, given limited data available and to make the modelling task manageable, this paper will be focused on iron ore — one of the dominant commodities in this boom. 2. The iron ore industry in Western Australia The iron ore industry is now the largest individual commodity sector in Western Australia by value and plays a pivotal role in the State’s export-driven economy. In 2005, the iron ore industry accounted for 29% of total value of minerals and petroleum sales, up from 22% in 2004. Driven by Chinese demand, iron ore sales reached record volumes for a sixth consecutive year, increasing by an impressive 13% to 244.5 million tonnes (Mt). The solid increase in quantities sold together with a surge in iron ore prices pushed sales values to a new record of $11.3 billion, up 83% on the previous year’s level (figure 4).
7
Figure 4: Western Australian iron ore sales, 1981-2005
0
50
100
150
200
250
300
1981
1982
1983
1984
1985
1986
1987
1988
1989
1990
1991
1992
1993
1994
1995
1996
1997
1998
1999
2000
2001
2002
2003
2004
2005
Mt
0
2,000
4,000
6,000
8,000
10,000
12,000
$ million
VolumeValue
Source: Western Australian Department of Industry and Resources.
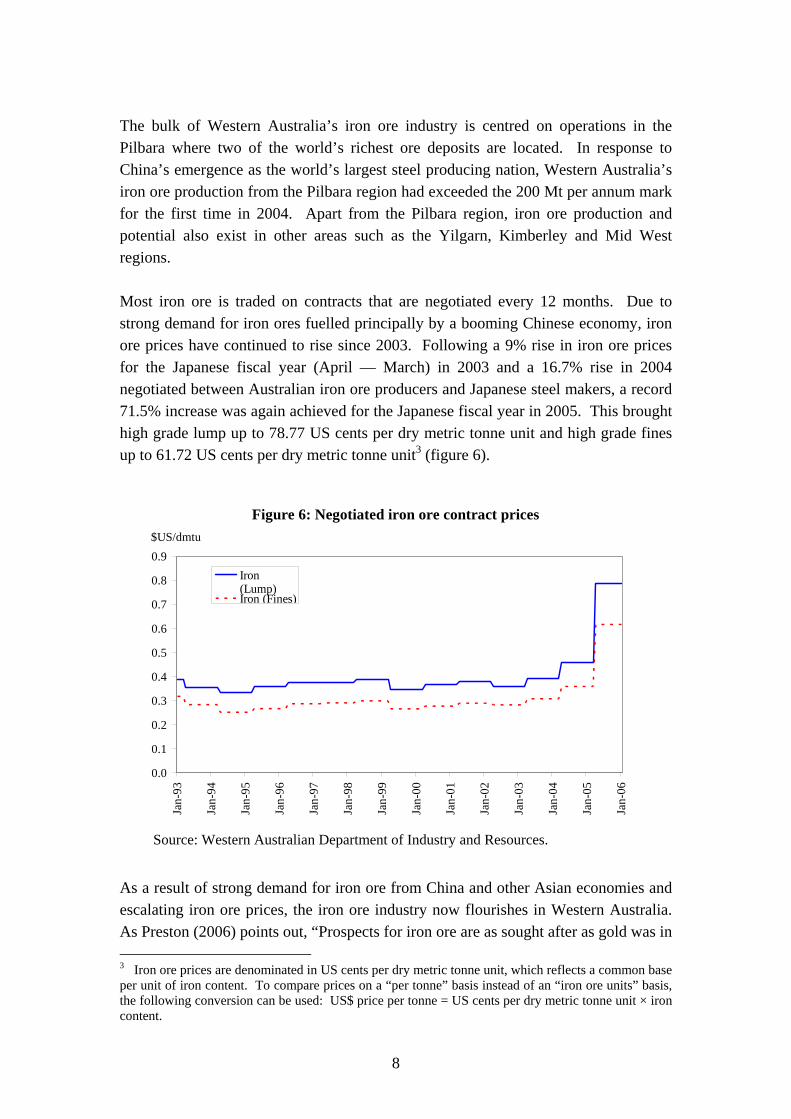
Western Australia’s iron ore industry is highly export-oriented and accounting for 37% of global iron ore seaborne trade. In 2005, iron ore exports from Western Australia increased by 84% to over $11.1 billion. China is now the largest consumer of Western Australia’s iron ore, accounting for 53.5% of the State’s iron ore exports, followed by Japan (29.4%), South Korea (9.5%), Taiwan (4.0%) and Europe (3.4%) (figure 5).
Figure 5: Western Australian iron ore exports in 2005
Japan29%
Exports$11.12 billion
Korea 9%Other 7%
China53%
Source: Western Australian Department of Industry and Resources.
8
The bulk of Western Australia’s iron ore industry is centred on operations in the Pilbara where two of the world’s richest ore deposits are located. In response to China’s emergence as the world’s largest steel producing nation, Western Australia’s iron ore production from the Pilbara region had exceeded the 200 Mt per annum mark for the first time in 2004. Apart from the Pilbara region, iron ore production and potential also exist in other areas such as the Yilgarn, Kimberley and Mid West regions. Most iron ore is traded on contracts that are negotiated every 12 months. Due to strong demand for iron ores fuelled principally by a booming Chinese economy, iron ore prices have continued to rise since 2003. Following a 9% rise in iron ore prices for the Japanese fiscal year (April — March) in 2003 and a 16.7% rise in 2004 negotiated between Australian iron ore producers and Japanese steel makers, a record 71.5% increase was again achieved for the Japanese fiscal year in 2005. This brought high grade lump up to 78.77 US cents per dry metric tonne unit and high grade fines up to 61.72 US cents per dry metric tonne unit3 (figure 6).
Figure 6: Negotiated iron ore contract prices
0.0
0.1
0.2
0.3
0.4
0.5
0.6
0.7
0.8
0.9
Jan-
93
Jan-
94
Jan-
95
Jan-
96
Jan-
97
Jan-
98
Jan-
99
Jan-
00
Jan-
01
Jan-
02
Jan-
03
Jan-
04
Jan-
05
Jan-
06
$US/dmtu
Iron(Lump)Iron (Fines)
Source: Western Australian Department of Industry and Resources.
As a result of strong demand for iron ore from China and other Asian economies and escalating iron ore prices, the iron ore industry now flourishes in Western Australia. As Preston (2006) points out, “Prospects for iron ore are as sought after as gold was in 3 Iron ore prices are denominated in US cents per dry metric tonne unit, which reflects a common base per unit of iron content. To compare prices on a “per tonne” basis instead of an “iron ore units” basis, the following conversion can be used: US$ price per tonne = US cents per dry metric tonne unit × iron content.
9
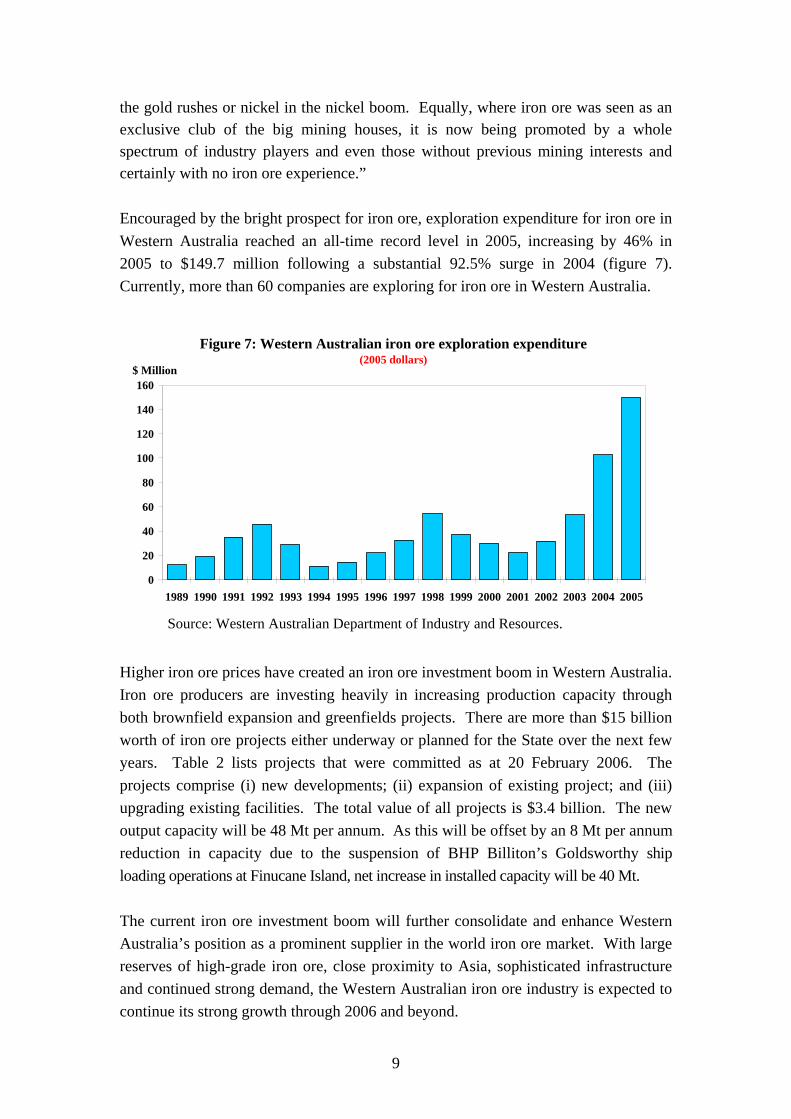
the gold rushes or nickel in the nickel boom. Equally, where iron ore was seen as an exclusive club of the big mining houses, it is now being promoted by a whole spectrum of industry players and even those without previous mining interests and certainly with no iron ore experience.” Encouraged by the bright prospect for iron ore, exploration expenditure for iron ore in Western Australia reached an all-time record level in 2005, increasing by 46% in 2005 to $149.7 million following a substantial 92.5% surge in 2004 (figure 7). Currently, more than 60 companies are exploring for iron ore in Western Australia.
Figure 7: Western Australian iron ore exploration expenditure(2005 dollars)
0
20
40
60
80
100
120
140
160
1989 1990 1991 1992 1993 1994 1995 1996 1997 1998 1999 2000 2001 2002 2003 2004 2005
$ Million
Source: Western Australian Department of Industry and Resources.
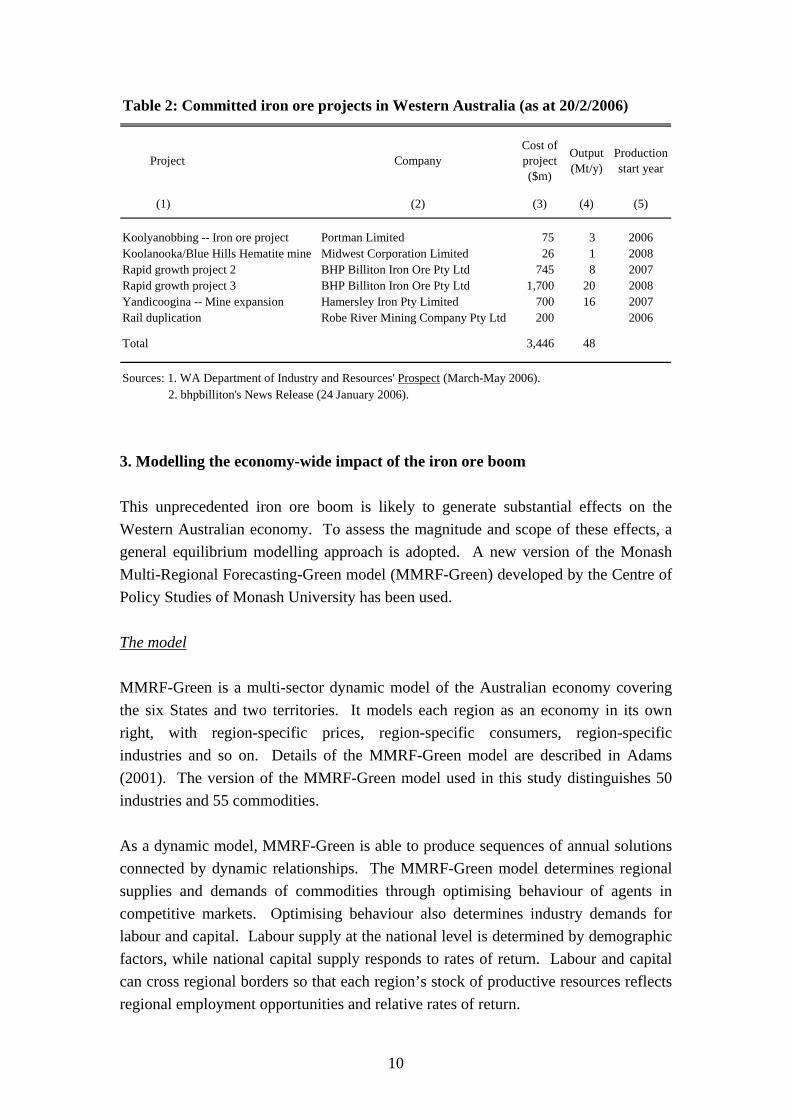
Higher iron ore prices have created an iron ore investment boom in Western Australia. Iron ore producers are investing heavily in increasing production capacity through both brownfield expansion and greenfields projects. There are more than $15 billion worth of iron ore projects either underway or planned for the State over the next few years. Table 2 lists projects that were committed as at 20 February 2006. The projects comprise (i) new developments; (ii) expansion of existing project; and (iii) upgrading existing facilities. The total value of all projects is $3.4 billion. The new output capacity will be 48 Mt per annum. As this will be offset by an 8 Mt per annum reduction in capacity due to the suspension of BHP Billiton’s Goldsworthy ship loading operations at Finucane Island, net increase in installed capacity will be 40 Mt. The current iron ore investment boom will further consolidate and enhance Western Australia’s position as a prominent supplier in the world iron ore market. With large reserves of high-grade iron ore, close proximity to Asia, sophisticated infrastructure and continued strong demand, the Western Australian iron ore industry is expected to continue its strong growth through 2006 and beyond.
10
Table 2: Committed iron ore projects in Western Australia (as at 20/2/2006)
(1) (2) (3) (4) (5)
Koolyanobbing -- Iron ore project Portman Limited 75 3 2006Koolanooka/Blue Hills Hematite mine Midwest Corporation Limited 26 1 2008Rapid growth project 2 BHP Billiton Iron Ore Pty Ltd 745 8 2007Rapid growth project 3 BHP Billiton Iron Ore Pty Ltd 1,700 20 2008Yandicoogina -- Mine expansion Hamersley Iron Pty Limited 700 16 2007Rail duplication Robe River Mining Company Pty Ltd 200 2006
Total 3,446 48
Sources: 1. WA Department of Industry and Resources' Prospect (March-May 2006). 2. bhpbilliton's News Release (24 January 2006).
Project Company Output (Mt/y)
Production start year
Cost of project ($m)
3. Modelling the economy-wide impact of the iron ore boom This unprecedented iron ore boom is likely to generate substantial effects on the Western Australian economy. To assess the magnitude and scope of these effects, a general equilibrium modelling approach is adopted. A new version of the Monash Multi-Regional Forecasting-Green model (MMRF-Green) developed by the Centre of Policy Studies of Monash University has been used. The model MMRF-Green is a multi-sector dynamic model of the Australian economy covering the six States and two territories. It models each region as an economy in its own right, with region-specific prices, region-specific consumers, region-specific industries and so on. Details of the MMRF-Green model are described in Adams (2001). The version of the MMRF-Green model used in this study distinguishes 50 industries and 55 commodities. As a dynamic model, MMRF-Green is able to produce sequences of annual solutions connected by dynamic relationships. The MMRF-Green model determines regional supplies and demands of commodities through optimising behaviour of agents in competitive markets. Optimising behaviour also determines industry demands for labour and capital. Labour supply at the national level is determined by demographic factors, while national capital supply responds to rates of return. Labour and capital can cross regional borders so that each region’s stock of productive resources reflects regional employment opportunities and relative rates of return.
11
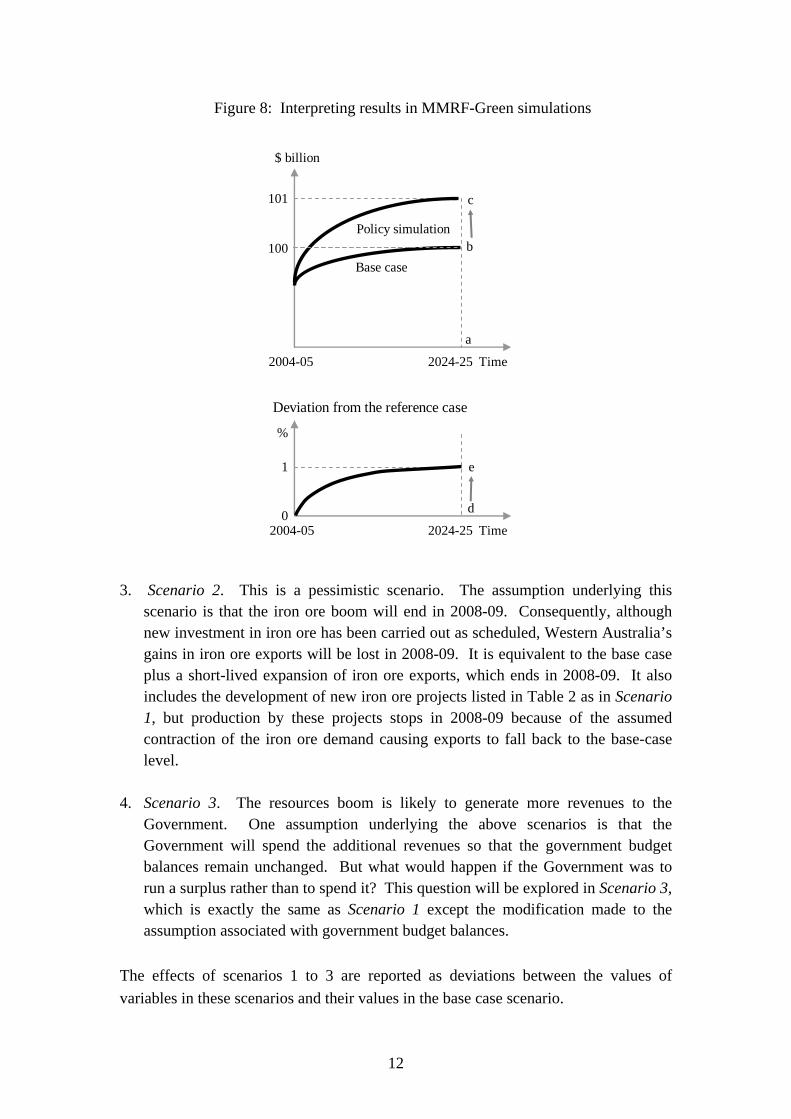
Interpreting results To run a dynamic simulation, MMRF-Green has to develop a reference case or a “business as usual” simulation. The reference case projects the growth in key variables in a region based on business-as-usual assumptions for the economy. In this report, for example, the reference case represents the likely outlook for general economic conditions in the Western Australian economy without the resources booms. Against the baseline provided by this reference case, the impacts of changes in policies or other external factors can be assessed. The estimated impacts on economic variables of policy changes or external shocks are typically expressed as percentage deviations between the equilibrium levels of those variables in the reference case and their equilibrium levels in the policy simulation. For example, the impact on Western Australian Gross State Product (GSP) of the iron ore boom can be identified by comparing the level in the State’s GSP in the policy simulation (i.e. with the iron ore boom) with its level in the reference case (i.e. without the iron ore boom). If GSP in the reference case in 2024-25 is projected to be $100 billion and following the iron ore boom, GSP in 2024-25 is projected to be $101 billion, this corresponds to a 1% increase in GSP from the reference case. Hence, in this example, the effect of the iron ore boom would be to increase Western Australia’s GSP by 1% compared with the reference case projection at 2024-25 (figure 8). Simulation design Strong demand for iron ore led by China has significantly pushed up iron ore prices and driven Western Australian iron ore exports to a record level, leaving the Western Australian iron ore industry to operate at full capacity. With global demand expected to remain strong, established and emerging Western Australian iron ore producers are investing heavily. To fully appreciate the impact of the iron ore boom on the Western Australian economy, both initial increases in iron ore exports and the subsequent investment boom in iron ore projects need to be simulated. Thus, the simulations involve a series of exogenous increases in both exports and investment in the iron ore sector based on data available. The following four scenarios that cover the period up to 2024-25 have been modelled: 1. Base Case. The base case or the reference case is a projection for the Australian
and state economies, representing the likely outlook for general economic conditions based on business-as-usual assumptions.
2. Scenario 1. This is an optimistic scenario which assumes that rising demand for
iron ore is sustainable, thus Western Australia’s iron ore exports will remain at its record level and new iron ore projects will materialise as scheduled. It is equivalent to the base case plus a total $3.6 billion increasing of iron ore exports together with the development of new iron ore projects listed in Table 2.
12
Figure 8: Interpreting results in MMRF-Green simulations
Deviation from the reference case
Base case
Policy simulation
$ billion
101
100
c
b
a
2004-05 2024-25 Time
2024-25 Time2004-05
e
d
1
0
%
3. Scenario 2. This is a pessimistic scenario. The assumption underlying this scenario is that the iron ore boom will end in 2008-09. Consequently, although new investment in iron ore has been carried out as scheduled, Western Australia’s gains in iron ore exports will be lost in 2008-09. It is equivalent to the base case plus a short-lived expansion of iron ore exports, which ends in 2008-09. It also includes the development of new iron ore projects listed in Table 2 as in Scenario 1, but production by these projects stops in 2008-09 because of the assumed contraction of the iron ore demand causing exports to fall back to the base-case level.
4. Scenario 3. The resources boom is likely to generate more revenues to the
Government. One assumption underlying the above scenarios is that the Government will spend the additional revenues so that the government budget balances remain unchanged. But what would happen if the Government was to run a surplus rather than to spend it? This question will be explored in Scenario 3, which is exactly the same as Scenario 1 except the modification made to the assumption associated with government budget balances.
The effects of scenarios 1 to 3 are reported as deviations between the values of variables in these scenarios and their values in the base case scenario.
13
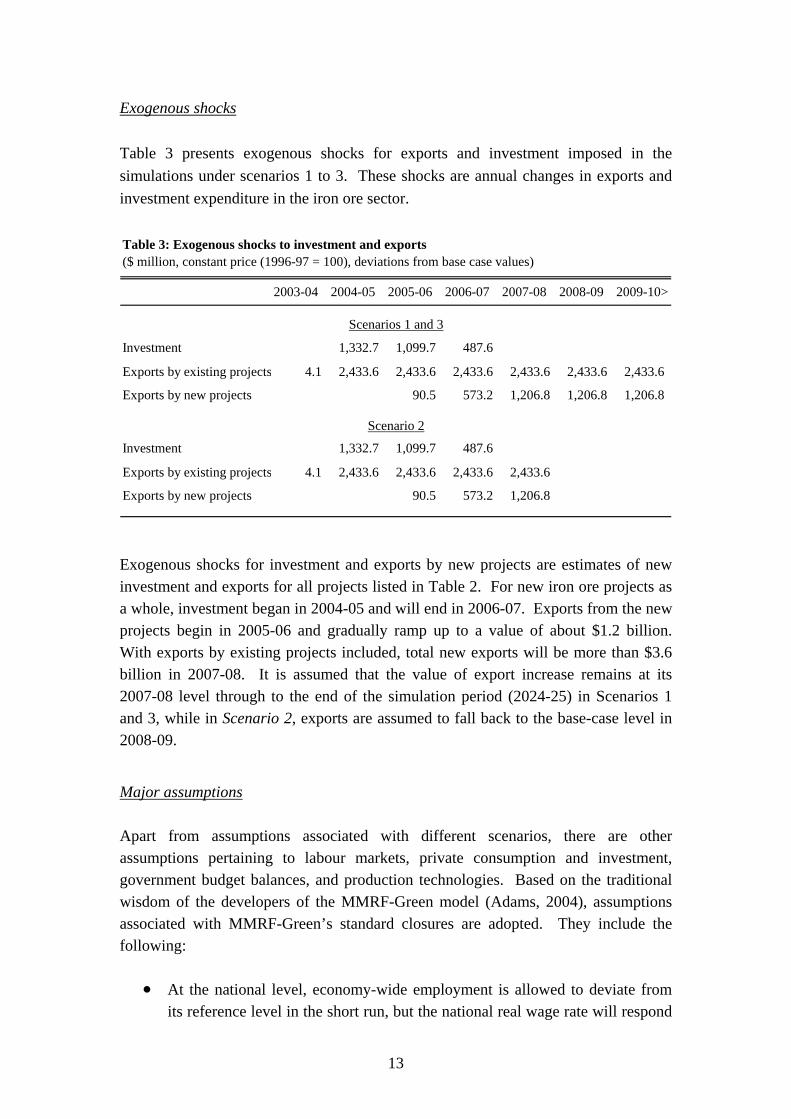
Exogenous shocks Table 3 presents exogenous shocks for exports and investment imposed in the simulations under scenarios 1 to 3. These shocks are annual changes in exports and investment expenditure in the iron ore sector.
Table 3: Exogenous shocks to investment and exports($ million, constant price (1996-97 = 100), deviations from base case values)
2003-04 2004-05 2005-06 2006-07 2007-08 2008-09 2009-10>
Investment 1,332.7 1,099.7 487.6
Exports by existing projects 4.1 2,433.6 2,433.6 2,433.6 2,433.6 2,433.6 2,433.6
Exports by new projects 90.5 573.2 1,206.8 1,206.8 1,206.8
Investment 1,332.7 1,099.7 487.6
Exports by existing projects 4.1 2,433.6 2,433.6 2,433.6 2,433.6
Exports by new projects 90.5 573.2 1,206.8
Scenarios 1 and 3
Scenario 2
Exogenous shocks for investment and exports by new projects are estimates of new investment and exports for all projects listed in Table 2. For new iron ore projects as a whole, investment began in 2004-05 and will end in 2006-07. Exports from the new projects begin in 2005-06 and gradually ramp up to a value of about $1.2 billion. With exports by existing projects included, total new exports will be more than $3.6 billion in 2007-08. It is assumed that the value of export increase remains at its 2007-08 level through to the end of the simulation period (2024-25) in Scenarios 1 and 3, while in Scenario 2, exports are assumed to fall back to the base-case level in 2008-09.
Major assumptions Apart from assumptions associated with different scenarios, there are other assumptions pertaining to labour markets, private consumption and investment, government budget balances, and production technologies. Based on the traditional wisdom of the developers of the MMRF-Green model (Adams, 2004), assumptions associated with MMRF-Green’s standard closures are adopted. They include the following:
• At the national level, economy-wide employment is allowed to deviate from its reference level in the short run, but the national real wage rate will respond
14
to gradually eliminate any deviation in national employment caused by new iron ore projects. Accordingly, in the long run national-wide employment is determined by demographic factors rather than by changes in iron ore exports and investment in Western Australia.
• However, the regionally-based new projects are likely to have significant
effects on regional distribution of employment, thus at the regional level labour is assumed to move between regions so as to maintain inter-state wage and unemployment rate differentials at their reference levels.
• Household disposable income determines consumption expenditure of the
regional household. In calculating the change in household disposable income due to the iron ore boom, MMRF-Green takes account of the locally-retained income directly generated by new iron ore projects, the income indirectly generated via input/output linkages and induced income effects.
• Capital supply responds to rates of return which are allowed to deviate from
their reference levels in the short run. Over time, changes in capital stocks gradually erode the divergences in rates of return. Consequently, in the long-run rates of return on industries’ capital return to their base case levels.
• Government expenditure is assumed to move in line with government revenue
changes due to the iron ore resources boom. Consequently, government budget balances at both the federal and state levels are fixed at their base-case levels through endogenously-determined changes to the average income tax rate and direct transfer payments to households. This assumption applies to all scenarios except for Scenario 3.
• All indirect tax rates are assumed not affected by the expansion in iron ore
exports and new iron ore projects.
• All industry technology and household preferences variables in the policy simulations have the same values as in the base case simulation.
4. Western Australian economic impact of the iron ore boom The economics of expanding sectors Before proceeding to present the macro economic impact of the iron ore boom on the Western Australian economy, its is worthwhile to briefly note the way of thinking about the general equilibrium effects of an expanding industry.
15
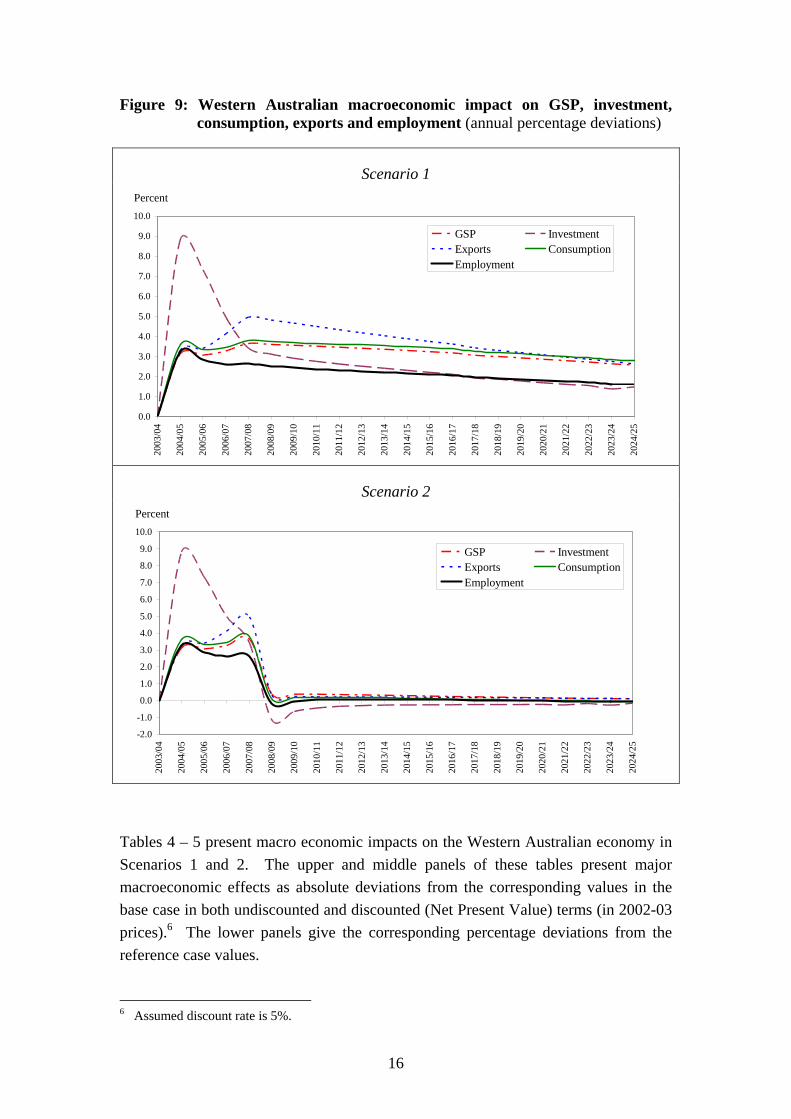
As the current resources boom in Western Australia is mainly characterised by a surge in exports and most of the output of new resources projects will be exported, the export expansion has put upward pressures on the exchange rate. An appreciation of the exchange rate would squeeze other exporters (i.e., exporters who are not part of the expanding sector), as well as firms in import-competing sector. A similar effect could also occur during the period in which the projects are under construction due to additional economic activity putting upward pressures on costs in general. As the high costs would have to be paid by all sectors, the profitability of other exporters and import-competing industries would be squeezed.4 These effects can be described as an appreciation of the real exchange rate, whereby the nominal exchange rate appreciates relative to costs. These effects are known as the “Gregory Thesis” in Australia (Gregory, 1976) and the “Dutch Disease” in Europe and elsewhere (The Economists, 26 November 1977, pp. 82-83). The basic idea of the Gregory Thesis is that a large surge in new exports does not lead to an increase in total exports of the same amount. The initial surge forces up the prices that other industries have to pay for their inputs and thus hurts other exporters, causing exports of their products to fall. Accordingly, the change in total exports comprises the surge in new exports and the reduction in other exports, so that the total increase is less than the initial stimulus. Firms in traditional export industries are hurt by an appreciation of the exchange rate and/or a rise in costs in general associated with the higher level of economic activity generated by the new projects. For similar reasons, the profitability of import-competing firms is also squeezed, causing imports to expand.5 Macroeconomic impact on Western Australia The iron ore boom is expected to generate higher investment, employment, consumption, exports and gross state product (GSP). This occurs because the boom will significantly increase the iron ore production and export capacity, generating direct and indirect demand for labour that in turn leads to higher incomes which increase private consumption potential in the economy. Increases in investment, exports and consumption will lead to higher GSP. However, the magnitude of the impact will depend on whether the boom is sustainable (figure 9).
4 Note also that to the extent that the foreign-exchange market is forward looking in its behaviour, the exchange rate could appreciate in anticipation of the future expansion of exports. This would add to the pressure likely to be experienced by other exporters and the import-competing sector. 5 For the literature pertaining to Australia, see Corden (1982), Dornbusch and Fischer (1984), Gregory (1976), Helliwell (1984), Long (1983), Snape (1977) and Stoeckel (1979). See also Choi (1988), Corden (1984), Corden and Neary (1982), Gelb et al. (1988) and Neary and Wijnbergen (1986).
16
Figure 9: Western Australian macroeconomic impact on GSP, investment, consumption, exports and employment (annual percentage deviations)
Scenario 1
0.0
1.0
2.0
3.0
4.0
5.0
6.0
7.0
8.0
9.0
10.0
2003
/04
2004
/05
2005
/06
2006
/07
2007
/08
2008
/09
2009
/10
2010
/11
2011
/12
2012
/13
2013
/14
2014
/15
2015
/16
2016
/17
2017
/18
2018
/19
2019
/20
2020
/21
2021
/22
2022
/23
2023
/24
2024
/25
Percent
GSP InvestmentExports ConsumptionEmployment
Scenario 2
-2.0
-1.0
0.0
1.0
2.0
3.0
4.0
5.0
6.0
7.0
8.0
9.0
10.0
2003
/04
2004
/05
2005
/06
2006
/07
2007
/08
2008
/09
2009
/10
2010
/11
2011
/12
2012
/13
2013
/14
2014
/15
2015
/16
2016
/17
2017
/18
2018
/19
2019
/20
2020
/21
2021
/22
2022
/23
2023
/24
2024
/25
Percent
GSP InvestmentExports ConsumptionEmployment
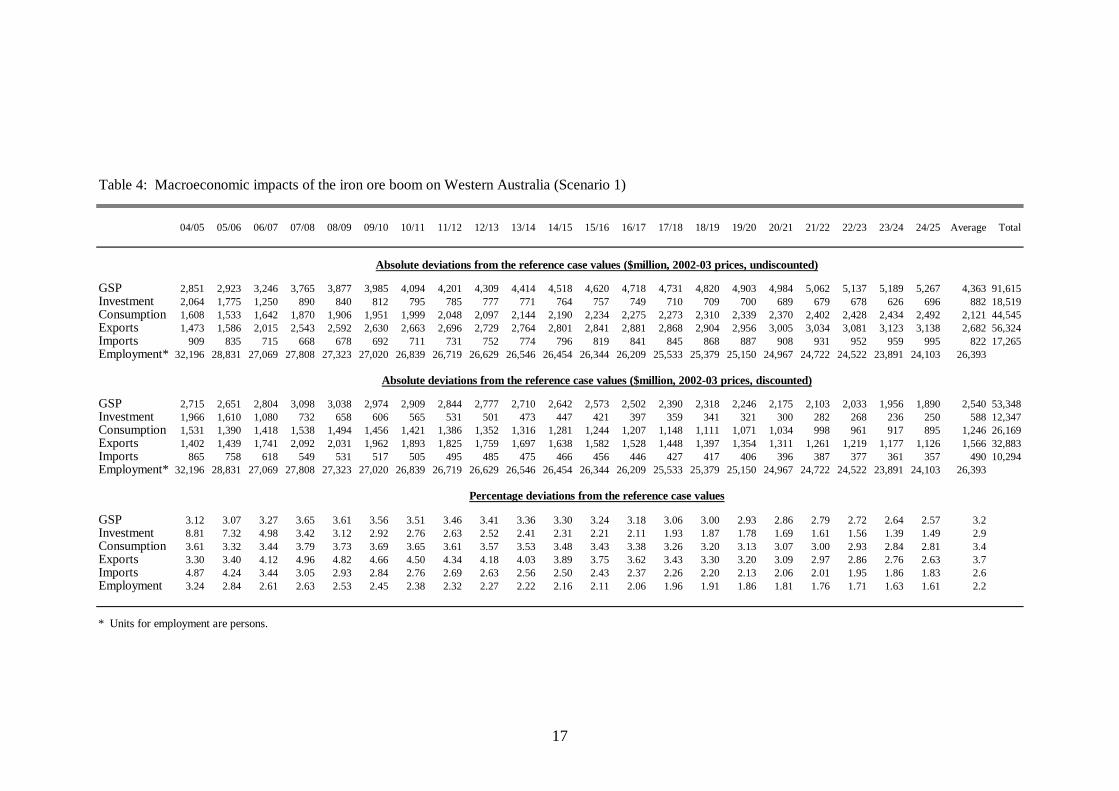
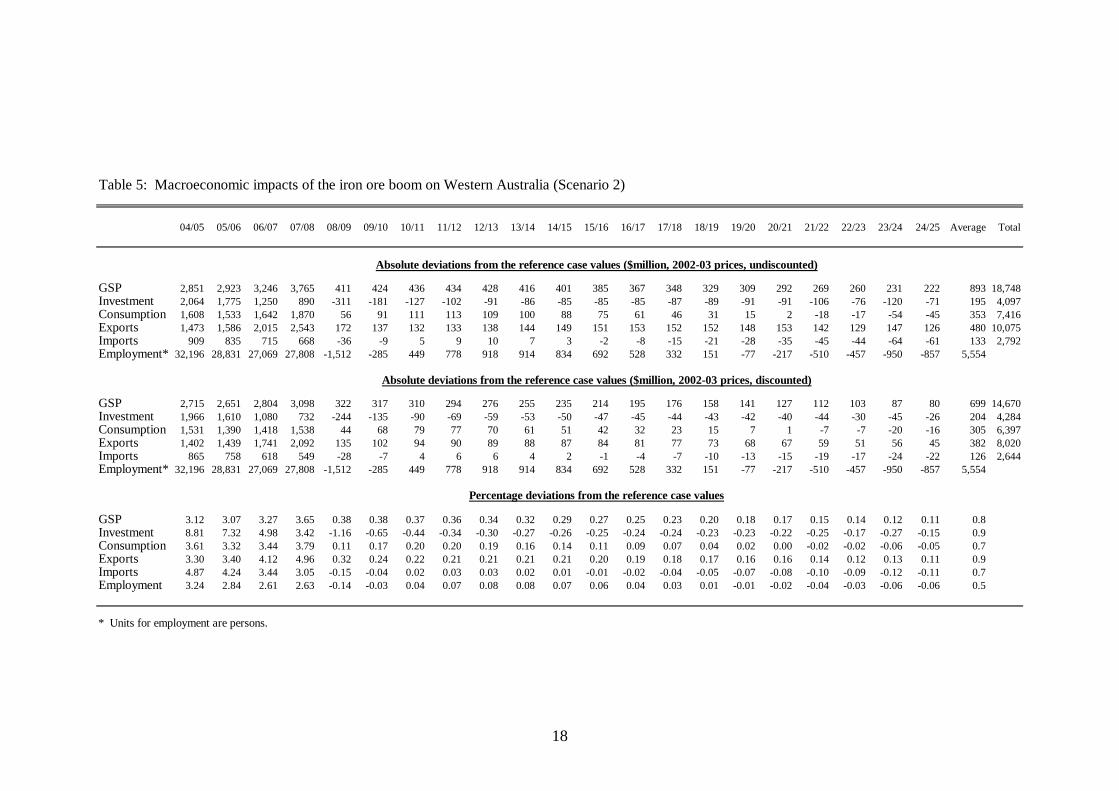
Tables 4 – 5 present macro economic impacts on the Western Australian economy in Scenarios 1 and 2. The upper and middle panels of these tables present major macroeconomic effects as absolute deviations from the corresponding values in the base case in both undiscounted and discounted (Net Present Value) terms (in 2002-03 prices).6 The lower panels give the corresponding percentage deviations from the reference case values. 6 Assumed discount rate is 5%.
17
Table 4: Macroeconomic impacts of the iron ore boom on Western Australia (Scenario 1)
04/05 05/06 06/07 07/08 08/09 09/10 10/11 11/12 12/13 13/14 14/15 15/16 16/17 17/18 18/19 19/20 20/21 21/22 22/23 23/24 24/25 Average Total
GSP 2,851 2,923 3,246 3,765 3,877 3,985 4,094 4,201 4,309 4,414 4,518 4,620 4,718 4,731 4,820 4,903 4,984 5,062 5,137 5,189 5,267 4,363 91,615Investment 2,064 1,775 1,250 890 840 812 795 785 777 771 764 757 749 710 709 700 689 679 678 626 696 882 18,519Consumption 1,608 1,533 1,642 1,870 1,906 1,951 1,999 2,048 2,097 2,144 2,190 2,234 2,275 2,273 2,310 2,339 2,370 2,402 2,428 2,434 2,492 2,121 44,545Exports 1,473 1,586 2,015 2,543 2,592 2,630 2,663 2,696 2,729 2,764 2,801 2,841 2,881 2,868 2,904 2,956 3,005 3,034 3,081 3,123 3,138 2,682 56,324Imports 909 835 715 668 678 692 711 731 752 774 796 819 841 845 868 887 908 931 952 959 995 822 17,265Employment* 32,196 28,831 27,069 27,808 27,323 27,020 26,839 26,719 26,629 26,546 26,454 26,344 26,209 25,533 25,379 25,150 24,967 24,722 24,522 23,891 24,103 26,393
GSP 2,715 2,651 2,804 3,098 3,038 2,974 2,909 2,844 2,777 2,710 2,642 2,573 2,502 2,390 2,318 2,246 2,175 2,103 2,033 1,956 1,890 2,540 53,348Investment 1,966 1,610 1,080 732 658 606 565 531 501 473 447 421 397 359 341 321 300 282 268 236 250 588 12,347Consumption 1,531 1,390 1,418 1,538 1,494 1,456 1,421 1,386 1,352 1,316 1,281 1,244 1,207 1,148 1,111 1,071 1,034 998 961 917 895 1,246 26,169Exports 1,402 1,439 1,741 2,092 2,031 1,962 1,893 1,825 1,759 1,697 1,638 1,582 1,528 1,448 1,397 1,354 1,311 1,261 1,219 1,177 1,126 1,566 32,883Imports 865 758 618 549 531 517 505 495 485 475 466 456 446 427 417 406 396 387 377 361 357 490 10,294Employment* 32,196 28,831 27,069 27,808 27,323 27,020 26,839 26,719 26,629 26,546 26,454 26,344 26,209 25,533 25,379 25,150 24,967 24,722 24,522 23,891 24,103 26,393
GSP 3.12 3.07 3.27 3.65 3.61 3.56 3.51 3.46 3.41 3.36 3.30 3.24 3.18 3.06 3.00 2.93 2.86 2.79 2.72 2.64 2.57 3.2Investment 8.81 7.32 4.98 3.42 3.12 2.92 2.76 2.63 2.52 2.41 2.31 2.21 2.11 1.93 1.87 1.78 1.69 1.61 1.56 1.39 1.49 2.9Consumption 3.61 3.32 3.44 3.79 3.73 3.69 3.65 3.61 3.57 3.53 3.48 3.43 3.38 3.26 3.20 3.13 3.07 3.00 2.93 2.84 2.81 3.4Exports 3.30 3.40 4.12 4.96 4.82 4.66 4.50 4.34 4.18 4.03 3.89 3.75 3.62 3.43 3.30 3.20 3.09 2.97 2.86 2.76 2.63 3.7Imports 4.87 4.24 3.44 3.05 2.93 2.84 2.76 2.69 2.63 2.56 2.50 2.43 2.37 2.26 2.20 2.13 2.06 2.01 1.95 1.86 1.83 2.6Employment 3.24 2.84 2.61 2.63 2.53 2.45 2.38 2.32 2.27 2.22 2.16 2.11 2.06 1.96 1.91 1.86 1.81 1.76 1.71 1.63 1.61 2.2
* Units for employment are persons.
Absolute deviations from the reference case values ($million, 2002-03 prices, undiscounted)
Absolute deviations from the reference case values ($million, 2002-03 prices, discounted)
Percentage deviations from the reference case values
18
Table 5: Macroeconomic impacts of the iron ore boom on Western Australia (Scenario 2)
04/05 05/06 06/07 07/08 08/09 09/10 10/11 11/12 12/13 13/14 14/15 15/16 16/17 17/18 18/19 19/20 20/21 21/22 22/23 23/24 24/25 Average Total
GSP 2,851 2,923 3,246 3,765 411 424 436 434 428 416 401 385 367 348 329 309 292 269 260 231 222 893 18,748Investment 2,064 1,775 1,250 890 -311 -181 -127 -102 -91 -86 -85 -85 -85 -87 -89 -91 -91 -106 -76 -120 -71 195 4,097Consumption 1,608 1,533 1,642 1,870 56 91 111 113 109 100 88 75 61 46 31 15 2 -18 -17 -54 -45 353 7,416Exports 1,473 1,586 2,015 2,543 172 137 132 133 138 144 149 151 153 152 152 148 153 142 129 147 126 480 10,075Imports 909 835 715 668 -36 -9 5 9 10 7 3 -2 -8 -15 -21 -28 -35 -45 -44 -64 -61 133 2,792Employment* 32,196 28,831 27,069 27,808 -1,512 -285 449 778 918 914 834 692 528 332 151 -77 -217 -510 -457 -950 -857 5,554
GSP 2,715 2,651 2,804 3,098 322 317 310 294 276 255 235 214 195 176 158 141 127 112 103 87 80 699 14,670Investment 1,966 1,610 1,080 732 -244 -135 -90 -69 -59 -53 -50 -47 -45 -44 -43 -42 -40 -44 -30 -45 -26 204 4,284Consumption 1,531 1,390 1,418 1,538 44 68 79 77 70 61 51 42 32 23 15 7 1 -7 -7 -20 -16 305 6,397Exports 1,402 1,439 1,741 2,092 135 102 94 90 89 88 87 84 81 77 73 68 67 59 51 56 45 382 8,020Imports 865 758 618 549 -28 -7 4 6 6 4 2 -1 -4 -7 -10 -13 -15 -19 -17 -24 -22 126 2,644Employment* 32,196 28,831 27,069 27,808 -1,512 -285 449 778 918 914 834 692 528 332 151 -77 -217 -510 -457 -950 -857 5,554
GSP 3.12 3.07 3.27 3.65 0.38 0.38 0.37 0.36 0.34 0.32 0.29 0.27 0.25 0.23 0.20 0.18 0.17 0.15 0.14 0.12 0.11 0.8Investment 8.81 7.32 4.98 3.42 -1.16 -0.65 -0.44 -0.34 -0.30 -0.27 -0.26 -0.25 -0.24 -0.24 -0.23 -0.23 -0.22 -0.25 -0.17 -0.27 -0.15 0.9Consumption 3.61 3.32 3.44 3.79 0.11 0.17 0.20 0.20 0.19 0.16 0.14 0.11 0.09 0.07 0.04 0.02 0.00 -0.02 -0.02 -0.06 -0.05 0.7Exports 3.30 3.40 4.12 4.96 0.32 0.24 0.22 0.21 0.21 0.21 0.21 0.20 0.19 0.18 0.17 0.16 0.16 0.14 0.12 0.13 0.11 0.9Imports 4.87 4.24 3.44 3.05 -0.15 -0.04 0.02 0.03 0.03 0.02 0.01 -0.01 -0.02 -0.04 -0.05 -0.07 -0.08 -0.10 -0.09 -0.12 -0.11 0.7Employment 3.24 2.84 2.61 2.63 -0.14 -0.03 0.04 0.07 0.08 0.08 0.07 0.06 0.04 0.03 0.01 -0.01 -0.02 -0.04 -0.03 -0.06 -0.06 0.5
* Units for employment are persons.
Absolute deviations from the reference case values ($million, 2002-03 prices, undiscounted)
Absolute deviations from the reference case values ($million, 2002-03 prices, discounted)
Percentage deviations from the reference case values
19
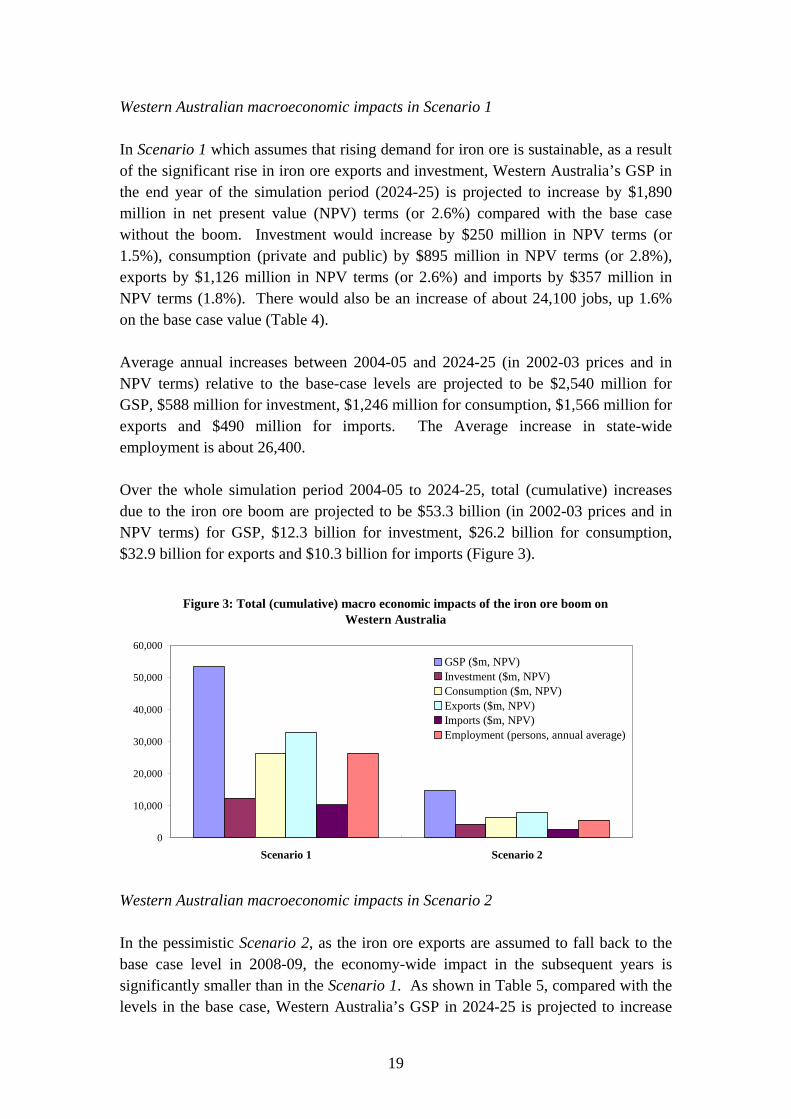
Western Australian macroeconomic impacts in Scenario 1 In Scenario 1 which assumes that rising demand for iron ore is sustainable, as a result of the significant rise in iron ore exports and investment, Western Australia’s GSP in the end year of the simulation period (2024-25) is projected to increase by $1,890 million in net present value (NPV) terms (or 2.6%) compared with the base case without the boom. Investment would increase by $250 million in NPV terms (or 1.5%), consumption (private and public) by $895 million in NPV terms (or 2.8%), exports by $1,126 million in NPV terms (or 2.6%) and imports by $357 million in NPV terms (1.8%). There would also be an increase of about 24,100 jobs, up 1.6% on the base case value (Table 4). Average annual increases between 2004-05 and 2024-25 (in 2002-03 prices and in NPV terms) relative to the base-case levels are projected to be $2,540 million for GSP, $588 million for investment, $1,246 million for consumption, $1,566 million for exports and $490 million for imports. The Average increase in state-wide employment is about 26,400. Over the whole simulation period 2004-05 to 2024-25, total (cumulative) increases due to the iron ore boom are projected to be $53.3 billion (in 2002-03 prices and in NPV terms) for GSP, $12.3 billion for investment, $26.2 billion for consumption, $32.9 billion for exports and $10.3 billion for imports (Figure 3).
Figure 3: Total (cumulative) macro economic impacts of the iron ore boom on Western Australia
0
10,000
20,000
30,000
40,000
50,000
60,000
Scenario 1 Scenario 2
GSP ($m, NPV)Investment ($m, NPV)Consumption ($m, NPV)Exports ($m, NPV)Imports ($m, NPV)Employment (persons, annual average)
Western Australian macroeconomic impacts in Scenario 2 In the pessimistic Scenario 2, as the iron ore exports are assumed to fall back to the base case level in 2008-09, the economy-wide impact in the subsequent years is significantly smaller than in the Scenario 1. As shown in Table 5, compared with the levels in the base case, Western Australia’s GSP in 2024-25 is projected to increase
20
by $80 million in NPV terms (or 0.1%) and exports by $45 million in NPV terms (or 0.1%). However, investment, consumption and imports will be lower. Specifically, investment would fall by $26 million in NPV terms (or 0.2%), consumption (private and public) by $16 million in NPV terms (or 0.1%), and imports by $22 million in NPV terms (0.1%). There would also be about 850 less jobs, down 0.1% on the base case value. Nevertheless, due to the substantial gains in the earlier years of the simulation period, on average, the iron ore boom is still projected to have a positive impact over the whole period. Average annual increases between 2004-05 and 2024-25 (in 2002-03 prices and in NPV terms) relative to the levels without the boom are projected to be $699 million for GSP, $204 million for investment, $305 million for consumption, $382 million for exports and $126 million for imports. Employment in the State would increase by about 5,550 persons per annum. Over the whole simulation period 2004-05 to 2024-25, total (cumulative) increases resulting from the expansion of iron ore exports and new investment are projected to be $14.7 billion (in 2002-03 prices and in NPV terms) for GSP, $4.3 billion for investment, $6.4 billion for consumption, $8.0 billion for exports and $2.6 billion for imports (Figure 3). Western Australian welfare impacts As pointed out by Layman (2004), GSP is generally regarded as a poor measure of economic welfare as it includes income that is “owned” by overseas corporations, while it takes no account of the additional resources required to produce an increase. In contrast, consumption of private and public goods and services is considered a better measure of welfare, as it reflects only income that flows to domestic residents. Figure 4 presents the impact on Western Australia’s welfare (private and public consumption) in Scenarios 1 and 2. In Scenario 1, as a result of the surge in iron ore exports and new iron ore projects, total increases in the State’s welfare in NPV terms over the period until 2024-25 are projected to be $30.5 billion. On average, the State’s welfare in NPV terms is forecast to increase by $1,452 million per annum. The corresponding figures for Scenario 2 are $7.7 billion and $368 million. However, consumption as a measure of welfare still suffers from the “scale” effect that is normally associated with modelling a new project resulting in an inflow of labour and capital into home State from other States in a CGE modelling framework. For details, see Layman (2004). To eliminate this “scale” effect, Layman proposed to use a measure of economic benefits based on per capita consumption. The increase in
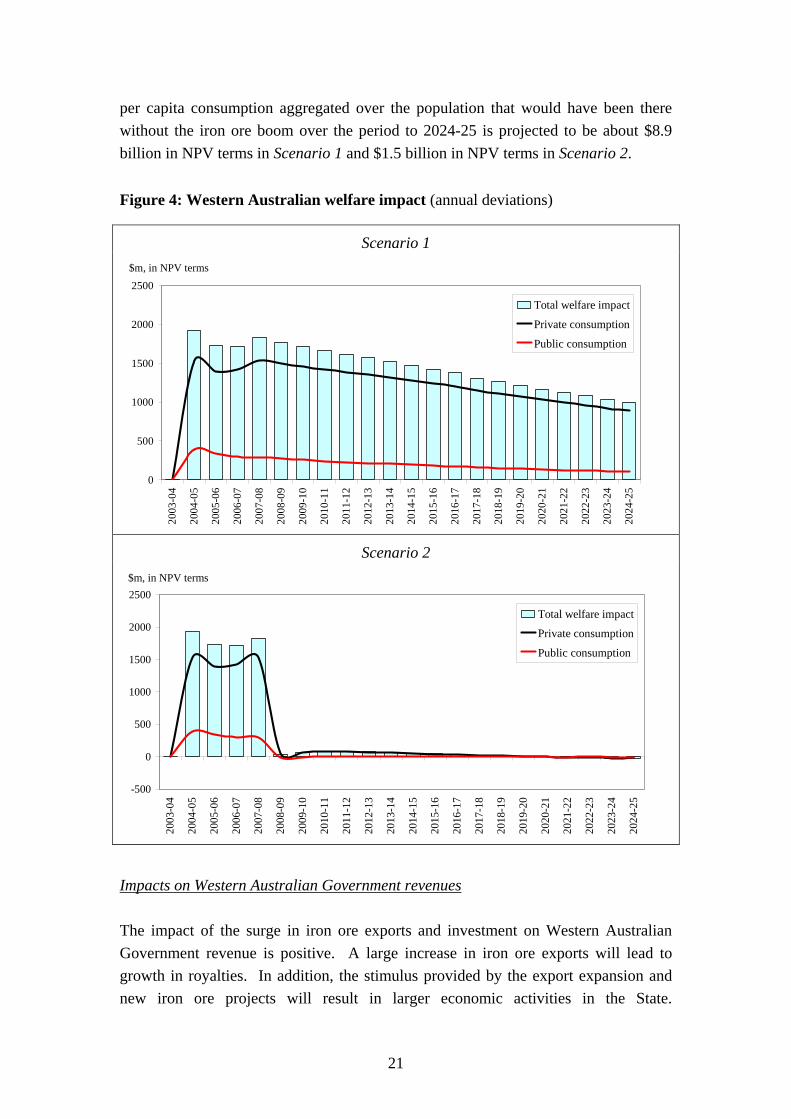
21
per capita consumption aggregated over the population that would have been there without the iron ore boom over the period to 2024-25 is projected to be about $8.9 billion in NPV terms in Scenario 1 and $1.5 billion in NPV terms in Scenario 2.
Figure 4: Western Australian welfare impact (annual deviations)
Scenario 1
0
500
1000
1500
2000
2500
2003
-04
2004
-05
2005
-06
2006
-07
2007
-08
2008
-09
2009
-10
2010
-11
2011
-12
2012
-13
2013
-14
2014
-15
2015
-16
2016
-17
2017
-18
2018
-19
2019
-20
2020
-21
2021
-22
2022
-23
2023
-24
2024
-25
$m, in NPV terms
Total welfare impact
Private consumption
Public consumption
Scenario 2
-500
0
500
1000
1500
2000
2500
2003
-04
2004
-05
2005
-06
2006
-07
2007
-08
2008
-09
2009
-10
2010
-11
2011
-12
2012
-13
2013
-14
2014
-15
2015
-16
2016
-17
2017
-18
2018
-19
2019
-20
2020
-21
2021
-22
2022
-23
2023
-24
2024
-25
$m, in NPV terms
Total welfare impact
Private consumption
Public consumption
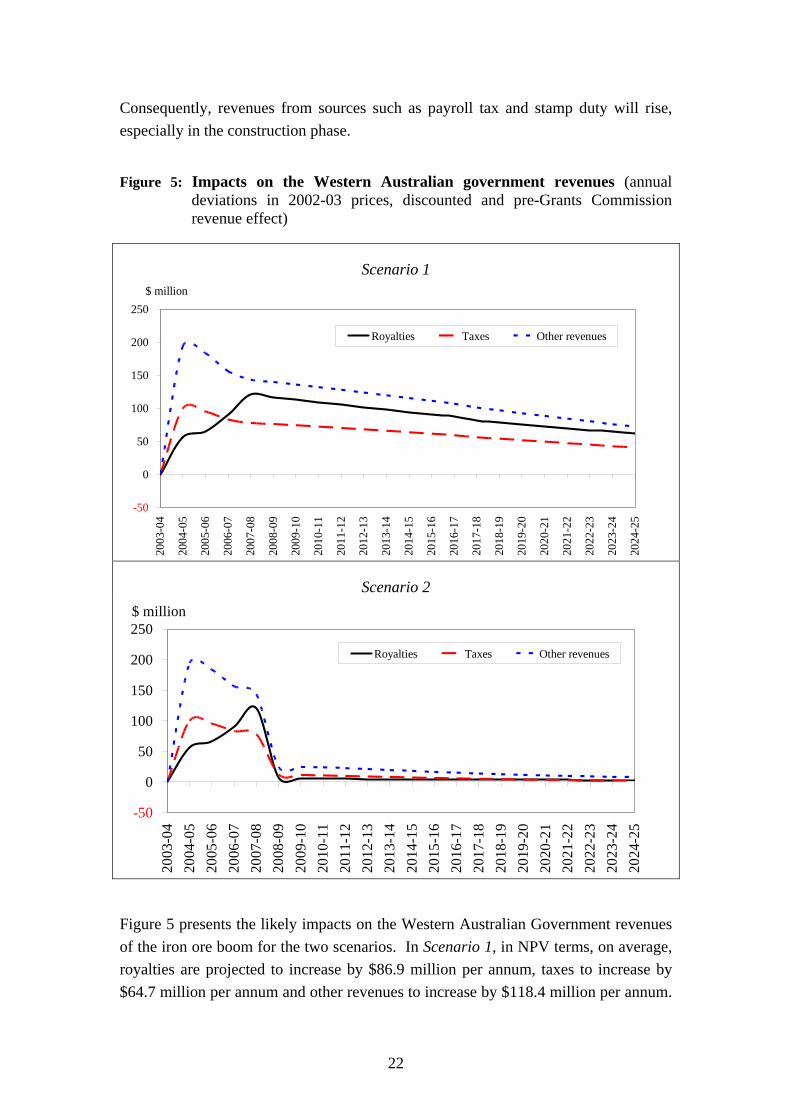
Impacts on Western Australian Government revenues The impact of the surge in iron ore exports and investment on Western Australian Government revenue is positive. A large increase in iron ore exports will lead to growth in royalties. In addition, the stimulus provided by the export expansion and new iron ore projects will result in larger economic activities in the State.
22
Consequently, revenues from sources such as payroll tax and stamp duty will rise, especially in the construction phase.
Figure 5: Impacts on the Western Australian government revenues (annual
deviations in 2002-03 prices, discounted and pre-Grants Commission revenue effect)
Scenario 1
-50
0
50
100
150
200
250
2003
-04
2004
-05
2005
-06
2006
-07
2007
-08
2008
-09
2009
-10
2010
-11
2011
-12
2012
-13
2013
-14
2014
-15
2015
-16
2016
-17
2017
-18
2018
-19
2019
-20
2020
-21
2021
-22
2022
-23
2023
-24
2024
-25
$ million
Royalties Taxes Other revenues
Scenario 2
-50
0
50
100
150
200
250
2003
-04
2004
-05
2005
-06
2006
-07
2007
-08
2008
-09
2009
-10
2010
-11
2011
-12
2012
-13
2013
-14
2014
-15
2015
-16
2016
-17
2017
-18
2018
-19
2019
-20
2020
-21
2021
-22
2022
-23
2023
-24
2024
-25
$ million
Royalties Taxes Other revenues
Figure 5 presents the likely impacts on the Western Australian Government revenues of the iron ore boom for the two scenarios. In Scenario 1, in NPV terms, on average, royalties are projected to increase by $86.9 million per annum, taxes to increase by $64.7 million per annum and other revenues to increase by $118.4 million per annum.
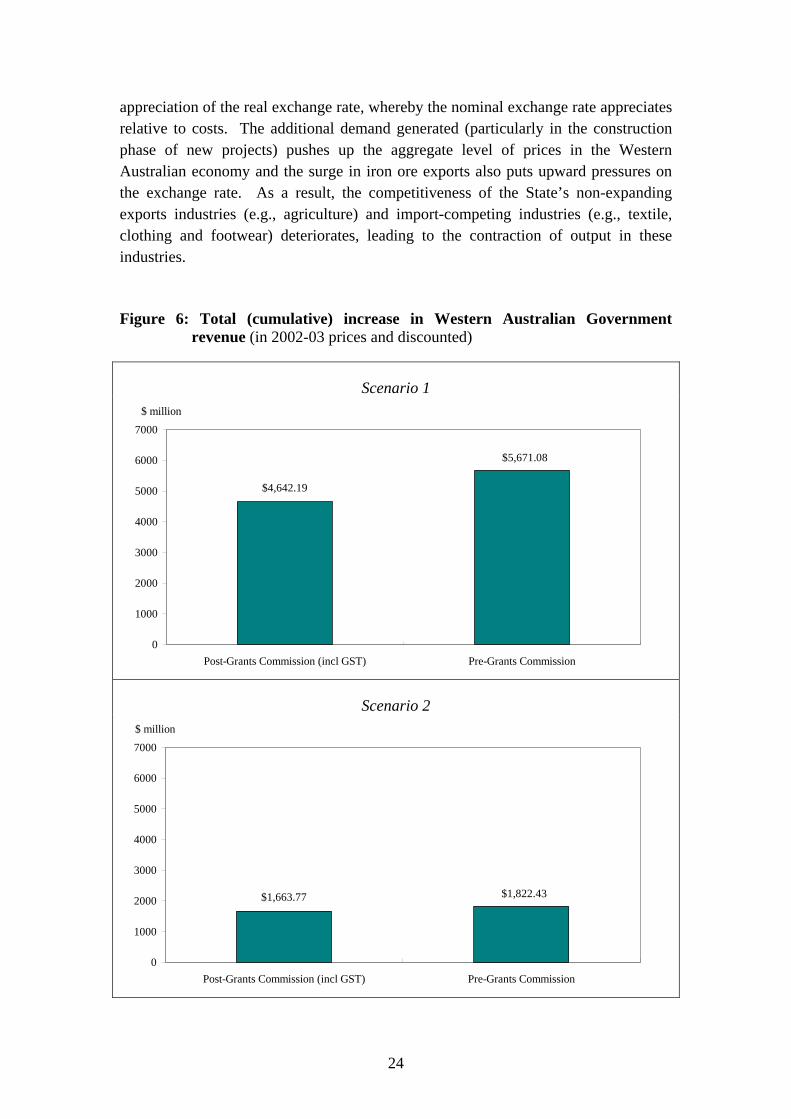
23
Total cumulative increases in the State Government revenues over the period 2004-05 to 2024-25 are forecast to be $1,825 million for royalties, $1,359 million for taxes and $2,487 million for other revenues. Reflecting an ephemeral expansion of iron ore exports assumed, the impact on Western Australian Government revenues in Scenario 2 is much smaller than that in Scenario 1. In NPV terms, on average, royalties are projected to increase by $19.4 million per annum, taxes to increase by $22.2 million per annum and other revenues to increase by $45.2 million per annum. Total cumulative increases in the State Government revenues over the period 2004-05 to 2024-25 are forecast to be $406 million for royalties, $467 million for taxes and $949 million for other revenues. Although the surge in iron ore exports and new iron ore investment is projected to generate significant revenues for the State Government, the State will not be able to reap all rewards brought about by the resources boom under the Commonwealth Grants Commission’s equalisation processes.7 When Grants Commission effect is taken into account, total post-Grants Commission revenue (in 2002-03 prices and NPV terms) is $4,642 million in Scenario 1 and $1,664 million in Scenario 2, respectively. This compares with the total pre-Grants Commission revenues of $5,671 million in Scenario 1 and $1,822 million in Scenario 2 (figure 6). Impacts on Western Australian industries’ output Figure 7 presents the selected Western Australian industry output effects of the export expansion and new investment in the iron ore industry. These results are reported as the cumulative percentage changes away from the base-case level. For example, if a variable grows by 2% in year one of the reference case and 3% in the policy simulation, the deviation is 1%. If the deviation is 2% in the second year and 0.5% in the third year, then the cumulative deviation is 1% in year one, 3% in year two and 3.5% in year three. The industry results presented are for the real (inflation-adjusted) output of each industry. Non-expanding export-orientated industries and import-competing industries As a result of the iron ore boom, output from non-expanding export-orientated industries and import-competing industries is forecast to fall slightly due to an 7 As an independent statutory authority, the Commonwealth Grants Commission (CGC) is responsible for making recommendations about the distribution of general revenue assistance to the States and Territories. “The general revenue assistance is distributed on the basis of horizontal fiscal equalisation which is embodied in the per capita relativities calculated annually by the CGC. Horizontal fiscal equalisation has been defined as providing each State and Territory with the capacity to deliver the average standard of State-type services, assuming it operates at an average level of efficiency and makes the average effort to raise revenue from its own sources.” (http://www.treasury.qld.gov.au /office/services/state-relations/grants/index.shtml). Under the CGC’s fiscal equalisation processes, Western Australia retains only its population share (10%) of any so-called windfall gains.
24
appreciation of the real exchange rate, whereby the nominal exchange rate appreciates relative to costs. The additional demand generated (particularly in the construction phase of new projects) pushes up the aggregate level of prices in the Western Australian economy and the surge in iron ore exports also puts upward pressures on the exchange rate. As a result, the competitiveness of the State’s non-expanding exports industries (e.g., agriculture) and import-competing industries (e.g., textile, clothing and footwear) deteriorates, leading to the contraction of output in these industries. Figure 6: Total (cumulative) increase in Western Australian Government
revenue (in 2002-03 prices and discounted)
Scenario 1
$5,671.08
$4,642.19
0
1000
2000
3000
4000
5000
6000
7000
Post-Grants Commission (incl GST) Pre-Grants Commission
$ million
Scenario 2
$1,822.43$1,663.77
0
1000
2000
3000
4000
5000
6000
7000
Post-Grants Commission (incl GST) Pre-Grants Commission
$ million
25
Figure 7: Western Australian industry output impacts
(cumulative percentage deviations from the base case)
Scenario 1 Scenario 2
Export and import-competing industries Export and import-competing industries
-3.5
-3.0
-2.5
-2.0
-1.5
-1.0
-0.5
0.0
0.5
1.0
1.5
2002
-03
2003
-04
2004
-05
2005
-06
2006
-07
2007
-08
2008
-09
2009
-10
2010
-11
2011
-12
2012
-13
2013
-14
2014
-15
2015
-16
2016
-17
2017
-18
2018
-19
2019
-20
2020
-21
2021
-22
2022
-23
2023
-24
2024
-25
Percent
AgAnimalAgOtherDrinkTCF
-4.0
-3.0
-2.0
-1.0
0.0
1.0
2.0
3.0
2002
-03
2003
-04
2004
-05
2005
-06
2006
-07
2007
-08
2008
-09
2009
-10
2010
-11
2011
-12
2012
-13
2013
-14
2014
-15
2015
-16
2016
-17
2017
-18
2018
-19
2019
-20
2020
-21
2021
-22
2022
-23
2023
-24
2024
-25
Percent
AgAnimalAgOtherDrinkTCF
Investment-related industry Investment-related industry
-1.0
0.0
1.0
2.0
3.0
4.0
5.0
6.0
2002
-03
2003
-04
2004
-05
2005
-06
2006
-07
2007
-08
2008
-09
2009
-10
2010
-11
2011
-12
2012
-13
2013
-14
2014
-15
2015
-16
2016
-17
2017
-18
2018
-19
2019
-20
2020
-21
2021
-22
2022
-23
2023
-24
2024
-25
Percent
CementConstructionOtherEqpMetalPrd
-1.0
0.0
1.0
2.0
3.0
4.0
5.0
6.0
2002
-03
2003
-04
2004
-05
2005
-06
2006
-07
2007
-08
2008
-09
2009
-10
2010
-11
2011
-12
2012
-13
2013
-14
2014
-15
2015
-16
2016
-17
2017
-18
2018
-19
2019
-20
2020
-21
2021
-22
2022
-23
2023
-24
2024
-25
Percent
CementConstructionOtherEqpMetalPrd
Energy industries Energy industries
-0.5
0.0
0.5
1.0
1.5
2.0
2.5
3.0
3.5
4.0
2002
-03
2003
-04
2004
-05
2005
-06
2006
-07
2007
-08
2008
-09
2009
-10
2010
-11
2011
-12
2012
-13
2013
-14
2014
-15
2015
-16
2016
-17
2017
-18
2018
-19
2019
-20
2020
-21
2021
-22
2022
-23
2023
-24
2024
-25
Percent
ElecCoalElecGasElecOilElecSupply
-0.5
0.0
0.5
1.0
1.5
2.0
2.5
3.0
3.5
4.0
2002
-03
2003
-04
2004
-05
2005
-06
2006
-07
2007
-08
2008
-09
2009
-10
2010
-11
2011
-12
2012
-13
2013
-14
2014
-15
2015
-16
2016
-17
2017
-18
2018
-19
2019
-20
2020
-21
2021
-22
2022
-23
2023
-24
2024
-25
Percent
ElecCoalElecGasElecOilElecSupply
Domestic industries Domestic industries
-0.50.00.51.01.52.02.53.03.54.04.5
2002
-03
2003
-04
2004
-05
2005
-06
2006
-07
2007
-08
2008
-09
2009
-10
2010
-11
2011
-12
2012
-13
2013
-14
2014
-15
2015
-16
2016
-17
2017
-18
2018
-19
2019
-20
2020
-21
2021
-22
2022
-23
2023
-24
2024
-25
Percent
TradeHotelsCafesBusServicesServicesOth
-0.50.00.51.01.52.02.53.03.54.04.5
2002
-03
2003
-04
2004
-05
2005
-06
2006
-07
2007
-08
2008
-09
2009
-10
2010
-11
2011
-12
2012
-13
2013
-14
2014
-15
2015
-16
2016
-17
2017
-18
2018
-19
2019
-20
2020
-21
2021
-22
2022
-23
2023
-24
2024
-25
Percent
TradeHotelsCafesBusServicesServicesOth
26
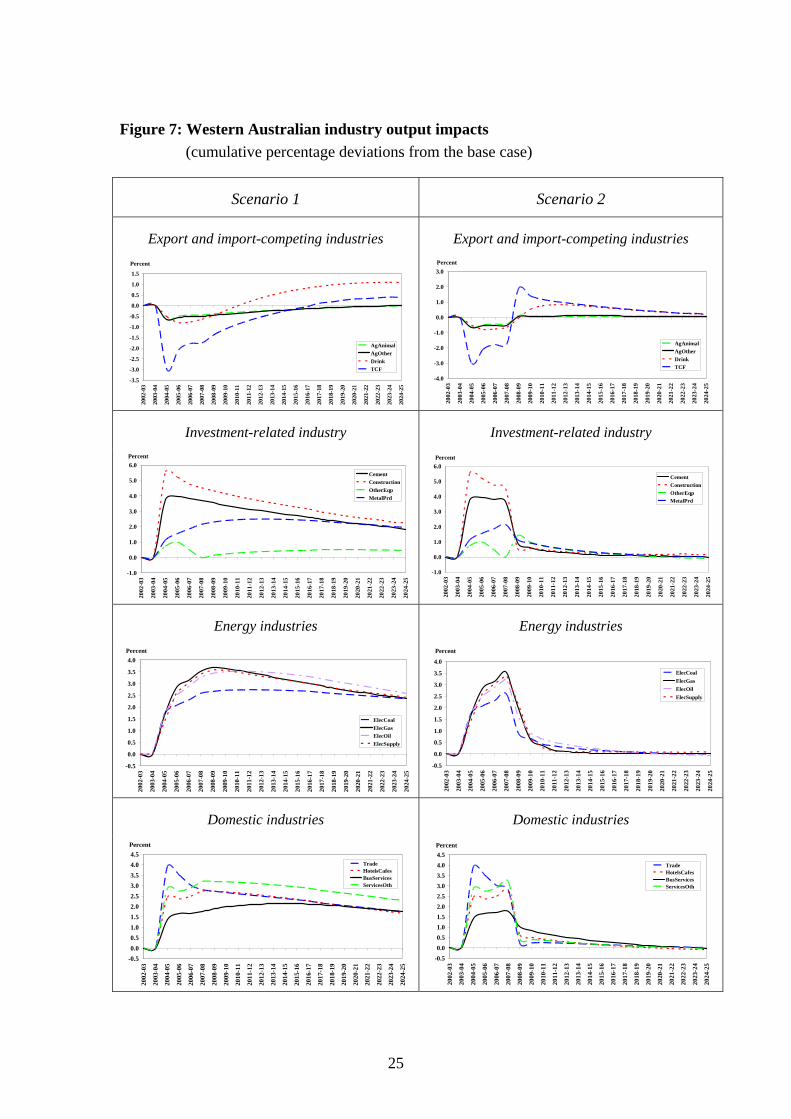
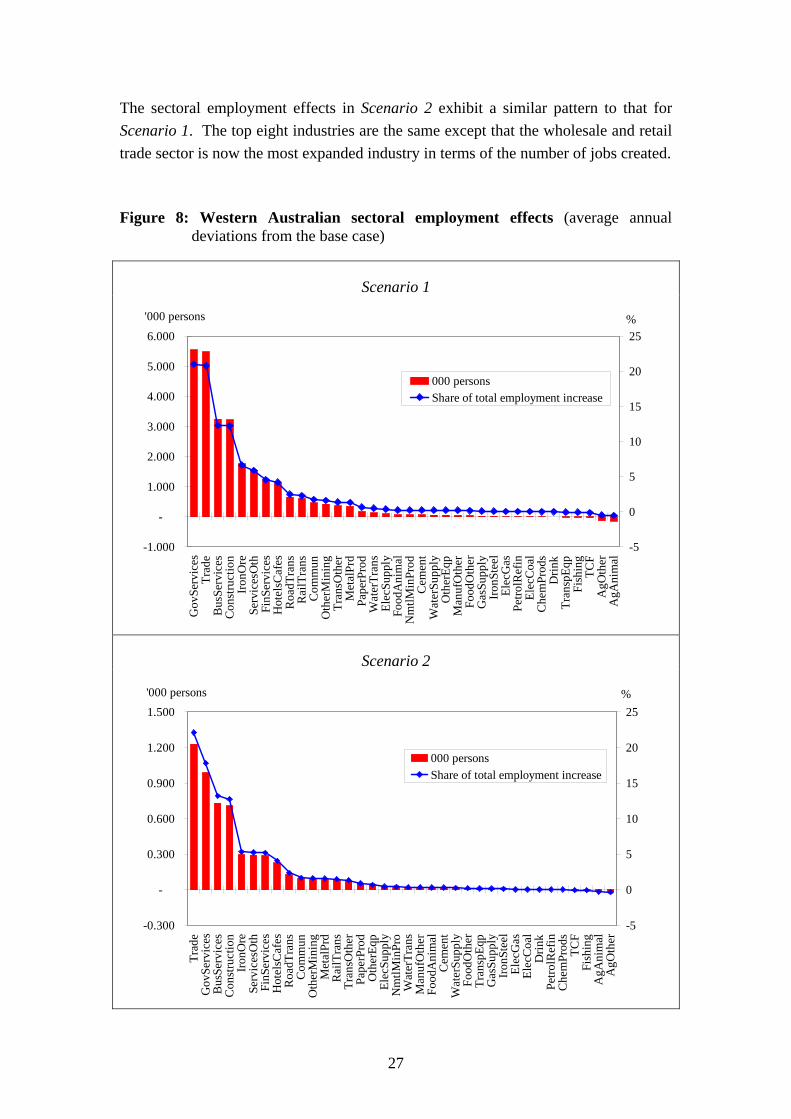
Investment-related industries All investment-related industries are projected to benefit from the development of new iron ore projects, particularly during the construction phase. As a key input to business investment, the construction industry is expected to benefit the most in percentage terms. For example, the modelling results indicate that production of the construction sector would be 5.5 percentage points higher in 2004-05 compared with the base case level. Other industries which supply construction materials and equipments are also expected to benefit from the iron ore boom. Energy industries Demand for energy is expected to rise due to the resources boom. As a result, all energy industries are forecast to grow faster than in the base case. In cumulative percentage deviation terms for example, the output of the electricity industry will be about 2.4 percentage points higher in 2004-05 compared to the base case level. Domestic industries Higher employment resulting from the resources boom will increase the consumption capacity in Western Australia. Also, the influx of interstate migrants associated with large investment activities in the State will stimulate the demand for financial, education and health services. As a result, Western Australia’s domestically focussed industries such as retail trade, business services, hotel services and other services are forecast to expand relative to the levels in the base case. Impacts on Western Australian industries’ employment Figure 8 presents the effects on employment for selected Western Australian industries. These results are reported as the average number of jobs created in each industry over the simulation period to 2024-25 and the share of total new jobs accounted for by each industry. As can be seen from the upper panel of Figure 8, in Scenario 1, the industries whose employment expands more than 1,000 jobs due to the surge in iron ore exports and new iron ore projects are Government services (5,550 additional jobs), wholesale and retail trade (5,490), business services (3,240), construction (3,220), iron ore (1,760), other services (1,550), financial services (1,200) and hotel, café and restaurant industry (1,100). These sectors together account for more than 85% of the total number of jobs (26,400). These industries alone indicate the variety of the demand for different skills likely to be created by a sustainable iron ore export expansion and new projects.
27
The sectoral employment effects in Scenario 2 exhibit a similar pattern to that for Scenario 1. The top eight industries are the same except that the wholesale and retail trade sector is now the most expanded industry in terms of the number of jobs created. Figure 8: Western Australian sectoral employment effects (average annual
deviations from the base case)
Scenario 1
-1.000
-
1.000
2.000
3.000
4.000
5.000
6.000
Gov
Serv
ices
Trad
eB
usSe
rvic
esC
onst
ruct
ion
Iron
Ore
Serv
ices
Oth
FinS
ervi
ces
Hot
elsC
afes
Roa
dTra
nsR
ailT
rans
Com
mun
Oth
erM
inin
gTr
ansO
ther
Met
alPr
dPa
perP
rod
Wat
erTr
ans
Elec
Supp
lyFo
odA
nim
alN
mtlM
inPr
odC
emen
tW
ater
Supp
lyO
ther
Eqp
Man
ufO
ther
Food
Oth
erG
asSu
pply
IronS
teel
Elec
Gas
Petro
lRef
inEl
ecC
oal
Che
mPr
ods
Drin
kTr
ansp
Eqp
Fish
ing
TCF
AgO
ther
AgA
nim
al
'000 persons
-5
0
5
10
15
20
25%
000 personsShare of total employment increase
Scenario 2
-0.300
-
0.300
0.600
0.900
1.200
1.500
Trad
eG
ovSe
rvic
esB
usSe
rvic
esC
onst
ruct
ion
Iron
Ore
Serv
ices
Oth
FinS
ervi
ces
Hot
elsC
afes
Roa
dTra
nsC
omm
unO
ther
Min
ing
Met
alPr
dR
ailT
rans
Tran
sOth
erPa
perP
rod
Oth
erEq
pEl
ecSu
pply
Nm
tlMin
Pro
Wat
erTr
ans
Man
ufO
ther
Food
Ani
mal
Cem
ent
Wat
erSu
pply
Food
Oth
erTr
ansp
Eqp
Gas
Supp
lyIr
onSt
eel
Elec
Gas
Elec
Coa
lD
rink
Petro
lRef
inC
hem
Prod
sTC
FFi
shin
gA
gAni
mal
AgO
ther
'000 persons
-5
0
5
10
15
20
25%
000 personsShare of total employment increase
28
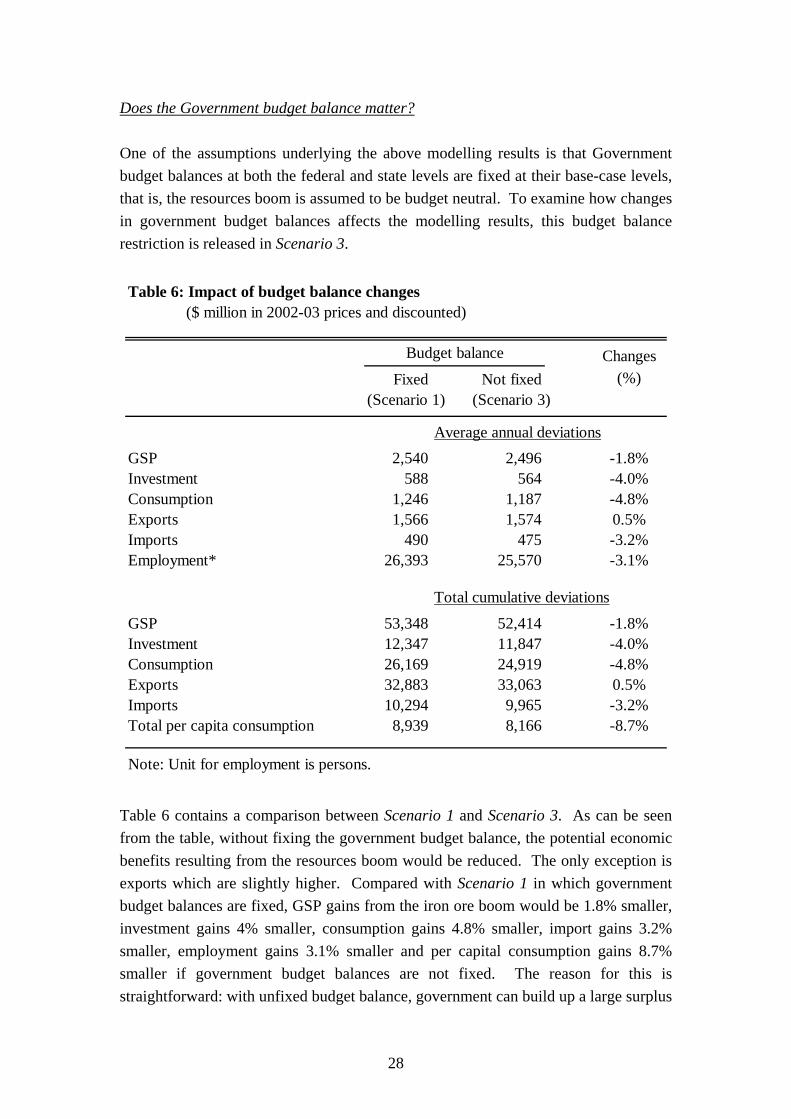
Does the Government budget balance matter? One of the assumptions underlying the above modelling results is that Government budget balances at both the federal and state levels are fixed at their base-case levels, that is, the resources boom is assumed to be budget neutral. To examine how changes in government budget balances affects the modelling results, this budget balance restriction is released in Scenario 3.
Table 6: Impact of budget balance changes ($ million in 2002-03 prices and discounted)
ChangesFixed Not fixed (%)
(Scenario 1) (Scenario 3)
Average annual deviationsGSP 2,540 2,496 -1.8%Investment 588 564 -4.0%Consumption 1,246 1,187 -4.8%Exports 1,566 1,574 0.5%Imports 490 475 -3.2%Employment* 26,393 25,570 -3.1%
Total cumulative deviations
GSP 53,348 52,414 -1.8%Investment 12,347 11,847 -4.0%Consumption 26,169 24,919 -4.8%Exports 32,883 33,063 0.5%Imports 10,294 9,965 -3.2%Total per capita consumption 8,939 8,166 -8.7%
Note: Unit for employment is persons.
Budget balance
Table 6 contains a comparison between Scenario 1 and Scenario 3. As can be seen from the table, without fixing the government budget balance, the potential economic benefits resulting from the resources boom would be reduced. The only exception is exports which are slightly higher. Compared with Scenario 1 in which government budget balances are fixed, GSP gains from the iron ore boom would be 1.8% smaller, investment gains 4% smaller, consumption gains 4.8% smaller, import gains 3.2% smaller, employment gains 3.1% smaller and per capital consumption gains 8.7% smaller if government budget balances are not fixed. The reason for this is straightforward: with unfixed budget balance, government can build up a large surplus
29
derived from the resources boom. As these surpluses are not converted to consumption/investment either through tax cuts, transfers or other channels, stimulus in the economy is reduced. Consequently, the economy-wide impact of the resources boom will be smaller. Lower investment and consumption is likely to reduce local absorption, which in turn results in a slight rise in exports. 5. Concluding comments As a prominent resources-rich province, Western Australia has experienced several resources booms since the 1890s. The latest boom seems to be the most prominent one in Western Australia’s history. Using the iron ore sector as an example, this paper attempts to assess the flow-on effects of the current resources boom on the Western Australian economy. The main findings are as follows:
• As a result of the surge in iron ore exports and new iron ore projects, total (cumulative) increases over the period up to 2024-25 are projected to be $53.3 billion (in 2002-03 prices and in NPV terms) for GSP, $12.3 billion for investment, $26.2 billion for consumption and $32.9 billion for exports if the strong demand for iron ore is sustainable. If the iron ore boom is short-lived and to be ended in 2008-09, total (cumulative) increases resulting from the boom are projected to be $14.7 billion for GSP, $4.3 billion for investment, $6.4 billion for consumption and $8.0 billion for exports.
• The surge in iron ore exports and investment will create approximately 5,550
to 26,400 new jobs in the State, depending on whether the expanded iron ore exports are ephemeral or sustainable.
• After eliminating the “scale” effect, aggregate per capita consumption in
Western Australia over the period to 2024-25 is projected to increase by about $8.9 billion in the optimistic scenario and $1.5 billion in the pessimistic scenario (both in NPV terms).
• With respect to the sectoral effects, industries which closely relate to
construction activity, supply energy and provide various services are projected to benefit the most from the resources boom; while non-expanding export industries and import-competing industries are expected to either contract or benefit least.
Based on the above results, there are at least three important conclusions can be drawn from this study:
30
• The effects of the resources boom are not all of the “good news” variety. The economy as a whole will grow faster, but at the industry level there will be losers as well as winners. In particular, non-expanding export industries and import-competing industries will be squeezed by the real appreciation of the exchange rate during the construction phase of the new projects.
• The expansion of iron ore exports and new iron ore projects will generate
substantial flow-on benefits. It is interesting to note that only a small proportion (about 6.7% in Scenario 1 and 5.3% in Scenario 2) of new jobs generated in the whole economy are located in the iron ore industry, while more than 80% of the total number of additional jobs are projected to be generated in other industries, in particular the service industries. This shows that the economic effects of the expansion of iron ore exports and new iron ore projects are very broad.
• Western Australia’s benefits in terms of government revenues are projected to
be significantly reduced due to the Commonwealth Grants Commission’s equalisation processes. This is consistent with the usual claim that Western Australia subsidises other states. Thus the resources boom not only benefits the resources-rich state, but also helps non-booming states which might suffer from the “Dutch Disease”.
31
References Adams, P.D. (2001). “MMRF-GREEN: A Dynamic Multi-Regional Applied General
Equilibrium Model of the Australian Economy.” Research report for the Bureau of Transport Economics.
(2004). “Economic Impacts of Alternative Development Proposals for the
Argyle Diamond Mine.” Caton, C. (2006). “Economic Overview.” Economic and Political Overview, CEDA
White Paper No. 26: pp. 5-16. Choi, K-H. (1988). “The Economics of Booming Sectors.” Discussion Paper No.
88.04, Department of Economics, The University of Western Australia. Clements, K. W. and R. A. Greig (1994). Modeling Large Resource Development
Projects in an Open Economy: The Case of Australia’s North West Shelf Gas Project. Mount Pleasant, MI: The Blackstone Company.
, H. Ahammad and Ye Q. (1996). “New Mining and Mineral Processing
Projects in Western Australia: Effects on Employment and the Macroeconomy.” Resources Policy 22: 293-346.
Corden, W. M. (1982). “Exchange Rate Policy and the Resources Boom.” Economic
Record 58: 18-31. (1984). “Booming Sector and Dutch Disease Economics: Survey and
Consolidation.” Oxford Economic Papers 36: 359-80. and J. P. Neary (1982). “Booming Sector and De-Industrialisation in a Small
Open Economy.” Economic Journal 92: 825-48. Doran, C. R. (1984). “An Historical Perspective on Mining and Economic Change.”
Chapter 2 in L. H. Cook and M. G. Porter, eds, The Minerals Sector and the Australian Economy. Sydney: George Allen and Unwin. Pp. 37-84.
Dornbusch, R. (1974). “Tariffs and Nontraded Goods.” Journal of International
Economics 4: 177-85. Dornbusch, R. and S. Fischer (1984). “The Australian Macroeconomy.” Chapter 2
in R. E. Caves and L. B. Krause, eds, The Australian Economy: A View from the North. Sydney: George Allen and Unwin. Pp. 25-79.
Gelb, A. H. and Associates (1988). Oil Windfalls: Blessing or Curse? New York:
World Bank/Oxford University Press. Gregory, R. G. (1976). “Some Implications of the Growth of the Minerals Sector.”
Australian Journal of Agricultural Economics 20: 71-91.
32
Greig, R.A. (1998). “Trade complementarity: Western Australia and Korea.” Chapter
9 in Y. Wu (ed) The Economics of the East Asian Steel Industry: Production, Consumption and Trade. London: Ashgate, 1998.
Helliwell, J. F. (1984). “Natural Resources and the Australian Economy.” Chapter 3
in R. E. Caves and L. B. Krause, eds, The Australian Economy: A View from the North. Sydney: George Allen and Unwin. Pp. 81-126.
Layman, B. (2004). “The Economic and Fiscal Impact of Burrup Peninsula Based
Gas-Processing Projects on the Western Australian Economy: A Computable General Equilibrium Analysis.”
Long, N. V. (1983). “The Effects of a Booming Export Industry on the Rest of the
Economy.” Economic Record 59: 57-60. Maxwell, P. (1996). “Australia’s first and Second Nickel Booms: The Similarities and
Contrasts.” Paper presented at Department of Economics Seminar Series, University of Western Australia.
Neary, J. P. and S. van Wijnbergen (1986). Natural Resources and the
Macroeconomy. Oxford: Basil Blackwell. Preston, B. (2006). “Growth beyond all expectations.” Prospect March-May 2006:
7-8. Perth: DoIR. Snape, R. H. (1977). “Effects of Mineral Development on the Economy.” Australian
Journal of Agricultural Economics 21: 147-56. Stoeckel, A. (1979). “Some General Equilibrium Effects of Mining Growth on the
Economy.” Australian Journal of Agricultural Economics 23: 1-22. Western Australian Department of Treasury and Finance (2006). Business
Investment in Western Australia. Perth: DTF. Ye, Q. (1998). The Economic Significance of New Minerals Projects in Western
Australia. PhD Thesis, Nedlands: Economic Research Centre, Department of Economics, The University of Western Australia. pp. i-xiii, 1-376.