Embed Size (px)
Citation preview

Automechanika Dubai7 – 9 June 2021 | DWTC
Automechanika Riyadh11 – 13 October 2021

Webinar access – desktop/laptop
No Audio/Video? – Refresh browser
Click here for audio button – click it!
For best user experience:

Engagement area
Replay available on: www.automechanikaDubai.com/Webinars
For best user experience:
4
Commercial Vehicle Industry –
Overcoming the COVID-19 Crisis

5
Agenda
6
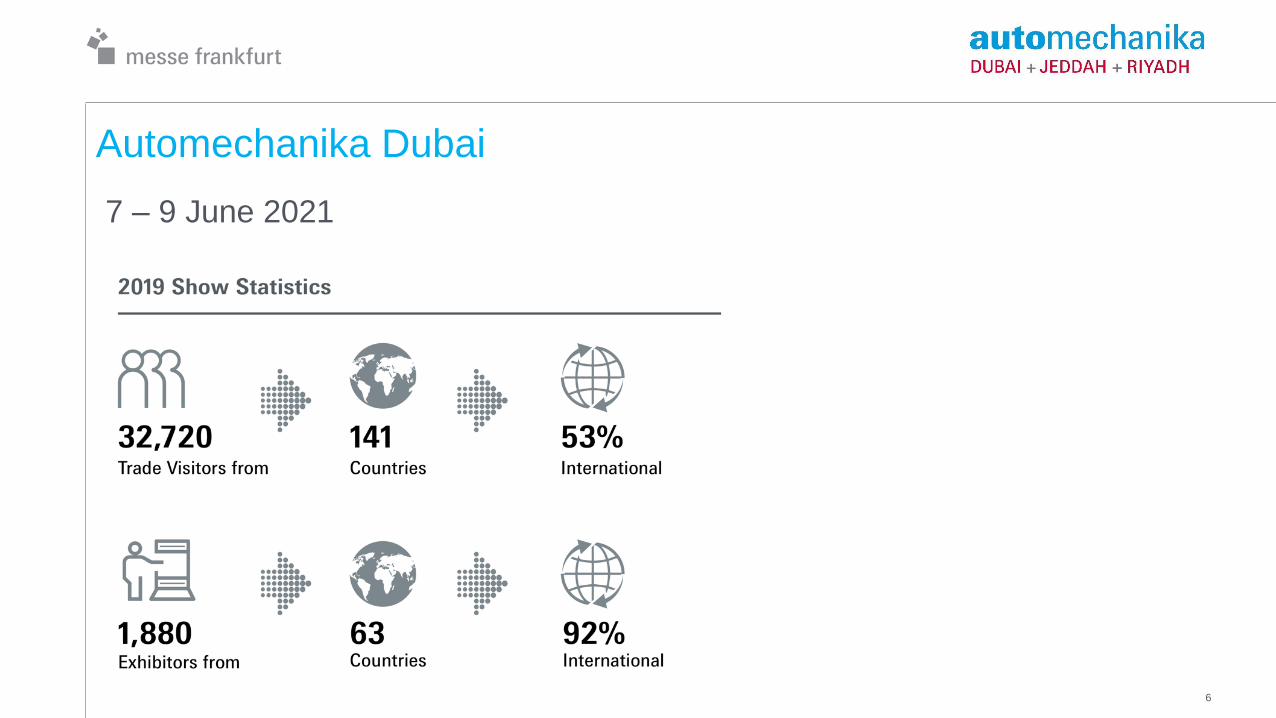
Automechanika Dubai
7 – 9 June 2021

7
Automechanika Dubai
Key Show Highlights:
Competencies:
Truck, motorcycle & agriculture
Academy:
Learning & development area of the show
Modern workshop:
Area for our garage/workshop audience – product demos & trainings
Product focus:
Body & paint
Oils & lubricants

8
Exhibitors• 87 exhibitors from 13 countries
• 52 exhibitors from 11 countries (COVID-19)
• Country Pavilions: Turkey, USA, South Korea, China, Hong Kong, Taiwan
Visitors• 2,470 visitors
New show dates 11-13 October 2021
Automechanika Riyadh 2020
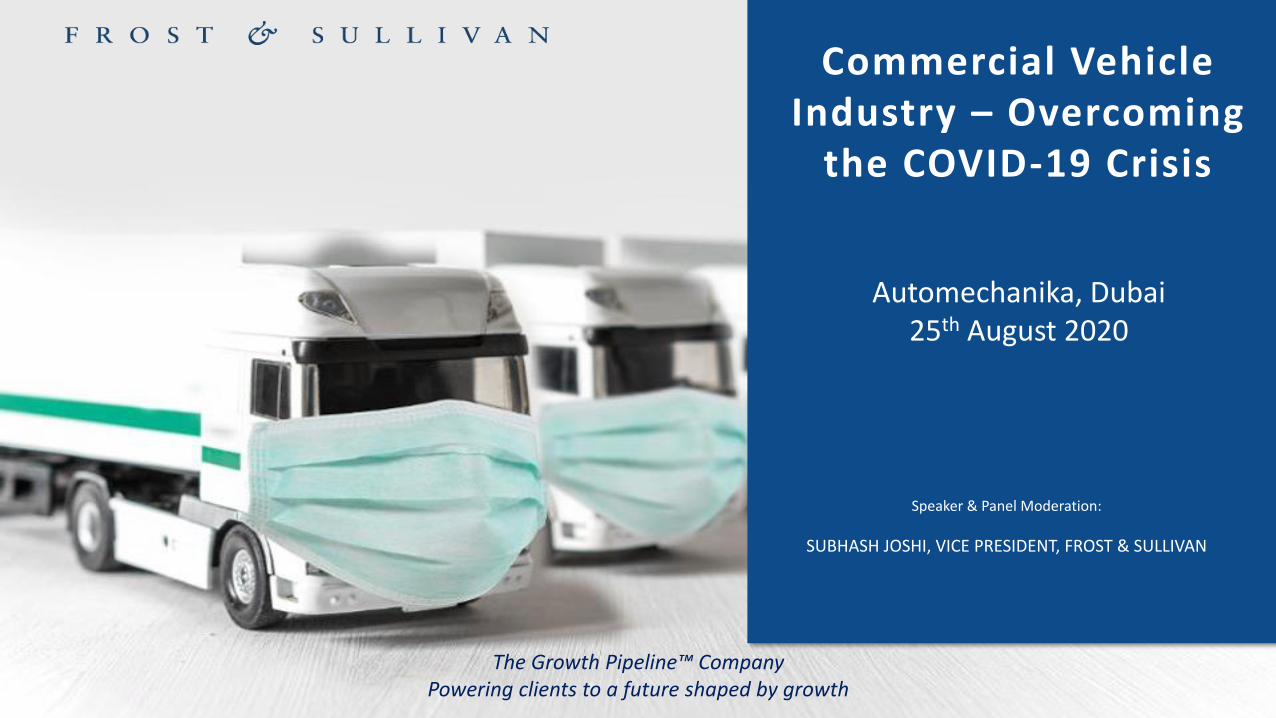
The Growth Pipeline™ CompanyPowering clients to a future shaped by growth
Commercial Vehicle Industry – Overcoming
the COVID-19 Crisis
Speaker & Panel Moderation:
SUBHASH JOSHI, VICE PRESIDENT, FROST & SULLIVAN
Automechanika, Dubai25th August 2020
10
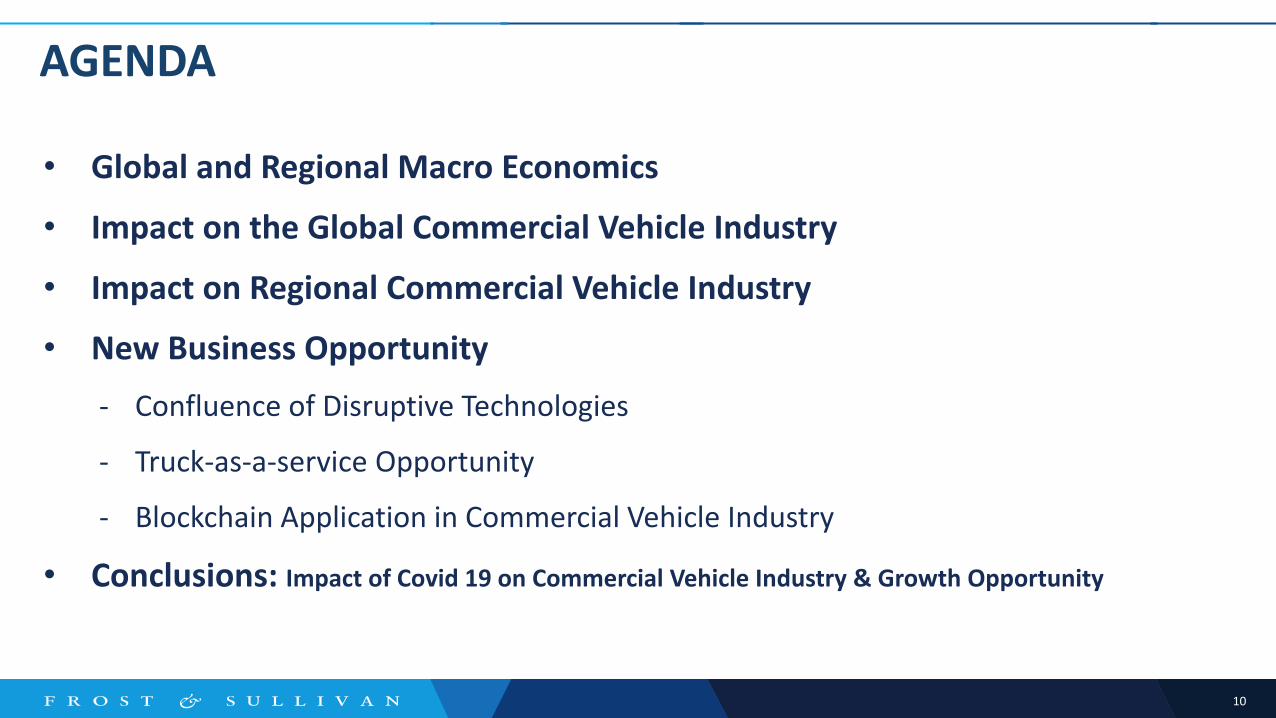
• Global and Regional Macro Economics
• Impact on the Global Commercial Vehicle Industry
• Impact on Regional Commercial Vehicle Industry
• New Business Opportunity
- Confluence of Disruptive Technologies
- Truck-as-a-service Opportunity
- Blockchain Application in Commercial Vehicle Industry
• Conclusions: Impact of Covid 19 on Commercial Vehicle Industry & Growth Opportunity
AGENDA

11
Global and Regional Macro Economics
12
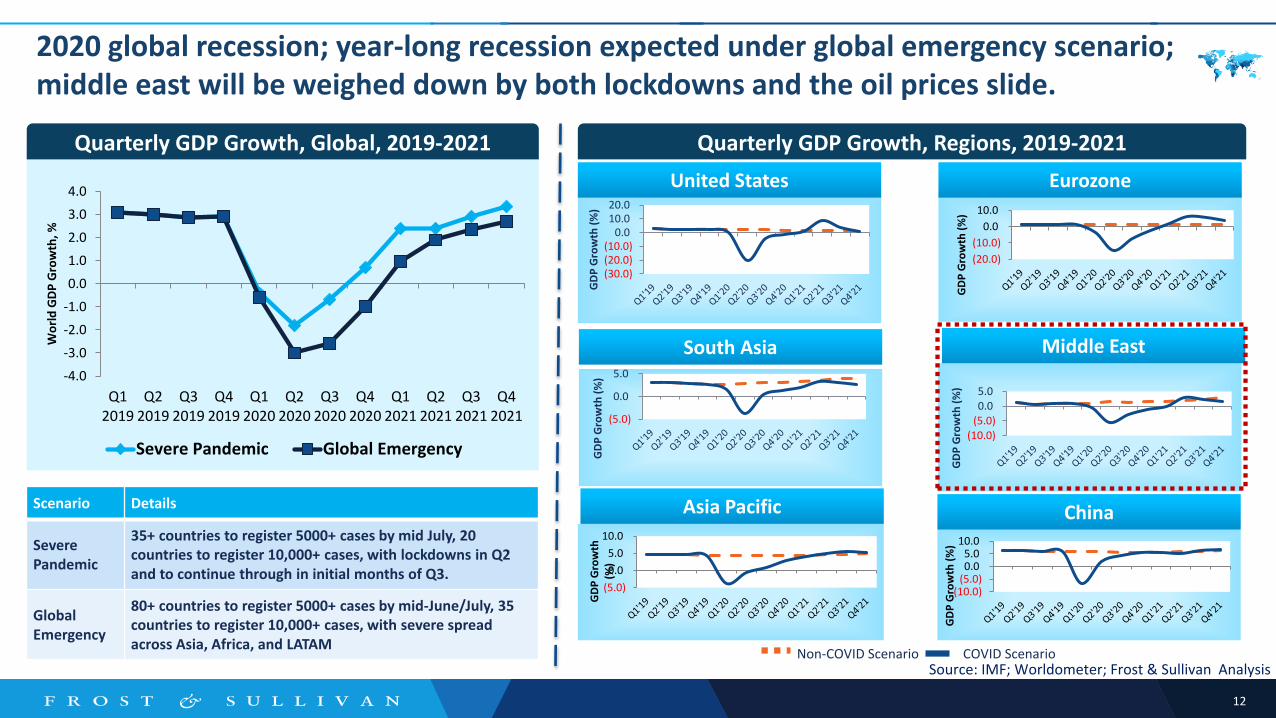
2020 global recession; year-long recession expected under global emergency scenario; middle east will be weighed down by both lockdowns and the oil prices slide.
-4.0
-3.0
-2.0
-1.0
0.0
1.0
2.0
3.0
4.0
Q12019
Q22019
Q32019
Q42019
Q12020
Q22020
Q32020
Q42020
Q12021
Q22021
Q32021
Q42021
Wo
rld
GD
P G
row
th, %
Severe Pandemic Global Emergency
Source: IMF; Worldometer; Frost & Sullivan Analysis
Quarterly GDP Growth, Global, 2019-2021
Scenario Details
Severe Pandemic
35+ countries to register 5000+ cases by mid July, 20 countries to register 10,000+ cases, with lockdowns in Q2 and to continue through in initial months of Q3.
Global Emergency
80+ countries to register 5000+ cases by mid-June/July, 35 countries to register 10,000+ cases, with severe spread across Asia, Africa, and LATAM
Quarterly GDP Growth, Regions, 2019-2021
(20.0)
(10.0)
0.0
10.0
GD
P G
row
th (
%)
United States Eurozone
Asia Pacific
South Asia Middle East
China
(5.0)
0.0
5.0
10.0
GD
P G
row
th
(%)
(30.0)(20.0)(10.0)
0.010.020.0
GD
P G
row
th (
%)
(5.0)
0.0
5.0
GD
P G
row
th (
%)
(10.0)(5.0)0.05.0
GD
P G
row
th (
%)
(10.0)(5.0)0.05.0
10.0
GD
P G
row
th (
%)
Non-COVID Scenario COVID Scenario
13
3.0
2.0
1.0
0.0
1.0
2.0
3.0
Q12019
Q22019
Q32019
Q42019
Q12020
Q22020
Q32020
Q42020
Q12021
Q22021
Q32021
Q42021
Saudi Arabia
UAE
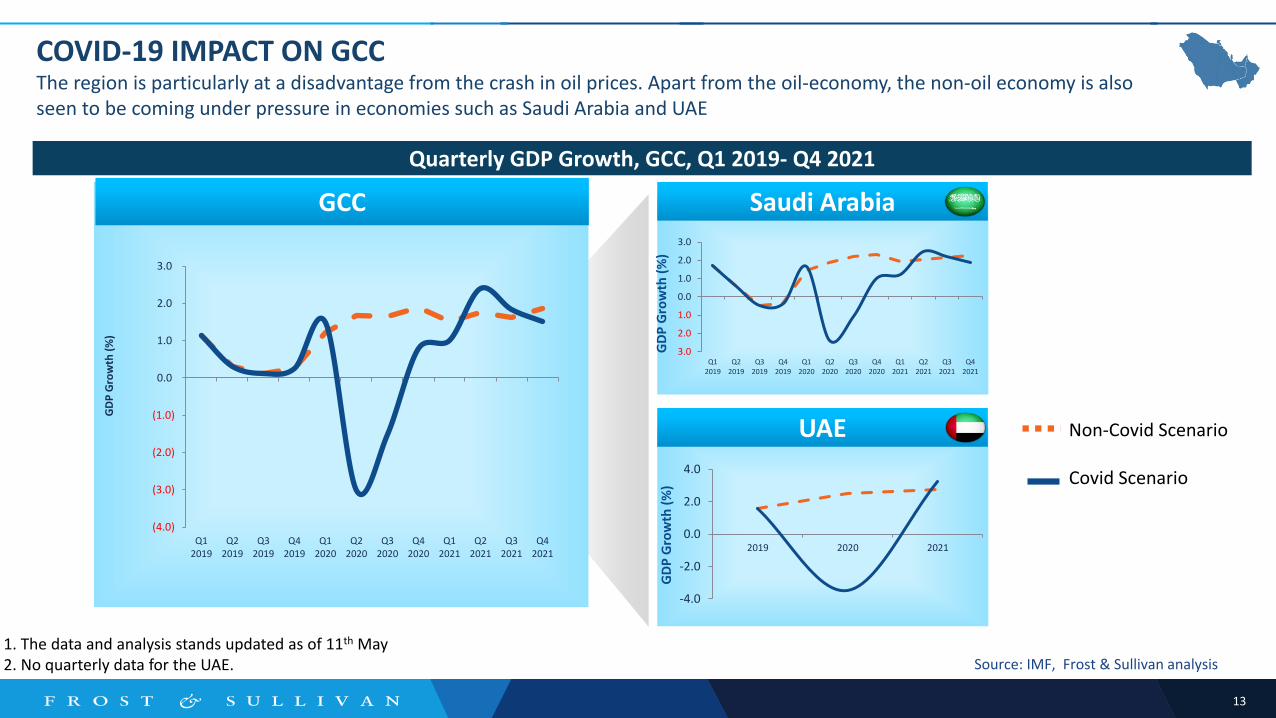
COVID-19 IMPACT ON GCCThe region is particularly at a disadvantage from the crash in oil prices. Apart from the oil-economy, the non-oil economy is also seen to be coming under pressure in economies such as Saudi Arabia and UAE
Quarterly GDP Growth, GCC, Q1 2019- Q4 2021
GCC
(4.0)
(3.0)
(2.0)
(1.0)
0.0
1.0
2.0
3.0
Q12019
Q22019
Q32019
Q42019
Q12020
Q22020
Q32020
Q42020
Q12021
Q22021
Q32021
Q42021
GD
P G
row
th (
%)
1. The data and analysis stands updated as of 11th May2. No quarterly data for the UAE.
-4.0
-2.0
0.0
2.0
4.0
2019 2020 2021
Non-Covid Scenario
Covid Scenario
GD
P G
row
th (
%)
GD
P G
row
th (
%)
Source: IMF, Frost & Sullivan analysis
14
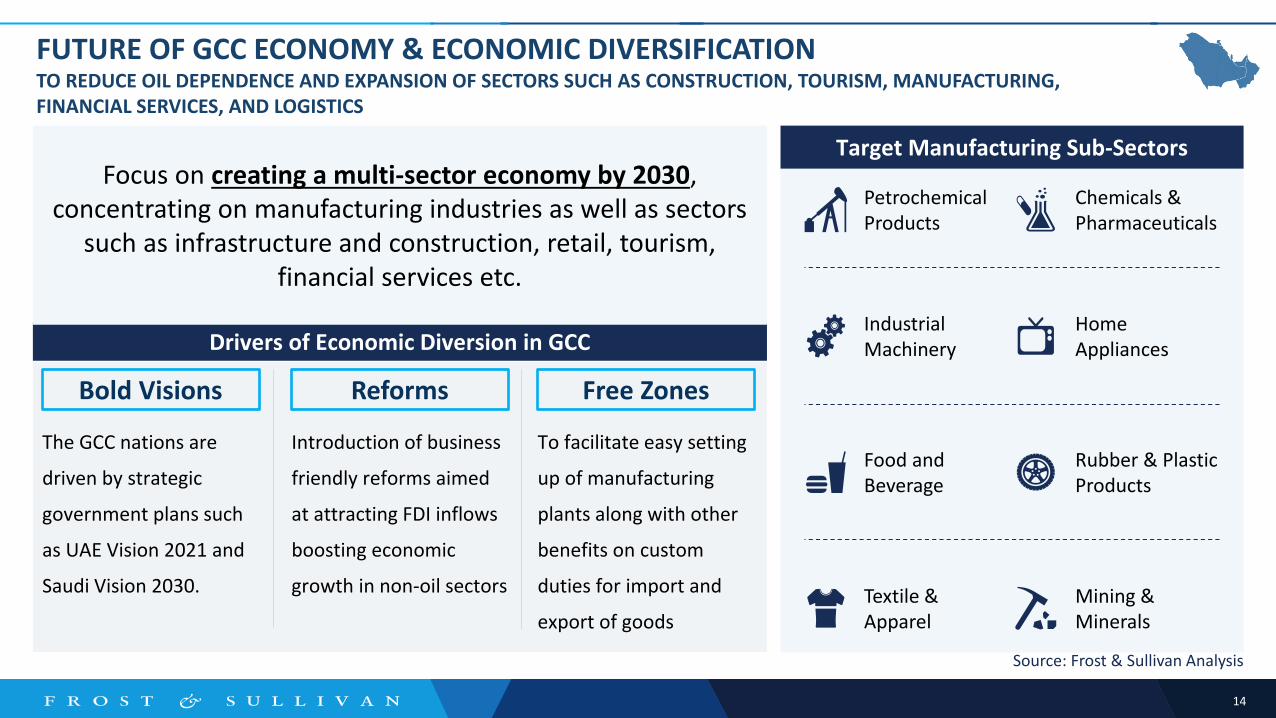
FUTURE OF GCC ECONOMY & ECONOMIC DIVERSIFICATION TO REDUCE OIL DEPENDENCE AND EXPANSION OF SECTORS SUCH AS CONSTRUCTION, TOURISM, MANUFACTURING, FINANCIAL SERVICES, AND LOGISTICS
Drivers of Economic Diversion in GCC
The GCC nations are
driven by strategic
government plans such
as UAE Vision 2021 and
Saudi Vision 2030.
Introduction of business
friendly reforms aimed
at attracting FDI inflows
boosting economic
growth in non-oil sectors
To facilitate easy setting
up of manufacturing
plants along with other
benefits on custom
duties for import and
export of goods
Bold Visions Reforms Free Zones
Focus on creating a multi-sector economy by 2030, concentrating on manufacturing industries as well as sectors
such as infrastructure and construction, retail, tourism, financial services etc.
Petrochemical Products
Chemicals & Pharmaceuticals
Industrial Machinery
Home Appliances
Food and Beverage
Rubber & Plastic Products
Textile & Apparel
Mining & Minerals
Target Manufacturing Sub-Sectors
Source: Frost & Sullivan Analysis
15
Impact on the Global* Commercial Vehicle Industry
*Global segment definition is different then regional (GCC)
*Data on further slides is only for Trucks, however LCV does include Small Commercial Vehicles as well
(which is <3.5t GVW)

16
-4
-3
-2
-1
0
1
2
3
4
5
6
7
0.0
0.5
1.0
1.5
2.0
2.5
3.0
3.5
4.0
Mill
ion
s U
nit
s
YearSevere Pandemic Scenario Global Emergency Scenario Global GDP
2008-2009: Global
economic downturn
2018-2019: Trade war &
Brexit uncertainty
2010: Market recovery, ~45% growth rate
-29%
-48%
3.5
2020: Temporary production shutdown due to COVID-19
outbreak
3.2
Global M&HD Truck Production – 2004 to 2025Global M&HD truck production is likely to shape up as per the ‘severe pandemic’ scenario
wherein most countries resumed partial vehicle production mid-May & June
Source: IMF,Marklines; Frost & Sullivan Analysis
Global Emergency
• About 48% Y-o-Y decline is projected in 2020, followed by 24% Y-o-Y recovery in 2021
Severe Pandemic
• Frost & Sullivan expects a 29% Y-o-Y decline in 2020, followed by about 16% Y-o-Y growth in 2021
2019: M&HD Production levels: 3.3 Million Units
COVID-19 Impact: Global M&HD Truck Production Forecast Scenarios, Global, 2004 to 2025
17
Source: Frost & Sullivan analysis
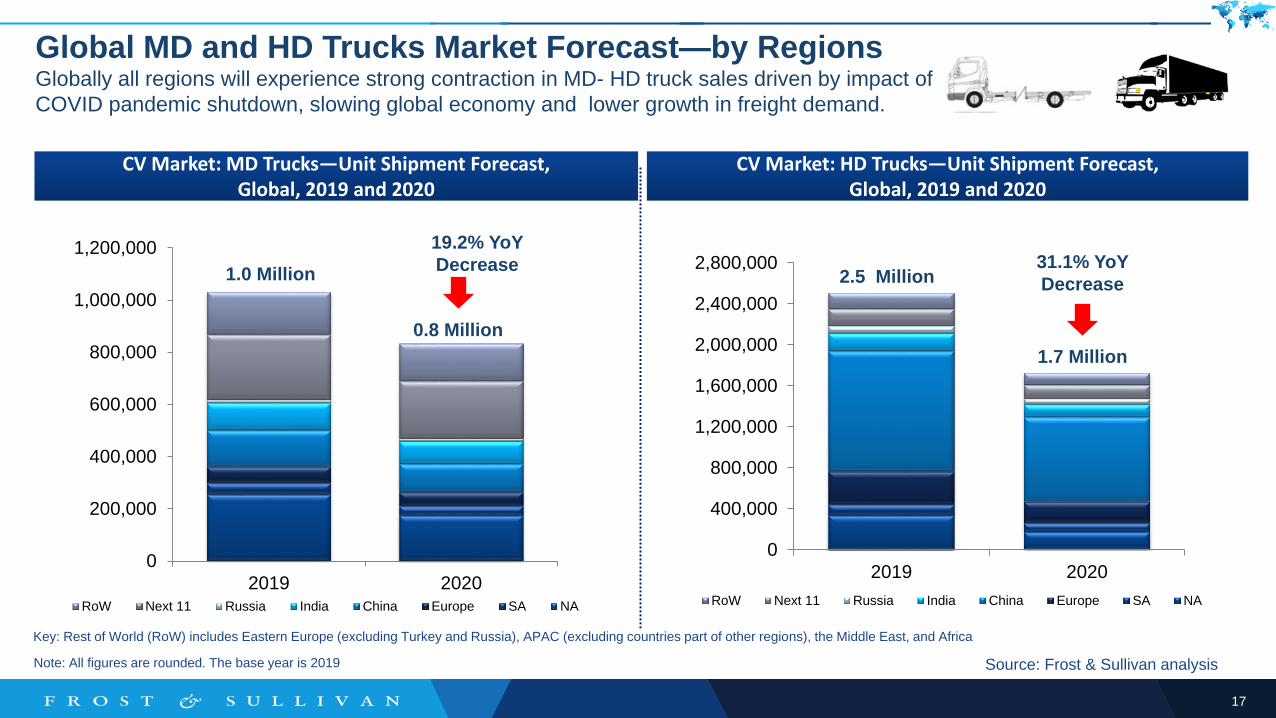
Global MD and HD Trucks Market Forecast—by RegionsGlobally all regions will experience strong contraction in MD- HD truck sales driven by impact of
COVID pandemic shutdown, slowing global economy and lower growth in freight demand.
Note: All figures are rounded. The base year is 2019
Key: Rest of World (RoW) includes Eastern Europe (excluding Turkey and Russia), APAC (excluding countries part of other regions), the Middle East, and Africa
CV Market: HD Trucks—Unit Shipment Forecast, Global, 2019 and 2020
CV Market: MD Trucks—Unit Shipment Forecast, Global, 2019 and 2020
0
400,000
800,000
1,200,000
1,600,000
2,000,000
2,400,000
2,800,000
2019 2020
RoW Next 11 Russia India China Europe SA NA
0
200,000
400,000
600,000
800,000
1,000,000
1,200,000
2019 2020RoW Next 11 Russia India China Europe SA NA
1.0 Million
0.8 Million
2.5 Million
1.7 Million
19.2% YoY
Decrease 31.1% YoY
Decrease
18
Source: Frost & Sullivan analysis
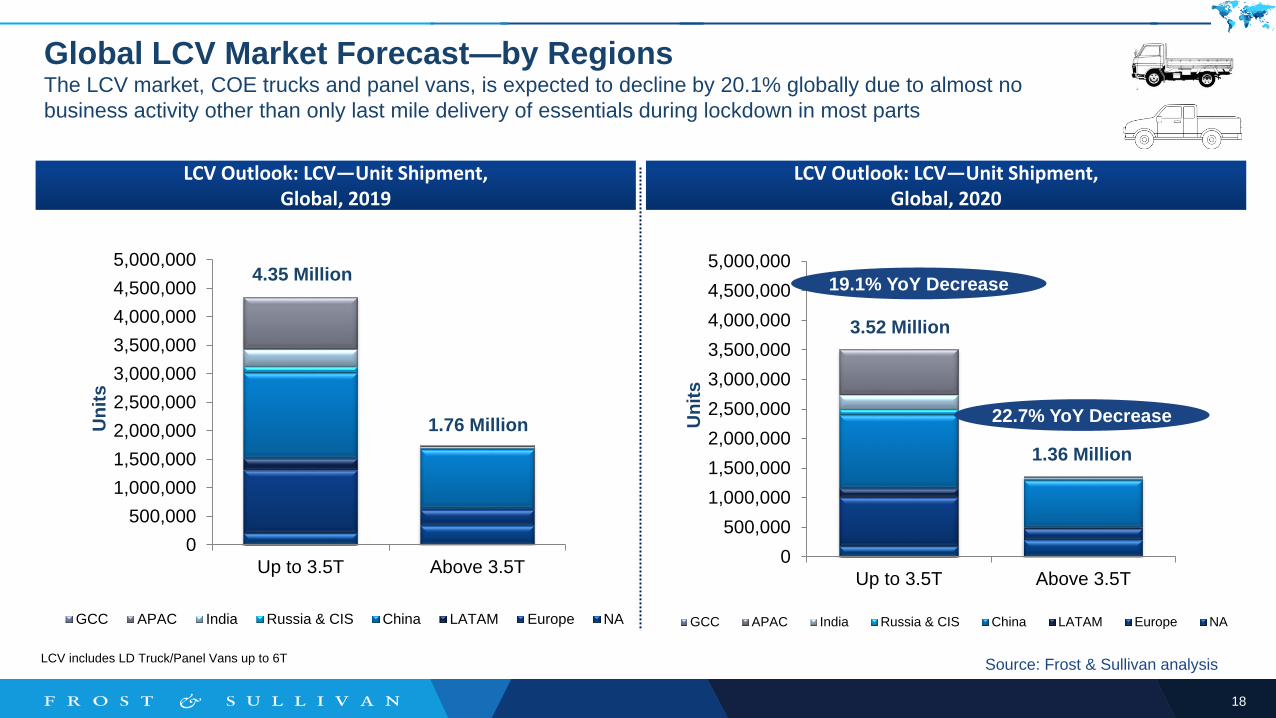
Global LCV Market Forecast—by RegionsThe LCV market, COE trucks and panel vans, is expected to decline by 20.1% globally due to almost no
business activity other than only last mile delivery of essentials during lockdown in most parts
LCV Outlook: LCV—Unit Shipment, Global, 2020
LCV Outlook: LCV—Unit Shipment, Global, 2019
LCV includes LD Truck/Panel Vans up to 6T
0
500,000
1,000,000
1,500,000
2,000,000
2,500,000
3,000,000
3,500,000
4,000,000
4,500,000
5,000,000
Up to 3.5T Above 3.5T
GCC APAC India Russia & CIS China LATAM Europe NA
19.1% YoY Decrease
22.7% YoY Decrease
0
500,000
1,000,000
1,500,000
2,000,000
2,500,000
3,000,000
3,500,000
4,000,000
4,500,000
5,000,000
Up to 3.5T Above 3.5T
GCC APAC India Russia & CIS China LATAM Europe NA
Un
its
Un
its
4.35 Million
1.76 Million
3.52 Million
1.36 Million
19
Impact on Regional* Commercial Vehicle Industry
*Regional definition includes buses; LCV classified as >=3.5t GVW to uoto 9t GVW, MCV is upto 16t
GVW. The data provided in further slides does not include SCVs (Small commercial vehicles)
20
56,984
43,990 44,785
70,047
-
20,000
40,000
60,000
80,000
100,000
2019 2020 2021 2025
Sale
s (U
nit
s)
Bahrain
Qatar
Oman
Kuwait
UAE
Saudi Arabia
Total
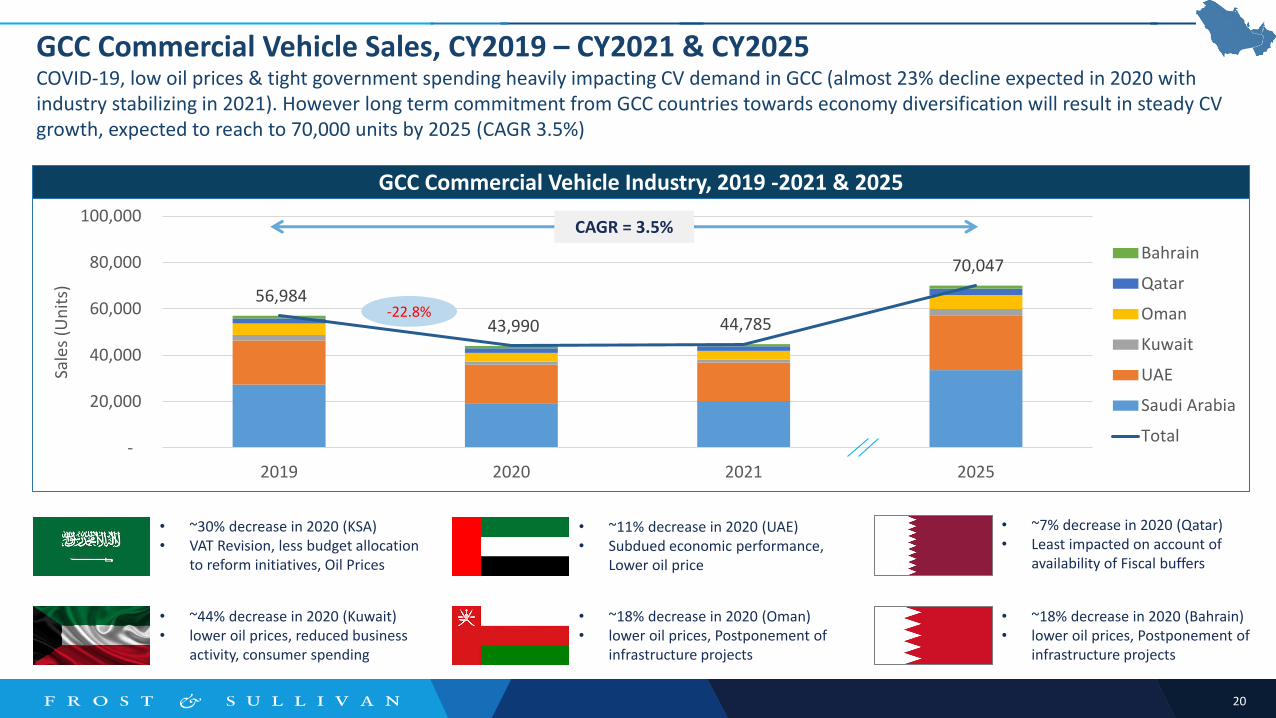
GCC Commercial Vehicle Industry, 2019 -2021 & 2025
GCC Commercial Vehicle Sales, CY2019 – CY2021 & CY2025COVID-19, low oil prices & tight government spending heavily impacting CV demand in GCC (almost 23% decline expected in 2020 with industry stabilizing in 2021). However long term commitment from GCC countries towards economy diversification will result in steady CV growth, expected to reach to 70,000 units by 2025 (CAGR 3.5%)
CAGR = 3.5%
-22.8%
• ~30% decrease in 2020 (KSA)• VAT Revision, less budget allocation
to reform initiatives, Oil Prices
• ~44% decrease in 2020 (Kuwait)• lower oil prices, reduced business
activity, consumer spending
• ~11% decrease in 2020 (UAE)• Subdued economic performance,
Lower oil price
• ~18% decrease in 2020 (Oman)• lower oil prices, Postponement of
infrastructure projects
• ~7% decrease in 2020 (Qatar)• Least impacted on account of
availability of Fiscal buffers
• ~18% decrease in 2020 (Bahrain)• lower oil prices, Postponement of
infrastructure projects
21
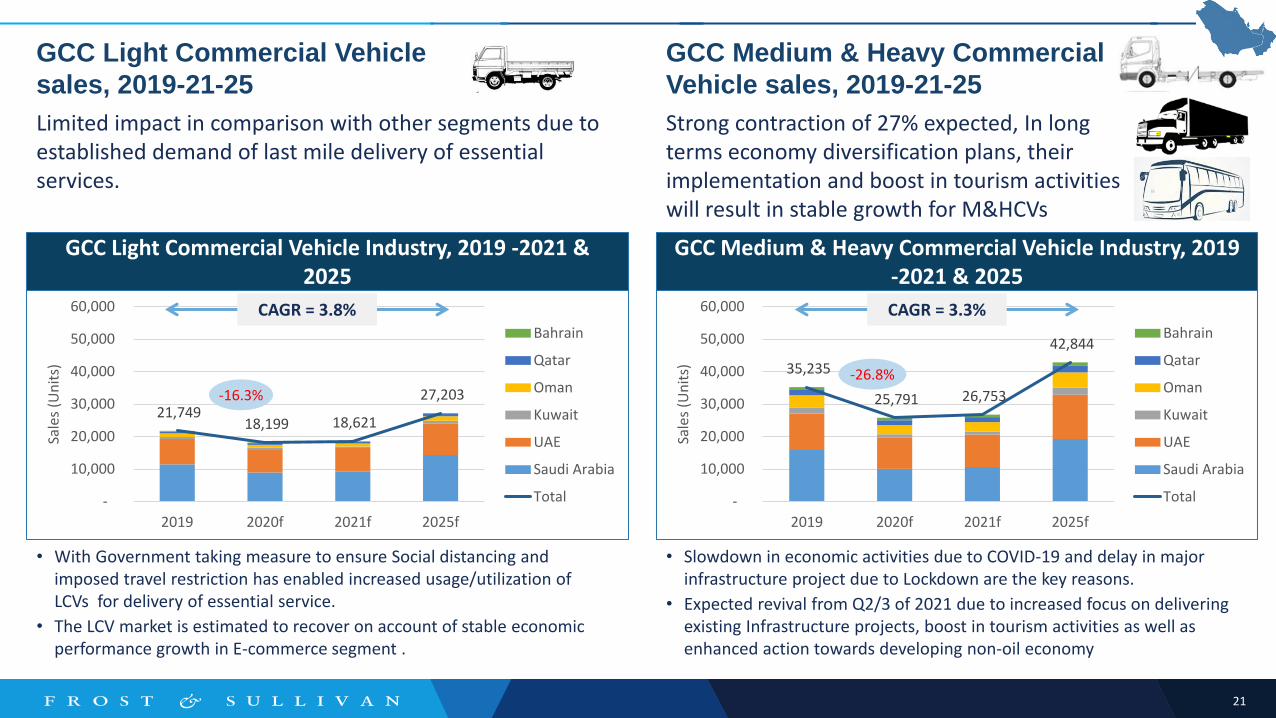
GCC Light Commercial Vehicle
sales, 2019-21-25
GCC Medium & Heavy Commercial
Vehicle sales, 2019-21-25
Limited impact in comparison with other segments due to established demand of last mile delivery of essential services.
Strong contraction of 27% expected, In long terms economy diversification plans, their implementation and boost in tourism activities will result in stable growth for M&HCVs
GCC Light Commercial Vehicle Industry, 2019 -2021 & 2025
21,749 18,199 18,621
27,203
-
10,000
20,000
30,000
40,000
50,000
60,000
2019 2020f 2021f 2025f
Sale
s (U
nit
s)
Bahrain
Qatar
Oman
Kuwait
UAE
Saudi Arabia
Total
35,235
25,791 26,753
42,844
-
10,000
20,000
30,000
40,000
50,000
60,000
2019 2020f 2021f 2025f
Sale
s (U
nit
s)
Bahrain
Qatar
Oman
Kuwait
UAE
Saudi Arabia
Total
GCC Medium & Heavy Commercial Vehicle Industry, 2019 -2021 & 2025
-16.3%
-26.8%
CAGR = 3.8% CAGR = 3.3%
• With Government taking measure to ensure Social distancing and imposed travel restriction has enabled increased usage/utilization of LCVs for delivery of essential service.
• The LCV market is estimated to recover on account of stable economic performance growth in E-commerce segment .
• Slowdown in economic activities due to COVID-19 and delay in major infrastructure project due to Lockdown are the key reasons.
• Expected revival from Q2/3 of 2021 due to increased focus on delivering existing Infrastructure projects, boost in tourism activities as well as enhanced action towards developing non-oil economy
22
New Business Models and Opportunities
23
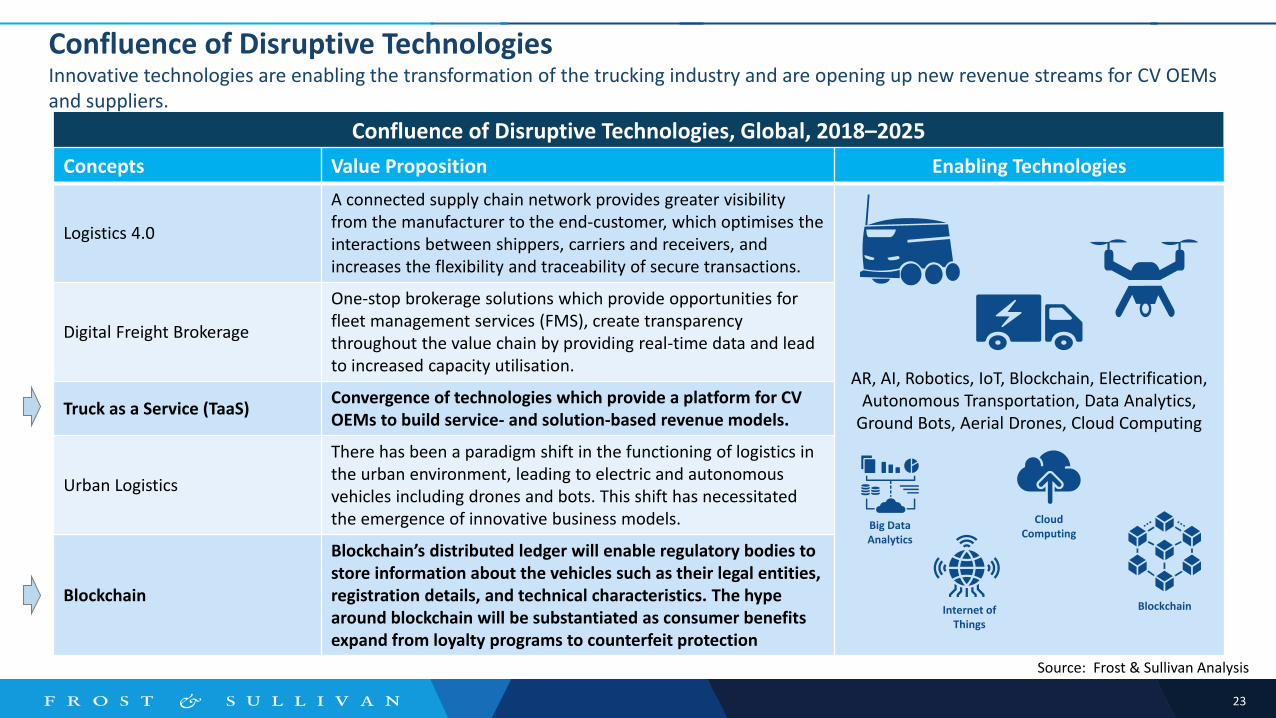
Confluence of Disruptive TechnologiesInnovative technologies are enabling the transformation of the trucking industry and are opening up new revenue streams for CV OEMs and suppliers.
Confluence of Disruptive Technologies, Global, 2018–2025
Concepts Value Proposition Enabling Technologies
Logistics 4.0
A connected supply chain network provides greater visibility from the manufacturer to the end-customer, which optimises the interactions between shippers, carriers and receivers, and increases the flexibility and traceability of secure transactions.
AR, AI, Robotics, IoT, Blockchain, Electrification, Autonomous Transportation, Data Analytics,
Ground Bots, Aerial Drones, Cloud Computing
Digital Freight Brokerage
One-stop brokerage solutions which provide opportunities for fleet management services (FMS), create transparency throughout the value chain by providing real-time data and lead to increased capacity utilisation.
Truck as a Service (TaaS)Convergence of technologies which provide a platform for CV OEMs to build service- and solution-based revenue models.
Urban Logistics
There has been a paradigm shift in the functioning of logistics in the urban environment, leading to electric and autonomous vehicles including drones and bots. This shift has necessitated the emergence of innovative business models.
Blockchain
Blockchain’s distributed ledger will enable regulatory bodies to store information about the vehicles such as their legal entities, registration details, and technical characteristics. The hype around blockchain will be substantiated as consumer benefits expand from loyalty programs to counterfeit protection
Big Data Analytics
BlockchainInternet of Things
Cloud Computing
Source: Frost & Sullivan Analysis

24
Truck-as-a-service OpportunitiesThe confluence of technologies provides a platform to build service and solution-based revenue models – OEMs are transitioning from product or service to catering to the overall customer experience.
Digital Transformation
Technology Advancements
Emerging BusinessOpportunity
Truck as a Service
Telematics/FMS
Digital Retail
TMSBusiness Analytics
Confluence of Technologies
Digital Freight
Brokerage
Truck Leasing / Rental / Sharing
Connectivity Technologies
Online Mobile Ecosystem
Big Data/IOT
Predictive Maintenance
Blockchain
Source: Frost & Sullivan analysis
“UBER for trucks – will generate more than
$26.5 Billion in revenue in 2025”
25
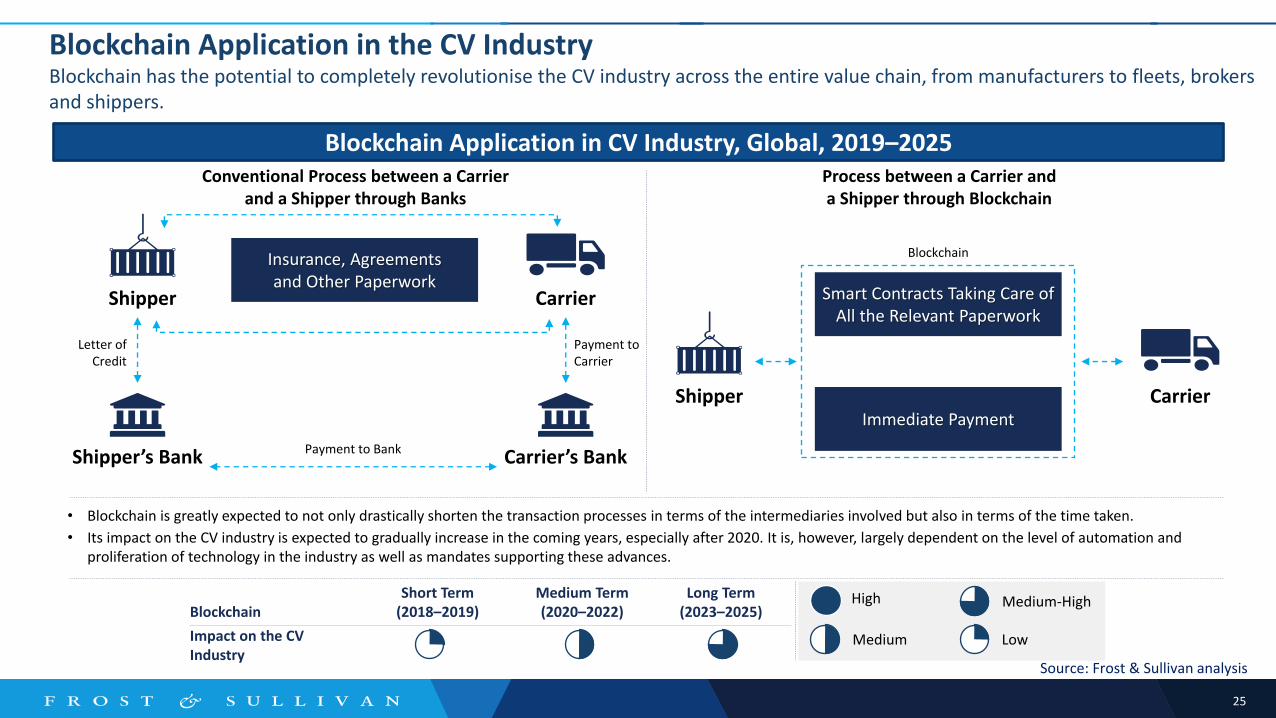
Blockchain Application in the CV IndustryBlockchain has the potential to completely revolutionise the CV industry across the entire value chain, from manufacturers to fleets, brokers and shippers.
Blockchain Application in CV Industry, Global, 2019–2025
BlockchainShort Term
(2018–2019)Medium Term(2020–2022)
Long Term(2023–2025)
Impact on the CV Industry
Payment to Bank
Conventional Process between a Carrierand a Shipper through Banks
Process between a Carrier anda Shipper through Blockchain
CarrierShipper
Insurance, Agreementsand Other Paperwork
Shipper’s Bank Carrier’s Bank
Letter of Credit
Payment to Carrier
CarrierShipper
Smart Contracts Taking Care of All the Relevant Paperwork
Immediate Payment
Blockchain
• Blockchain is greatly expected to not only drastically shorten the transaction processes in terms of the intermediaries involved but also in terms of the time taken.
• Its impact on the CV industry is expected to gradually increase in the coming years, especially after 2020. It is, however, largely dependent on the level of automation and proliferation of technology in the industry as well as mandates supporting these advances.
High Medium-High
Medium Low
Source: Frost & Sullivan analysis
26
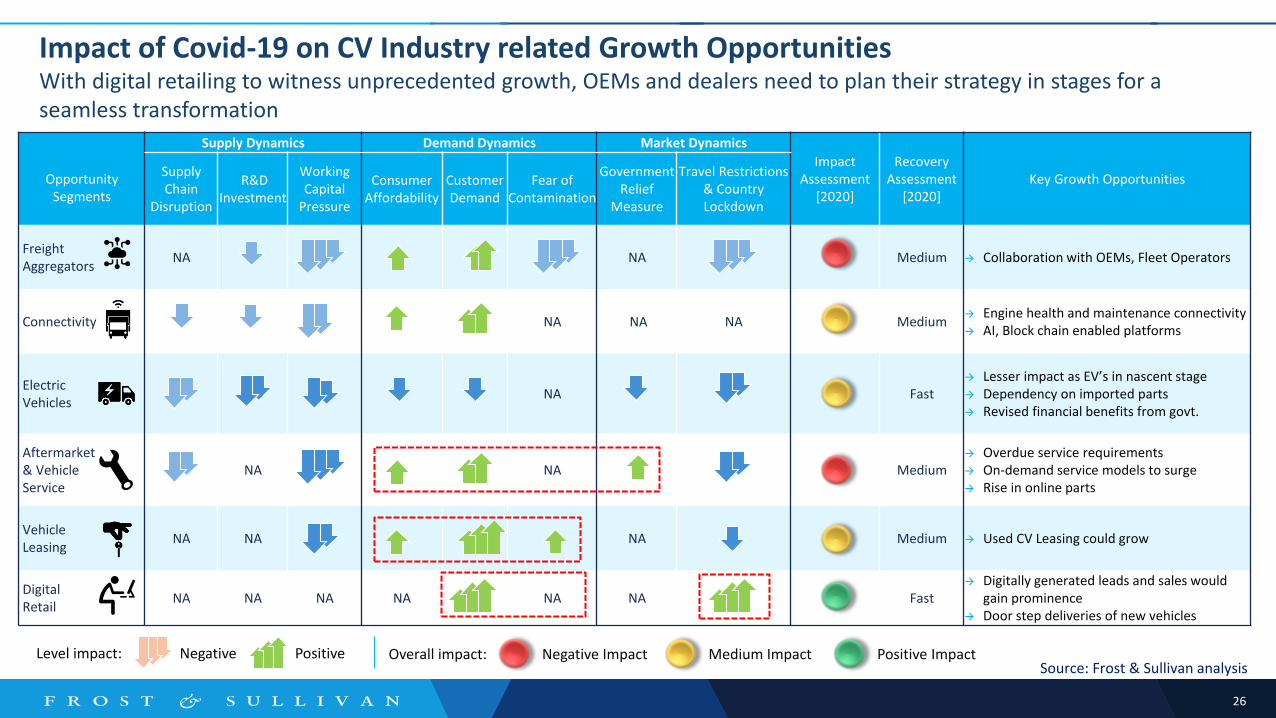
Impact of Covid-19 on CV Industry related Growth OpportunitiesWith digital retailing to witness unprecedented growth, OEMs and dealers need to plan their strategy in stages for a seamless transformation
Opportunity Segments
Supply Dynamics Demand Dynamics Market Dynamics
Impact Assessment
[2020]
Recovery Assessment
[2020]Key Growth Opportunities
Supply Chain
Disruption
R&DInvestment
Working Capital
Pressure
Consumer Affordability
Customer Demand
Fear ofContamination
GovernmentRelief
Measure
Travel Restrictions & Country Lockdown
Freight Aggregators
NA NA Medium Collaboration with OEMs, Fleet Operators
Connectivity NA NA NA Medium Engine health and maintenance connectivity AI, Block chain enabled platforms
ElectricVehicles
NA Fast Lesser impact as EV’s in nascent stage Dependency on imported parts Revised financial benefits from govt.
Aftermarket & VehicleService
NA NA Medium Overdue service requirements On-demand service models to surge Rise in online parts
VehicleLeasing
NA NA NA Medium Used CV Leasing could grow
DigitalRetail
NA NA NA NA NA NA Fast Digitally generated leads and sales would
gain prominence Door step deliveries of new vehicles
Overall impact:Level impact: Negative Positive Negative Impact Medium Impact Positive ImpactSource: Frost & Sullivan analysis
27
Which segment of Commercial Vehicle will see faster recovery in the GCC region?
POLL QUESTION

Panel Discussion
Panel Member Panel Member Panel Member Moderator

The Growth Pipeline Company
Your Next Steps
1: Take the Growth Pipeline Diagnostic to assess your current growth capabilities
https://ww2.frost.com/growth-pipeline-diagnostic/
2: Reach out to your team to act
Subhash Joshi
Vice President – Mobility
Regional Head – Middle East & Africa
Phone: +971.44 331 896
Email: [email protected]
Nimisha Iyer
Director - Marketing Communications, Middle East & South Asia (MESA)
Phone: +91 22 66072003 | Cell : +91 9820050519
Email: [email protected]
30
Thank you for joining!
Replays will be available on www.automechanikaDubai.com/Webinars
Follow us @automechanikaDu for all updates
Email us at [email protected]
Automechanika Dubai19 – 21 October 2020 | DWTC
Automechanika Riyadh2021