Embed Size (px)
Citation preview

COMM-20140512-86450| March 2017
Commercial Roof-top Units in Minnesota
Characteristics and Energy Performance
Conservation Applied Research & Development (CARD)
FINAL REPORT
Prepared for: Minnesota Department of Commerce
Division of Energy Resources
Prepared by: Seventhwave and Center for Energy and Environment

Prepared by:
Scott Schuetter, Seventhwave Mark Hancock, Center for Energy and the Environment Alex Haynor, Center for Energy and the Environment Ben Schoenbauer, Center for Energy and the Environment Jeannette LeZaks, Seventhwave Melanie Lord, Seventhwave
Principal Investigator: Scott Schuetter, Seventhwave 749 University Row, Suite 320 Madison, WI 53705
© 2017 Seventhwave. All rights reserved.
Contract Number: 86450
Prepared for Minnesota Department of Commerce, Division of Energy Resources
Mike Rothman, Commissioner, Department of Commerce
Bill Grant, Deputy Commissioner, Department of Commerce, Division of Energy Resources
Mark Garofano, Project Manager Phone (651-539-1864) Email ([email protected])
ACKNOWLEDGEMENTS
This project was supported in part (or in whole) by a grant from the Minnesota Department of Commerce, Division of Energy Resources, through the Conservation Applied Research and Development (CARD) program, which is funded by Minnesota ratepayers.
The project benefited greatly from the hard work and insights of Ben Auchter, Allison Cardiel, Scott Hackel, Joe Kramer, Scott Pigg, and Hayley Young of Seventhwave. The project also benefited significantly from the time that the building and RTU manufacturer staff took to a share valuable information with us. Thank you to all who participated.
DISCLAIMER
This report does not necessarily represent the view(s), opinion(s), or position(s) of the Minnesota Department of Commerce (Commerce), its employees or the State of Minnesota (State). When applicable, the State will evaluate the results of this research for inclusion in Conservation Improvement Program (CIP) portfolios and communicate its recommendations in separate document(s).
Commerce, the State, its employees, contractors, subcontractors, project participants, the organizations listed herein, or any person on behalf of any of the organizations mentioned herein make no warranty, express or implied, with respect to the use of any information, apparatus, method, or process disclosed in this document. Furthermore, the aforementioned parties assume no liability for the information in this report with respect to the use of, or damages resulting from the use of, any information, apparatus, method, or process disclosed in this document; nor does any party represent that the use of this information will not infringe upon privately owned rights.

i
Table of Contents
Executive Summary ................................................................................................................................... 1
Objective .................................................................................................................................................. 1
Methodology ........................................................................................................................................... 1
Results ...................................................................................................................................................... 2
Existing RTUs ..................................................................................................................................... 2
New and Replacement RTUs ........................................................................................................... 5
Monitoring .......................................................................................................................................... 5
CIP Recommendations .......................................................................................................................... 6
Introduction ................................................................................................................................................ 8
Background and Objective .................................................................................................................... 8
Characterizing Rooftop Units ................................................................................................................... 9
Methodology for Characterizing Existing RTUs ............................................................................... 9
Data Accuracy .................................................................................................................................. 12
Methodology for Characterizing the New and Replacement RTU Market ................................. 14
Results .................................................................................................................................................... 15
Building Characteristics .................................................................................................................. 15
RTU Characteristics ......................................................................................................................... 29
New versus Replacement Market .................................................................................................. 41
Monitoring Rooftop Units ...................................................................................................................... 44
Methodology for Monitoring Rooftop Units .................................................................................... 44
In-depth Site Visit ............................................................................................................................ 44
Monitoring of RTU Consumption ................................................................................................. 46
Annual Energy Consumption ........................................................................................................ 49
Evaluation of RTU Sizing................................................................................................................ 54
Results from Monitored RTUs ........................................................................................................... 56
In-depth Site Visits ........................................................................................................................... 56
Annual Energy Consumption ........................................................................................................ 64
Evaluation of RTU Sizing................................................................................................................ 81
Key performance indicators ........................................................................................................... 85
High and Low Performance Characteristics ................................................................................ 85
Extrapolation to the Minnesota Market ........................................................................................ 86
CIP Recommendations ............................................................................................................................ 89

ii
Opportunities ........................................................................................................................................ 89
Barriers ................................................................................................................................................... 90
Recommendations ................................................................................................................................ 90
Future Work .............................................................................................................................................. 93
Appendix A: Sampling and Weighting ................................................................................................ 94
ZIP code sampling ............................................................................................................................... 94
Initial Enumeration and Sampling of Buildings with RTUs .......................................................... 94
Execution of the Telephone Survey ................................................................................................... 95
Case Weights......................................................................................................................................... 96
Appendix B: Building Staff Interview ................................................................................................... 98
Appendix C: Literature Review ........................................................................................................... 100
Appendix D: In Depth Site Assessment Form ................................................................................... 103
Appendix E: Monitored Site Details .................................................................................................... 105
Site: DAV ............................................................................................................................................ 105
Site: CAP .............................................................................................................................................. 106
Site: SEW .............................................................................................................................................. 107
Site: NUR ............................................................................................................................................. 109
Site: TFB ............................................................................................................................................... 111
Site: ABS .............................................................................................................................................. 113
Site: CHO ............................................................................................................................................. 115
Site: OUT ............................................................................................................................................. 117
Site: CWC ............................................................................................................................................ 119

iii
List of Figures
Figure 1: Other interesting characteristics of the Minnesota commercial buildings served by RTUs. ............................................................................................................................................................ 2
Figure 2: Average cooling efficiency by cooling capacity. ................................................................... 3
Figure 3: Minnesota ZIP codes including our sampled set of 50. ....................................................... 9
Figure 4: Example aerial imagery of buildings with RTUs. ............................................................... 10
Figure 5: Two example ZIP codes with their corresponding placemarks showing the location of buildings with RTUs. ............................................................................................................................... 11
Figure 6: Age of buildings served by RTUs. ........................................................................................ 16
Figure 7: Total area of buildings served by RTUs. .............................................................................. 17
Figure 8: Portions of buildings served by RTUs. ................................................................................. 18
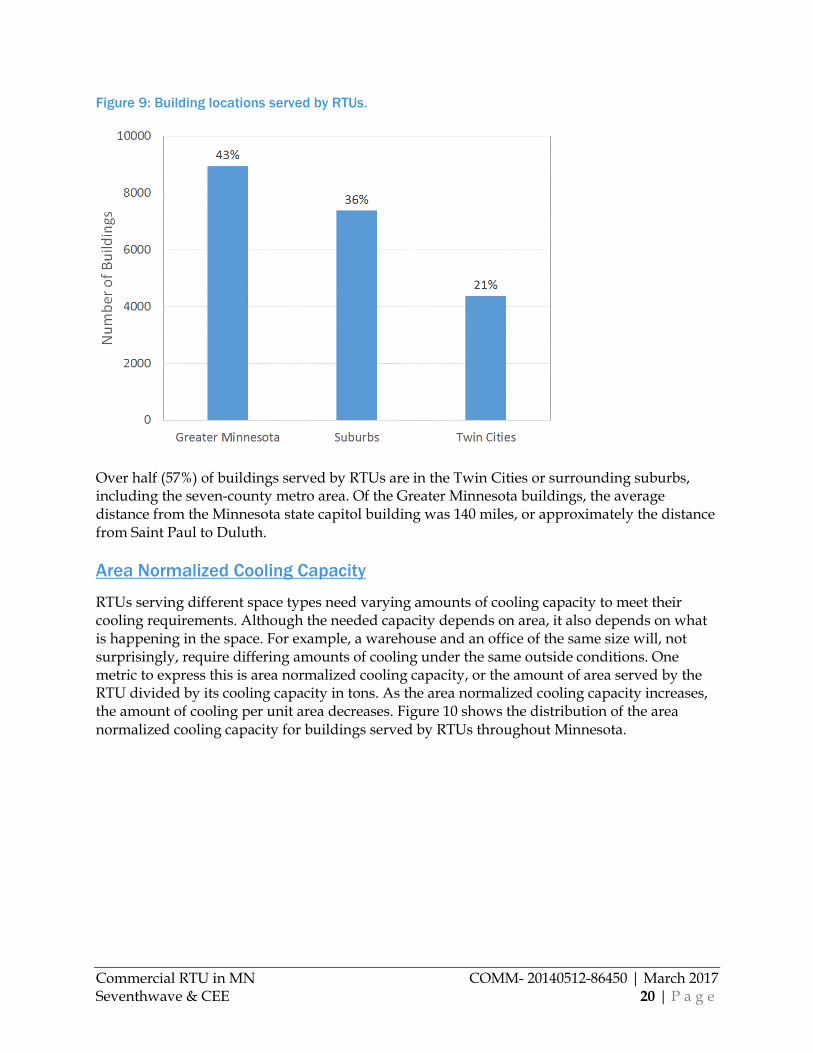
Figure 9: Building locations served by RTUs. ...................................................................................... 20
Figure 10: Area normalized cooling capacity for buildings served by RTUs. ................................. 21
Figure 11: Ownership structure for buildings served by RTUs. ....................................................... 22
Figure 12: Number of tenants for buildings served by RTUs. ........................................................... 23
Figure 13: Weekly occupied hours for buildings served by RTUs.................................................... 23
Figure 14: Occupant density for buildings served by RTUs. ............................................................. 24
Figure 15: Maintenance approaches for buildings served by RTUs. ................................................ 25
Figure 16: Summer and winter startup practiced by buildings served by RTUs. .......................... 26
Figure 17: Annual frequency of air filter replacement and compressor cleaning. .......................... 27
Figure 18: Comfort complaints in buildings served by RTUs. .......................................................... 28
Figure 19: Age of RTUs. .......................................................................................................................... 30
Figure 20: Dependence of RTU age on building age........................................................................... 31
Figure 21: Full load cooling efficiency of RTUs. .................................................................................. 32
Figure 22: Average full load cooling efficiency by RTU age. ............................................................. 33
Figure 23: Average cooling efficiency by cooling capacity. ............................................................... 34
Figure 24: Portion with part load cooling efficiency by RTU age. .................................................... 35
Figure 25: Part load cooling efficiency of RTUs. .................................................................................. 36
Figure 26: Supply fan power normalized by supply airflow rate. .................................................... 39
Figure 27: Portion of RTUs with R-410A refrigerant by RTU age. .................................................... 40

iv
Figure 28: Mix of new construction and renovation activity in Minnesota by building type square footage........................................................................................................................................... 42
Figure 29: Flow Patterns for Condenser Fan ........................................................................................ 45
Figure 30: Monitoring System Configuration ...................................................................................... 47
Figure 31: Typical gas consumption configuration ............................................................................ 48
Figure 32: Typical electric consumption monitoring installation ..................................................... 49
Figure 33: Electric Model ....................................................................................................................... 52
Figure 34: Gas Model .............................................................................................................................. 53
Figure 35: Unit Sizing with building load ............................................................................................ 55
Figure 36: Map of all potential sites for in-depth visits ...................................................................... 56
Figure 37: Indication of Area served by RTU size .............................................................................. 58
Figure 38: RTU Condition Assessment for In-depth Sites.................................................................. 60
Figure 39: RTU Condition vs Age ......................................................................................................... 61
Figure 40: Economizer Manufacturer and typical models ................................................................ 62
Figure 41: Minimum Outside Air Settings ........................................................................................... 63
Figure 42: Ideal Gas Consumption Model ........................................................................................... 67
Figure 43: Non-typical Gas Consumption Model #1 ......................................................................... 68
Figure 44: Non-typical Gas Consumption Model #2 ......................................................................... 69
Figure 45: Non-Typical Gas Consumption Model #3 ........................................................................ 70
Figure 46: Ideal Electric Consumption Model .................................................................................... 75
Figure 47: Non-typical Electric Consumption Example #1 ............................................................... 76
Figure 48: Non-typical Electrical Consumption Example #2 ........................................................... 77
Figure 49: Electric Model Change Point Temperatures ..................................................................... 78
Figure 50: Measured Outside Air Temperatures ................................................................................. 82
Figure 51: Annual Gas Consumption as Function of Sizing ............................................................. 84
Figure 52: Annual Electric Consumption as a Function of Sizing.................................................... 84
Figure 53: In Depth Site Assessment Form, Page 1 ........................................................................... 103
Figure 54: In Depth Site Assessment Form, Page 2 ........................................................................... 104
Figure 55: Site DAV Roof Image .......................................................................................................... 106
Figure 56: Site CAP Roof Image .......................................................................................................... 107

v
Figure 57: Site SEW Roof Image .......................................................................................................... 108
Figure 58: Site NUR Roof Image ......................................................................................................... 110
Figure 59: Site TFB Roof Image ........................................................................................................... 112
Figure 60: Site ABS Roof Image ........................................................................................................... 114
Figure 61: Site CHO Roof Image ......................................................................................................... 116
Figure 62: Site OUT Roof Image.......................................................................................................... 118
Figure 63: Site CWC Roof Image ......................................................................................................... 120

vi
List of Tables
Table 1: RTU cooling efficiency for existing RTUs and code-required values. ................................. 4
Table 2: Building characteristics collected. ........................................................................................... 12
Table 3: RTU characteristics collected. .................................................................................................. 12
Table 4: Market characteristics collected. ............................................................................................. 14
Table 5: Building types served by RTUs. .............................................................................................. 18
Table 6: Maintenance level descriptions. .............................................................................................. 25
Table 7: Buildings with RTUs serving single versus multiple zones. ............................................... 29
Table 8: Manufacturers of RTUs. ........................................................................................................... 29
Table 9: Cooling capacity of RTUs. ........................................................................................................ 31
Table 10: Number of compressors of existing RTUs. .......................................................................... 36
Table 11: Heating capacity of RTUs. ...................................................................................................... 37
Table 12: Fan power of RTUs. ................................................................................................................ 38
Table 13: Fan speed of RTUs................................................................................................................... 38
Table 14: Refrigerants of RTUs. .............................................................................................................. 40
Table 15: Data Description ..................................................................................................................... 50
Table 16: Design conditions for Minneapolis ....................................................................................... 55
Table 17: In-depth Site Characteristics .................................................................................................. 57
Table 18: Distribution of Thermostat Types ......................................................................................... 64
Table 19: Data Capture Rates ................................................................................................................. 65
Table 20: Heating Fit Parameters ........................................................................................................... 70
Table 21: RTU Annual Gas Consumption ........................................................................................... 72
Table 22: RTU Heating Consumption Compared to Total Site ........................................................ 74
Table 23: RTU Annual Electric Consumption ...................................................................................... 79
Table 24: RTU Electric Consumption Compared to Total Site ......................................................... 81
Table 25: Sizing Evaluation .................................................................................................................... 82
Table 26: RTU efficiency options. .......................................................................................................... 89
Table 27: Examples of RTU programs outside of Minnesota ............................................................. 91
Table 28: Site DAV RTU Information .................................................................................................. 105
Table 29: Site DAV Thermostat Settings ............................................................................................. 105

vii
Table 30: Site CAP RTU Information .................................................................................................. 106
Table 31: Site CAP Thermostat Settings ............................................................................................. 106
Table 32: Site SEW RTU Information ................................................................................................. 107
Table 33: Site SEW Thermostat Settings ............................................................................................. 108
Table 34: Site NUR RTU Information ................................................................................................. 109
Table 35: Site NUR Thermostat Settings ............................................................................................ 109
Table 36: Site TFB RTU Information ................................................................................................... 111
Table 37: Site TFB Thermostat Settings .............................................................................................. 112
Table 38: Site ABS RTU Information .................................................................................................. 113
Table 39: Site ABS Thermostat Settings ............................................................................................. 113
Table 40: Site CHO RTU Information ................................................................................................. 115
Table 41: Site CHO Thermostat Settings ............................................................................................ 115
Table 42: Site OUT RTU Information ................................................................................................. 117
Table 43: Site OUT Thermostat Settings ............................................................................................ 117
Table 44: Site CWC RTU Information ................................................................................................ 119
Table 45: Site CWC Thermostat Settings ........................................................................................... 119

viii
[This page intentionally left blank]

Commercial RTU in MN COMM- 20140512-86450 | March 2017 Seventhwave & CEE 1 | P a g e
Executive Summary
Objective
Packaged roof-top units (RTUs) are ubiquitous on commercial buildings throughout the United States because of their low capital cost, reliability and well-developed service and distribution network. There is anecdotal evidence, however, that these systems tend to operate inefficiently and sub-optimally. To validate or refute this evidence, we conducted a multi-level field study to characterize the RTUs in Minnesota. The objective of this study is to characterize the existing RTUs and the new/replacement market as well as monitor existing RTU energy performance. This characterization and associated monitored data can be used to inform the improvement or development of utility conservation improvement programs (CIPs) whose goal is to reduce the energy consumption of new and existing RTUs.
Methodology
The first stage of this project, conducted by Seventhwave, was to characterize the existing RTUs and the new/replacement market. Our methodology for collecting and analyzing building and existing RTU characteristics followed these steps:
1. Develop sample set of Minnesota ZIP codes 2. Identify all buildings with RTUs in each sampled ZIP code 3. Find contact information on a subset of these buildings 4. Conduct phone interviews with a subset of buildings with contact information 5. Analyze data: extrapolate characterization to Minnesota
We collected building-level and existing RTU data for each of the 101 surveyed buildings. Finally, we analyzed the new and replacement market for RTUs in Minnesota including annual shipments, annual sales, as well as their corresponding efficiency levels and refrigerant type.
The second stage of this project, conducted by the Center for Energy and Environment, was to monitor existing RTU energy performance. We recruited buildings for RTU monitoring from those identified in the characterization study. Twenty building managers/owners agreed to have their RTUs assessed as part of an in-depth site visit aimed at identifying RTUs that could be monitored for a six- to nine-month period. A total of 93 RTUs were assessed and of those, 52 were monitored. The collection of monitored data at these sites focused on the electric and gas consumption to allow for model development to report RTU annual energy consumption.
In addition to the annual consumption analysis, we also assessed RTU sizing using the monitored data at each test site. Once the consumption was determined and the models were developed, the required heating and cooling loads at design temperatures could be calculated and compared to the installed capacity of each RTU. The monitored consumption data contributed to a better understanding of actual RTU loading.

Commercial RTU in MN COMM- 20140512-86450 | March 2017 Seventhwave & CEE 2 | P a g e
Results
Following are results of our analysis of existing RTUs and the market for new and replacement RTUs.
Existing RTUs
Our analysis concludes that there are currently 20,700 statewide buildings with RTUs, with a 95 percent confidence interval of ± 3,100 buildings. We estimate that approximately 80% of these commercial buildings or 730 million square feet are served by RTUs. Nearly a third (30%) of these buildings are relatively new, having been built since the turn of the century. Smaller buildings (those less than 50,000 square feet) dominate the total number of buildings, comprising 78% by number of buildings. However, larger buildings (those greater than 50,000 square feet) dominate the total area of buildings, comprising 70% by area. The majority of buildings that have RTUs do not have significant secondary HVAC systems, but are served entirely by RTUs. Over half (57%) of buildings served by RTUs are in the Twin Cities or surrounding suburbs, including the seven-county metro area. Of the buildings in Greater Minnesota, the average distance from the Minnesota state capitol building was 140 miles, or approximately the distance from Saint Paul to Duluth.
The building types with the highest population are office, food service, food sales, and public order and safety. Combined these building types comprise over half (51%) of the buildings with RTUs in Minnesota. However, in terms of area served by RTUs, food service, food sales and public order and safety represent a much smaller portion due to their relatively small average area served by RTUs.
Other interesting characteristics of the Minnesota commercial buildings served by RTUs are summarized in Figure 1.
Figure 1: Other interesting characteristics of the Minnesota commercial buildings served by RTUs.

Commercial RTU in MN COMM- 20140512-86450 | March 2017 Seventhwave & CEE 3 | P a g e
We estimated a total of 136,000 ± 30,000 existing RTUs in the state. On average, there are between 6 and 7 RTUs per commercial building that is served by RTUs. Three manufacturers (Carrier, Lennox and Trane) account for approximately three-quarters (75%) of the RTUs in Minnesota and over half (52%) of the installed capacity. The average age of an existing RTU in
Minnesota is 13.1 years. Newer RTUs, those that are less than 5 years old, comprise 11% of existing RTUs while only 7% of existing RTUs are older than the Minnesota Technical Reference Manual’s [1] (TRM) value of 20 years for estimated useful life.
The total estimated cooling capacity of RTUs in Minnesota is approximately 1.3 million tons with an average cooling capacity of 10.7 tons per RTU. Slightly more than half (52%) of the individual RTUs have a cooling capacity of less than 5.4 tons. While the median cooling capacity of RTUs is 5 tons, RTUs with cooling capacities over 20 tons comprise 45% of the cooling capacity of all RTUs.
Over half (56%) of RTUs had full load cooling efficiencies between 9 and 11 EER. The average full load cooling efficiency of RTUs in Minnesota is 10.6 EER. The average cooling efficiency of existing RTUs has increased by 18% over the past 20 years. For new construction or renovation projects, the Minnesota energy code requires a minimum level of cooling efficiency for RTUs. The requirement varies by cooling capacity range. It is therefore interesting to compare the average cooling efficiency within each of these cooling capacity ranges. Figure 2 illustrates the cooling-capacity weighted average cooling efficiency by cooling capacity.
Figure 2: Average cooling efficiency by cooling capacity.
[1] State of Minnesota Technical Reference Manual for Energy Conservation Improvement Programs, Version 2.0, 2017, https://energy.mo.gov/docs/default-source/energy_division/state-of-minnesota-technical-reference-manual.pdf?sfvrsn=2

Commercial RTU in MN COMM- 20140512-86450 | March 2017 Seventhwave & CEE 4 | P a g e
The average existing RTU cooling efficiencies are plotted as bars, while the range of cooling efficiency between the current Minnesota energy code [2] and the Consortium for Energy Efficiency’s (CEE) Tier 2 [3] recommendations are also shown to illustrate the potential programmatic savings magnitude. For RTUs with cooling capacities below 20 tons, the average existing efficiency is below the code-minimum and well-below the CEE Tier 2 recommendation suggesting that there is considerable opportunity for improved efficiency in smaller RTUs. For larger RTUs with cooling capacities between 20 and 63.3 tons, the average existing efficiency is between the code-minimum requirement and below the CEE Tier 2 recommendation. This suggests that there is a limited opportunity for increasing efficiency for RTUs in this capacity range, as their efficiency is already relatively high. For RTUs with cooling capacities above 63.3 tons, the average existing efficiency is near the CEE Tier 2 recommendation leaving little opportunity for increased efficiency. For historical context, Table 1 outlines the average existing RTU cooling efficiency as well as the code-required minimum cooling efficiencies across the previous four ASHRAE 90.1 building energy codes. [4]
Table 1: RTU cooling efficiency for existing RTUs and code-required values.
Cooling Capacity (ton) 90.1-2004 90.1-2007 90.1-2010 90.1-2013 Existing
< 5.4 12 13 13 14 12.9
5.4 to 11.3 10.1 11 11 11 10.2
11.3 to 20.0 9.5 10.8 10.8 10.8 10.6
20.0 to 63.3 9.3 9.8 9.8 9.8 10.1
> 63.3 9 9.5 9.5 9.5 10.1
Note that a large increase in the minimum efficiencies occurred between 2004 and 2007, with only one increase in the smallest capacity RTUs since.
The current trend in increasing RTU performance is with respect to part load cooling efficiency, rather than full load cooling efficiency. We calculate that 35% of RTUs in Minnesota have some level of part load efficiency. The proportion of RTUs with part load efficiency has been growing steadily over the past 20 years. Half (50%) of RTUs with part load cooling efficiencies had an Integrated Energy Efficiency Ratio (IEER) between 10 and 12. For existing RTUs in Minnesota with part load cooling efficiencies, the average IEER is 11.2.
The total estimated heating capacity of RTUs in Minnesota is approximately 23.8 million MBH with an average heating capacity of 205 MBH per RTU. Nearly three-fourths (72%) of individual RTUs have a heating capacity less than 225 MBH. However, RTUs with heating
[2] ASHRAE 90.1-2010, Table 6.8.1A
[3] CEE 2016. High Efficiency Commercial Air-conditioning and Heat Pumps Initiative. Consortium for Energy Efficiency. 2016.
[4] The stated code efficiencies are for RTUs with gas-fired heating.

Commercial RTU in MN COMM- 20140512-86450 | March 2017 Seventhwave & CEE 5 | P a g e
capacities over 225 MBH comprise 58% of the heating capacity of all RTUs. We found that the heating fuel type of Minnesota RTUs is overwhelmingly (97%) natural gas. The remainder use electric resistance heating. The average heating efficiency of natural gas fired RTUs in Minnesota is essentially the code-minimum required value across all capacities of approximately 80%. We did not find any high efficiency condensing RTUs as they are a relatively new (but growing) technology, indicating an opportunity for programmatic intervention.
Fan power is a large component of a RTU’s energy consumption. The total estimated fan power of RTUs in Minnesota is approximately 389 thousand horsepower with an average of 3.3 horsepower per RTU. Fan motors of less than 3 motor horsepower are used on more than two-thirds (69%) of RTUs in Minnesota. However, larger fans with more than 3 motor horsepower comprise nearly three-quarters (73%) of fan power used by RTUs. Single speed fans are used on four-fifths (81%) of RTUs in Minnesota, representing 56% of total RTU fan power. A large and growing proportion of RTUs use variable speed fans, comprising 42% of fan power.
Another important characteristic of RTUs is the refrigerant they use. R-22 is used in over three-fourths (79%) of RTUs, comprising 55% of RTU cooling capacity. This indicates that larger RTUs are more likely to use R-410A. Increasingly, RTUs are using R-410A with over two-thirds (69%) of RTUs less than 5 years of age utilizing it; this trend can be attributed to the phasing out of R-22 refrigerants per the 1989 Montreal Protocol
For those buildings that had more than one RTU per building, nearly two-thirds (62%) of the buildings had RTUs from multiple manufacturers.
New and Replacement RTUs
We estimate that a total of 6,400 RTUs are shipped to commercial buildings in Minnesota annually. Of these, 40% or 2,600 RTUs are for new construction projects, while 60% or 3,800 are for existing retrofits or replacements. We estimate that the total sales of RTUs in Minnesota is
$88 million annually. Of these, 3,500 shipments are for code-compliant RTUs, while 2,900 shipments are for high performance RTUs. These levels of shipments represent $41 million and $47 million in sales for code-compliant and high performance RTUs, respectively.
Monitoring
Monitored RTUs showed a wide variety of consumption patterns across the different building types and RTU size ranges. Due to issues with data collection, consumption models could not be generated for all 52 monitored RTUs. Both gas and electric models that were developed, give an accurate representation of the consumption at the site but the results are difficult to extrapolate to the larger population due to the small sample set and limited systems monitored.
An innovative approach was used to analyze the oversizing issue with the monitored data to show the actual use of RTUs as a function of the outside weather and the space needs. Analysis showed that heating is more often oversized than cooling with a correlation in oversizing as a function of annual energy use. The greater the annual energy use the closer the RTU is right sized to the heating and cooling requirements of the space.

Commercial RTU in MN COMM- 20140512-86450 | March 2017 Seventhwave & CEE 6 | P a g e
We also extrapolated potential savings from upgrading existing RTUs in Minnesota to high performance models. The result of this analysis was a predicted electricity savings of 1,183 million kWh (4,037 million kBtu) and natural gas savings of 28 million therms (2,839 million kBtu) in Minnesota. This equates to $142 million in cost savings for Minnesota businesses.
CIP Recommendations
Increasing the efficiency of RTUs has been a target of energy efficiency programs for many years because of the large penetration of RTUs in the HVAC market. As RTU manufacturers develop increasingly complex functionality that can drive higher levels of efficiency, programs would benefit from reflecting those changes. Expanding the Minnesota Technical Reference Manual (TRM) to include a wider scope of RTU-related measures will aid in the development of more comprehensive RTU programs. Other efficiency options that are now available and could be added to a comprehensive RTU program include:
Demand control ventilation: reducing ventilation during unoccupied periods by using carbon dioxide or occupancy sensors thereby saving the energy needed to heat or cool the outside air.
Improved economizers: ensuring that the outdoor air dampers do not let in unconditioned air when closed. Also ensuring that the economizer is working properly through advanced fault detection.
Casing insulation: properly insulating the RTU casing reduces heating and cooling loads to the building.
Efficient supply fan: increased supply fan efficiency through improved blade design. Also direct drive motors reduce frictional losses as compared to belt driven fans, increasing overall fan system efficiency.
Condensing gas-fired heat exchanger: capturing the latent heat in the combustion exhaust increases the heating efficiency of gas-fired RTUs to 90-95%.
Energy recovery ventilation: utilizing a sensible or latent heat exchanger to recover energy from the exhaust air stream to preheat incoming ventilation air.
Evaporative cooling retrofit packages: adding evaporative cooling kits to existing RTUs to increase cooling efficiency by allowing condensing temperatures to approach outside air wet-bulb temperature as opposed to dry-bulb temperature.
Increasingly sophisticated and intelligent controls: adding controls capable of precisely controlling RTU operation to optimize energy performance, as well as detect faults and alert maintenance staff to address degraded performance quickly.
The main barrier to incorporating these technologies and capturing their savings is capital cost. Utility programs address this barrier through rebates to defer a portion of the incremental cost of higher efficiency units. Historically, these rebates have been based on exceeding a minimum full load efficiency. For utility programs whose priority is peak demand reduction, providing incentives for full load efficiency make sense. However, since the trend in efficiency for RTUs is increasing part load efficiency, developing rebates based on the Integrated Energy Efficiency Ratio (IEER) would be beneficial for utility programs whose priority is annual energy savings.
Additional insights we gathered from our manufacturer interviews include:
Commercial RTU in MN COMM- 20140512-86450 | March 2017 Seventhwave & CEE 7 | P a g e
Recast rebates in units that are more understandable to program participants and easier to incorporate into budgets, such as basing them on square footage rather than RTU cooling capacity (i.e. dollars per ton).
Reduce transactional costs of participating in programs by replacing lengthy paperwork with online, simple interactions.
Stabilize incentives so they do not change frequently or run out as this kind of volatility confuses program participants and trade allies and undermines confidence in the program.
Educate trade allies such as manufacturers and distributors about utility programs and provide them with simple tools and calculators to support incorporation of programs into their sales process.
Require a minimal level of commissioning since RTU performance often falls short of expectations without that important step.
Ensure proper RTU installation to achieve expected levels of performance. The Air Conditioning Contractors of America have developed guidance for proper installation. [5] This standard also includes recommendations for owner training, which is important for ensuring persistence in high levels of energy performance and savings.
[5] ACCA Standard 5, 2010, Air Conditioning Contractors of America

Commercial RTU in MN COMM- 20140512-86450 | March 2017 Seventhwave & CEE 8 | P a g e
Introduction
Background and Objective
Heating, Ventilation and Air-Conditioning (HVAC) energy consumption comprises just over 30% of US commercial building energy costs. [6] Within this considerable footprint, packaged roof-top units (RTUs) serve nearly half of Minnesota’s commercial floor area. [7] RTUs are ubiquitous on commercial buildings throughout the U.S. because of their low capital cost, reliability and well-developed service and distribution network. There is anecdotal evidence, however, that these systems tend to operate inefficiently and sub-optimally. To validate or refute this evidence, we conducted a multi-level field study to characterize the RTUs in Minnesota. The results of this study may be used to improve or develop utility conservation improvement programs (CIPs) whose goal is to reduce the energy consumption of new and existing RTUs.
To begin a characterization study, it is important to clearly define what is being characterized. For the purposes of this study we define RTUs as a forced-air HVAC system that packages the evaporator, condenser coils and heating coils into a single unit that sits on the roof of a commercial building and serves the buildings heating, cooling and ventilation loads.
[6] US Department of Energy, “Buildings Energy Data Book: 2015 Commercial Energy End-Use Expenditure Splits, by Fuel Type.” Accessed March 3, 2016. (http://buildingsdatabook.eren.doe.gov/TableView.aspx?table=3.3.5)
[7] 2012 CBECS Table B41, Cooling equipment, floorspace, 2012. Accessed March 3, 2016. (https://www.eia.gov/consumption/commercial/data/2012/)

Commercial RTU in MN COMM- 20140512-86450 | March 2017 Seventhwave & CEE 9 | P a g e
Characterizing Rooftop Units
Following is a discussion of the methodology we used to characterize RTUs in Minnesota.
Methodology for Characterizing Existing RTUs
Our methodology for collecting and analyzing building and existing RTU characteristics is discussed in more detail in Appendix A: Sampling and Weighting. In general, it followed these steps:
1. Develop sample set of Minnesota ZIP codes 2. Identify all buildings in each sampled ZIP code with RTUs 3. Find contact information on a subset of these buildings 4. Conduct phone interviews with a subset of buildings with contact information 5. Analyze data: extrapolate characterization to Minnesota
We began by using U.S. Census Bureau data to randomly sample 50 of the 936 total Minnesota ZIP codes. Our sampled ZIP codes ranged in size, density and geographic location and are highlighted in red in Figure 3.
Figure 3: Minnesota ZIP codes including our sampled set of 50.
The yellow dots represent the 101 buildings where we conducted interviews with facility staff (step 4 above), and are discussed in more detail subsequently. For each of these 50 ZIP codes, we then used public aerial imagery (such as Google Earth and Bing Maps) to systematically search for all of the commercial buildings with RTUs within a given ZIP code. For each of the

Commercial RTU in MN COMM- 20140512-86450 | March 2017 Seventhwave & CEE 10 | P a g e
buildings where we identified RTUs, we counted the number of apparent RTUs and gave the building an identification code and associated placemark. Figure 4 illustrates the aerial imagery of two example buildings with RTUs.
Figure 4: Example aerial imagery of buildings with RTUs.
We were careful not to count equipment on rooftops that looked like RTUs but were not. For air handling units, mechanical penthouses and split systems this was relatively straightforward. Other questionable units were flagged and an audit of all flags was conducted by an experienced mechanical engineer to make the final determination of whether the unit was actually an RTU. However, due to the nature of remote data collection, we occasionally mistakenly counted things that were not in fact RTUs, such as heating-only or make-up air units. We took steps to address these potential non-RTUs in our estimates as discussed in more detail in Appendix A: Sampling and Weighting. We also did not count RTUs that served non-commercial facilities such as multifamily buildings.
As mentioned previously, we endeavored to find and count every RTU by searching across the entire geographic extent of each ZIP code as defined by the U.S. Government – Postal Code Boundaries layer within Google Earth. To systematically cover a ZIP code (and not miss portions of it), we used guiding gridlines to section off manageable sections of a given ZIP code. Each subsection was searched thoroughly before moving on to the next section. Two fully enumerated ZIP codes and their corresponding placemarks are illustrated in Figure 5.

Commercial RTU in MN COMM- 20140512-86450 | March 2017 Seventhwave & CEE 11 | P a g e
Figure 5: Two example ZIP codes with their corresponding placemarks showing the location of
buildings with RTUs.
The enumeration process identified a total of 4,508 buildings across the 50 ZIP codes, with an initial count of 28,946 RTUs. An average of 90 buildings with RTUs were identified per ZIP code, but this ranged from as few as 2 in rural ZIP codes to more than 300 in urban ZIP codes. For a portion of the buildings from this sample, we then identified the contact information of a subsample of 1,842 buildings from across all our 50 sampled ZIP codes.
Using this contact information, we reached out to each building and attempted to connect with someone who would be able to provide us with pertinent building and RTU data. To increase our response rate, we first sent out a letter introducing the project with a notification that we would be following up with a call within the next few days. We offered a $50 gift certificate to interviewees who provided data. We completed 101 interviews resulting in a response rate of approximately 6%, represented as the yellow dots in Figure 3. However, respondents for five of these buildings provided information that allowed us to determine that the buildings did not in fact have any RTUs. These buildings were dropped from the analysis (except for the purpose of determining the ratio of actual RTUs to imagery-determined RTUs, which we used for estimating the total number of RTUs in the state). In addition, nine respondents did not provide sufficient information to determine if they actually had any RTUs: these buildings were dropped from the study entirely.
This left a total of 87 respondents, of which 81 provided information about the building and the RTUs associated with the building. Six respondents could provide information about the building only, and were not able to provide details about their RTUs. For these buildings, we included the data about the building, but not their RTUs.
The specific building-level data that we collected is outlined in Table 2.

Commercial RTU in MN COMM- 20140512-86450 | March 2017 Seventhwave & CEE 12 | P a g e
Table 2: Building characteristics collected.
Building Characteristics
Building age
Total area
Area served by RTUs
Type of commercial activity
Building location
Area normalized cooling capacity
Ownership structure
Number of tenants
Occupancy schedule
Occupant density
Maintenance practices and schedule
Occupant complaints
Number of zones served
Additionally, we gathered utility bill information to support the monitoring task efforts to be outlined in the project’s Final Report. For each interview, we also attained the make and model of the RTUs that served the building. This information was then used in conjunction with manufacturer specifications to collect the data for each RTU outlined in Table 3.
Table 3: RTU characteristics collected.
RTU Characteristics
Manufacturer
RTU age
Cooling type
Cooling capacity
Cooling efficiency, full load
Cooling efficiency, part load (if applicable)
Compressor type
Number of compressors
Heating type
Heating capacity
Heating efficiency
Fan speed
Fan power
Supply airflow
Refrigerant
Homogeneity of multiple RTUs
Data Accuracy
Data accuracy is important to ensure that results are admissible for utility program design, calculations, and evaluation. As mentioned previously, our first level of quality control involved developing a process to identify and count RTUs, which included the following steps:

Commercial RTU in MN COMM- 20140512-86450 | March 2017 Seventhwave & CEE 13 | P a g e
Researchers were trained on how to identify RTUs (and rooftop equipment that were not RTUs) from aerial imagery.
Any questionable units were flagged and subsequently reviewed by an experienced mechanical engineer.
Guiding grids were laid out across ZIP codes to ensure a thorough review of the ZIP code.
Audits of preliminary, example ZIP codes identified gaps and pointed to ways of improving data gathering accuracy.
To minimize self-selection sampling bias when calling our building contacts, we made three attempts to contact a small set of sampled buildings before moving on to another set of buildings. However, some sampling bias may persist as buildings with more sophisticated maintenance staff may have been more likely to respond and provide accurate information.
Once data was in hand, our quality control checks for data accuracy included high level tabulations to identify and address:
Significant gaps in data
Number of reported RTUs that differed significantly from the number we counted from aerial imagery
Building areas as compared to rough estimates gleaned from aerial imagery
Cooling capacity normalized per area that were outside of reasonable engineering judgment for a given building type
Make and model numbers that were clearly not RTUs (i.e. split systems or heating only units)
Fan power normalized by supply flow rate that were outside of reasonable engineering judgment
Reasonable part load efficiencies as compared to full load efficiency
We also performed a sanity check on our estimates and either corrected issues that were identified or developed reasonable explanations for them. These sanity checks included:
Buildings with RTUs in Minnesota compared to Commercial Building Energy Consumption Survey (CBECS) estimates as proportion of total building population
Average estimated RTUs per building
Number of shipped RTUs as a percentage of existing RTUs as compared to percentage of new construction floor area reported by the U.S. Energy Information Administration (EIA); also percentage converted to estimated life of RTU compared to the Minnesota TRM value for RTU estimated useful life
Once a quality data set was established we applied weighting factors to scale our characterization to represent Minnesota as a whole. The weighting factor development is discussed in more detail in Appendix A: Sampling and Weighting.

Commercial RTU in MN COMM- 20140512-86450 | March 2017 Seventhwave & CEE 14 | P a g e
Methodology for Characterizing the New and Replacement
RTU Market
To understand the new and replacement RTU market characteristics, we interviewed 4 representatives of major RTU manufacturers representing 72% of the installed cooling capacity in Minnesota to inform our assumptions as well as gather information on market trends. The specific questions we asked are outlined below:
1. What are the energy efficient features of your RTUs? 2. What do you perceive to be the barriers to higher adoption of more energy efficient
RTUs? 3. In your opinion, what factors lead to poor RTU energy performance? 4. In your opinion, what factors lead to high RTU energy performance? 5. Are utility efficiency programs effective at increasing the adoption of more energy
efficient RTUs? 6. Do you have any feedback as to how to improve utility efficiency programs with respect
to RTUs? 7. In your opinion, what is the approximate proportion of RTUs sales for new construction
and replacement, respectively? 8. In your opinion, what is the approximate proportion of RTUs sales that are minimally
code compliant versus high performance? 9. Any other thoughts?
Additionally, we looked at sales and shipment data to round out our analysis. The market characteristics that we analyzed are listed in Table 4.
Table 4: Market characteristics collected.
Market Characteristics
Annual shipments
Annual sales
Efficiency level
Refrigerant type
To estimate the number of annual shipments of RTUs for Minnesota, we first obtained Air-Conditioning, Heating, and Refrigeration Institute data for the total number of U.S. shipments. [8] This data included not only shipments outside of Minnesota, but also information pertaining to residential and commercial split systems. Using EIA Residential Energy Consumption Survey and Commercial Building Energy Consumption Survey data, we could split out just the commercial RTU shipments. Finally, we used the ratio of Minnesota population to U.S. population to estimate the proportion of shipments of RTUs to Minnesota.
At this point, we had an estimate for the total number of RTU shipments to Minnesota. We were then able to differentiate between those destined for new buildings versus replacements of
[8] Central Air Conditioners and Air-Source Heat Pumps, AHRI. Accessed March 3, 2017. (http://www.ahrinet.org/site/496/Resources/Statistics/Historical-Data/Central-Air-Conditioners-and-Air-Source-Heat-Pumps)

Commercial RTU in MN COMM- 20140512-86450 | March 2017 Seventhwave & CEE 15 | P a g e
existing RTUs based on responses from our interviews with manufacturers. On average, manufacturers reported that 40% of their shipments were for new buildings and 60% for replacements. [9]
Once we estimated the annual RTUs shipments, we analyzed the total sales of RTUs within Minnesota. We began this process by using RS Means [10] to determine an average equipment cost across a range of RTU types and capacities. RS Means provides this data as U.S. averages, but also includes factors for interpreting those averages for different locations to account for varying costs of labor and equipment. We therefore normalized our cost estimates to Minnesota, as well as extrapolated it to the present. From our analysis, we determined that a reasonable capital cost for a code-compliant RTU in Minnesota is approximately $1100/ton. We additionally estimate that an average high performance RTU in Minnesota costs approximately $1500/ton. Note that this does not include sales tax or installation costs, but simply represents the cost of the RTU equipment itself. Further note that there is a wide range of RTU costs based on the application, efficiency level and accessories among other factors. We then scaled this to Minnesota using the average capacity per RTU from our existing RTU characterization via:
𝑀𝑁 𝐴𝑛𝑛𝑢𝑎𝑙 𝑆𝑎𝑙𝑒𝑠 = 𝐴𝑣𝑒𝑟𝑎𝑔𝑒 𝐶𝑎𝑝𝑎𝑐𝑖𝑡𝑦 𝑝𝑒𝑟 𝑅𝑇𝑈 ×
(𝐶𝑜𝑑𝑒 𝐶𝑜𝑚𝑝𝑙𝑖𝑎𝑛𝑡 𝑆ℎ𝑖𝑝𝑚𝑒𝑛𝑡𝑠 × $1100 𝑝𝑒𝑟 𝑡𝑜𝑛 +
𝐻𝑖𝑔ℎ 𝑃𝑒𝑟𝑓𝑜𝑟𝑚𝑎𝑛𝑐𝑒 𝑆ℎ𝑖𝑝𝑚𝑒𝑛𝑡𝑠 × $1500 𝑝𝑒𝑟 𝑡𝑜𝑛)
To better understand the varying efficiency levels of new and replacement RTUs, we used data from our interviews with manufacturers. From these interviews, we knew a reasonable approximation of the proportion of new RTUs that simply met code-required minimum performance versus those that were high performance. On average, manufacturers reported that 55% of their shipments were code-compliant compared to 45% high performance.9 We used these proportions to approximate the annual shipments and sales of both code-compliant and high performance RTUs.
Information regarding refrigerant types in new and replacement RTUs was compiled from data gathered on the newest existing RTUs, as well as from secondary literature.
Results
As a result of our analysis, we can characterize the buildings served by RTUs in Minnesota, existing RTUs and the market for new and replacement RTUs.
Building Characteristics
We estimate there are currently 20,700 statewide buildings with RTUs, with a 95 percent confidence interval of ± 3,100 buildings. We characterized several interesting aspects of buildings served by RTUs in Minnesota. The most relevant characteristics are detailed in this section.
[9] Note that there was relatively close agreement between the manufacturer responses.
[10] RSMeans. 2010. Mechanical Cost Data. R.S. Means Company, Rockland, MA.

Commercial RTU in MN COMM- 20140512-86450 | March 2017 Seventhwave & CEE 16 | P a g e
Building Age
One interesting aspect of these buildings is their age. Figure 6 shows the distribution of the age of buildings served by RTUs throughout Minnesota.
Figure 6: Age of buildings served by RTUs.
Nearly a third (30%) of buildings are relatively new, having been built since the turn of the century. However, buildings fall into each decade in significant numbers going back as far as the 1950s. Interestingly, the oldest building in our sample was built in 1881.
Building Area and Portion Served by RTUs
Another building characteristic of interest is the building area. Figure 7 shows the distribution of the total area of buildings served by RTUs throughout Minnesota.

Commercial RTU in MN COMM- 20140512-86450 | March 2017 Seventhwave & CEE 17 | P a g e
Figure 7: Total area of buildings served by RTUs.
Smaller buildings (those less than 50,000 square feet) dominate the total number of buildings, comprising 78% of all buildings. However, larger buildings (those greater than 50,000 square feet) dominate the total area of buildings, comprising 70% of total square feet. We were able to estimate the portion of each building that was (and conversely was not) served by RTUs from building imagery and secondary HVAC systems reported during the interviews. Based on these proportions, we estimate that of the 900 million square feet of total area in commercial buildings that have RTUs, approximately 80% or 730 million square feet are served by RTUs. The remainder of these buildings are served by another HVAC system type, or none at all. Figure 8 shows the distribution of the portion of buildings served by RTUs throughout Minnesota.

Commercial RTU in MN COMM- 20140512-86450 | March 2017 Seventhwave & CEE 18 | P a g e
Figure 8: Portions of buildings served by RTUs.
The majority (87%) of buildings that have RTUs do not have significant secondary HVAC systems, but are served entirely by RTUs. Examples of buildings that weren’t entirely served by RTUs were:
Hotels with RTUs serving the common areas, but not the hotel rooms
Warehouses with small offices served by a residential system
Schools with RTUs only serving the pool or an addition
Religious worship buildings
Building Type
The primary business of the type of building the RTU is serving significantly affects its energy consumption, as buildings with higher internal loads such as healthcare require different amounts of HVAC energy than more sparsely loaded buildings such as warehouses. Table 5 shows the distribution of the building types served by RTUs throughout Minnesota, in descending order of number of buildings.
Table 5: Building types served by RTUs.
Building Type Number of Buildings
RTU Area (millions of square feet)
Office 3692 17.8% 170.8 23.4%
Food Service 2644 12.8% 23.0 3.2%
Food Sales 2359 11.4% 50.9 7.0%

Commercial RTU in MN COMM- 20140512-86450 | March 2017 Seventhwave & CEE 19 | P a g e
Building Type Number of Buildings
RTU Area (millions of square feet)
Public Order and Safety 1869 9.0% 25.5 3.5%
Mercantile (Enclosed and Strip Malls) 1619 7.8% 67.5 9.2%
Religious Worship 1590 7.7% 28.3 3.9%
Education 1453 7.0% 100.2 13.7%
Other 1207 5.8% 23.1 3.2%
Warehouse and Storage 994 4.8% 99.3 13.6%
Public Assembly 929 4.5% 58.7 8.0%
Mercantile (Retail Other Than Mall) 848 4.1% 38.1 5.2%
Lodging 483 2.3% 18.1 2.5%
Health Care (Inpatient) 450 2.2% 10.3 1.4%
Health Care (Outpatient) 368 1.8% 15.2 2.1%
Service 195 0.9% 1.4 0.2%
The building types with the highest number of buildings are office, food service, food sales, and public order and safety. Combined these buildings types comprise over half (51%) of the buildings with RTUs in Minnesota. However, in terms of area served by RTUs, food service, food sales and public order and safety are a much smaller portion due to their relatively small average area. However, warehouse and education increase their share due to their higher average area.
Building Location
When planning energy efficiency programs, it is useful to know where the technology of interest is located. We therefore categorized the buildings served by RTUs by their location: the Twin Cities, the surrounding suburbs, or Greater Minnesota. Figure 9 shows the distribution of the building locations served by RTUs throughout Minnesota.
Commercial RTU in MN COMM- 20140512-86450 | March 2017 Seventhwave & CEE 20 | P a g e
Figure 9: Building locations served by RTUs.
Over half (57%) of buildings served by RTUs are in the Twin Cities or surrounding suburbs, including the seven-county metro area. Of the Greater Minnesota buildings, the average distance from the Minnesota state capitol building was 140 miles, or approximately the distance from Saint Paul to Duluth.
Area Normalized Cooling Capacity
RTUs serving different space types need varying amounts of cooling capacity to meet their cooling requirements. Although the needed capacity depends on area, it also depends on what is happening in the space. For example, a warehouse and an office of the same size will, not surprisingly, require differing amounts of cooling under the same outside conditions. One metric to express this is area normalized cooling capacity, or the amount of area served by the RTU divided by its cooling capacity in tons. As the area normalized cooling capacity increases, the amount of cooling per unit area decreases. Figure 10 shows the distribution of the area normalized cooling capacity for buildings served by RTUs throughout Minnesota.

Commercial RTU in MN COMM- 20140512-86450 | March 2017 Seventhwave & CEE 21 | P a g e
Figure 10: Area normalized cooling capacity for buildings served by RTUs.
Because of data gaps, our sample size for this metric (along with several subsequent metrics) was less than our full estimate for number of buildings in Minnesota served by RTUs. The average area normalized cooling capacity for RTUs in Minnesota is 488 square feet per ton. Typically, commercial buildings fall between 250 to 750 square feet per ton, and the same is true with our Minnesota estimates as over 80% fall within this range.
Ownership Structure
Different ownership structures may influence the decisions that affect RTU performance. For instance, people that own their buildings as well as those that manage a publicly-held building may have more motivation to invest in energy efficiency than those that lease their space. They may evaluate investments on a longer time horizon and may directly see the benefits of improved energy performance in terms of reduced energy costs. Decision makers in leased buildings on the other hand may be less motivated to invest in energy efficiency measures because they may not see the benefit of reduced energy costs if they are not paying their own utility bills. Figure 11 shows the distribution of ownership structures for buildings served by RTUs throughout Minnesota.

Commercial RTU in MN COMM- 20140512-86450 | March 2017 Seventhwave & CEE 22 | P a g e
Figure 11: Ownership structure for buildings served by RTUs.
Over four-fifths (83%) of commercial buildings served by RTUs in Minnesota are owner occupied or public. Chain stores are an interesting ownership structure in that they may have more sophisticated facility staff. However, they often have approved designs with associated bureaucratic hurdles to overcome for CIPs to influence efficiency decisions.
Number of Tenants
Many buildings have multiple associated businesses. As opposed to buildings with a single tenant, buildings with multiple tenants may be more difficult to approach programmatically, as they often require the additional step of connecting with the management organization. Figure 12 shows the distribution of number of tenants for buildings served by RTUs throughout Minnesota.

Commercial RTU in MN COMM- 20140512-86450 | March 2017 Seventhwave & CEE 23 | P a g e
Figure 12: Number of tenants for buildings served by RTUs.
Over two-thirds (68%) of the buildings served by RTUs in Minnesota have a single tenant. The remainder tended to be malls, strip malls or multi-tenant office buildings.
Occupied Hours
Figure 13: Weekly occupied hours for buildings served by RTUs.

Commercial RTU in MN COMM- 20140512-86450 | March 2017 Seventhwave & CEE 24 | P a g e
The hours of occupancy affect the RTU energy consumption: longer hours of operation require the RTU to work harder to maintain temperature and humidity setpoints. Figure 13 shows the distribution of weekly occupied hours for buildings served by RTUs throughout Minnesota.
Approximately two-thirds (67%) of buildings with RTUs had occupied hours exceeding what would be considered a standard work week. The buildings with standard occupied hours (40 to 60 per week) were dominated by offices, but the other building types were also well-represented. Buildings with expanded occupied hours (61 to 167 per week) were those that were open on the weekends or had multiple shifts. This category was predominantly education, food service, retail and public assembly. Buildings that were open continuously had a significant proportion of food sales, health care and lodging.
Occupant Density
Occupant density also drives RTU energy requirements as buildings with high occupant density will need additional cooling to meet the increased load. Additionally, higher ventilation requirements will increase fan energy, as well as heating and cooling energy needed to temper the unconditioned outdoor air. Figure 14 shows the distribution of occupant density for buildings served by RTUs throughout Minnesota.
Figure 14: Occupant density for buildings served by RTUs.
Nearly two-thirds (64%) of buildings had relatively low occupant densities of between 0 and 5 people per 1000 square feet. Put another way, the median occupancy density of this range is 2.5 people per 1000 square feet. By inverting this number, it becomes 400 square feet per person or the equivalent of each person having an average of 20 feet by 20 feet of space around them. These buildings were mostly office, retail and warehouse. Buildings with occupant densities higher than 20 people per 1000 square feet (approximately 7 feet by 7 feet of space) tended to be

Commercial RTU in MN COMM- 20140512-86450 | March 2017 Seventhwave & CEE 25 | P a g e
food service. The buildings with 5 to 20 people per 1000 square feet had a diverse mix of commercial building types.
Maintenance
The frequency and level of RTU maintenance affects energy consumption. Table 6 outlines the various levels of maintenance that building staff reported.
Table 6: Maintenance level descriptions.
Level of Maintenance Preventative Maintenance Repairs
Low Minimal to none As needed by vendor
Low/Medium Occasionally by owner As needed by vendor
Medium Varying by owner As needed by owner
Medium/High Frequent by vendor As needed by owner or vendor
High Frequent by vendor As needed by vendor
Figure 15 shows the distribution of maintenance levels for buildings served by RTUs throughout Minnesota.
Figure 15: Maintenance approaches for buildings served by RTUs.
Most buildings served by RTUs in Minnesota use contracted vendors for their maintenance service. Although this is likely the highest level of maintenance, program opportunities for

Commercial RTU in MN COMM- 20140512-86450 | March 2017 Seventhwave & CEE 26 | P a g e
improvement exist through training of trade allies regarding proper maintenance techniques. The greatest opportunity for improved maintenance (Low and Low/Medium) comprise 15% of buildings. In these buildings, and in some buildings with a medium level of maintenance, it is likely that little to no maintenance of RTUs is being conducted.
Summer and winter startup are routine maintenance practices typically involving changing filters, cleaning coils and other basic checks to ensure the RTU is working properly. We additionally asked whether summer or winter startup was practiced annually. Figure 16 shows the portion of buildings served by RTUs throughout Minnesota that practice summer and winter startup.
Figure 16: Summer and winter startup practiced by buildings served by RTUs.
Over three-quarters (77%) of buildings practiced both summer and winter startup, but over one-fifth (21%) did neither.
We also asked about the frequency with which filters were changed and compressors were cleaned. Figure 17 shows the annual frequency of maintenance for buildings served by RTUs throughout Minnesota that change air filters and clean compressors.

Commercial RTU in MN COMM- 20140512-86450 | March 2017 Seventhwave & CEE 27 | P a g e
Figure 17: Annual frequency of air filter replacement and compressor cleaning.
The best practice for replacing air filters is to track the pressure drop across the filter and replace the filter when the pressure drop exceeds some threshold when it becomes too dirty. A more common recommendation is that air filters be changed on a quarterly basis or four times each year. Nearly half (46%) of buildings had their air filters changed at this level of frequency or above. In some cases, higher frequency was driven by site-specific needs such as very dusty adjacent parking lots. Compressors were less likely to be cleaned on a frequent basis with over one-third (34%) never being cleaned or only being cleaned as needed.
The following are other maintenance practices outside of the ones outlined previously, as well as the numbers of times they were reported during our 101 interviews.
Inspect belts and bearings; lubricate (10)
Inspect indoor and outdoor coils; clean (7)
Inspect drain (2)
Inspect economizer (2)
Check pressures and fan speeds (2)
Check for voltage imbalances (1)
Conduct amperage checks (1)
Occupant Complaints
During our interviews, we asked if occupants reported any noise or thermal comfort issues. The overwhelming majority (92%) of buildings with RTUs in Minnesota do not experience noise concerns. In the few cases that noise complaints did occur, it was usually related to older units that were in need of replacement or repair.
A much more sizable portion of building occupants reported thermal comfort issues. Figure 18 illustrates the portion of buildings in which occupants reported comfort issues.

Commercial RTU in MN COMM- 20140512-86450 | March 2017 Seventhwave & CEE 28 | P a g e
Figure 18: Comfort complaints in buildings served by RTUs.
Over one-third (36%) of buildings served by RTUs in Minnesota experience occupant comfort complaints. The cause of these complaints fell into two categories; the RTUs were not properly maintaining temperature and/or humidity setpoints, or the occupants’ personal preferences diverged from the setpoints. In the second case, the RTUs were working properly. We are not able to ascertain the cause of a given complaint without further research. However, from the information the interviewee provided, we estimate that two-thirds of complaints were based on RTU performance while one-third were dependent on an occupant’s personal preferences. Some of the reasons given for why the RTU was unable to maintain setpoints include:
The system was broken and subsequently repaired
The system was undersized
Improper air distribution (multiple zones)
Someone remote to the building itself (headquarters of a retail chain) controlled the setpoints and did not take occupant feedback into consideration
Number of Zones Served
RTUs are typically meant to serve only a single zone or space with a single thermostat. However, in practice, they often serve multiple zones. This is usually driven by cost or logistical considerations. In situations where an RTU serves multiple zones of which only one zone has a thermostat, the zone with the thermostat receives the appropriate amount of heating or cooling. The RTU controller does not analyze how much heating or cooling the other zones require, resulting in occupant discomfort as the temperature of these secondary spaces rise or fall relative to setpoints. Table 7 shows the portion of buildings that have RTUs serving single versus multiple zones.

Commercial RTU in MN COMM- 20140512-86450 | March 2017 Seventhwave & CEE 29 | P a g e
Table 7: Buildings with RTUs serving single versus multiple zones.
Zones Served Number of Buildings
(thousands)
Single 9900 59.8%
Multiple 8061 40.2%
Approximately two-fifths (40%) of buildings have RTUs supply conditioning to multiple zones, increasing the frequency of occupant discomfort.
RTU Characteristics
Our analysis indicated a total of 136,000 ± 30,000 RTUs in the state. On average, there are between 6 and 7 RTUs per commercial building that is served by RTUs. We characterized several interesting aspects of existing RTU in Minnesota. Following is a discussion of the most relevant characteristics.
Manufacturer
There are several RTU manufacturers, each with their own models of RTUs and differentiating performance features. Table 8 shows the distribution of the manufacturers of existing RTUs throughout Minnesota.
Table 8: Manufacturers of RTUs.
Manufacturer Number of RTUs
(thousands) Cooling Capacity
(thousands of tons)
Carrier 35.1 29.0% 243.6 18.8%
Lennox 28.8 23.8% 195.1 15.0%
Trane 26.7 22.1% 236.3 18.2%
Bryant 10.3 8.5% 64.2 4.9%
AAON 7.4 6.1% 389.3 30.0%
York 6.8 5.6% 76.9 5.9%
McQuay 1.5 1.2% 63.9 4.9%
Other 4.3 3.6% 29.2 2.3%
Three manufacturers (Carrier, Lennox and Trane) account for approximately three-quarters (75%) of the RTUs in Minnesota and over half (52%) of the installed capacity. Although AAON

Commercial RTU in MN COMM- 20140512-86450 | March 2017 Seventhwave & CEE 30 | P a g e
has a relatively small share of the number of RTUs (6%), it is the largest manufacturer in terms of installed capacity (30%). The average AAON unit is larger than the average RTU in Minnesota.
RTU Age
The age of RTUs also has an impact on energy performance because newer RTUs may have higher efficiencies and system performance tends to degrade over time. Figure 19 shows the portion of existing RTUs falling into different age ranges.
Figure 19: Age of RTUs.
Note that it was increasingly difficult to find the age of older RTUs, meaning the accuracy of estimates becomes increasingly less precise as RTU age increases. The average age of an
existing RTU in Minnesota is 13.1 years. Newer RTUs, those that are less than 5 years old, comprise 11% of existing RTUs. Also, only 7% of existing RTUs are older than the Minnesota TRM’s value of 20 years for estimated useful life.
Since we collected both RTU age as well as the age of the building they serve, we can look at the relationship between them. Figure 20 shows the average age of RTUs for ranges of building age.

Commercial RTU in MN COMM- 20140512-86450 | March 2017 Seventhwave & CEE 31 | P a g e
Figure 20: Dependence of RTU age on building age.
For buildings less than 15 years old, the average RTU age was essentially in line with the building age. For buildings greater than 15 years old, the average RTU age held pretty constant around 15 years regardless of the age of the building. This is likely because the RTUs in older buildings have been replaced, bringing their average age in line with the typical lifetime of RTUs.
Cooling
The RTUs in this study were all cooled via a direct expansion process. None of the RTUs we characterized were water source or ground source heat pumps. The RTUs in Minnesota are overwhelmingly air cooled. Only 3 RTUs were identified as being evaporatively cooled: all of which had very large cooling capacities of 170 tons.
Another important characteristic of RTUs is their cooling capacity. Table 9 shows the distribution of cooling capacity of existing RTUs throughout Minnesota.
Table 9: Cooling capacity of RTUs.
Cooling Capacity (ton)
Number of RTUs (thousands)
Cooling Capacity (thousands of tons)
< 5.4 62.2 51.5% 242.8 18.7%
5.4 to 11.3 35.2 29.1% 299.5 23.1%
11.3 to 20.0 12.0 9.9% 175.5 13.5%

Commercial RTU in MN COMM- 20140512-86450 | March 2017 Seventhwave & CEE 32 | P a g e
Cooling Capacity (ton)
Number of RTUs (thousands)
Cooling Capacity (thousands of tons)
20.0 to 63.6 9.6 7.9% 286.6 22.1%
> 63.3 1.9 1.6% 294.0 22.6%
The total estimated cooling capacity of RTUs in Minnesota is approximately 1.3 million tons with an average cooling capacity of 10.7 tons per RTU. Slightly more than half (52%) of the individual RTUs have a cooling capacity of less than 5.4 ton. However, RTUs with cooling capacities over 20 ton comprise 45% of the cooling capacity of all RTUs.
The full load cooling efficiency is currently the major driver of how much electricity an RTU consumes. Figure 21 shows the portion of existing RTUs falling into different full load cooling efficiency ranges.
Figure 21: Full load cooling efficiency of RTUs.
Note that all stated efficiencies are nameplate efficiencies. For cooling capacities above 5.4 ton, the cooling efficiency is expressed as an Energy Efficiency Ratio (EER), while the cooling efficiency for capacities below 5.4 ton is expressed in Seasonal Energy Efficiency Ratio (SEER). RTUs with cooling efficiencies expressed in SEER were converted to EER for ease of comparison. The conversion is expressed as: [11]
𝐸𝐸𝑅 = 𝑆𝐸𝐸𝑅 ∙ 0.875
[11] Minnesota TRM, version 1.3, 2016, pg. 15

Commercial RTU in MN COMM- 20140512-86450 | March 2017 Seventhwave & CEE 33 | P a g e
Over half (56%) of RTUs had full load cooling efficiencies between 9 and 11 EER. The average full load cooling efficiency of RTUs in Minnesota is 10.6 EER.
Since we also collected information about the age of each RTU, we are able to look at the trend of cooling efficiency with respect to RTU age. Figure 22 shows cooling-capacity weighted average cooling efficiency by RTU age.
Figure 22: Average full load cooling efficiency by RTU age.
Note the clear trend of increasing cooling efficiency in newer RTUs. In fact, over the last 20 years, the average cooling efficiency of RTUs has increased by 18%.
For new construction or renovation projects, the Minnesota energy code requires a minimum level of cooling efficiency for RTUs. The requirement varies by cooling capacity range. It is therefore interesting to compare the average cooling efficiency within each of these cooling capacity ranges. Figure 23 illustrates the cooling-capacity weighted average cooling efficiency by cooling capacity.

Commercial RTU in MN COMM- 20140512-86450 | March 2017 Seventhwave & CEE 34 | P a g e
Figure 23: Average cooling efficiency by cooling capacity.
For cooling capacities above 5.4 ton, the cooling efficiency is expressed as EER, while the cooling efficiency for capacities below 5.4 ton is expressed as SEER. As opposed to previous graphs, the existing RTU data are plotted as bars. Additionally, the range of cooling efficiency between the current Minnesota energy code [12] and CEE’s Tier 2 [13] recommendations are also plotted to illustrate the potential programmatic savings magnitude. CEE’s Tier 1 efficiency recommendations are defined at a performance level corresponding to price points with significant sales volume. CEE’s Tier 2 is defined to provide significant, but achievable, savings above and beyond Tier 1.
In RTUs with cooling capacities below 20 tons, the average existing efficiency is below the code-minimum and well-below the CEE Tier 2 recommendation, suggesting considerable opportunity for improved efficiency in smaller RTUs. For larger RTUs with cooling capacities between 20 and 63.5 ton, the average existing efficiency is between the code-minimum requirement and below the CEE Tier 2 recommendation. Since their efficiency is already relatively high, there is a limited opportunity for increasing efficiency. For the largest capacity RTUs with cooling capacities above 63.3 ton, the average existing efficiency is near the CEE Tier 2 recommendation, leaving little opportunity for increased efficiency.
The current trend in increasing RTU performance is with respect to part load cooling efficiency, rather than full load cooling efficiency. For instance, variable speed compressors (often inverter-driven) allow for part-load efficiencies over 18 IEER. We calculate that 35% of existing RTUs in
[12] ASHRAE 90.1-2010, Table 6.8.1A
[13] CEE 2016. High Efficiency Commercial Air-conditioning and Heat Pumps Initiative. Consortium for Energy Efficiency. 2016.

Commercial RTU in MN COMM- 20140512-86450 | March 2017 Seventhwave & CEE 35 | P a g e
Minnesota have some level of part load cooling efficiency. Figure 24 shows the portion of RTUs that had some level of part load cooling efficiency by RTU age.
Figure 24: Portion with part load cooling efficiency by RTU age.
Note the trend of increasing portion of RTUs with part load cooling efficiency in RTUs from 20 years to 5 years old. The portion deceases in the RTUs less than 5 years of age, which may be attributable to the economic climate in Minnesota over that time period.
The part load cooling efficiency is increasingly important because of how much electricity an RTU consumes. Figure 25 shows the portion of existing RTUs with part load cooling efficiency falling into different ranges.

Commercial RTU in MN COMM- 20140512-86450 | March 2017 Seventhwave & CEE 36 | P a g e
Figure 25: Part load cooling efficiency of RTUs.
Approximately half (50%) of RTUs with part load cooling efficiencies had an IEER between 10 and 12. For existing RTUs in Minnesota with part load cooling efficiencies, the average IEER is 11.2.
Compressor
As scroll compressors have become increasingly popular over the past couple of decades, they have captured increasing shares of the RTU market. Today, nearly four-fifths (79%) of RTU compressors in Minnesota are scroll. The remaining are reciprocating, mostly legacy in the older RTUs. Table 10 shows the distribution of number of compressors of existing RTUs throughout Minnesota.
Table 10: Number of compressors of existing RTUs.
Number of Compressors
Number of RTUs (thousands)
Cooling Capacity (thousands of tons)
1 69.7 58.8% 309.6 30.4%
2 40.6 34.3% 474.9 46.6%
3 4.3 3.7% 91.0 8.9%
4 3.6 3.0% 122.9 12.1%
6 0.3 0.2% 19.7 1.9%

Commercial RTU in MN COMM- 20140512-86450 | March 2017 Seventhwave & CEE 37 | P a g e
The majority (93.1%) of existing RTUs have 1 or 2 compressors, but the number of compressors in larger RTUs is increasing. More recently, compressors are being added for improved humidity control.
Heating
We gathered information about the heating type of Minnesota RTUs and found that overwhelmingly (97%) they are natural gas fired. The remainder use electric resistance heating. As stated previously, we did not find any heat pump RTUs in the course of the study. The average heating efficiency of natural gas fired RTUs in Minnesota is essentially the code-minimum required value across all capacities of approximately 80%. We did not find any high efficiency condensing RTUs as they are a relatively new (but growing) technology, currently existing in such small numbers as to have a small likelihood to be randomly sampled. Since condensing RTUs can have heating efficiencies between 90% and 94%, [14] there is considerable room for natural gas savings in new and replacement RTUs from this technology.
Another important characteristic of RTUs is their heating capacity. Table 11 shows the distribution of the heating capacity of existing RTUs throughout Minnesota.
Table 11: Heating capacity of RTUs.
Heating Capacity (MBH)
Number of RTUs (thousands)
Heating Capacity (millions of MBH)
< 225 83.4 71.7% 10.1 42.2%
≥ 225 32.9 28.3% 13.8 57.8%
The total estimated heating capacity of RTUs in Minnesota is approximately 23.8 million MBH with an average heating capacity of 205 MBH per RTU. Nearly three-fourths (72%) of individual RTUs have a heating capacity less than 225 MBH. [15] However, RTUs with heating capacities over 225 MBH comprise 58% of the heating capacity of all RTUs.
Fans
Fan power is a large component of RTU energy consumption. Gathering accurate information about fan power proved particularly difficult. We looked at manufacturer specifications, only some of which contained any information about fan power. When available, the specifications often contained a range of potential fan powers. In these circumstances, we recorded the median value. While a more accurate approach would be to gather the mechanical design drawings to find the fan power on the RTU schedule, getting this information from building facility staff proved too difficult to rely on to complete our dataset. Table 12 shows the distribution of the fan power of existing RTUs throughout Minnesota.
[14] Nicor Gas Energy Efficiency Emerging Technology Program, 11/11/2013, pg 5
[15] The heating capacity thresholds were defined in agreement with the table defining RTU minimum heating efficiency from ASHRAE 90.1-2013.

Commercial RTU in MN COMM- 20140512-86450 | March 2017 Seventhwave & CEE 38 | P a g e
Table 12: Fan power of RTUs.
Fan power (motor hp) Number of RTUs
(thousands) Fan power (thousands
of motor hp)
fractional 39.3 33.0% 23.0 5.9%
1 to 1.5 14.5 12.2% 17.8 4.6%
1.5 to 2 4.6 3.8% 7.2 1.8%
2 to 3 24.0 20.1% 57.6 14.8%
3 to 5 20.9 17.5% 66.7 17.2%
5 to 7.5 7.1 6.0% 37.6 9.7%
7.5 to 10 3.8 3.2% 28.8 7.4%
>10 4.9 4.1% 149.9 38.6%
The total estimated fan power of RTUs in Minnesota is approximately 389 thousand horsepower with an average of 3.3 horsepower per RTU. Fan motors of less than 3 motor horsepower are used on more than two-thirds (69%) of RTUs in Minnesota. However, larger fans with motor horsepower greater than 3 comprise nearly three-quarters (73%) of fan power used by RTUs.
The fan speed is an important characteristic influencing how much fan energy an RTU consumes. Table 13 shows the distribution of the fan speed of existing RTUs throughout Minnesota.
Table 13: Fan speed of RTUs.
Fan speed Number of RTUs
(thousands) Fan power (thousands
of motor hp)
Single 97.5 80.9% 215.9 55.7%
Two 8.4 6.9% 8.0 2.1%
Multiple 1.3 1.1% 0.8 0.2%
Variable 13.4 11.1% 163.2 42.1%
Single speed fans are used on four-fifths (81%) of RTUs in Minnesota, representing 56% of total RTU fan power. A large and growing proportion of RTUs use variable speed fans, comprising 42% of fan power. The relatively large proportion of variable speed by fan power as opposed to number of RTUs is indicative of the higher incremental cost of variable speed being more justifiable in larger fans.

Commercial RTU in MN COMM- 20140512-86450 | March 2017 Seventhwave & CEE 39 | P a g e
Supply airflow is related to RTU fan energy in that the fan should be properly sized to effectively distribute the required air. Oversizing fans can result in increased energy consumption. Gathering accurate information about supply airflow proved particularly difficult. Like fan power, our approach looked at manufacturer specifications, only some of which contained any information about supply airflow. The supply airflow reported on manufacturer specifications does not account for the actual distribution system accompanying the RTU on a given project, and is therefore an approximation. A more accurate approach would be to gather the mechanical design drawings themselves on which the supply airflow is often called out on the RTU schedule. However, getting this information from building facility staff proved too difficult. Figure 26 shows the fan power normalized by supply airflow over a range of different airflows.
Figure 26: Supply fan power normalized by supply airflow rate.
The Minnesota energy code maximum [16] requirements are also illustrated for both constant speed (the predominant type) and variable speed fans. For all supply airflows, the fan power is below code-required maximum values, indicating that there is less program potential for increasing fan power efficiency on RTUs.
Refrigerant
Another important characteristic of RTUs is the refrigerant they use. Table 14 shows the distribution of refrigerants of existing RTUs throughout Minnesota.
[16] ASHRAE 90.1-2010, Table 6.5.3.1.1A

Commercial RTU in MN COMM- 20140512-86450 | March 2017 Seventhwave & CEE 40 | P a g e
Table 14: Refrigerants of RTUs.
Refrigerant Type Number of RTUs
(thousands) Cooling Capacity
(thousands of tons)
R-22 89.5 78.6% 654.3 55.3%
R-410A 24.3 21.4% 529.8 44.7%
Over three-fourths (79%) of existing RTUs use R-22 as their refrigerant. A smaller proportion (55%) of RTU capacity uses R-22, indicating that larger RTUs are more likely to utilize R-410A. As discussed in more detail in the New versus Replacement Market section, R-22 is being phased out as part of the 1989 Montreal Protocol. In fact, this treaty currently places restrictions on imports and production of R-22 at 10% of the 1989 baseline amount. The reason that R-22 still comprises such a large component of the RTU market is the long lifetime of RTUs relative to the restrictions themselves. However, over time R-410A will increase in proportion to R-22 as the restrictions cause newer RTUs to be predominantly R-410A. Figure 27 illustrates this, showing the percentage of RTUs using R-401A by RTU age.
Figure 27: Portion of RTUs with R-410A refrigerant by RTU age.
Note the increasing proportion of RTUs with R-410A. In RTUs less than 5 years of age, over two-thirds (69%) utilize R-410A.
Homogeneity
For those buildings that had more than one RTU per building, nearly two-thirds (62%) of the buildings had RTUs from multiple manufacturers. A significant number of buildings (38%) had

Commercial RTU in MN COMM- 20140512-86450 | March 2017 Seventhwave & CEE 41 | P a g e
RTUs that were all from a single manufacturer. However, none of these buildings had RTUs that were all the same model, typically with varying capacities and corresponding efficiencies.
New versus Replacement Market
We estimate that a total of 6,400 RTUs are shipped to commercial buildings in Minnesota annually. Of these, 40% or 2,600 RTUs are for new construction projects, while 60% or 3,800 are for existing retrofits or replacements. This estimate represents approximately 4.7% of our estimated existing RTUs. Another way to think of this percentage is that if 4.7% of the existing RTUs are replaced each year, then the average life of an RTU is approximately 21 years. This compares very well with the Minnesota TRM’s value for RTU estimated useful life of 20 years, [17] providing a higher level of confidence in both estimates. This sanity check gives an estimated average life of RTUs that is longer than our existing RTU estimate of 13.1 years. This is likely due to recent economic conditions resulting in fewer RTUs being replaced over the past few years. Another useful sanity check is to compare the percentage of the existing RTUs that are for new construction with typical rates of new construction square footage increases. Our estimate that 1.9% of shipments were for new construction buildings compares well with the estimates of new construction activity from the EIA. [18]
We estimate that the total sales of RTUs in Minnesota was $88 million annually, which is approximately 0.03% of Minnesota’s gross domestic product.
Using the proportions from our manufacturer interviews, we estimate that 3,500 shipments are for code-compliant RTUs, while 2,900 shipments are for high performance RTUs. These levels of shipments represent $41 million and $47 million in sales for code-compliant and high performance RTUs, respectively.
We also analyzed new construction data to ascertain what types of commercial buildings are being built in Minnesota that are likely to include RTUs. The analyzed dataset was obtained from ConstructionWire, [19] and represented over 90% of the new construction and renovation activity in Minnesota over the past 5 years. We determined the following mix of commercial buildings by square footage that were built or planned to be built in Minnesota from 2013 to 2016.
[17] State of Minnesota Technical Reference Manual for Energy Conservation Improvement Programs, Version 1.3, 2016. (http://mn.gov/commerce-stat/pdfs/trm-version-1.3.pdf)
[18] Buildings Energy Data Book, Chapter 3: Commercial Sector, “Commercial floor space and primary energy consumption grew by 58% and 69%, respectively, between 1980 and 2009.” This equates to an average annual growth of 1.9%. (http://buildingsdatabook.eren.doe.gov/ChapterIntro3.aspx)
[19] ConstructionWire. (http://www.constructionwire.com/)

Commercial RTU in MN COMM- 20140512-86450 | March 2017 Seventhwave & CEE 42 | P a g e
Figure 28: Mix of new construction and renovation activity in Minnesota by building type square
footage.
There is a clear trend of rapid growth in the lodging sector over the past several years, driven by multifamily, assisted living and hotels/motels. Although RTUs are not typically applied to multifamily buildings, opportunities are certainly available for efficiency programs to increase RTU efficiency on the other lodging building types. Two sectors with strong growth were health care and education, again both not traditionally known for using RTUs. However, RTUs do serve portions of each sector, and such institutions’ longer-term mindset suggest they may be more open to improved energy performance even if it means increased capital costs. Office spaces remain a large sector for growth, and with their high use of RTUs, remains a significant opportunity for programs. Warehouses round out the sectors with the most growth. Although a portion of warehouses are not typically conditioned, those warehouse spaces that are conditioned have high use of RTUs.
From our existing RTU data, we know the mix of refrigerants of the newest RTUs. In RTUs less than 5 years old, the market is 69% R-410A and 31% R-22. Going forward the R-22 portion will only decease as HCFCs like R-22 will be phased out based on the provisions of the 1989 Montreal Protocol. [20] By 2020 restrictions on imports and production of HCFCs will be limited to 0.5% of a 1989 baseline. Currently, these restrictions are at 10% of the 1989 baseline, meaning that limitations will increase another 20-fold over the next 4 years. Although the refrigerant may
[20] The Montreal Protocol on Substances that Deplete the Ozone Layer, UNEP Ozone Secretariat. (http://ozone.unep.org/en/treaties-and-decisions/montreal-protocol-substances-deplete-ozone-layer)

Commercial RTU in MN COMM- 20140512-86450 | March 2017 Seventhwave & CEE 43 | P a g e
still be used in existing RTUs, it will become increasingly difficult and expensive to recharge these systems.
Currently, the alternative for HCFCs are HFCs such as R-410A. However, these refrigerants are also being phased out, albeit on a less aggressive schedule according to the 2015 amendment to the Montreal Protocol. [21] Under this amendment, the phase out will occur in incremental steps, culminating in a goal of 10% of baseline by 2036.
The alternatives to HFCs are currently Hydro-fluoroolefins (HFOs), which are similar to HFCs but have significantly shorter atmospheric lifetimes (HFOs only take days to degrade when exposed to atmospheric conditions as opposed to decades for HFCs). This significantly decreases HFOs Global Warming Potential as compared to HFCs.
One drawback of HFOs is their mild flammability. They are now classified under a new ASHRAE flammability designation 2L or mildly flammable with low burning velocity. Although their risk of flammability is relatively low, there still exists additional safety requirements for working with them as opposed to existing refrigerants.
An additional drawback is that replacement refrigerants currently result in system efficiencies that in most cases are worse (in some cases equivalent, but rarely better) than if the system had used current refrigerants. Ongoing research is underway to improve alternatives in terms of their resulting system efficiency. [22] [,23]
[21] Summary: North American 2015 HFC Submission to the Montreal Protocol. (https://www.epa.gov/sites/production/files/2016-
01/documents/hfc_amendment_2015_summary.pdf)
[22] AHRI Low-GWP Alternative Refrigerants Evaluation Program. (http://www.ahrinet.org/site/514/Resources/Research/AHRI-Low-GWP-Alternative-Refrigerants-Evaluation)
[23] Skye, H., NIST Technical Note 1895, “Heat Pump Test Apparatus for the Evaluation of Low Global Warming Potential Refrigerants,” November 2015.

Commercial RTU in MN COMM- 20140512-86450 | March 2017 Seventhwave & CEE 44 | P a g e
Monitoring Rooftop Units
The monitoring stage of this research project was completed by the Center for Energy and Environment. We have extensive experience with RTUs and understand the complexity of RTU use in a wide variety of buildings and the technology needed to capture accurate data for the monitoring stage.
Methodology for Monitoring Rooftop Units
The goal of the monitoring phase was to document the annual consumption for a range of RTU sizes in a variety of business types. The monitored sites were selected from the 81 sites that participated in the characterization phase of this project. During the characterization phase, participants were asked additional questions to determine their interest in having the consumption of their RTUs monitored for a 6- to 9-month period. The only incentive offered was detailed information about their RTU’s performance provided at the end of the project. Sites that indicated interest were tagged in the database and evaluated for potential participation in the monitoring phase. The data from the larger characterization population was used to discover operational performance baseline data and gain insight into why systems were performing above or below expected consumption levels.
In-depth Site Visit
The initial step in the detailed monitoring process was an in-depth site visit. These visits were intended to gain more information about the building’s RTU use and validate the information collected over the phone during the characterization phase. Twenty sites (from an initial list of 43) were selected for an in-depth site visit to collect detailed information on the status of the RTUs. The initial list of 43 sites included the sites from the larger database that the characterization team identified as potential sites for consumption monitoring. The 20 sites ultimately selected are located across the State of Minnesota to represent the entire state, not just the Twin Cities metro area.
A data collection form was developed and used to assure consistency for the in-depth site visits. The form assessed both the building and the condition of the RTUs. Details about the RTU’s configuration were captured and analyzed for trends. Details such as control of the RTU, options installed on the RTU, and the distribution duct work that the RTU used for delivery of air were all documented. To understand the loading that the RTU served, details about the site were also documented including the type of space (office, warehouse, restaurant, etc.), number of people in space, type and location of thermostat or controlling device, and general building configuration. A sample of the form is included in Appendix D: In-Depth Site Assessment Form.
Each RTU was inspected for condition and its ability to perform as designed. Issues of maintenance or the lack of maintenance were assessed and documented. There were a number of observation-based tests that rated the condition of the RTU components to determine the likelihood that the RTU was maintained and operating as expected. These tests were more subjective than quantitative, given the time available to assess the individual systems. The components were evaluated on a scale from 1 to 5 with 1 being the lowest level and 5 being the

Commercial RTU in MN COMM- 20140512-86450 | March 2017 Seventhwave & CEE 45 | P a g e
best based on the observed condition and the functional performance. These values were aggregated for each site to estimate the relative condition of the site’s RTUs.
The RTU inspection was broken down by major RTU sections. Evaluations were performed on the cooling section (which included the compressors, condenser coil, and evaporator coil), supply fan, gas burner, and economizer (if one was installed). The evaluation documented the condition of each section and tested for each section’s function and performance whenever possible.
An example of a subjective test used to assess the RTU condition is the perceived air flow across the condenser. The test is performed on the condenser fan by assessing the evenness of the air flow across the area of the condenser fan. Discussions with HVAC technicians pointed to the potential for condenser fans to develop an annular flow pattern if the condenser coils are dirty and not flowing as designed. As a result of insufficient flow through the condenser, the flow pattern can develop a flow of air up from the edges of the fan and back down to the center of the fan. To evaluate the flow, the research technician performing the test passes their hand across the surface area of the condenser fan to assess the flow pattern. An example of the flow pattern is given in Figure 29.
Figure 29: Flow Patterns for Condenser Fan
One of the most important evaluations performed during the in-depth site visits was the assessment of the economizer. It is well documented that economizers on RTUs have an extremely high rate of failure and are often set up incorrectly. Often, either installing contractors incorrectly set economizer setpoints or the economizer simply isn’t commissioned to work correctly from the start. [24] Coupled with a high failure rate of the sensors used for economizer activation, this often results in mechanical cooling energy used when outside air conditions are such that should favor economizing.
[24] Cowen, A, New Buildings Institute, “Review of Recent Commercial Roof Top Unit Field Studies in the Pacific Northwest and California.” October 2004

Commercial RTU in MN COMM- 20140512-86450 | March 2017 Seventhwave & CEE 46 | P a g e
The testing procedure for the in-depth site visits attempted to assess the economizer’s condition. Advanced skills are needed to properly test the economizer’s condition and performance. The ideal person to do economizer testing is a HVAC technician with many years of experience as they would generally be familiar with the large number of economizer configurations that depend on the age and manufacturer. However, having a HVAC technician perform the testing was an unrealistic expectation for this research given the limited funds and the number of RTUs. A research technician with extensive experience with RTUs performed the testing using a simplified testing protocol to yield results that could give insight into the state of economizers across the small sample size.
There are several critical tests that help indicate if the economizer controls are in fact moving the outside air damper. These tests include turning off the RTU and observing if the economizer controller returned the outside air damper to a closed position from its minimum outside air setting. Another test adjusts the minimum outside air adjustment setting to determine if the outside air damper moved. When the results of these two tests show the damper moving, that indicates with some assurance that the economizer’s controller does control the damper, but not to what extent.
The final and most involved test that was used involves an ice pack on the outside air sensor of the economizer’s controller. The ice pack tricks the controller into thinking that the outside air is appropriate for free cooling. This test is only used when outside conditions are not ideal and there isn’t a way to get the economizer to activate. The ice pack test requires the thermostat for the RTU to call for cooling. The economizer is considered to be in good working order if the outside air dampers opened as a result of the ice pack on the sensor. The fact that they opened didn’t confirm the setpoint for the economizer, only that economizer did open as a result of these conditions being presented to the controller.
Monitoring of RTU Consumption
Data logging system
In the past, monitoring energy consumption of individual RTUs has been difficult due to the cost of the data logging systems required to capture the data. The goal of the project was to obtain the total energy use of individual RTUs including electrical consumption for air movement and cooling and gas consumption for heating. Traditionally, to measure the electrical consumption a power meter would be wired into the high voltage supply for the RTU, which requires a licensed electrician. For heating use, the gas consumption typically requires a utility grade gas meter that would have to be plumbed into the natural gas line, which would require a licensed plumber. To collect the information from these meters a data logger would either have to be deployed at each RTU or one logger with multiple channels would have to be used, which would require running sensor cabling across the roof. Both configurations require additional costs either from the multiple loggers or the increased labor costs for running sensor cabling across the roof. Since this was deemed cost prohibited with the volume of RTUs identified for testing, we elected to work with newer wireless technology to collect consumption data.
Based on our experience, we deployed a system that is capable of near-live data collection to assure that the data was collected timely and accurately. We selected an internet based logger that communicated via the cellular network and transferred data to our computers. This

Commercial RTU in MN COMM- 20140512-86450 | March 2017 Seventhwave & CEE 47 | P a g e
allowed us to review the data as it was collected, which assured that the logging system was operating as expected and that the data collected was valid. This feature became extremely valuable to the monitoring team given a number of logging issues that occurred during the data collection period.
A schematic of the wireless data logger system is displayed in Figure 30. The sensors communicated on a lower power, local communications network to a cellular gateway. The cellular gateway transferred the data from the site via the internet to a data collection server located at our office. Regular data checks were made on the data received from the field to assure that the sensors were collecting accurately and that there were no major lapses on the communication network.
Figure 30: Monitoring System Configuration
Consumption Sensors
Both RTU electric and gas consumption were monitored. The gas consumption was measured by the use of a pulse generator module that we developed to provide a one second pulse whenever there was a voltage applied to the circuit. The source of the voltage for the circuit was the 24 VAC control signal that activated the fixed input gas valve. The pulse generator was tied to a wireless pulse counter that accumulated the pulses and provided the length of time that the gas valve was activated. Gas consumption was computed using the known input rate for the gas burner and the time the gas valve was open. The pulse counter was set to capture all pulses and report the pulse count to the cellular gateway every 15 minutes.
Because RTUs are installed on the roof and exposed to extreme temperature swings, the pulse generator needed to be installed in the return air section of the RTU to assure that the circuit would perform as expected over the course of the project. Temperature extremes can affect the timing circuit used to develop the one second pulse; this required keeping the pulse generator at a relatively constant temperature to assure proper performance of the module. A typical installation of the pulse counter and pulse generator in the return air chamber of the RTU is
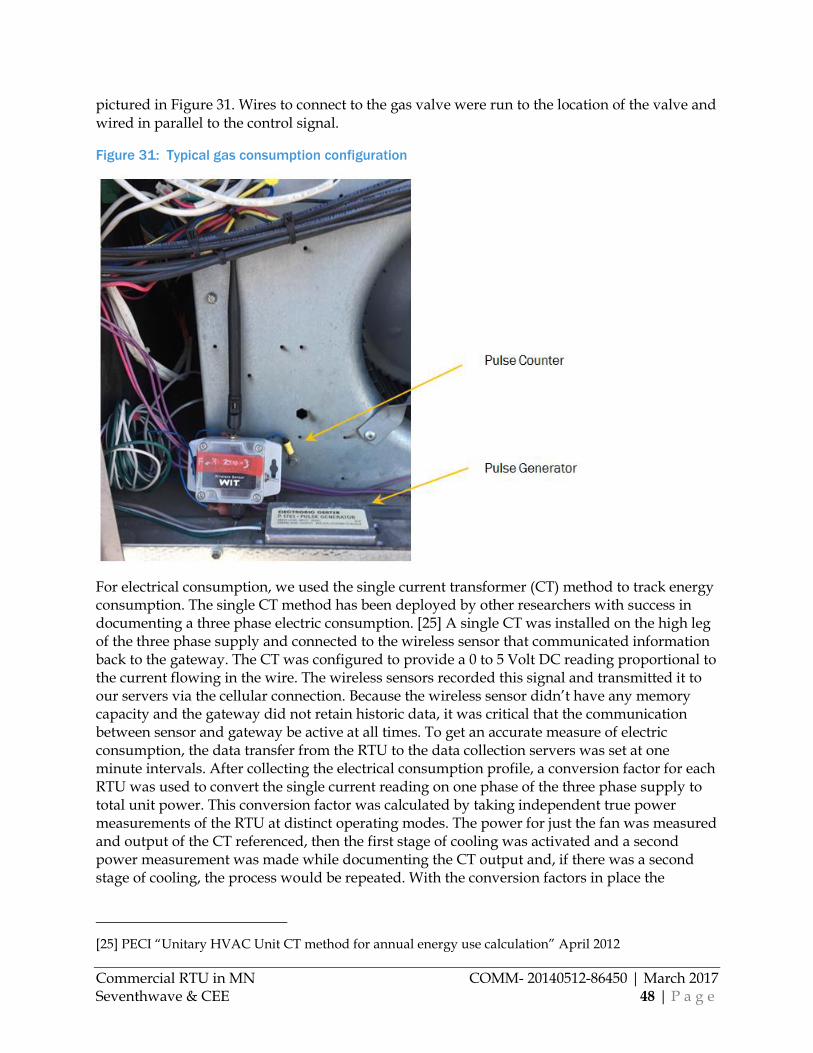
Commercial RTU in MN COMM- 20140512-86450 | March 2017 Seventhwave & CEE 48 | P a g e
pictured in Figure 31. Wires to connect to the gas valve were run to the location of the valve and wired in parallel to the control signal.
Figure 31: Typical gas consumption configuration
For electrical consumption, we used the single current transformer (CT) method to track energy consumption. The single CT method has been deployed by other researchers with success in documenting a three phase electric consumption. [25] A single CT was installed on the high leg of the three phase supply and connected to the wireless sensor that communicated information back to the gateway. The CT was configured to provide a 0 to 5 Volt DC reading proportional to the current flowing in the wire. The wireless sensors recorded this signal and transmitted it to our servers via the cellular connection. Because the wireless sensor didn’t have any memory capacity and the gateway did not retain historic data, it was critical that the communication between sensor and gateway be active at all times. To get an accurate measure of electric consumption, the data transfer from the RTU to the data collection servers was set at one minute intervals. After collecting the electrical consumption profile, a conversion factor for each RTU was used to convert the single current reading on one phase of the three phase supply to total unit power. This conversion factor was calculated by taking independent true power measurements of the RTU at distinct operating modes. The power for just the fan was measured and output of the CT referenced, then the first stage of cooling was activated and a second power measurement was made while documenting the CT output and, if there was a second stage of cooling, the process would be repeated. With the conversion factors in place the
[25] PECI “Unitary HVAC Unit CT method for annual energy use calculation” April 2012

Commercial RTU in MN COMM- 20140512-86450 | March 2017 Seventhwave & CEE 49 | P a g e
electrical power for the RTU could be measured across all operational modes. A picture of typical electric consumption sensors is given in Figure 32.
Figure 32: Typical electric consumption monitoring installation
No additional data was collected by the monitoring system. Outside air temperature was collected from the nearest National Oceanic and Atmospheric Administration (NOAA) weather station. The combination of the monitored data and the outside air data was used as the base for the evaluation of RTU consumption and to provide key indicators of performance or lack of performance.
Annual Energy Consumption
Model Specification
Based on the team’s extensive experience working with RTUs, outside air temperature was selected as the variable most likely to explain annual energy consumption due to its large effect on energy use. Outside air temperature was acquired from the nearest NOAA weather station, and the data was aggregated to the daily level with weekdays (Monday through Friday) separated from weekends (Saturday and Sunday) to account for variation in occupancy and temperature setpoints.
Gas and electric consumption was collected for each RTU at 15-minute and one-minute data intervals respectively. The data was then imported into the R statistical analysis software. R is a language and environment for statistical computing and graphics, and it was chosen for analysis due to its ability to quickly process large amounts of data. The data used in the analysis is summarized in Table 15.

Commercial RTU in MN COMM- 20140512-86450 | March 2017 Seventhwave & CEE 50 | P a g e
Table 15: Data Description
Measurement Value Interval
Heating Call Stage 1 accumulated seconds 15 minute totals
Heating Call Stage 2 accumulated seconds 15 minute totals
Current draw of RTU Instantaneous Amps one minute
Outdoor Air Temp Deg F hourly data
Several issues were identified during the project that required extensive data filtering to exclude days that did not have a significant amount of valid data. Data was filtered for days that were considered invalid. The criteria for data to be considered invalid are:
Days when an RTU had a known operational issue.
Days when an RTU was shut down due to operational issues or service being performed.
Days when a monitoring system or sensor had a known operational issue.
Days with unusual readings outside of reasonable range.
Days when a site had no tenant occupying the space.
Gas data was collected at 15-minute intervals that indicated total seconds of run time for the unit. The run time data was summed and converted to daily energy usage using Equation 1.
Equation 1: Gas Consumption Equation
𝐸 =(𝑇1 × 𝐶1 + 𝑇2 × 𝐶2) × 24
1,000 × 86,400
where:
E is the daily kBTU use,
𝑇1 is the stage 1 daily runtime in seconds,
𝑇2 is the stage 2 daily runtime in seconds,
𝐶1 is the stage 1 rated capacity in Btu per hour,
𝐶2 is the stage 2 rated capacity in Btu per hour,
24 is the number of hours per day,
1,000 is the number of Btu per kBTU, and
86,400 is the number of seconds per day.
Electric data was collected at one-minute intervals to represent the current draw of the RTU, which required a conversion to power. The data was imported into R, and a multiplier was applied to each data point based on the mode of operation. The multiplier represents a

Commercial RTU in MN COMM- 20140512-86450 | March 2017 Seventhwave & CEE 51 | P a g e
conversion from the value from the data logger (current) to a power reading in kW. After the multiplier was applied, the data was summed and converted to daily kWh totals. Equation 2 represents the calculation from one-minute current measurement to daily electric energy consumption.
Equation 2: Electric Consumption Equation
𝐸 = ∑(𝐴 ∗ 𝐶)/60
where:
E is the daily electric use in kWh,
A is the current reading for one minute,
C is the multiplier for conversion to power in kW, and
60 is the number of minutes in an hour.
Regression Analysis
After preparing the data for analysis we plotted daily energy use (kWh and kBTU) as a function of outside air temperature and fitted a regression to the data. Gas and electric data was plotted separately and each regression split out weekday and weekend use.
HVAC cooling data generally shows strong temperature dependence at warmer temperatures and constant response or subtle dependence at lower temperatures. Regression analyses often use piece-wise linear regressions (or change point model) to describe this model. A change point model selects a single temperature at which energy use depends on temperature changes and fits a linear regression to the data above and below that point.
All change point models were created using the piecewise linear function [26] in the R analysis software. This function creates a single change point and is consistent with the methodology used in ASHRAE 1050-RP, Development of a Toolkit for Calculating Linear, Change-point Linear and Multiple-Linear Inverse Building Energy Analysis Models. [27]
Figure 33 displays a typical change point model for the electric data, and Equation 3 represents the equation for the model both above and below the calculated change point.
[26] Package ‘SiZer’. (https://cran.r-project.org/web/packages/SiZer/SiZer.pdf)
[27] ASHRAE. Guideline 14-2002 Measurement of Energy and Demand Savings. Section 6.2 Retrofit Isolation Approach. Atlanta, GA. 2002, June 22.
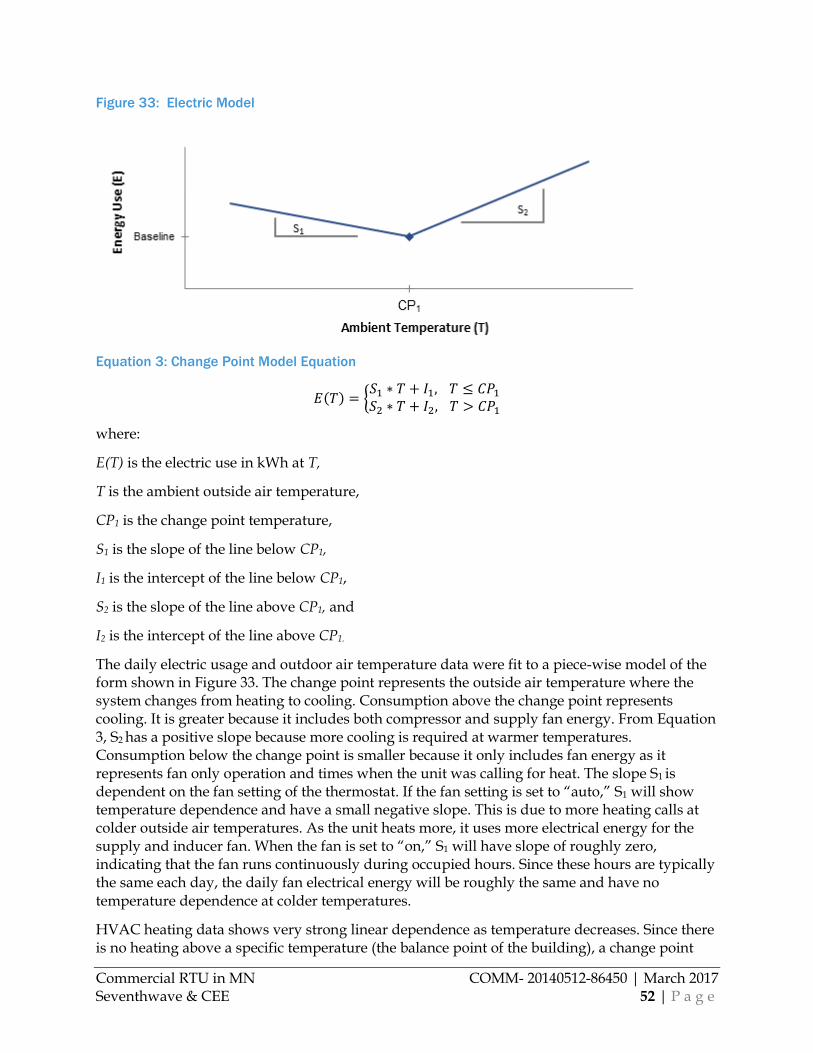
Commercial RTU in MN COMM- 20140512-86450 | March 2017 Seventhwave & CEE 52 | P a g e
Figure 33: Electric Model
Equation 3: Change Point Model Equation
𝐸(𝑇) = {𝑆1 ∗ 𝑇 + 𝐼1, 𝑇 ≤ 𝐶𝑃1
𝑆2 ∗ 𝑇 + 𝐼2, 𝑇 > 𝐶𝑃1
where:
E(T) is the electric use in kWh at T,
T is the ambient outside air temperature,
CP1 is the change point temperature,
S1 is the slope of the line below CP1,
I1 is the intercept of the line below CP1,
S2 is the slope of the line above CP1, and
I2 is the intercept of the line above CP1.
The daily electric usage and outdoor air temperature data were fit to a piece-wise model of the form shown in Figure 33. The change point represents the outside air temperature where the system changes from heating to cooling. Consumption above the change point represents cooling. It is greater because it includes both compressor and supply fan energy. From Equation 3, S2 has a positive slope because more cooling is required at warmer temperatures. Consumption below the change point is smaller because it only includes fan energy as it represents fan only operation and times when the unit was calling for heat. The slope S1 is dependent on the fan setting of the thermostat. If the fan setting is set to “auto,” S1 will show temperature dependence and have a small negative slope. This is due to more heating calls at colder outside air temperatures. As the unit heats more, it uses more electrical energy for the supply and inducer fan. When the fan is set to “on,” S1 will have slope of roughly zero, indicating that the fan runs continuously during occupied hours. Since these hours are typically the same each day, the daily fan electrical energy will be roughly the same and have no temperature dependence at colder temperatures.
HVAC heating data shows very strong linear dependence as temperature decreases. Since there is no heating above a specific temperature (the balance point of the building), a change point

Commercial RTU in MN COMM- 20140512-86450 | March 2017 Seventhwave & CEE 53 | P a g e
model is not necessary and a linear regression was chosen. The linear regression is represented by the model displayed Figure 34 and Equation 4.
Figure 34: Gas Model
Equation 4: Gas Equation Form
𝐸(𝑇) = 𝑆1 ∗ 𝑇 + 𝐼1
where:
E(T) is the electric use in kWh at T,
T is the ambient outside air temperature,
S1 is the slope of the line, and
I1 is the intercept of the line.
The gas consumption model for most of the RTUs showed strong correlation and produced good results for the analysis, but some had to be discarded. Individual RTU data sets were discarded for the following reasons:
Not enough valid data points available to create an acceptable regression.
Temperature range of available data too narrow to extrapolate to annual estimates.
Improper RTU or sensor operation.
Typical Weather Year Normalization
After regression models were completed for each unit, the units were normalized using NOAA Typical Meteorological Year (TMY3) data for the location nearest to the RTU to estimate energy use for a typical weather year. Separate regressions were created for occupied (weekday) and unoccupied (weekend) times. Energy use for each was estimated and summed to reach total annual use.

Commercial RTU in MN COMM- 20140512-86450 | March 2017 Seventhwave & CEE 54 | P a g e
For electric models with change point regressions, separate calculations were done above and below the change point and then summed to get total energy consumption.
Uncertainty Analysis
Regression analysis uncertainty can come from many sources, which can impact final energy use estimates. The primary two are measurement uncertainty and regression model uncertainty. Measurement uncertainty can be minimized by selecting monitoring equipment with an appropriate level of precision so that random measurement error is minimized.
The far more important of the two in this type of analysis is regression model uncertainty. This uncertainty is caused by the fact that not all of the energy use can be explained by the model, and it would occur even if the model were perfect. Variables such as occupancy, thermostat adjustments, the effect of other unmonitored units on the building, and inconsistent data all have an impact on the degree to which the model is able to describe the measured actual use. We chose a 95 percent confidence interval to measure the uncertainty surrounding the energy savings estimates.
Evaluation of RTU Sizing
An analysis of RTU sizing was performed using the consumption information from each RTU. Consumption, not RTU capacity, was chosen because summing cooling and heating capacity did not yield a representative evaluation given that many of the sites had varying space usage and represented different loading requirements. The measured consumption for each RTU gave a good indication of the space requirements and each RTU’s ability to meet the needs of the individual space.
Sizing analysis was considered to be more accurate using the monitored consumption data as opposed to using site specific building construction and internal load data. The consumption information showed the actual loading of the RTU to meet space requirements across all outside air temperatures. The traditional method of calculating heating and cooling load via the summation of internal gains and envelope losses with weather conditions was not used due to the limited information available at each site on components such as wall construction and insulation levels. The buildings monitored were older constructions and did not have detailed plans available.
To evaluate RTU sizing, 15-minute consumption data and outside air temperature were plotted against each other, and a change point model analysis was performed on the data set. The resulting models of 15-minute data were evaluated at the design temperatures for the Minneapolis area. The design temperatures per ASHRAE for heating and cooling are given in Table 16. The energy consumption of the RTUs was analyzed during maximum heating and maximum cooling outside air conditions to closely match the design conditions.

Commercial RTU in MN COMM- 20140512-86450 | March 2017 Seventhwave & CEE 55 | P a g e
Table 16: Design conditions for Minneapolis
Season Dry Bulb Temperature (F)
Mean Coincident Wet Bulb Temperature (F)
Heating -11.2 - - -
Cooling 90.9 72.9
Figure 35 shows the typical model for consumption of both heating and cooling energy. The 15-minute consumption models were developed during the weather periods that included as much warm weather and cool weather as experienced during the monitoring period. The regression of the data was used to determine the percent loading on the RTU when applying the design temperature data.
Figure 35: Unit Sizing with building load
Rated inputs were used as maximum values for capacity for heating and cooling. For the heating season, the rated input for the burner was used as the maximum heat content available to the RTU. With 15-minute data the percent loading for each 15-minute time period is expressed by Equation 5.
Equation 5: Percent Heating Capacity
𝐻𝑒𝑎𝑡𝑖𝑛𝑔 % 𝐶𝑎𝑝𝑎𝑐𝑖𝑡𝑦 = [(𝑃𝑢𝑙𝑠𝑒 𝑖𝑛 15 𝑚𝑖𝑛𝑢𝑡𝑒𝑠) ×𝐼𝑛𝑝𝑢𝑡 𝑅𝑎𝑡𝑒
3600] /[(𝐼𝑛𝑝𝑢𝑡 𝑅𝑎𝑡𝑒)/4]

Commercial RTU in MN COMM- 20140512-86450 | March 2017 Seventhwave & CEE 56 | P a g e
For the electric consumption, the maximum power was determined by the manufactures listed cooling capacity and the efficiency for the RTU expressed in energy efficiency ratio (EER). The average 15-minute power was compared to this maximum power consumption per Equation 6.
Equation 6: Percent Cooling Capacity
𝐶𝑜𝑜𝑙𝑖𝑛𝑔 % 𝐶𝑎𝑝𝑎𝑐𝑖𝑡𝑦 = [𝐴𝑣𝑒𝑟𝑎𝑔𝑒 𝑃𝑜𝑤𝑒𝑟 𝑖𝑛 15 𝑚𝑖𝑛𝑢𝑡𝑒𝑠]/[(𝐶𝑜𝑜𝑙𝑖𝑛𝑔 𝑡𝑜𝑛𝑠)/𝐸𝐸𝑅]
With the known regression models for heating and cooling, the sizing for each RTU for each space was documented and reported.
Results from Monitored RTUs
In-depth Site Visits
Data was collected at the in-depth site visits to understand the building and the RTUs used to meet the loads of the building. The building assessment was focused on the type of spaces within the buildings including the number of people, type of activity, and how the RTU is controlled for each area. Once information was documented on the space, detailed information was collected on the RTU including make, model, options, capacity, and location. There were also a number of more subjective tests used to evaluate each of the RTUs at the site. The objectives of the in-depth site visits were to validate the information collected during the phone interview phase of the characterization work, get experience with a wide variety of systems and building types, and arrive at a sub-sample of buildings that were the best sites to monitor RTU performance for the next phase of the project. The map on the left in Figure 36 shows the location of the 43 sites that the characterization team identified as good for monitoring. The map on the right in Figure 36 shows the 20 sites that were visited for in-depth assessments.
Figure 36: Map of all potential sites for in-depth visits

Commercial RTU in MN COMM- 20140512-86450 | March 2017 Seventhwave & CEE 57 | P a g e
Figure 36 shows that about 1/3 of the sites are outside the Twin Cities metro area. The monitoring team is based in downtown Minneapolis, and sites up to 85 miles away from this location were determined to be acceptable. This distribution is in line with the findings from the characterization phase showing that 57% of Minnesota’s RTUs are located within the metro area.
With the 20 in-depth site visits, 93 RTUs were assessed. It is worth noting that the intent of the in-depth sites visits was not to mirror the results from the characterization phase, but to collect detailed information and find sites that could be used for successful consumption monitoring.
To understand the diversity of the in-depth site visits, a table of site information showing business type, RTU capacity, and the area served by each RTU is shown below in Table 17.
Table 17: In-depth Site Characteristics
Site ID Primary Business type
# of RTUs
Total Capacity
(ton/KBtu)
Average Capacity
(ton/KBtu)
Square footage
Ft2/ton
CLC Church 9 89/NA 9.8/NA 29,145 329
CWC Church 6 53/1,339 8.8/223 17.189 324
OSL Church 3 45/858 15.0/286 34,570 768
AWR Fast Food 2 18/365 8.8/183 2,850 163
YMC Health Club 15 102/3,113 6.8/208 63,095 618
COM Hotel 4 37/813 9.1/203 4,200 115
HPS Medical 3 110/NA 36.7/NA 65,311 594
ABS Office 2 11/325 3.5/108 6,215 592
CAP Office 1 8/180 7.5/180 4,410 588
CHO Office 4 12/372 3.0/93 6,169 514
LRE Office 2 30/720 15.0/360 32,048 1,068
OUT Office 5 14/425 3.4/106 8,449 626
TFB Office/Lab 18 128/2,579 7.1/143 49,368 386
BPP Police 1 13/NA 12.5/NA 3,585 287
CHH Restaurant 7 39/643 5.5/129 15.036 391

Commercial RTU in MN COMM- 20140512-86450 | March 2017 Seventhwave & CEE 58 | P a g e
Site ID Primary Business type
# of RTUs
Total Capacity
(ton/KBtu)
Average Capacity
(ton/KBtu)
Square footage
Ft2/ton
DAV Restaurant 3 20/454 6.7/151 6,670 333
GAL Restaurant 5 28/645 5.5/129 6,590 240
NMM Retail 1 16/224 15.5/224 2,230 144
SWP Retail 1 5/135 5.0/135 5,400 1,080
USP Retail 1 10/224 10/180 5,762 576
TOTAL --- 93 783/13,414 9.8/185 368,292 487
The data in Table 17 suggest there is no consistent trend based on RTU sizing for a business type or the facility square footage. The first type of business in the table is a church; there are three sites in this category and they vary by both square footage and by the RTU capacity to serve the area. Both area per RTU and RTU capacity per area (ft2/ton) values vary by a ratio of almost two to one. Similar results are observed by business types that have more than one site in the table. To graphically represent these numbers a plot of area per ton of cooling was generated and is displayed in Figure 37.
Figure 37: Indication of Area served by RTU size

Commercial RTU in MN COMM- 20140512-86450 | March 2017 Seventhwave & CEE 59 | P a g e
There is no clear trend by business type or by the installed capacity per area of conditioned space across the wide variety of building construction types and space utilization. We are unable to conclude whether a larger sample set would produce a trend.
RTU Condition Assessments
Four subjective assessments were made on each of the 93 RTUs as part of the in-depth site visit. These assessments provided an indicator of the maintenance performed on the RTU using a 5-point rating scale with 0 indicating very poor condition to 5 indicating excellent condition. The four areas used in the assessment were the condition of the electric control section, the condition of the electric disconnect, the condition of the condenser fins, and the overall condition of the RTU.
The four inspection areas were chosen based on recommendations from HVAC technicians interviewed as part of the development of the testing protocol. The technicians identified these four areas as indicators of overall service life of the RTU. The technicians also noted that it was their experience that all of the RTUs on buildings with multiple RTUs would be in a similar condition if they were all of the same age.
The condition assessments for the RTUs were plotted for each of the four assessment tests as an average for the site across all RTUs for that site. The bar chart in Figure 38 displays the average for each site including the average age of the RTU displayed as a dot. An average for all 93 RTUs is displayed on the far right of Figure 38 for reference.
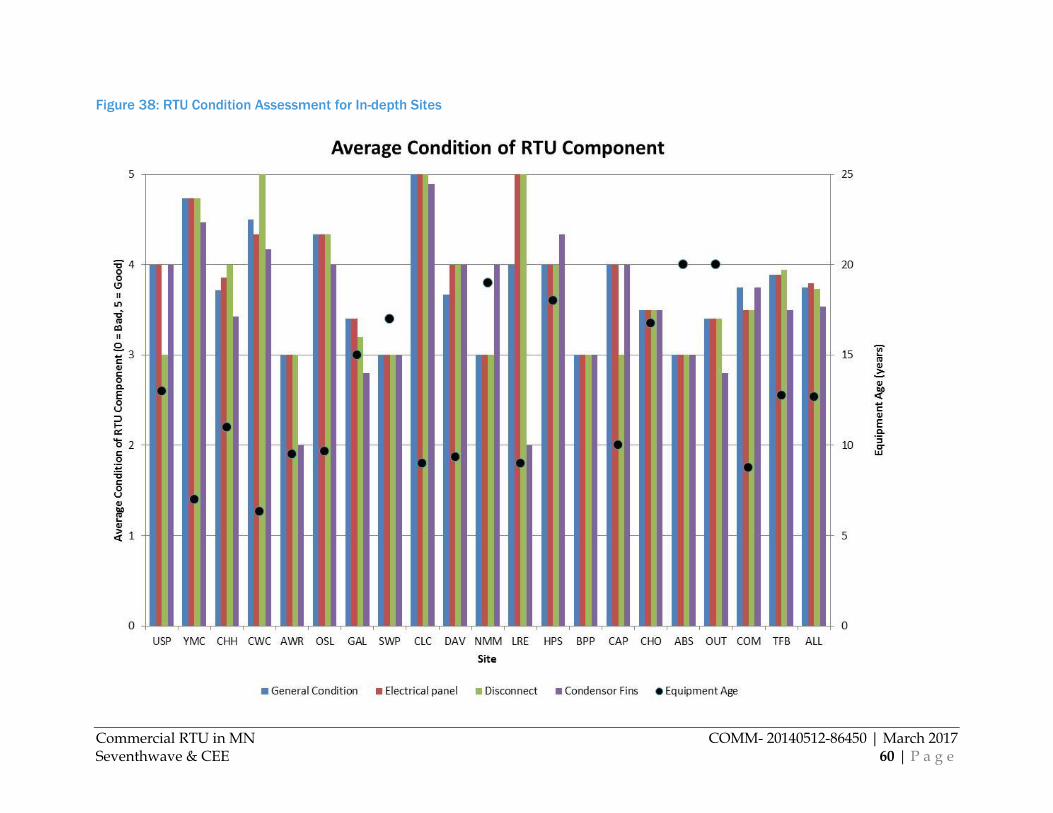
Commercial RTU in MN COMM- 20140512-86450 | March 2017 Seventhwave & CEE 60 | P a g e
Figure 38: RTU Condition Assessment for In-depth Sites

Commercial RTU in MN COMM- 20140512-86450 | March 2017 Seventhwave & CEE 61 | P a g e
With the limited sample of sites, it was observed that in general all of the RTUs tested were well maintained. The average general condition of all 93 RTUs was calculated to be 3.7, with the other assessment checks being very close to the 3.5 range (based on a 5 point scale with 5 being the best condition). There were sites that had below average conditions as assessed by these tests. The AWR site has values that represent equipment that had far below average assessment scores with an average RTU age of only 10 years. The best site, CLC, had the highest equipment condition scores, which is an indication of regular maintenance. CLC also had newer equipment relative to the other RTUs observed in the sample set.
To confirm the above observations, a plot was generated to show the general condition of the RTU on a site basis versus the average RTU age at the site. This plot is displayed in Figure 39.
Figure 39: RTU Condition vs Age
As expected, there is a good relationship with the condition of the RTU as a function of age. The older the RTU the more likely the condition starts to worsen. What’s encouraging is that from the sample of 93 RTUs, units with an average age of 10 years old still had a good overall general condition of approximately 3.5.
Economizer Testing
An area of focus for the in-depth site visits was the condition of the economizers. This is an element of RTUs that is well document for failure. Of the 93 RTUs tested, 77 (83%) had an economizer installed. The most often observed manufacturer of economizer controllers was Honeywell (74%), with a small numbers of other brands which included Carrier (6%), Johnson Controls (1%), Belimo (1%), and Trane (1%). On some RTUs the economizer controller could not

Commercial RTU in MN COMM- 20140512-86450 | March 2017 Seventhwave & CEE 62 | P a g e
be identified due to lack of access, missing labeling, or lack of information on the controller. These unknown controllers represented 16% of the economizers tested. These numbers are graphically represented on the left in Figure 40.
Figure 40: Economizer Manufacturer and typical models
With Honeywell having just under 3/4 of the installed controllers, the model of controller became important to document. The subset of Honeywell models is broken out on the right side of Figure 40. . The most commonly observed Honeywell model was the 7200 series of controller at 63%, with the 7400 series at 14%, and an unknown model at 23%.
Economizer testing proved to be much more difficult than expected due to the large variety of RTU manufacturers and the various testing protocols needed to verify correct operation. The goal of the in-depth site visits was not to document the exact behavior as a function of temperature, but to get an overall sense of whether or not the economizer was working. Three simple tests were performed to assess the status of each economizer. The first was to disconnect power from the RTU to observe if the outside air damper moved from its minimum outside air position. The second was to move the minimum outside air setting adjustment on the controller to observe if the outside air dampers opened or closed as the minimum setting was increased or decreased. The last test required ice packs to be installed on the outside air sensor for the economizer. The ice packs were used to simulate an outside air condition that would make the controller believe economizing was appropriate. The third test was the most involved and the most difficult to perform. Not all RTUs were subjected to all three tests as it was not possible to test some RTUs due to site restrictions, the inability to operate the economizer control, and the control of the RTU by a building automation system and not a unitary controller.
Seventy-one of the 77 RTUs had the power down test and, of these, 53 (75%) passed the test and 18 (25%) did not. The test adjusting the minimum outside air resulted in only 60 (87%) passing and 9 (13%) failing. For the ice pack test, only 37 (53%) passed and 33 (47%) failed. From these results it can be summarized that even if the economizer passed one or two of the tests, a great number of units did not pass all the tests. Only 26 RTU economizers passed all three tests; however, only 7 (10%) failed all three tests. With a rough sample set of 70 RTUs being tested, only 37 units passed one or more of the tests while also failing one or more of the tests indicating that economizers remain a common failure component on RTUs.

Commercial RTU in MN COMM- 20140512-86450 | March 2017 Seventhwave & CEE 63 | P a g e
Minimum Outside Air
The minimum outside air test was subjective; it was based on observations of all RTUs with economizers. The volume of outside air was not measured, but the damper position was observed during the power down test of the RTU. The minimum outside air position was recorded as the amount moved from the “as found” condition to the “closed” position when the power was removed. The percentages were visual evaluations made by the same observer on all tested economizers.
The majority of the minimum settings were found to be 10% or less. There were a few that had higher settings of 15%, 50%, and even 100%, but these represented a small number of occurrences relative to the total sample set. The distribution of minimum outside air settings is displayed in Figure 41.
Figure 41: Minimum Outside Air Settings
Thermostats
The in-depth site visits also looked at the type of thermostat installed to control the RTU. Of the 93 units in the survey, only 15 were standard non-programmable thermostats with a single setpoint. There were a large number of RTUs with programmable thermostats installed (50 total). The type of programmable thermostats varied from 5-2 programmable, which typically has a program for the weekday (5-day period) and weekend (2-day period) only, to the more customizable 7-day, which has individual programs for each day of the week. Each of the remaining 28 RTUs were controlled by a building automation system, which is beyond what is considered typical for this type of building and RTU. Table 18 gives the distribution of thermostats.

Commercial RTU in MN COMM- 20140512-86450 | March 2017 Seventhwave & CEE 64 | P a g e
Table 18: Distribution of Thermostat Types
Type Number (%)
Non Programmable 15 (16%)
Programmable 50 (54%)
Building Automation System 28 (30%)
Annual Energy Consumption
Annual RTU energy consumption was the primary objective of this monitoring phase. The in-depth site visits, the monitoring, and the data processing were all leveraged to obtain consumption information for RTUs in the Minnesota climate. Below is a discussion of both the heating and the cooling consumption models for each RTU and for each site. As discussed previously, the sample set for this data does not represent the complete population of RTUs in the State of Minnesota; it is a limited data set of sites that were willing to participate in the monitoring phase of the research project.
Appendix E: Monitored Site Details has detailed information on each monitored site from this study including information on RTU make and model number, capacity, and age. The building type, square footage, primary business, occupancy, and thermostat settings are also tabulated. A satellite image of each site’s roof is also included to give a visual representation of the RTU configuration.
Data Capture
Data capture proved to be a more difficult task than the research team anticipated. There were a number of sensor and logger issues that limited the data collection and resulted in additional effort to obtain quality data.
As stated in the methodology section, it was our intent to deploy internet based loggers to capture data in near real time and, if an issue occurred, dispatch a research technician to correct it, thereby maintaining the highest possible data capture rates for each RTU and the entire site. However, there were a number of unexpected data collection issues over the monitoring period that were more complicated to solve than a simple sensor correction. The monitoring equipment had critical problems where their operation was not to spec, and the communication on the roof between RTUs and the internet gateway was much more difficult than expected. We worked closely with the manufacturer to resolve equipment- and sensor-related issues and worked through communication issues to achieve the highest possible data capture rates at all the sites.
We accounted for the issue of site occupancy during the in-depth site visits. Each site was questioned about whether their lease would be up for renewal during the 6- to 9-month monitoring period and, if it was, the site was taken out of consideration for monitoring. Only sites with extended leases were considered for monitoring. Even with these factors taken into consideration, there was a site that vacated the building during their lease agreement and mid-

Commercial RTU in MN COMM- 20140512-86450 | March 2017 Seventhwave & CEE 65 | P a g e
term of the data logging. The vacancy resulted in loss of cooling data for the site. The CHO site occupied their building for the first part of the monitoring period, which allowed us to capture heating data. Once the cooling seasons started the business at the site shut down and moved out of the building so there is no representative cooling data for that site.
One other issue that caused the reduction in data collection was an error we made during the deployment of the single current transformer (CT) on the high leg of the electrical supply. Three sites (CHO, ABS, and OUT) were non-typical RTUs in that they were split phase electric systems that only had two wires supplying energy to the RTU. The disconnects for these sites were non-typical, which required the CT to be installed in the electrical control section of the RTU. Because the heating season was the first season for data collection, the electric consumption of the fan was verified to be correct and we assumed that the power to the compressors would be captured with the same CT installation location. We failed to verify that the CTs were not picking up the energy consumption of the compressor until late in the cooling season, thus preventing the development of an accurate consumption model for some of the RTUs at these sites.
Table 19 shows the total number of days of data for each end use at each of the sites. The days varied by RTU and by end use so maximum, average, and minimum values for each energy stream is reported. The data captured rates are also documented based on the total days and the valid days of data collected. The gas data achieved a higher data capture rate due to the accumulation of the pulses by the pulse counter. Data from a 15-minute period could be missing, resulting in reduced data resolution, but no loss of total energy use data as a result of the accumulation. For the electric data, if a reading was missed it could not be reproduced. The electric consumption is considered valid for the entire day only if 90% or more of the data from that day was captured.
Table 19: Data Capture Rates
Gas Data Electric Data
Site Total Days
Valid Days
Capture Rate
Total Days
Valid Days
Capture Rate
ABS
Max 156 128 82% 0 0 0%
Ave 156 85 54% 0 0 0%
Min 156 41 26% 0 0 0%
CAP 139 139 100% 260 211 81%
CHO
Max 74 74 100% 0 0 0%
Ave 74 54 72% 0 0 0%
Min 74 25 34% 0 0 0%
CWC
Max 158 119 75% 356 310 87%
Ave 158 108 68% 356 284 80%
Min 158 54 34% 356 262 74%

Commercial RTU in MN COMM- 20140512-86450 | March 2017 Seventhwave & CEE 66 | P a g e
Gas Data Electric Data
Site Total Days
Valid Days
Capture Rate
Total Days
Valid Days
Capture Rate
DAV
Max 184 173 94% 310 260 84%
Ave 184 132 72% 310 249 80%
Min 184 106 58% 310 232 75%
NUR
Max 137 120 88% 262 179 68%
Ave 137 106 77% 261 152 58%
Min 137 65 47% 260 94 36%
OUT
Max 153 153 100% 0 0 0%
Ave 153 118 77% 0 0 0%
Min 153 56 47% 0 0 0%
SEW
Max 128 127 99% 253 233 92%
Ave 128 117 92% 253 209 83%
Min 128 89 70% 253 166 66%
TFB
Max 151 151 100% 276 216 78%
Ave 148 127 85% 273 191 70%
Min 145 98 68% 270 0 0%
Data capture rates are not as high as expected. The loss of data as a result of sensor problems and the communication difficulties lowered the capture rates far below our goal. The deployment of the internet based loggers and the near real-time data collection helped identify the issues at each RTU while also adding to the difficulty of the monitoring system.
The period identified by the electric consumption was the span of time that the monitoring system was in place. The period for the gas consumption represents only the time when outside air temperature was low enough to require gas for heating. Due to the problems with the monitoring equipment, specifically the pulse counters, the gas consumption was not monitored for the full length of the monitoring period.
Natural Gas Consumption
With Minnesota’s heating dominate climate, heating use was of particular interest to this research project. The gas consumption for all RTUs was captured and processed as a function of outside air temperature. As can be expected, the models for gas consumption show many variations. A separate supplemental document to this final report shows the gas models for each RTU with sufficient data to generate a significant model. Figure 42 shows the gas models for each RTU with sufficient data to generate a significant model. The figures below show some of the more typical gas consumption models.

Commercial RTU in MN COMM- 20140512-86450 | March 2017 Seventhwave & CEE 67 | P a g e
Figure 42: Ideal Gas Consumption Model
Figure 42 represents an ideal consumption model with a different model for weekday and weekend periods. The weekday period model has a good regression fit with an R2 of 91% while the weekend model shows lower gas consumption at the same outside air temperature. The weekend regression model is also a good fit with an R2 of 96%. The RTU at this site is controlled by a 7-day programmable thermostat that can’t be modified by the occupants so it results in the clean models displayed in the figure. One interesting observation is the area served by this RTU requires heating to an outside air temperature of over 60 degrees F, much higher than the typical commercial office building which usually reaches balance point at 50 degrees F.
Figure 43 shows a different trend with the weekend model consuming more energy than the weekday model. There could be a number of reasons for this consumption pattern. The SEW site is an office building that is occupied during typical office hours during the week (6:30 am to 6:00 pm) with very limited occupancy on the weekend. The RTU at this site is controlled with a programmable thermostat. One explanation for the higher weekend use is the setting for the thermostat on the weekend might not be low enough, causing the RTU to heat more than needed. No information on thermostat adjustments was made available during the monitoring period. Additionally, the weekday internal gains from the people and office equipment provide a positive effect on the weekday model, causing the RTU to use less energy to maintain the space setpoints.

Commercial RTU in MN COMM- 20140512-86450 | March 2017 Seventhwave & CEE 68 | P a g e
Figure 43: Non-typical Gas Consumption Model #1
Figure 44 displays an RTU that did not consume natural gas for heating during the monitoring period. This RTU served an interior space that did not have heat loss, a typical aspect of spaces during the winter months. The setting on the thermostat may also have been lower than the surrounding RTUs so that it never reached the limit required for the activation of heat. The phenomenon of RTUs that don’t use energy is observed on a regular basis for distinct units that condition interior spaces with little to no load and thermostats that don’t match the surrounding units.

Commercial RTU in MN COMM- 20140512-86450 | March 2017 Seventhwave & CEE 69 | P a g e
Figure 44: Non-typical Gas Consumption Model #2
The last example of a non-typical gas model is displayed in Figure 45. This graph shows a natural gas consumption model that increases with increasing outside air temperature. There is no correlation between weekday and weekend use, and there are periods when heat should be needed but the unit didn’t consume any energy. This type of model shows what happens when a thermostat is modified at random times and for spaces that may have shifting heat requirements from time to time such as a conference room or common area.

Commercial RTU in MN COMM- 20140512-86450 | March 2017 Seventhwave & CEE 70 | P a g e
Figure 45: Non-Typical Gas Consumption Model #3
Table 20 shows the weekday and weekend balance point temperatures and the regression slope for all RTU gas models.
Table 20: Heating Fit Parameters
Site RTU ID
Weekday Balance
Temperature (F)
Weekend Balance
Temperature (F)
Weekday Regression
Slope (KBTU/Deg F)
Weekend Regression
Slope (KBTU/Deg F)
CWC
RTU #1 68.0 69.5 -28.1 -23.5
RTU #2 63.3 65.6 -6.8 -9.2
RTU #3 61.2 76.3 -13.5 -3.7
RTU #4 71.0 61.0 -8.2 -8.1
RTU #5 62.7 62.3 -43.0 -44.8
RTU #6 55.6 57.2 -15.5 -14.3
Full Site 61.7 58.4 -121.8 -124.1
CAP RTU #1 66.0 59.8 -46.8 -39.9
DAV
RTU #1 51.7 53.8 -32.0 -27.8
RTU #2 49.4 52.6 -8.6 -7.9
RTU #3 66.1 71.5 -7.3 -6.4
Full Site 52.9 55.5 -50.8 -45.5
TFB RTU #1 60.4 45.7 -3.5 -4.5
RTU #2 48.6 50.1 -3.1 -1.9

Commercial RTU in MN COMM- 20140512-86450 | March 2017 Seventhwave & CEE 71 | P a g e
Site RTU ID
Weekday Balance
Temperature (F)
Weekend Balance
Temperature (F)
Weekday Regression
Slope (KBTU/Deg F)
Weekend Regression
Slope (KBTU/Deg F)
RTU #3 57.6 49.2 -15.0 -14.9
RTU #4 198.7 5.2 0.0 0.0
RTU #5 67.8 61.4 -35.0 -25.6
RTU #6 -0.9 -23.8 0.1 0.1
RTU #7 59.7 50.0 -18.6 -12.9
RTU #8 -186.8 -24.8 4.0 12.5
RTU #9 69.2 44.9 -22.3 -56.4
RTU #10 63.8 0.2 -9.6 0.0
RTU #11 50.5 53.0 -8.3 -6.1
RTU #12 51.0 47.9 -6.1 -4.0
RTU #13 58.6 51.5 -7.3 -5.7
RTU #14 111.9 87.6 -2.4 -1.7
RTU #15 59.8 48.3 -17.3 -8.8
RTU #16 58.4 53.6 -8.3 -2.4
RTU #17 86.2 48.1 -16.2 -10.9
RTU #18 60.8 51.6 -22.8 -19.7
Full Site N/A N/A N/A N/A
NUR
RTU #1 59.5 80.6 -4.2 -2.9
RTU #2 N/A N/A N/A N/A
RTU #3 443.9 800.0 -0.2 -0.2
RTU #4 45.7 50.9 -2.1 -3.4
RTU #5 60.9 66.5 -23.9 -22
RTU #6 246.7 83.4 0.0 -0.1
RTU #7 60.4 67.0 -3.8 -6.4
RTU #8 58.0 67.4 -41.2 -33.7
RTU #9 64.1 65.8 -23.0 -23.9
Full Site 62.9 70.2 -84.8 -76.0
SEW
RTU #1 54.7 72.4 -17.3 -15.1
RTU #2 51.5 69.2 -6.0 -13.9
RTU #3 56.2 61.6 -23.5 -17.2
RTU #4 65.5 58.7 -23.6 -22.9
Full Site 60.0 64.5 -61.6 -66.3
The variation in balance point temperatures and the magnitude of the regression slopes gives an indication of the type of consumption pattern the RTU followed. Each of the above models is represented in the four models discussed. Extreme balance point temperatures (negative or positive) and large or small regression slopes indicate models that don’t represent typical gas use and spaces that have varying consumption patterns.

Commercial RTU in MN COMM- 20140512-86450 | March 2017 Seventhwave & CEE 72 | P a g e
Annual Gas Consumption
With individual RTU consumption models developed, annual consumption was computed for each RTU and each site by applying the NOAA Typical Meteorological Year (TMY3) data to the models. Table 21 shows the individual RTU annual consumption values along with the site totals and each RTU’s contribution to the total consumption. The consumption per square foot of conditioned area was also computed to normalize the size of RTU and area served. Only sites that were able to be computed are displayed.
Table 21: RTU Annual Gas Consumption
Site RTU Annual Consumption (Therms)
Percent of Site Total
Therms/Ft2
CAP RTU #1 3,396 100% 0.77
CWC
RTU #1 2,347 28% 1.28
RTU #2 562 7% 0.20
RTU #3 763 9% 0.23
RTU #4 704 8% 0.34
RTU #5 3,092 37% 1.03
RTU #6 839 10% 0.28
DAV
RTU #1 1,447 60% 0.94
RTU #2 362 15% 0.20
RTU #3 589 25% 0.19
NUR
RTU #1 295 4% 0.14
RTU #2 N/A N/A N/A
RTU #3 315 4% 0.15
RTU #4 96 1% 0.04
RTU #5 1,652 23% 0.66
RTU #6 14 0% 0.01
RTU #7 330 5% 0.13
RTU #8 2,566 36% 1.15
RTU #9 1,774 25% 0.77
SEW
RTU #1 1,074 23% 0.34
RTU #2 554 12% 0.18
RTU #3 1,270 27% 0.40
RTU #4 1.723 37% 0.55

Commercial RTU in MN COMM- 20140512-86450 | March 2017 Seventhwave & CEE 73 | P a g e
Site RTU Annual Consumption (Therms)
Percent of Site Total
Therms/Ft2
TFB
RTU #1 207 2% 0.04
RTU #2 112 1% 0.05
RTU #3 806 6% 0.29
RTU #4 0 0% 0.00
RTU #5 2,609 20% 0.56
RTU #6 0 0% 0.00
RTU #7 1,001 8% 0.81
RTU #8 0 0% 0.00
RTU #9 1,958 15% 0.45
RTU #10 501 4% 0.38
RTU #11 342 3% 0.25
RTU #12 236 2% 0.08
RTU #13 392 3% 0.17
RTU #14 480 4% 0.18
RTU #15 886 7% 0.43
RTU #16 391 3% 0.27
RTU #17 1,817 14% 1.07
RTU #18 1,340 10% 0.33
RTU annual gas consumption was highly variable across the sites and across the area served. There are too many factors that affect the consumption of an RTU to generalize the consumption pattern and predict with confidence what the consumption will be for a RTU at a site given limited information about the configuration application. By normalizing to area served, the spread of consumption did tighten up, but there still wasn’t a clear representation of consumption by RTU size, space use, or type of business.
The site natural gas consumption data was only collected from the sites that agreed to release the data. Of the monitored sites, only 5 agreed to release their utility data for analysis. Table 22 displays the result of the comparison.

Commercial RTU in MN COMM- 20140512-86450 | March 2017 Seventhwave & CEE 74 | P a g e
Table 22: RTU Heating Consumption Compared to Total Site
Site
Site Consumption (Therms)
RTU Consumption
(Therms)
RTU percent of Total
Observed Modeled
CAP 2,225 2,786 3,396 122%
CWC 6,090 7,091 8,131 115%
DAV 11,568 12,363 2,466 20%
TFB N/A N/A 13,079 N/A
NUR 5,918 7,557 6,336 84%
SEW N/A N/A 4,285 N/A
For most of the sites, RTUs are the major consumer of natural gas. The CAP, CWC, and NUR sites have the majority of the site gas consumption with CAP and CWC falling within the errors of the models for both site use and RTU consumption. The DAV has lower RTU consumption on a whole site basis due to the cooking equipment at the site. DAV is a restaurant with a number of gas cooking appliances that consume natural gas and provide heat to the space. The SEW and TFB sites did not agree to release consumption for the total site so a calculation of RTU percent of total natural gas use was not completed.
Electric Consumption
The electric consumption of RTUs follows a much different pattern than the gas. RTUs continually use electric energy for the movement of air during winter and for the supply fan in summer. The largest electrical component of the RTU is the compressor whose consumption is dependent on the cooling requirements of the space. The typical electric model has two defined areas of consumption when daily use is plotted against outside air values. There is constant energy consumption due to fan energy at lower outside air temperatures, and a linearly increasing energy consumption beyond a temperature at which space cooling is required. The linear consumption will increase with increasing outside air temperature. All electric consumption models for RTUs with sufficient data are displayed in a separate supplemental document to this final report.
Figure 46 represents an ideal electric consumption model. There is a good change point model for both the weekday and weekend periods. There is an interesting occurrence displayed in the models. For the weekday periods during colder weather the electrical consumption is flat. This flat consumption represents the well-defined and constant consumption of the supply fan that is active during occupied hours for a fixed time length. On the weekends during heating season the electrical consumption is lower and increases as the outside air temperature gets colder. This is expected when the supply fan is set to only operate on a call for heating during the weekend or unoccupied period. As it gets colder outside, more heat is needed resulting in longer runtimes for the supply fan and an increase in electric consumption at colder temperatures. It is of note that this site does use 7-day programmable, Wi-Fi enabled thermostats that have the ability to program fan operation based on occupancy schedules.

Commercial RTU in MN COMM- 20140512-86450 | March 2017 Seventhwave & CEE 75 | P a g e
Figure 46: Ideal Electric Consumption Model
Figure 47 displays a non-typical electric consumption model. There is no difference between the weekday or weekend consumption models as one would expect for a site with a programmable thermostat. This is an office that doesn’t have weekend office hours, which should result in lower RTU electric use during the unoccupied periods. The models are slightly different but not enough to assume that the weekend setpoints are different than the weekday.

Commercial RTU in MN COMM- 20140512-86450 | March 2017 Seventhwave & CEE 76 | P a g e
Figure 47: Non-typical Electric Consumption Example #1
Figure 48 is another model with no difference in the weekday and weekend. However, the interesting thing about this model is that the space requires cooling down to 45-degree outside air temperature. The DAV site is a restaurant with a large amount of cooking equipment that adds to the cooling requirements of the space. As with Figure 47, there is no significant difference in weekday or weekend consumption as could be expected for a restaurant.

Commercial RTU in MN COMM- 20140512-86450 | March 2017 Seventhwave & CEE 77 | P a g e
Figure 48: Non-typical Electrical Consumption Example #2
If the economizer were operating correctly for RTU #2 at DAV, there wouldn’t be the increase in electric energy at an outside air temperature of 45 degrees. The mechanical cooling on this RTU should be kept off to at least 60, if not 65, degrees outside air temperature, at which time the compressor would need to be utilized to provide cooling to the space.
Figure 49 further supports the analysis of cooling energy and the affect the economizer has on the change point.

Commercial RTU in MN COMM- 20140512-86450 | March 2017 Seventhwave & CEE 78 | P a g e
Figure 49: Electric Model Change Point Temperatures

Commercial RTU in MN COMM- 20140512-86450 | March 2017 Seventhwave & CEE 79 | P a g e
The majority of the RTUs had change point values between 40 and 55 degrees. Only 13 units had a change point value of 60 degrees or higher, which indicates that the economizers on these RTUs are operational and have appropriate control points that allow for economizing during milder weather. There doesn’t appear to be a trend in the difference between weekday versus weekend change point temperature. It is expected that if there is a different load on the weekend and the RTU is controlled by a programmable thermostat that resets cooling during unoccupied times the change point for the weekend period would be higher. There isn’t a consistent correlation in this limited data set.
Table 23 shows individual RTU annual consumption. The annual consumption was computed using the individual models and applying TMY3 data. Along with the annual electric consumption the contribution each RTU makes to the total HVAC electric use has been computed. The square footage values have also been applied to each RTU consumption to normalize kWh consumption by area served.
Table 23: RTU Annual Electric Consumption
Site RTU Annual Consumption (kWh)
Percent of Site Total
kWh/Ft2
CAP RTU #1 16,130 100% 3.66
CWC
RTU #1 2,083 12% 1.13
RTU #2 3,875 22% 1.35
RTU #3 1,559 9% 0.48
RTU #4 1,845 10% 0.88
RTU #5 5,202 29% 1.73
RTU #6 3,215 18% 1.07
DAV
RTU #1 7,821 13% 5.10
RTU #2 31,841 54% 17.31
RTU #3 19,732 33% 6.34
NUR
RTU #1 1,037 2% 0.49
RTU #2 1,023 2% 1.07
RTU #3 N/A N/A N/A
RTU #4 6,737 11% 2.57
RTU #5 17,741 28% 7.05
RTU #6 6,098 10% 2.20
RTU #7 3,806 6% 1.54
RTU #8 6,676 11% 2.98
RTU #9 19,467 31% 8.47

Commercial RTU in MN COMM- 20140512-86450 | March 2017 Seventhwave & CEE 80 | P a g e
Site RTU Annual Consumption (kWh)
Percent of Site Total
kWh/Ft2
SEW
RTU #1 11,032 32% 3.50
RTU #2 7,620 22% 2.42
RTU #3 8,793 26% 2.79
RTU #4 6,887 20% 2.19
TFB
RTU #1 8,660 6% 1.76
RTU #2 12,012 9% 5.11
RTU #3 10,551 8% 3.77
RTU #4 6,408 5% 1.25
RTU #5 22,196 16% 4.75
RTU #6 13,150 10% 7.65
RTU #7 8,560 6% 6.91
RTU #8 3,378 2% 1.56
RTU #9 12,421 8% 2.39
RTU #10 3,904 3% 2.92
RTU #11 5,110 4% 3.74
RTU #12 6,979 5% 2.45
RTU #13 2,451 2% 1.09
RTU #14 3,648 3% 1.36
RTU #15 6,704 5% 3.23
RTU #16 6,205 5% 4.22
RTU #17 6,398 5% 3.78
RTU #18 N/A N/A N/a
RTU electric consumption presented in Table 23 follows the same conclusions made with gas consumption. The annual electric consumption at a site is dependent on the site requirement more than the characteristics of the RTU. The kWh/ft2 values span a wide range of values and isn’t helpful in determining RTU consumption without detailed monitoring.
As with natural gas, the total site electric utility bills were collected for sites that agreed to release that information. Table 24 displays the results of the comparison of RTU use to total site use.

Commercial RTU in MN COMM- 20140512-86450 | March 2017 Seventhwave & CEE 81 | P a g e
Table 24: RTU Electric Consumption Compared to Total Site
Site Site Consumption (kWh) RTU
Consumption (kWh)
RTU percent of Total
Observed Modeled
CAP 34,746 35,176 16,131 46%
CWC 71,200 73,393 18,167 25%
DAV 194,880 195,666 59,513 30%
TFB N/A N/A N/A
NUR 180,640 175,628 85,709 49%
SEW N/A N/A 35,132 N/A
The three traditional office buildings (CAP and NUR) have approximately the same percentage of RTU use to total site consumption at 46%, 49% and 39% respectively. The CWC site is a church with limited operational hours and special load requirements on the weekends for a shorter duration than a typical site. As shown in Table 23, the DAV site, which had a higher than typical kWh/ft2 value, has a lower RTU consumption as a percentage of the total site. This can only be explained by the additional energy requirements of a restaurant.
Evaluation of RTU Sizing
An RTU sizing analysis was performed with the monitored data to understand the amount of oversizing that happens in this small sample of buildings. Oversizing can have negative effects on occupant comfort, equipment life and energy consumption of RTUs. Designers typically oversize RTUs to account for growth within the sites and the fact that an oversized unit will operate without issue a site, just not as efficiently as a correctly sized unit. The ramifications of under sizing causes more issues for mechanical designers in that the lack of delivery of comfort will cause redesign and added cost to the building after the initial occupancy.
To generate the data needed for sizing analysis, a subset of the 15-minute data was used by parsing out consumption data during both heating and cooling dominated periods. To assure that the units did see near design conditions a plot of the outside air temperature was generated and is displayed in Figure 50. The lowest outside air conditions were experienced during the time between December 2015 and January 2016. The warmest weather was experienced between June 2016 and July 2016. This is the time frame used for the sizing analysis.

Commercial RTU in MN COMM- 20140512-86450 | March 2017 Seventhwave & CEE 82 | P a g e
Figure 50: Measured Outside Air Temperatures
Figure 50 also has lines representing the ASHRAE design outdoor temperatures for the Minneapolis area. From this outside air plot, it is assured that the RTUs did operate at or near the design conditions during the monitoring period.
The subset of 15-minute consumption data was used to compute the percent loading at all operating times and plotted against the outside air temperature. A regression analysis was generated modeling the loading as a function of outside air temperature. Once the regression was known the design temperature was applied to the model and average loading was determined at the design conditions. This analysis was performed for both heating and cooling for each RTU with sufficient monitored data.
RTU sizing analysis is summarized in Table 25. No trends could be found for this analysis other than sizing is highly variable. The only restaurant in the study, DAV, had the most undersized cooling for the space with the most oversized heating. This is consistent with anecdotal discussions with restaurant managers that often comment that it is difficult to keep their customers comfortable in extreme warm weather.
Table 25: Sizing Evaluation
Site RTU Cooling % of Capacity
Heating % of Capacity
Site RTU Cooling % of Capacity
Heating % of Capacity
ABS
RTU #1 N/A N/A
SEW
RTU #1 51% 33%
RTU #2 N/A 67% RTU #2 75% 13%
RTU #3 N/A 110% RTU #3 91% 34%

Commercial RTU in MN COMM- 20140512-86450 | March 2017 Seventhwave & CEE 83 | P a g e
Site RTU Cooling % of Capacity
Heating % of Capacity
Site RTU Cooling % of Capacity
Heating % of Capacity
CAP RTU #1 63% 55% RTU #4 43% 50%
CHO
RTU #1 N/A 69%
TFB
RTU #1 71% 16%
RTU #2 N/A 104% RTU #2 63% 33%
RTU #3 N/A 29% RTU #3 102% 31%
RTU #4 N/A 43% RTU #4 N/A 49%
CWC
RTU #1 20% 42% RTU #5 91% 0%
RTU #2 58% 9% RTU #6 66% 41%
RTU #3 63% 12% RTU #7 125% 21%
RTU #4 63% 13% RTU #8 N/A 48%
RTU #5 49% 57% RTU #9 46% 76%
RTU #6 59% 25% RTU #10 33% 10%
DAV
RTU #1 102% 65% RTU #11 50% 22%
RTU #2 143% 19% RTU #12 N/A 18%
RTU #3 123% 28% RTU #13 61% 19%
NUR
RTU #1 39% 11% RTU #14 N/A 6%
RTU #2 35% 4% RTU #15 61% 30%
RTU #3 19% 3% RTU #16 56% 13%
RTU #4 61% 5% RTU #17 82% 30%
RTU #5 72% 62% RTU #18 N/A 29%
RTU #6 65% 0%
OUT
RTU #1 N/A 69%
RTU #7 44% 1% RTU #2 N/A 104%
RTU #8 70% 99% RTU #3 N/A 29%
RTU #9 99% 67% RTU #4 N/A 43%
From the data, there were units that were operating at or over their design capacity (i.e. OUT RTU #2 heating and all RTUs at DAV for cooling), and there were units that never operated near their design capacity (i.e. CWC RTU #2 heating and TFB RTU #5 and #14 heating). Heating appeared to be the more oversized mode of operation compared to cooling, which is interesting given the heating dominant climate of Minnesota. The other anecdotal fact is that when sizing an RTU for a space, it has been our experience that cooling is the determining factor in the selection of the RTU. It is assumed that if the RTU meets the cooling load, whatever the heating capacity is for that model will be sufficient to meet space demands.
Plotting the annual consumption for gas and electric versus the sizing percentages yields the expected result that RTUs operating closer to capacity at design conditions have higher annual consumption. These plots are displayed in Figure 51 and Figure 52.

Commercial RTU in MN COMM- 20140512-86450 | March 2017 Seventhwave & CEE 84 | P a g e
Figure 51: Annual Gas Consumption as Function of Sizing
Figure 52: Annual Electric Consumption as a Function of Sizing

Commercial RTU in MN COMM- 20140512-86450 | March 2017 Seventhwave & CEE 85 | P a g e
As seen in Figure 51, RTU heating capacity is generally more oversized than cooling. This is visually represented by more RTUs having the computed value of heating percent of capacity at design of less than 50%. The same is not true for the cooling sizing. More RTUs are near their design capacity at design outside air conditions.
Key performance indicators
The intent of this research was to draw from the data key performance indicators that could be used by energy professionals to quickly identify low RTU performance during a traditional energy audit. These indicators could be used to deliver savings for potential customers, thereby resulting in energy savings for the utility. The indicators would have energy impacts assigned to the behavior and the typical corrective action to resolve the sub-par performance. Analysis of the data set collected during the monitoring phase doesn’t allow for the identification of the performance indicators. The data wasn’t detailed enough to expose the performance issues without a detailed analysis of the operation of the RTU. Additionally, the monitored data shows that site conditions vary to such a large extent that generalization across typical building or business type cannot be made. Varying load, different business types, and varying RTU size applied to these buildings result in too many variations to predict indicators of performance.
The in-depth sites visit did test the function of the economizer with limited success. The three tests performed on the economizer did result in the identification of a functioning economizer, but could not identify the setpoints used by the economizer to determine if conditions are appropriate for activation. These economizer tests are routine for HVAC technicians and should be performed on a regular basis. The cooling performance monitoring did suggest that there were a number of RTUs that either didn’t have operational economizers or the setpoints controlling the activation of the economizer were set inappropriately. This finding is consistent with previous research. [28]
High and Low Performance Characteristics
As mentioned previously, our relatively small monitored sample size combined with the highly variable nature of RTU performance prohibited us from making statistically significant determinations about the factors that lead to high and low RTU energy performance. Anecdotally, the primary factors include:
Age
Newer units tend to have higher performance as their relatively higher efficiencies, controls and other features improved performance. In addition, when not properly maintained, RTU performance tends to degrade over time due to clogged filters and condensers, and non-functioning economizers.
[28] Cowen, A., New Buildings Institute, “Review of Recent Commercial Roof Top Unit Field Studies in the Pacific Northwest and California, October 2004

Commercial RTU in MN COMM- 20140512-86450 | March 2017 Seventhwave & CEE 86 | P a g e
Capacity
Units with larger capacity tend to have higher performance as their efficiencies tend to be higher due to larger heat exchangers. Additionally, higher energy consumption means that it is more economical to add other energy saving controls and features.
Efficiency
Units with higher cooling efficiencies tend to result in higher performance. In particular, higher part load efficiency is a key driver in improved performance.
Sizing
Units that are right-sized for the load being served tend to have higher performance. Oversizing causes short cycling, more frequent space temperature swings and shortens the life of the equipment. Right-sized units reduce these issues and operate closer to the intended design which is more efficient.
Features and controls
Additional features, such as those discussed in the CIP Recommendations section, tend to improve performance by allowing the RTU to use only the energy needed to maintain temperature and humidity setpoints.
Extrapolation to the Minnesota Market
A given RTUs energy performance can range widely based on a variety of factors. However, it is clear that a gap exists between existing and optimal performance. To understand the impact of this gap, we quantified the potential savings if all of Minnesota’s existing RTUs were upgraded to high performance. To begin, we used CBECS data representing existing building stock in 2012. [29] The available microdata contains a large number of relevant fields for 6,720 sampled buildings. This statistically significant sample was used to find existing building characteristics and energy consumption for commercial buildings in Minnesota. The fields that we used for this analysis were:
Census Division (CENDIV)
Final full sample building weight (FINALWT)
Heating degree days (HDD65)
Cooling degree days (CDD65)
Percent heated by packaged heating (PKGHP)
Percent cooled by packaged cooling (PKGCP)
Natural gas heating use (NGHTBTU)
Electricity heating use (ELHTBTU)
Electricity cooling use (ELCLBTU)
[29] Commercial Buildings Energy Consumption Survey (CBECS). 2012. (http://www.eia.gov/consumption/commercial/)

Commercial RTU in MN COMM- 20140512-86450 | March 2017 Seventhwave & CEE 87 | P a g e
Electricity fan use (ELVNBTU)
We began by filtering the data for the West North Central region (CENDIV = 4) which contains Minnesota. The next step of our analysis was to calculate the total natural gas consumption of RTUs in the West North Central region for heating (NatGasWNC,heat,2012), as well as the total electricity consumption for heating (ElecWNC,heat,2012), cooling (ElecWNC,cool,2012), and fan (ElecWNC,fan,2012) end uses.
𝑁𝑎𝑡𝐺𝑎𝑠𝑊𝑁𝐶,ℎ𝑒𝑎𝑡,2012 = ∑ [𝑁𝐺𝐻𝑇𝐵𝑇𝑈𝑖 ∙ 𝐹𝐼𝑁𝐴𝐿𝑊𝑇𝑖 ∙ (𝐻𝐷𝐷65𝑀𝑁
𝐻𝐷𝐷65𝑖) ∙ (
𝑃𝐾𝐺𝐻𝑃𝑖
100)]
𝑁
𝑖=1
𝐸𝑙𝑒𝑐𝑊𝑁𝐶,ℎ𝑒𝑎𝑡,2012 = ∑ [𝐸𝐿𝐻𝑇𝐵𝑇𝑈𝑖 ∙ 𝐹𝐼𝑁𝐴𝐿𝑊𝑇𝑖 ∙ (𝐻𝐷𝐷65𝑀𝑁
𝐻𝐷𝐷65𝑖) ∙ (
𝑃𝐾𝐺𝐻𝑃𝑖
100)]
𝑁
𝑖=1
𝐸𝑙𝑒𝑐𝑊𝑁𝐶,𝑐𝑜𝑜𝑙,2012 = ∑ [𝐸𝐿𝐶𝐿𝐵𝑇𝑈𝑖 ∙ 𝐹𝐼𝑁𝐴𝐿𝑊𝑇𝑖 ∙ (𝐶𝐷𝐷65𝑀𝑁
𝐶𝐷𝐷65𝑖) ∙ (
𝑃𝐾𝐺𝐶𝑃𝑖
100)]
𝑁
𝑖=1
𝐸𝑙𝑒𝑐𝑊𝑁𝐶,𝑓𝑎𝑛,2012 = ∑ [𝐸𝐿𝑉𝑁𝐵𝑇𝑈𝑖 ∙ 𝐹𝐼𝑁𝐴𝐿𝑊𝑇𝑖 ∙ (𝑃𝐾𝐺𝐻𝑃𝑖 + 𝑃𝐾𝐺𝐶𝑃𝑖
2 ∙ 100)]
𝑁
𝑖=1
where:
HDD65MN is the heating degree days in Minneapolis, [30] CDD65MN is the cooling degree days in Minneapolis, [30] and N is the total number of filtered data points.
Note that the previous step not only calculated the total RTU energy consumption, but also normalized it from across the West North Central region to a Minnesota-specific value using heating and cooling degree days. The next step of the extrapolation was to find the total energy proportion attributable to Minnesota. We therefore assumed that a state’s population was a reasonable approximation of its proportion of buildings within its census division. Using U.S. census data [31], we calculated a population scaling factor for Minnesota (FactorMN) according to:
𝐹𝑎𝑐𝑡𝑜𝑟𝑀𝑁 = 𝑃𝑜𝑝𝑢𝑙𝑎𝑡𝑖𝑜𝑛𝑀𝑁
𝑃𝑜𝑝𝑢𝑙𝑎𝑡𝑖𝑜𝑛𝐶𝑒𝑛𝐷𝑖𝑣
where:
PopulationMN is the population of Minnesota and PopulationWNC is the population of the West North Central region.
[30] From 2009 ASHRAE Handbook – Fundamentals, the Minneapolis heating degree days were 7565 and the cooling degree days were 751.
[31] US Census State Population Totals Tables: 2010-2016. (https://www.census.gov/data/tables/2016/demo/popest/state-total.html)

Commercial RTU in MN COMM- 20140512-86450 | March 2017 Seventhwave & CEE 88 | P a g e
From this equation, we calculated a Minnesota population scaling factor of 26%. We then calculated the end use energy consumption for Minnesota for 2012 according to:
𝑁𝑎𝑡𝐺𝑎𝑠𝑀𝑁,ℎ𝑒𝑎𝑡,2012 = 𝑁𝑎𝑡𝐺𝑎𝑠𝑊𝑁𝐶,ℎ𝑒𝑎𝑡,2012 ∙ 𝐹𝑎𝑐𝑡𝑜𝑟𝑀𝑁
𝐸𝑙𝑒𝑐𝑀𝑁,ℎ𝑒𝑎𝑡,2012 = 𝐸𝑙𝑒𝑐𝑊𝑁𝐶,ℎ𝑒𝑎𝑡,2012 ∙ 𝐹𝑎𝑐𝑡𝑜𝑟𝑀𝑁
𝐸𝑙𝑒𝑐𝑀𝑁,𝑐𝑜𝑜𝑙,2012 = 𝐸𝑙𝑒𝑐𝑊𝑁𝐶,𝑐𝑜𝑜𝑙,2012 ∙ 𝐹𝑎𝑐𝑡𝑜𝑟𝑀𝑁
𝐸𝑙𝑒𝑐𝑀𝑁,𝑓𝑎𝑛,2012 = 𝐸𝑙𝑒𝑐𝑊𝑁𝐶,𝑓𝑎𝑛,2012 ∙ 𝐹𝑎𝑐𝑡𝑜𝑟𝑀𝑁
New construction has historically increased the U.S. building stock area by approximately 2% annually. [32] The next step of our calculation was to extrapolate the 2012 data to the present by assuming that this percentage increase applied to the energy consumption by:
𝑁𝑎𝑡𝐺𝑎𝑠𝑀𝑁,ℎ𝑒𝑎𝑡,2016 = 𝑁𝑎𝑡𝐺𝑎𝑠𝑀𝑁,ℎ𝑒𝑎𝑡,2012 ∙ (1 + 𝑟)(2016−2012)
𝐸𝑙𝑒𝑐𝑀𝑁,ℎ𝑒𝑎𝑡,2016 = 𝐸𝑙𝑒𝑐𝑀𝑁,ℎ𝑒𝑎𝑡,2012 ∙ (1 + 𝑟)(2016−2012)
𝐸𝑙𝑒𝑐𝑀𝑁,𝑐𝑜𝑜𝑙,2016 = 𝐸𝑙𝑒𝑐𝑀𝑁,𝑐𝑜𝑜𝑙,2012 ∙ (1 + 𝑟)(2016−2012)
𝐸𝑙𝑒𝑐𝑀𝑁,𝑓𝑎𝑛,2016 = 𝐸𝑙𝑒𝑐𝑀𝑁,𝑓𝑎𝑛,2012 ∙ (1 + 𝑟)(2016−2012)
where:
r is the annual percentage increase or 2%.
The final step in our extrapolation was to apply savings factors to each end use in order to calculate the energy savings potential. For the heating end uses, we assumed a savings factor of 13% based on our calculated average existing RTU heating efficiency of 80% and a high performing condensing RTU heating efficiency of 90%. [33] For the cooling end use, we assumed a savings factor of 17% based on our calculated average existing RTU cooling efficiency of 10.6 EER and CEE’s Advanced Tier recommendation of 12.4 EER.[33]For the fan end use, we assumed a savings factor of 60% based on modeled energy savings of switching from constant volume to variable speed fans in Minneapolis. [34] The result of this
analysis was a predicted electricity savings of 1,183 million kWh (4,037 million kBtu) and natural gas savings of 28 million therms (2,839 million kBtu) in Minnesota. This equates to $142 million in cost savings for Minnesota businesses.
[32] Buildings Energy Data Book, Chapter 3: Commercial Sector. (http://buildingsdatabook.eren.doe.gov/ChapterIntro3.aspx)
[33] Kosar, D., “1001: High Efficiency Heating Rooftop Units”, prepared for the Nicor Gas Energy Efficiency Emerging Technology Program, November 2013.
[34] Studer et al., “Energy Implications of Retrofitting Retail Sector Rooftop Units with Stepped-Speed and Variable Speed Functionality”, NREL/TP-5500-51102, April 2012.

Commercial RTU in MN COMM- 20140512-86450 | March 2017 Seventhwave & CEE 89 | P a g e
CIP Recommendations
Opportunities
Manufacturers are offering new products and features that continually increase the available efficiency options for new RTUs. The main trend for increasing RTU energy performance is in increasing its part load efficiency through the use of variable speed and variable capacity components and associated controls. These systems have the added benefit of increased humidity control, thereby increasing occupant comfort as well as energy performance. Also, variable air volume capabilities, as opposed to the current standard constant volume systems, are becoming available on increasingly smaller capacities.
Table 26 summarizes other efficiency options now available.
Table 26: RTU efficiency options.
Efficiency Option Description Retrofit or Replacement?
Demand Control Ventilation
Reducing ventilation during unoccupied periods by using carbon dioxide or occupancy sensors thereby saving fan energy, as well as the energy needed to heat or cool the outside air Replacement
Improved Economizers
Ensuring that the outdoor air dampers do not let in unconditioned air when closed. Also ensuring that the economizer is working properly through advanced fault detection. Both
Casing Insulation
Properly insulating the RTU casing reduces heating and cooling loads to the building in a manner similar to roof insulation. Replacement
Efficient Supply Fan
Increased supply fan efficiency through improved blade design. Also direct drive motors reduce frictional losses as compared to belt driven fans, increasing overall fan system efficiency. Replacement
Condensing Gas-Fired Heat Exchanger
Capturing the latent heat in the combustion exhaust increases the heating efficiency of gas-fired RTUs to 90-95%. Replacement
Energy Recovery Ventilation
Utilizing a sensible or latent heat exchanger to recover energy from the exhaust air stream to preheat incoming ventilation air. Replacement

Commercial RTU in MN COMM- 20140512-86450 | March 2017 Seventhwave & CEE 90 | P a g e
Efficiency Option Description Retrofit or Replacement?
Evaporative Cooling
Adding evaporative cooling RTUs to increase cooling efficiency by allowing condensing temperatures to approach outside air wetbulb temperature as opposed to drybulb temperature. Both
Increasingly, sophisticated, intelligent controls are also being applied to RTUs. These controls are capable of precisely controlling RTU operation to optimize energy performance, as well as detect faults and alert maintenance staff to address degraded performance quickly.
Barriers
The most significant barrier to increased penetration of high performance RTUs is incremental cost. Building owners pursuing an RTU HVAC system are generally less interested in life cycle cost and more interested in capital cost. They therefore are less likely to view the investment in more efficient equipment as worthwhile.
For existing RTUs, there are two kinds of replacements; emergency and planned. Emergency replacements occur when an RTU fails unexpectedly, causing an immediate need for replacement to satisfy building occupant comfort requirements. For emergency replacements, tight timelines and restrictive budgets typically necessitate the standard efficiency option. Planned replacements are scheduled based on RTU life and facility budgeting cycles. Although there is more opportunity for improved efficiency under this scenario, tight budgets and restrictive specifications still limit its potential.
An additional barrier to increased penetration of higher efficiency RTUs is physical size. Higher efficiencies are often achieved through increased heat exchanger size. This often increases the overall size of the unit as well. For replacement RTUs, this can be a barrier as replacement RTUs may need to fit on the same curb or meet building code-imposed height constraints.
Finally, stakeholder’s lack of knowledge regarding RTU’s dynamic, evolving capabilities is a major barrier to increased penetration of high efficiency RTUs.
Recommendations
Due to the large HVAC market penetration of RTUs, increasing their efficiency has been a target of energy efficiency programs for many years. As RTU manufacturers develop increasingly complex efficiency capabilities, developing programs to reflect them is important.
Currently, the 2016 Minnesota TRM contains two RTU-related measures; cooling efficiency and economizer measures. Both of these measures focus on electric consumption savings. A review of Minnesota programs found prescriptive rebates available for RTU cooling efficiency, demand control ventilation, and energy recovery ventilation. Expanding the TRM to include a wider scope of RTU-related measures will aid in the development of more comprehensive RTU

Commercial RTU in MN COMM- 20140512-86450 | March 2017 Seventhwave & CEE 91 | P a g e
programs. A few examples of RTU programs outside of Minnesota, including several that address RTU controls, are shown in Table 27.
Table 27: Examples of RTU programs outside of Minnesota
Program Incentive Project requirements
Focus on Energy Rooftop Unit Optimization (Wisconsin)
Economizer
DCV
Programmable thermostat
Advanced programmable thermostat
$200
$350
$30
$80
Incentives for optimizing RTUs. DCV incentive available for single zone RTUs only.
ComEd Rooftop Unit Optimization (Illinois)
$100/ton Advanced control systems installed on existing packaged rooftop units from 7.5 to 25 tons serving constant volume HVAC systems.
Puget Sound Energy Rooftop Unit Premium Service (Washington)
$360 to $1,925 per unit serviced
Customer must use an approved contractor and the incentive is determined by facility type, size/tonnage of the unit and the types of diagnostic and/or system improvements and sensors that the service enables.
PGE Advanced Rooftop HVAC Controls (California)
$20 - $194/ton Retrofit an existing RTU with one of several advanced control options.
Save On Energy (Ontario) Varies based on size Replace RTU with high efficiency unit
The capital cost barrier is addressed programmatically through rebates to defer a portion of the incremental cost of higher efficiency units. Historically, these rebates have been based on exceeding a minimum full load efficiency. Since the trend in efficiency for RTUs is increasing part load efficiency, developing rebates based on IEER would be beneficial. Since cooling loads are frequently well below the peak, an RTU capable of variable capacity would spend considerable time each year operating at part load. The actual energy performance of the

Commercial RTU in MN COMM- 20140512-86450 | March 2017 Seventhwave & CEE 92 | P a g e
variable speed unit would be much better than the standard unit. For utility programs whose priority is annual energy savings, providing incentives for part load efficiency is a better approach. For utility programs whose priority is peak demand reduction, providing incentives for full load efficiency makes more sense.
Building owners and design teams have limited time and resources to spend on understanding and interfacing with utility efficiency programs. Therefore, clear and simple program requirements will increase program participation. Additional insights we gathered from our interviews with stakeholders include:
Recast rebates in units that are more understandable. Prescriptive rebates have traditionally been based on RTU cooling capacity (i.e. $75 per ton). This aligns well with the energy savings, which scale with cooling capacity. However, it is not a metric that most building owners understand. Potentially recasting rebates based on square foot would make the rebates more understandable from a program participant perspective. It can also be more readily incorporated into project budgeting as it sends a consistent, upfront signal. Note that the rebates may need to be specific to various building types and their relative cooling needs. However, the Minnesota TRM already has this type of information in its Equivalent Full Load cooling hours tables.
Reduce transactional costs of participating in programs, less time via less paperwork and more online, simple interactions.
Stabilize incentives as it is confusing to program participants and trade allies when incentives run out or change.
Educate trade allies such as manufacturers and distributors about the programs so that they can more easily embed program information into their process. They can be further supported with simple tools and calculators for calculating available rebates, as well as energy and utility cost savings.
Require some level of commissioning since expected RTU performance is often not achieved without proper commissioning. Requiring some level of commissioning, such as its inclusion in contractor report, will help ensure energy savings.
Ensure proper RTU installation to achieve expected levels of performance. The Air Conditioning Contractors of America have developed guidance for proper installation. [35] This standard also includes recommendations for owner training, which is important for ensuring persistence in high levels of energy performance and savings.
[35] ACCA Standard 5, 2010, Air Conditioning Contractors of America

Commercial RTU in MN COMM- 20140512-86450 | March 2017 Seventhwave & CEE 93 | P a g e
Future Work
There is considerable room for continued research on RTUs. We recognized a few specific issues during the course of our study.
It would be beneficial to measure a broader data set of system performances. Additional building types could be studied, including packaged systems not included in this study such as Dedicated Outdoor Air Systems and Makeup Air Units. Expanding the study to look at a widening variety of features and controls would also be of interest over the coming years, as they continue to gain market share

Appendix A: Sampling and Weighting
Commercial RTU in MN COMM- 20140512-86450 | March 2017 Seventhwave & CEE 94 | P a g e
Appendix A: Sampling and Weighting
The sample of buildings for the characterization study is based on a two-stage sample design that involved first selecting a random sample of ZIP codes in the state of Minnesota, then identifying and sampling commercial buildings with RTUs within each sampled ZIP code. Sampling at each stage was done with probability proportional to size (PPS), so that, in theory, any given RTU in the state has an equal probability of inclusion in the study. In practice, survey non-response and other factors created deviations from this goal. The details of sample selection and weighting are described in more detail in this appendix.
ZIP code sampling
The first step in the process was to draw a sample of ZIP Codes within the state to create an initial sample frame for which commercial buildings with RTUs could be enumerated for further subsampling. The basis for the ZIP Code sampling was the Census Bureau’s 2012 ZIP Code Business Patterns (ZBP) database, which provides a count of commercial establishments by ZIP code. [36] The sample frame was limited to the 337 (of 936 total) ZIP codes with at least 75 establishments, which comprise 91 percent of total 145,420 commercial establishments in the database. We also removed four ZIP codes in downtown Minneapolis that largely comprise high-rise office towers with a large number of businesses but for which an initial imagery review suggested very few RTUs. The final sample frame for ZIP Code selection thus included 333 ZIP Codes across the state comprising 88 percent of the state’s population of commercial establishments, per the ZBP database.
We then drew a PPS random sample of 50 ZIP codes (with replacement), with selection probability equal to ZBP number of commercial establishments in the ZIP code. This sample of ZIP codes formed the basis for further subsampling for the study. As described below, only 40 of the 50 originally-sampled ZIP codes were ultimately needed to complete the characterization survey, though the original sample of 50 is used to estimate the statewide total number of buildings with RTUs and total RTUs.
Initial Enumeration and Sampling of Buildings with RTUs
The next step in the process was to enumerate all buildings with RTUs in each of the 50 sampled ZIP codes. This was done visually using public aerial imagery (Google Earth and Bing) to find what appeared to be commercial rooftops with RTUs present. The land area for each ZIP code was systematically searched, and each commercial rooftop with one or more RTUs was place-marked, given an identification code, and the apparent number of RTUs on the rooftop was recorded. As described later, subsequent adjustments account for the fact that not every rooftop object identified at this stage was in fact an RTU.
[36] US Census County Business Patterns: 2012. (https://www.census.gov/data/datasets/2012/econ/cbp/2012-cbp.html)

Appendix A: Sampling and Weighting
Commercial RTU in MN COMM- 20140512-86450 | March 2017 Seventhwave & CEE 95 | P a g e
The enumeration process identified a total of 4,508 buildings across the 50 ZIP codes, with an initial count of 28,946 RTUs. An average of 90 buildings with RTUs were identified per ZIP code, but this ranged from as few as 2 in rural ZIP codes to more than 300 in urban ZIP codes. The number of preliminarily-identified RTUs per building at this stage averaged 6.4, with a range from 1 to 189.
From this enumeration list, a PPS sample (without replacement) of buildings was selected within each ZIP code. The measure of size for the PPS sampling was the number of RTUs recorded for the building from the imagery review. [37] The sampled number of buildings within a given ZIP code was the lesser of: (a) the total number of RTU buildings identified from the imagery review (i.e. a census of all RTU buildings in the ZIP code); or (b) 30 times the number of times the ZIP code was sampled in the first stage of sampling. In this manner, a total of 1,842 buildings with RTUs were sampled for the study. Of these, about a third came from ZIP codes where all buildings with RTUs were selected for the study, and 70 percent came from ZIP codes were a sample of RTU buildings was drawn. This collection of buildings comprised the starting sample for the telephone characterization survey of buildings.
Execution of the Telephone Survey
To execute the telephone survey, the list of sampled buildings was randomized, first by ZIP code, and then by building within ZIP code. Telephone interviewers worked through the list sequentially, attempting to complete two interviews per sampled ZIP code. An interviewer would attempt 3 calls to a building. If they were unable to connect with the building staff in this number of calls, that building was considered unreachable and the interviewer would move on to the next set of buildings. If two completions could not be obtained in a given ZIP code, the remainder of the sample quota was pushed to the next ZIP code.
A total of 101 survey completions were ultimately obtained in this manner, resulting in a response rate of approximately 6%. However, respondents for five interviewed buildings provided information that allowed us to determine that these buildings did not in fact have any RTUs. These buildings were dropped from the analysis (except for the purpose of determining the ratio of actual RTUs to imagery-determined RTUs, which we used for estimating the total number of RTUs in the state). In addition, nine respondents did not provide sufficient information to determine if they actually had any RTUs: these buildings were dropped from the study entirely.
This left a total of 87 respondents, of which 81 provided information about the building and at least some of the RTUs on the building, and six were able to provide information only about the building, and were not able to provide details about their RTUs.
[37] For technical reasons, the PPS sampling at this stage, which we implemented using the gsample add-in for Stata, Version 13.1, would not work if the range of RTU counts per building in a ZIP code was large. In these cases we compressed the range of weights to the point where sampling could proceed.

Appendix A: Sampling and Weighting
Commercial RTU in MN COMM- 20140512-86450 | March 2017 Seventhwave & CEE 96 | P a g e
Case Weights
For analysis, case weights were developed and applied to account for the sample design, and to reflect the best estimate of the population from which the sample was drawn. Two sets of case weights are used in this report: one at the building level, to represent the total number of buildings in the statewide population of buildings with RTUs; and the other to represent the total number of RTUs statewide represented by a given RTU for which information was gathered in the telephone survey.
The building weights are a combination of the inverse of the probability of selection of the ZIP code at the first stage of sampling and of selecting an individual building within a ZIP code at the second stage. For survey respondent j in ZIP code i, the case weight is calculated as:
𝐵𝑢𝑖𝑙𝑑𝑖𝑛𝑔 𝑤𝑒𝑖𝑔ℎ𝑡𝑖 = [(∑ 𝐸𝑖
𝑁𝑧𝑖𝑝
𝑖=1
𝐸𝑖) ∗ (
1
40) ] ∗ [(
∑ 𝑅𝑇𝑈𝑠𝑗
𝑁𝑏𝑙𝑑𝑔𝑠𝑖
𝑗=1
𝑅𝑇𝑈𝑠𝑗) ∗ (
1
87) ]
where:
Ei is the Census number of commercial establishments in ZIP code i
Nzip is the total number of ZIP codes in the Census database
40 is the number of ZIP codes represented in the final survey dataset
RTUsj is the number of RTUs initially identified for the jth survey respondent
Nbldgsi is the total number of commercial buildings with RTUs identified in ZIP code i
87 is the total number of survey respondents with RTUs in the study
PPS sampling in complex survey designs sometimes leads to large differentials in weights, which can be problematic in later analysis. To avoid these problems, we applied a weight trimming procedure to limit the range of weights in the survey sample. The procedure substituted the weight of the next lowest case for cases where the initial weight exceeded five times the median weight, which affected 3 cases. A similar trim for weights that were less than one-fifth of the median weight affected one case.
We then scaled all of the building weights to reflect our best estimate of the total number of commercial buildings with RTUs in the state. This estimate is derived from a weighted estimate of the ratio of imagery-determined buildings with RTUs to Census commercial establishments at the first-stage sample of 50 ZIP codes (adjusted to account for the fact that five of 87 buildings that were surveyed were determined not to have any RTUs). When applied to the ZBP-database count of 145,420 commercial establishments, the estimate works out to 20,700 statewide buildings with RTUs, with a 95 percent confidence interval of ± 3,100 buildings. Final building-level weights were scaled to this value: the weights had a mean of about 238 and a range from 42 to 797.
Information about individual RTUs was sometimes provided by survey respondents for all units associated with the building, but was sometimes provided for only some units—and, as

Appendix A: Sampling and Weighting
Commercial RTU in MN COMM- 20140512-86450 | March 2017 Seventhwave & CEE 97 | P a g e
noted above, six respondents provided no information about their RTUs. For analyzing and reporting characteristics about RTUs, an RTU-level weight was developed. For all RTUs with reported information in Building i, the RTU weight is calculated as:
𝑅𝑇𝑈 𝑤𝑒𝑖𝑔ℎ𝑡 = 𝐵𝑢𝑖𝑙𝑑𝑖𝑛𝑔 𝑤𝑒𝑖𝑔ℎ𝑡𝑖 (𝑇𝑜𝑡𝑎𝑙 𝑅𝑇𝑈𝑠𝑖
𝑅𝑒𝑝𝑜𝑟𝑡𝑒𝑑 𝑅𝑇𝑈𝑠𝑖)
These weights were scaled to account for the six survey respondents that did not report any RTU information, and were trimmed to be within a factor of five of the median weight. , We also scaled the weights to our best estimate of the total number of RTUs in the state. For the this, we used the weighted survey dataset to get a ratio estimate of actual RTUs to imagery-based counts of RTUs from the final survey sample, and then applied this ratio to an extrapolated statewide estimate of total imagery-based RTU counts from the n=50 ZIP code sample. [38] The analysis indicated a total of 136,000 ± 30,000 RTUs in the state. RTU-level weights were scaled to match this total.
[38] For the survey-based ratio estimate, we omitted 11 cases where the survey respondent did not speak for the entire building: these were mostly strip malls, for which the interview was conducted with the proprietor for only one of multiple businesses.

Appendix B: Building Staff Interview
Commercial RTU in MN COMM- 20140512-86450 | March 2017 Seventhwave & CEE 98 | P a g e
Appendix B: Building Staff Interview
Building Information
1. What is your building’s age? (approximate OK) _____ years
2. What is your building’s total area? (approximate OK) _____ square feet
3. What is your building’s Ownership structure?
□ Owner Occupied □ Leased □ Public □ Other: ___________________
4. If your building has multiple tenants/businesses, how many? ____ tenants
5. What kind of commercial activity is conducted in your building? (to clarify: the most applicable for the
largest square footage) (open-ended)
5a: Category ** (to be filled out by interviewer following the interview):
□ Education □ Food Sales □ Food Service □ Health Care (Inpatient) □ Health Care (Outpatient) □ Lodging □ Mercantile (Retail Other Than Mall) □ Mercantile (Enclosed and Strip Malls) □ Office □ Public Assembly □ Public Order and Safety □ Religious Worship □ Service □ Warehouse and Storage □ Other □ Vacant
6. What hours of the day is the building open? Or what hours are there people in your building (i.e., during what times do HVAC systems need to keep the building comfortable?)?
Weekday: Begin Time _____ End Time _____
Saturday: Begin Time _____ End Time _____
Sunday: Begin Time _____ End Time _____
7. On a typical day, approximately how many people are in your building when it is most full?
8. Are you aware of any noise complaints specific to your building’s RTUs?
□ Yes, Description:______________________________________ □ No

Appendix B: Building Staff Interview
Commercial RTU in MN COMM- 20140512-86450 | March 2017 Seventhwave & CEE 99 | P a g e
9. Are you aware of any comfort complaints from occupants of this building?
□ Yes, Description:______________________________________ □ No
10. Are there other HVAC systems serving large portions of this building?
□ Yes □ Description:______________________________________
Rooftop Unit Information
13. How many RTUs are on your building?
13a. About how old are they? Are they all about the same age?
13b. Do any of the RTUs serve multiple zones? (i.e., are there any spaces served by a rooftop unit that do not have a thermostat controlling that unit?)
14. Who maintains the Rooftop Units?
□ Owner □ Contracted vendor □ We call vendor when there is an issue □ Other: ______________
15. Which of the following maintenance procedures do you do (or have someone else do) on the RTUs?
□ Winter Startup □ Summer Startup □ Additional filter replacement Frequency:___________ months □ Clean Compressors Frequency:___________ months □ Other: ___________ Frequency:___________ months
16. We are done with the high level questions and my next questions focus on details specific to the building’s RTUs. This information is summarized in a few different places, like the Rooftop Unit Schedule in the building’s mechanical drawings or on the units themselves. Were you able to get any of these documents to have on hand for this interview? [if contact doesn’t know about the RTU schedule, then suggest:] The make and model number would be useful too. If it would be easier for you, you could fax the RTU schedule or make/model to us.

Appendix C: Literature Review
Commercial RTU in MN COMM- 20140512-86450 | March 2017 Seventhwave & CEE 100 | P a g e
Appendix C: Literature Review
The following annotated bibliography represents a sample of the literature we reviewed in the course of this project and provides additional information related to RTUs.
AE 2012. Commercial Rooftop Unit Optimization Product Literature Review: Retrofit Devices for Single-Zone Rooftop Units. Advanced Energy. 2012.
A review of manufacturing marketing literature for three RTU retrofit devices.
ACHR 2015. Predicting the Future of RTUs. The Air Conditioning Heating Refrigeration News, June 15, 2015.
RTU manufacturers discuss changes and improvements to increase system efficiency. These improvements include enhanced IAQ (dehumidification and ventilation control), enhanced controls, improved energy efficiency and recovery, as well as increased connectivity. They’re also making systems easier to install and maintain. Finally, there is an increasing focus on part load efficiency, i.e. compressor staging, variable-speed compressors.
ACHR 2016. DOE Sets ‘Groundbreaking’ Rooftop Unit Standards. The Air Conditioning Heating Refrigeration News, January 18, 2016.
DOE released a new set of standards requiring approximately a 10 percent increase in RTU minimum efficiency by January 2018 and between 25-30 percent increases by January 2023. These upgrades will save an owner of a typical commercial building between $4,200 and $10,100 over the lifetime of the RTU.
CARD 2014. Advanced Rooftop Unit HVAC Controls Pilot. Center for Energy and Environment and PECI. 2014.
Results of a study evaluating three advance control optimizers and their potential to save energy in a non-cooling dominated climate.
CEE 2016. High Efficiency Commercial Air-conditioning and Heat Pumps Initiative. Consortium for Energy Efficiency. 2016.
A summary of CEE’s initiative to increase the availability of high efficiency commercial unitary air conditioners and heat pumps, and to encourage efficient upgrades to these systems across the North American market.
Cherniack 2013. Rooftop Units Fault Detection and Diagnostics. California Energy Commission.
A summary of the results of a project conducted for the California Energy Commission’s evidence-based design and operation research program. The project goals were to develop software for evaluating diagnostic protocols that identify and measure operating faults in RTUs, assess the market availability, usability and cost of Fault Detection and Diagnosis (FDD) products and propose a minimum standard for FDD functionality.
DOE 2016. 2016-01-15 Energy Conservation Program for Certain Industrial Equipment: Energy Conservation Standards for Small, Large, and Very Large Air-Cooled Commercial Package Air Conditioning and Heating Equipment and Commercial Warm Air Furnaces; Direct final rule. Federal Register, 81:10, January 15, 2016.

Appendix C: Literature Review
Commercial RTU in MN COMM- 20140512-86450 | March 2017 Seventhwave & CEE 101 | P a g e
Published amended minimum efficiency standards for RTUs.
Faramarzi 2004. Performance Evaluation of Rooftop Air Conditioning Units at High Ambient Temperatures. 2004 ACEEE Summer Study on Energy Efficiency in Buildings, 3-52.
Laboratory testing was used to quantify the impact of high ambient temperatures on the electric demand and cooling efficiency of five-ton RTUs.
Heinemeier 2014. Free Cooling: At What Cost? 2014 ACEEE Summer Study on Energy Efficiency in Buildings, 3-121.
Survey of California contractors found that 30-40 percent of the time, the economizer is disabled and the outside air dampers are closed, thereby eliminating associated cooling energy savings.
NICOR 2013. 1001: High Efficiency Heating Rooftop Units (RTUs) Public Project Report. Nicor Gas Energy Efficiency Emerging Technology Program.
Results of a pilot test of a higher efficiency, condensing RTU in a big box retail store in the Chicago area.
PECI 2011. Unitary HVAC Premium Ventilation Upgrade. ASHRAE Winter Conference Technical Program. Las Vegas, NV. 2011.
Field surveys of RTUs have found that, while the units are maintaining building comfort, most of them have performance issues that result in poor ventilation and inefficient energy use. These performance problems include outside air economizers that don’t work effectively, incorrect refrigerant charge, and fans either running when not needed or not running when needed.
PECI 2012. Advanced Unitary HVAC Control Sequence. ASHRAE Transactions, Vol. 118, Issue 1. 2012.
Details on a field-tested advanced sequence of operation using three different BACnet controllers to improve ventilation and energy savings for RTUs.
PNNL 2011. Energy Savings and Economics of Advanced Control Strategies for Packaged Air-Conditioning Units with Gas Heat (PNNL-20955). Pacific Northwest National Laboratory. 2011.
An evaluation of strategies that can be implemented in a controller to retrofit an existing RTU and improve its operational efficiency.
PNNL 2013a. Part-load Performance Characterization and Energy Savings Potential of the RTU Challenge Unit: Daikin Rebel (PNNL-22720). Pacific Northwest National Laboratory. 2013.
Documents the development of part-load performance curves to use with EnergyPlus to estimate the potential savings from Daikin Rebel units (the first RTU to meet DOE’s RTU Challenge specification) compared to standard RTUs.
PNNL 2013b. Advanced Rooftop Control (ARC) Retrofit: Field-Test Results (PNNL-22656). Pacific Northwest National Laboratory. 2013.
A multi-year research project to determine the magnitude of energy savings from retrofitting RTUs with advanced control strategies not ordinarily applied to RTUs.

Appendix C: Literature Review
Commercial RTU in MN COMM- 20140512-86450 | March 2017 Seventhwave & CEE 102 | P a g e
PNNL 2014. RTU Comparison Calculator Enhancement Plan (PNNL-23239). Pacific Northwest National Laboratory. 2014.
Documents the enhancements needed to the RTU comparison calculator to support estimating savings from products meeting the RTU Challenge (an IEER of 18) or using advanced controls on existing RTUs.
Purdue 2014. Workshop on FDD for RTUs – Moving from R&D to Commercialization. Purdue University. 2014.
Workshop on the status of FDD products for RTUs and strategies for accelerating commercialization of these tools.
SDGE 2013. Multi-vendor RTU Retrofit Controller Field Study Final Report. San Diego Gas and Electric Company Emerging Technologies Program. 2013.
Results of testing four different retrofit RTU controllers on 7.5 ton heat pumps on a building in San Diego.

Appendix D: In-Depth Site Assessment Form
Commercial RTU in MN COMM- 20140512-86450 | March 2017 Seventhwave & CEE 103 | P a g e
Appendix D: In-Depth Site Assessment Form
Figure 53: In Depth Site Assessment Form, Page 1

Appendix D: In-Depth Site Assessment Form
Commercial RTU in MN COMM- 20140512-86450 | March 2017 Seventhwave & CEE 104 | P a g e
Figure 54: In Depth Site Assessment Form, Page 2

Appendix E: Monitored Site Details
Commercial RTU in MN COMM- 20140512-86450 | March 2017 Seventhwave & CEE 105 | P a g e
Appendix E: Monitored Site Details
Site: DAV
Table 28: Site DAV RTU Information
RTU #
Manufacturer Space type Tonnage Est MFG Date
Model # Heating stages
Cooling stages
1 Carrier restaurant 5 2007 48TFE006---511-- 1 1
2 Carrier kitchen 10 2006 48TFE012---511-- 2 2
3 Carrier restaurant 5 2007 48HJE006---351-- 1 1
The DAV site is 6,600 square foot restaurant that is conditioned by three RTUs. The space has a mixture of dining space and a kitchen. Occupancy spikes during dining times and weekends, and is fairly consistent in-between but can be sporadic.
The RTUs are all Carrier units ranging from 5 to 10 tons and are all roughly 10 years old. They are all constant volume packaged systems with economizers. All of the units at this site have an additional controller on the economizer for advanced control. Each RTU is controlled by a programmable thermostat. They are all programmed to match the occupied hours of the site, which are consistent throughout the building. The settings are listed below:
Table 29: Site DAV Thermostat Settings
Heat Setpoint: 68 Cool Setpoint: 72
Heat Setback: 62 Cool Setback: 82
Occupied Times: 7:15-23:00 Occupied Days: Mon-Sun
Occupied Fan: On

Appendix E: Monitored Site Details
Commercial RTU in MN COMM- 20140512-86450 | March 2017 Seventhwave & CEE 106 | P a g e
Figure 55: Site DAV Roof Image
Site: CAP
Table 30: Site CAP RTU Information
RTU #
Manufacturer Space type
Tonnage Est MFG Date
Model # Heating stages
Cooling stages
1 Carrier office 7.5 2006 48TFE008-A-511-- 2 2
The CAP site is a 4,400 square foot office building that is conditioned by one RTU. The space is all office space and occupancy is very consistent. The RTU is a 7.5 ton Carrier unit and is a constant volume packaged system with an economizer. There are four different zones, with four programmable thermostats located in different parts of the building. The setpoints vary quite a bit across the thermostats, as they are adjusted frequently by the occupants. Typical settings are listed below:
Table 31: Site CAP Thermostat Settings
Heat Setpoint: 73 Cool Setpoint: 75
Heat Setback: 64 Cool Setback: 78
Occupied Times: 6:30-18:00 Occupied Days: Mon-Fri
Occupied Fan: On *Settings Vary

Appendix E: Monitored Site Details
Commercial RTU in MN COMM- 20140512-86450 | March 2017 Seventhwave & CEE 107 | P a g e
Figure 56: Site CAP Roof Image
Site: SEW
Table 32: Site SEW RTU Information
RTU #
Manufacturer Space type
Tonnage Est MFG Date
Model # Heating stages
Cooling stages
1 Lennox office 6 2010 LGH072H4BH1G 2 1
2 Lennox office 7.5 2011 LGH092H4BH1G 2 2
3 Lennox office 7.5 2011 LGH092H4BH1G 2 2
4 Lennox office 6 2011 LGH072H4BH1G 2 1
The Sew site is a 12,600 square foot office building that is conditioned by four RTUs. It is mostly office space and cubicles with a few small conference rooms. The space is occupied by 3 separate businesses and has very consistent occupancy. It is part of a larger building and has a single shared wall on the West side.
The RTUs are all newer Lennox units ranging from 6 to 7.5 tons. All units are constant volume packaged systems with an economizer. They are all controlled by programmable thermostats that have varied settings. Typical settings are listed below:

Appendix E: Monitored Site Details
Commercial RTU in MN COMM- 20140512-86450 | March 2017 Seventhwave & CEE 108 | P a g e
Table 33: Site SEW Thermostat Settings
Heat Setpoint: 72 Cool Setpoint: 75
Heat Setback: 68 Cool Setback: 78
Occupied Times: 6:30-20:00 Occupied Days: Mon-Sun
Occupied Fan: Auto *Settings vary
Figure 57: Site SEW Roof Image

Appendix E: Monitored Site Details
Commercial RTU in MN COMM- 20140512-86450 | March 2017 Seventhwave & CEE 109 | P a g e
Site: NUR
Table 34: Site NUR RTU Information
RTU #
Manufacturer Space type Tonnage Est MFG Date
Model # Heating stages
Cooling stages
1 Carrier conference 4 2008 48HJE005---651-- 2 1
2 Carrier conference 4 2009 48HJE005---651-- 2 1
3 Carrier conference 4 2008 48HJE005---651-- 2 1
4 Carrier office 7.5 2009 48TME008-A-
601-- 2 2
5 Carrier office 5 2009 48HJE006---641-- 2 1
6 Carrier office 7.5 2009 48TME008-A-
601-- 2 2
7 Carrier office 7.5 2009 48TME008-A-
601-- 2 2
8 Carrier office 5 2009 48HJE006---641-- 2 1
9 Carrier office 7.5 2009 48TME008-A-
601-- 1 2
The NUR site is a 20,000 square foot office building that is conditioned by nine RTUs. It is a part of a shared building and has a common wall on the North side of the space. It is a mixture of offices, cubicles, and conference rooms. RTUs 1 through 3 serve a large conference room that has movable partitions to section off the room.
All of the RTUs are packaged constant volume packaged systems with an economizer. Each unit has a programmable thermostat that is not programmed with a setback temperature. The settings are listed below:
Table 35: Site NUR Thermostat Settings
Heat Setpoint: 72 Cool Setpoint: 74
Heat Setback: 72 Cool Setback: 74
Occupied Times: 6:00-18:00 Occupied Days: Mon-Sun
Occupied Fan: Auto

Appendix E: Monitored Site Details
Commercial RTU in MN COMM- 20140512-86450 | March 2017 Seventhwave & CEE 110 | P a g e
Figure 58: Site NUR Roof Image

Appendix E: Monitored Site Details
Commercial RTU in MN COMM- 20140512-86450 | March 2017 Seventhwave & CEE 111 | P a g e
Site: TFB
Table 36: Site TFB RTU Information
RTU #
Manufacturer Space type
Tonnage Est MFG Date
Model # Heating stages
Cooling stages
1 Carrier office 6 2005 48TFE007---611-- 1 1
2 Carrier office 10 2005 48TFE012---611-- 2 2
3 Carrier office 6 2005 48TFE007---611-- 1 1
4 Trane office N/A N/A N/A 2 1
5 Trane office 15 1993 YC0180B4LGCA 2 2
6 Trane office 10 1993 YC0120B4LGCA 2 2
7 Carrier office 3 2011 48HCEA04A2A6A0A0A0 2 1
8 Trane office N/A N/A N/A 1 1
9 Carrier office 15 2013 48TCED16A2A6A0A0A0 2 2
10 Carrier office 5 2005 48TFE006---611-- 1 1
11 Carrier office 5 2005 48TFE006---611-- 1 1
12 Trane office N/A N/A N/A 1 1
13 Carrier office 3 2013 48HCEA04A2A6A0A0A0 2 1
14 Trane office N/A N/A N/A 1 1
15 Lennox office 5 2011 LGH060H4EH1G 2 1
16 Lennox office 6 2011 LGH072H4BH1G 2 1
17 Carrier office 4 2005 48TFE005---611-- 1 1
18 Lennox office 12.5 2011 LGH150S4BH1G 2 2
The TFB site is a 49,000 square foot office building that is served by 18 RTUs. The space is a mixture of offices, cubicles and small conference rooms. It is the largest site in the project.
The RTUs vary widely in terms of manufacturer, size, and age. All units are constant volume packaged systems and have economizers. Some of the older units had faded nameplates so

Appendix E: Monitored Site Details
Commercial RTU in MN COMM- 20140512-86450 | March 2017 Seventhwave & CEE 112 | P a g e
exact model information was not available. Each RTU has a networked thermostat and all settings are identical, which are shown below:
Table 37: Site TFB Thermostat Settings
Heat Setpoint: 72 Cool Setpoint: 75
Heat Setback: 65 Cool Setback: 77
Occupied Times: 7:00-17:00 Occupied Days: Mon-Fri
Occupied Fan: On
Figure 59: Site TFB Roof Image

Appendix E: Monitored Site Details
Commercial RTU in MN COMM- 20140512-86450 | March 2017 Seventhwave & CEE 113 | P a g e
Site: ABS
Table 38: Site ABS RTU Information
RTU #
Manufacturer Space type Tonnage Est MFG Date
Model # Heating stages
Cooling stages
1 Lennox Office 3 1996 GCS20-411-100-1P 1 1
2 Lennox Office 3 1996 GCS20-411-100-1P 1 1
3 Lennox Office 4.5 1996 GCS16-651-125-6P 1 1
The ABS site is a 6,200 square foot space that is part of a larger building with multiple businesses. It is sandwiched in-between two different spaces so it has two common walls, on the North and South end. Occupancy is very consistent throughout the space.
All of the RTUs are 20+ years old Lennox units that are packaged and constant volume. None of the units are equipped with an economizer, and have a small opening near the supply fan to allow in outside air. Thermostat settings are identical across all of the RTUs and are listed below:
Table 39: Site ABS Thermostat Settings
Heat Setpoint: 67 Cool Setpoint: 73
Heat Setback: 62 Cool Setback: 80
Occupied Times: 5:00-18:00 Occupied Days: Mon-Fri
Occupied Fan: On

Appendix E: Monitored Site Details
Commercial RTU in MN COMM- 20140512-86450 | March 2017 Seventhwave & CEE 114 | P a g e
Figure 60: Site ABS Roof Image

Appendix E: Monitored Site Details
Commercial RTU in MN COMM- 20140512-86450 | March 2017 Seventhwave & CEE 115 | P a g e
Site: CHO
Table 40: Site CHO RTU Information
RTU #
Manufacturer Space type Tonnage Est MFG Date
Model # Heating stages
Cooling stages
1 Lennox Office 3 1996 GCS20-411-100-1P 1 1
2 Lennox Office 3 1996 GCS20-411-100-1P 1 1
3 Lennox Office 3 1996 GCS20-411-100-1P 1 1
4 Bryant Office 3 2009 581BJV036072AJ-- 1 1
The CHO site is a 6,200 square foot space that is conditioned by four RTUs. It is part of a shared building and has a shared wall on the South side. Occupancy is fairly consistent throughout the space. The tenant at this site unexpectedly moved out in early February, and it remained unoccupied through the duration of the project.
Three of the RTUs are old Lennox units and one newer Bryant unit. None of the units are equipped with an economizer, and have a small opening near the supply fan to allow in outside air. Thermostat settings are identical across all of the RTUs and are listed below:
Table 41: Site CHO Thermostat Settings
Heat Setpoint: 70 Cool Setpoint: 72
Heat Setback: 62 Cool Setback: 85
Occupied Times: 8:00-18:00 Occupied Days: Mon-Sun
Occupied Fan: Auto

Appendix E: Monitored Site Details
Commercial RTU in MN COMM- 20140512-86450 | March 2017 Seventhwave & CEE 116 | P a g e
Figure 61: Site CHO Roof Image

Appendix E: Monitored Site Details
Commercial RTU in MN COMM- 20140512-86450 | March 2017 Seventhwave & CEE 117 | P a g e
Site: OUT
Table 42: Site OUT RTU Information
RTU #
Manufacturer Space type
Tonnage Est MFG Date
Model # Heating stages
Cooling stages
1 Lennox Office N/A N/A N/A 1 1
2 Lennox Office 3 N/A GCS20-411-100-1P 1 1
3 Lennox Office 4.5 1996 GCS20-651-125-2P 1 1
4 Lennox Office 3 1996 GCS20-411-100-1P 1 1
The OUT site is an 8,500 square foot space that is part of a larger building with multiple businesses. It has a shared wall and is on the West side and is conditioned by four RTUs
All of the RTUs are 20+ years old Lennox units that are packaged and constant volume. None of the units are equipped with an economizer, and have a small opening near the supply fan to allow in outside air. This site is the only one that did not have programmable thermostats. Settings were not consistent throughout the project, as tenants adjusted them frequently. An example of a typical thermostat is listed below:
Table 43: Site OUT Thermostat Settings
Heat Setpoint: 70 Cool Setpoint: 72
Heat Setback: N/A Cool Setback: N/A
Occupied Times N/A Occupied Days: N/A
Occupied Fan: N/A

Appendix E: Monitored Site Details
Commercial RTU in MN COMM- 20140512-86450 | March 2017 Seventhwave & CEE 118 | P a g e
Figure 62: Site OUT Roof Image

Appendix E: Monitored Site Details
Commercial RTU in MN COMM- 20140512-86450 | March 2017 Seventhwave & CEE 119 | P a g e
Site: CWC
Table 44: Site CWC RTU Information
RTU #
Manufacturer Space type Tonnage Est MFG Date
Model # Heating stages
Cooling stages
1 Carrier Classroom 7.5 2008 48TMT008---501HS 2 2
2 Carrier Church 10 2008 48TMT012---501HS 2 2
3 Carrier Church 12.5 2008 48TMR014-A-501HS 2 2
4 Carrier Office 3 2008 48TMT004-A-501AP 2 1
5 Carrier Classroom 10 2013 48TCFD12A2A5A0A0A0 2 2
6 Carrier Classroom 10 2013 48TCFD12A2A5A0A0A0 2 2
The CWC site is a 17,000 square foot church that is conditioned by six RTUs. The space is a mixture of office, classroom and auditorium style rooms. There are four RTUs on the roof that serve the east half of the building, which includes the office, a small classroom and the church. Two of the RTUs are sitting on the ground in the back of the building and serve the West half of the building.
The RTUs are all Carrier units ranging from 3 to 12.5 tons. They are all constant volume packaged systems and all but one has an economizer. Each RTU is controlled by a programmable thermostat. They are all programmed to match the occupied hours of the site, which are fairly consistent throughout the building. The occupied times and number of occupants vary much more than the typical site, in that the building sees large swings of people for church services and is only occupied by a few people during regular occupied hours. An example of the settings is listed below:
Table 45: Site CWC Thermostat Settings
Heat Setpoint: 68 Cool Setpoint: 72
Heat Setback: 66 Cool Setback: 76
Occupied Times: 8:15-20:00 Occupied Days: Mon-Sun
Occupied Fan: Auto *Settings Vary

Appendix E: Monitored Site Details
Commercial RTU in MN COMM- 20140512-86450 | March 2017 Seventhwave & CEE 120 | P a g e
Figure 63: Site CWC Roof Image