Embed Size (px)
Citation preview
COMPANY
REPORT
November 15, 2012
Commercial Engineers & Body Builders Co. Ltd.
Multi-year play on FBV conversion
COMPANY
REPORT
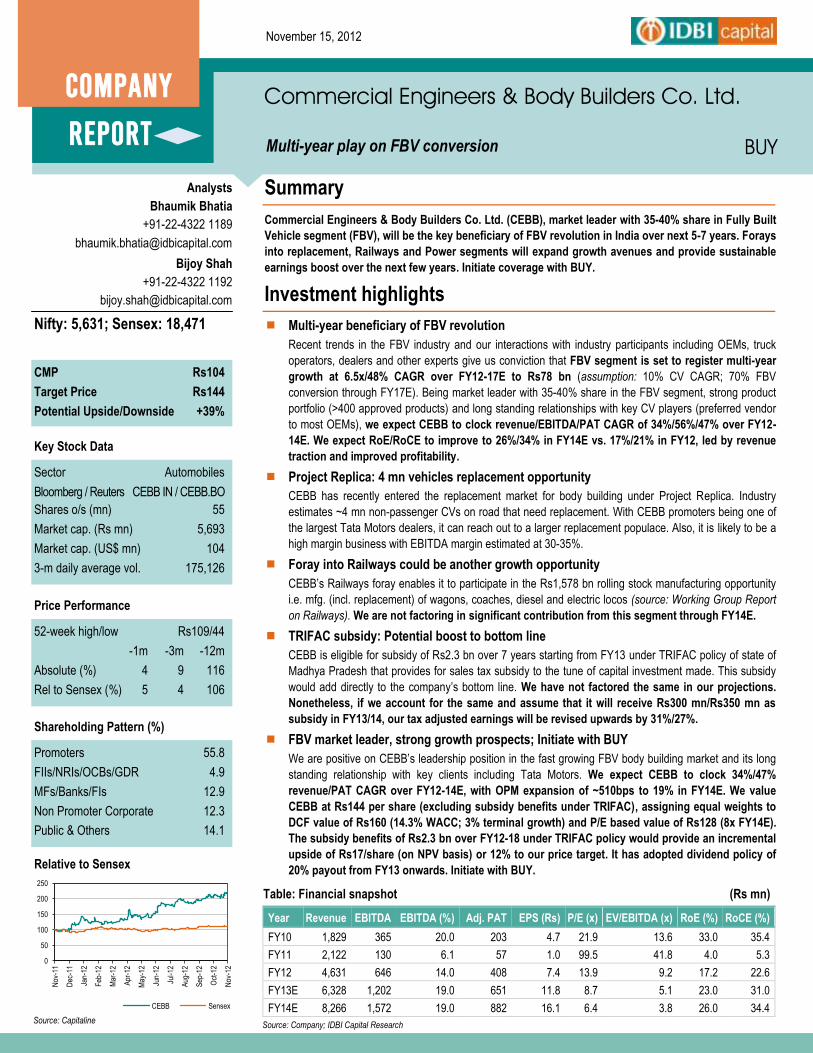
CMP Rs104
Target Price Rs144
Potential Upside/Downside +39%
Relative to Sensex
Summary
Commercial Engineers & Body Builders Co. Ltd. (CEBB), market leader with 35-40% share in Fully Built
Vehicle segment (FBV), will be the key beneficiary of FBV revolution in India over next 5-7 years. Forays
into replacement, Railways and Power segments will expand growth avenues and provide sustainable
earnings boost over the next few years. Initiate coverage with BUY.
Investment highlights
Multi-year beneficiary of FBV revolution
Recent trends in the FBV industry and our interactions with industry participants including OEMs, truck
operators, dealers and other experts give us conviction that FBV segment is set to register multi-year
growth at 6.5x/48% CAGR over FY12-17E to Rs78 bn (assumption: 10% CV CAGR; 70% FBV
conversion through FY17E). Being market leader with 35-40% share in the FBV segment, strong product
portfolio (>400 approved products) and long standing relationships with key CV players (preferred vendor
to most OEMs), we expect CEBB to clock revenue/EBITDA/PAT CAGR of 34%/56%/47% over FY12-
14E. We expect RoE/RoCE to improve to 26%/34% in FY14E vs. 17%/21% in FY12, led by revenue
traction and improved profitability.
Project Replica: 4 mn vehicles replacement opportunity
CEBB has recently entered the replacement market for body building under Project Replica. Industry
estimates ~4 mn non-passenger CVs on road that need replacement. With CEBB promoters being one of
the largest Tata Motors dealers, it can reach out to a larger replacement populace. Also, it is likely to be a
high margin business with EBITDA margin estimated at 30-35%.
Foray into Railways could be another growth opportunity
CEBB’s Railways foray enables it to participate in the Rs1,578 bn rolling stock manufacturing opportunity
i.e. mfg. (incl. replacement) of wagons, coaches, diesel and electric locos (source: Working Group Report
on Railways). We are not factoring in significant contribution from this segment through FY14E.
TRIFAC subsidy: Potential boost to bottom line
CEBB is eligible for subsidy of Rs2.3 bn over 7 years starting from FY13 under TRIFAC policy of state of
Madhya Pradesh that provides for sales tax subsidy to the tune of capital investment made. This subsidy
would add directly to the company’s bottom line. We have not factored the same in our projections.
Nonetheless, if we account for the same and assume that it will receive Rs300 mn/Rs350 mn as
subsidy in FY13/14, our tax adjusted earnings will be revised upwards by 31%/27%.
FBV market leader, strong growth prospects; Initiate with BUY
We are positive on CEBB’s leadership position in the fast growing FBV body building market and its long
standing relationship with key clients including Tata Motors. We expect CEBB to clock 34%/47%
revenue/PAT CAGR over FY12-14E, with OPM expansion of ~510bps to 19% in FY14E. We value
CEBB at Rs144 per share (excluding subsidy benefits under TRIFAC), assigning equal weights to
DCF value of Rs160 (14.3% WACC; 3% terminal growth) and P/E based value of Rs128 (8x FY14E).
The subsidy benefits of Rs2.3 bn over FY12-18 under TRIFAC policy would provide an incremental
upside of Rs17/share (on NPV basis) or 12% to our price target. It has adopted dividend policy of
20% payout from FY13 onwards. Initiate with BUY.
Source: Capitaline
BUY
Nifty: 5,631; Sensex: 18,471
Analysts
Bhaumik Bhatia
+91-22-4322 1189
Sector Automobiles
Bloomberg / Reuters CEBB IN / CEBB.BO
Shares o/s (mn) 55
Market cap. (Rs mn) 5,693
Market cap. (US$ mn) 104
3-m daily average vol. 175,126
Key Stock Data
52-week high/low Rs109/44
-1m -3m -12m
Absolute (%) 4 9 116
Rel to Sensex (%) 5 4 106
Price Performance
Promoters 55.8
FIIs/NRIs/OCBs/GDR 4.9
MFs/Banks/FIs 12.9
Non Promoter Corporate 12.3
Public & Others 14.1
Shareholding Pattern (%)
Table: Financial snapshot (Rs mn)
Year Revenue EBITDA EBITDA (%) Adj. PAT EPS (Rs) P/E (x) EV/EBITDA (x) RoE (%) RoCE (%)
FY10 1,829 365 20.0 203 4.7 21.9 13.6 33.0 35.4
FY11 2,122 130 6.1 57 1.0 99.5 41.8 4.0 5.3
FY12 4,631 646 14.0 408 7.4 13.9 9.2 17.2 22.6
FY13E 6,328 1,202 19.0 651 11.8 8.7 5.1 23.0 31.0
FY14E 8,266 1,572 19.0 882 16.1 6.4 3.8 26.0 34.4
Source: Company; IDBI Capital Research
0
50
100
150
200
250
Nov
-11
Dec
-11
Jan-
12
Feb
-12
Mar
-12
Apr
-12
May
-12
Jun-
12
Jul-1
2
Aug
-12
Sep
-12
Oct
-12
Nov
-12
CEBB Sensex
Bijoy Shah
+91-22-4322 1192

2
Company Report – Commercial Engineers & Body Builders Co. Ltd.
Investment rationale
FBV conversion picking up pace
Though there is no authorised data, which gives the number of non-passenger CVs (largely MHCVs) being sold as
Fully Built Vehicles (FBV) as against the traditional approach of OEMs selling chassis based truck to the truck
operator, recent trends and our interactions with various industry participants including OEMs, truck operators, dealers
and other industry experts indicate that proportion of FBVs in overall truck sales is rising at a fast clip. Industry pegs
organised FBV industry at ~60,000 units in FY12, with organised FBV share having gone up to 20% in FY12 from 10%
in FY10. This is significant as even if hypothetically, the truck demand in India had not grown during FY10-12 (actual
growth of 22% CAGR), the FBV players would still have seen 41% CAGR, led only by increased FBV share. This in
turn indicates that FBV segment is relatively immune from an otherwise cyclical nature of truck industry.
Let’s try and understand with an example, why there is a visibly increased preference towards FBVs. For ease of
understanding, let’s assume cost of truck chassis at Rs1 mn and cost of body building by local mechanic at Rs0.175
mn and by organised FBV player at Rs0.225 mn. Truck operator can avail the following benefits if he goes for an FBV:
Funding: Full funding on FBV (chassis + body = Rs1.225 mn) vs. funding on only chassis (Rs1 mn) and partial
high cost funding of body if body built by local mechanic.
Paying EMI out of FBV revenue: FBV can be put to use immediately (typical turnaround time of 3-4 days) rather
than waiting for 1.5-2 months in case of local mechanic. This will result in immediate revenue generation from the
vehicle, which can be used to pay EMIs. On the other hand, in case of local mechanic, EMI needs to be paid even
during the body building stage.
Lower excise duty: Post Budget 2012-13, FBV attracts 2% lower excise duty at 12% vs. chassis based vehicle.
OEM provides 18 months warranty on FBV, while there is no warranty from local mechanic. Typical life span of
FBV body is 4-5 years vs. 1-2 years for locally built body.
In a nutshell, even though the truck operator pays ~Rs50k higher on FBV (in our example), he saves ~Rs20k on lower
excise outgo (2% of Rs1 mn cost of chassis). Also, he gets benefits in the form of better quality of body, higher
funding, immediate revenue generation and 18 months warranty as mentioned above.
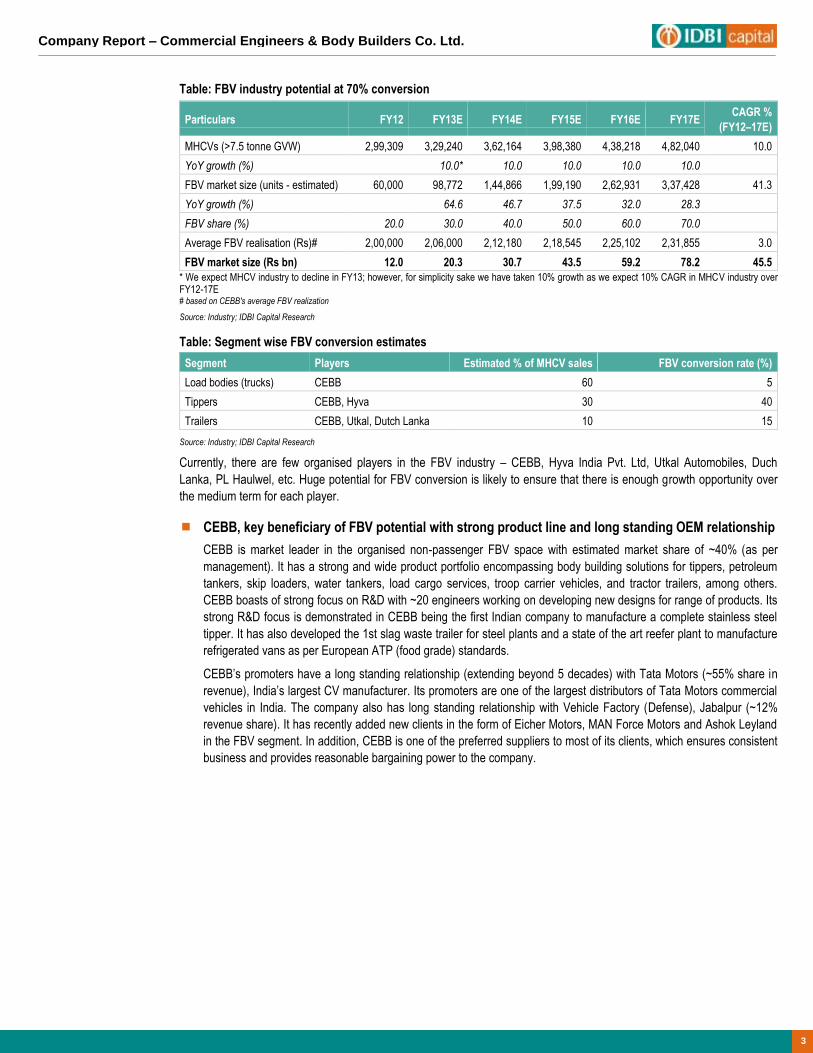
FBV industry to grow 6.5x at 70% conversion, 10% MHCV CAGR over FY12-17E
OEMs during our interactions have indicated that they expect FBV conversion to reach 100% in 5 years, which is
vindicated through our interactions with other industry participants including truck operators, dealers, financiers and
other experts. Even if we assume that FBV conversion is a gradual process and peg FBV share at 70% by FY17,
while projecting 10% CAGR for MHCVs, the Rs12 bn FBV industry is slated to grow 6.5x or 46% CAGR to Rs78
bn by FY17E – FBV volumes will grow 5.6x and we have assumed average realisation growth of 3% p.a. over
the same period.
Figure: Non-passenger CV industry trending towards FBVs
Source: Industry, Company
-
10
20
30
40
50
0
50,000
100,000
150,000
200,000
250,000
300,000
350,000
FY10 FY11 FY12 H1FY13
MHCVs (>7.5 tonne GVW) FBV market size (units - estimated) CEBBCO volumes (units)
FBV share (%) CEBBCO market share (%)
Company Report – Commercial Engineers & Body Builders Co. Ltd.
3
Table: FBV industry potential at 70% conversion
Particulars FY12 FY13E FY14E FY15E FY16E FY17E CAGR %
(FY12–17E)
MHCVs (>7.5 tonne GVW) 2,99,309 3,29,240 3,62,164 3,98,380 4,38,218 4,82,040 10.0
YoY growth (%)
10.0* 10.0 10.0 10.0 10.0
FBV market size (units - estimated) 60,000 98,772 1,44,866 1,99,190 2,62,931 3,37,428 41.3
YoY growth (%)
64.6 46.7 37.5 32.0 28.3
FBV share (%) 20.0 30.0 40.0 50.0 60.0 70.0
Average FBV realisation (Rs)# 2,00,000 2,06,000 2,12,180 2,18,545 2,25,102 2,31,855 3.0
FBV market size (Rs bn) 12.0 20.3 30.7 43.5 59.2 78.2 45.5
* We expect MHCV industry to decline in FY13; however, for simplicity sake we have taken 10% growth as we expect 10% CAGR in MHCV industry over FY12-17E # based on CEBB's average FBV realization
Source: Industry; IDBI Capital Research
Table: Segment wise FBV conversion estimates
Segment Players Estimated % of MHCV sales FBV conversion rate (%)
Load bodies (trucks) CEBB 60 5
Tippers CEBB, Hyva 30 40
Trailers CEBB, Utkal, Dutch Lanka 10 15
Source: Industry; IDBI Capital Research
Currently, there are few organised players in the FBV industry – CEBB, Hyva India Pvt. Ltd, Utkal Automobiles, Duch
Lanka, PL Haulwel, etc. Huge potential for FBV conversion is likely to ensure that there is enough growth opportunity over
the medium term for each player.
CEBB, key beneficiary of FBV potential with strong product line and long standing OEM relationship
CEBB is market leader in the organised non-passenger FBV space with estimated market share of ~40% (as per
management). It has a strong and wide product portfolio encompassing body building solutions for tippers, petroleum
tankers, skip loaders, water tankers, load cargo services, troop carrier vehicles, and tractor trailers, among others.
CEBB boasts of strong focus on R&D with ~20 engineers working on developing new designs for range of products. Its
strong R&D focus is demonstrated in CEBB being the first Indian company to manufacture a complete stainless steel
tipper. It has also developed the 1st slag waste trailer for steel plants and a state of the art reefer plant to manufacture
refrigerated vans as per European ATP (food grade) standards.
CEBB’s promoters have a long standing relationship (extending beyond 5 decades) with Tata Motors (~55% share in
revenue), India’s largest CV manufacturer. Its promoters are one of the largest distributors of Tata Motors commercial
vehicles in India. The company also has long standing relationship with Vehicle Factory (Defense), Jabalpur (~12%
revenue share). It has recently added new clients in the form of Eicher Motors, MAN Force Motors and Ashok Leyland
in the FBV segment. In addition, CEBB is one of the preferred suppliers to most of its clients, which ensures consistent
business and provides reasonable bargaining power to the company.

4
Company Report – Commercial Engineers & Body Builders Co. Ltd.
Figure: Preferred supplier to most OEMs
Source: Company; IDBI Capital Research
We believe that given its market leadership position, strong product profile and long standing OEM relationship, CEBB
is well poised to capitalise on FBV revolution in India on a capacity base of 30,000 FBVs, expandable to 40,000 FBVs
on Railway plant’s fungibility (explained later).
Centrally located facilities with low cost labour/overheads enable healthy margin
CEBB’s facilities are centrally located at Jabalpur, Indore and Jamshedpur. This ensures proximity to customers (CV
OEMs) as Jabalpur serves as central location to major OEM hubs across India. The company’s facilities are near key
customers in Jabalpur (Defense vehicle factory), Indore (Eicher Motors, MAN Force) and Jamshedpur (Tata Motors).
CEBB’s major raw material is steel and its facilities are closer to suppliers of steel in Orissa and Jharkhand like Essar
Steel, Lloyds Steel, SAIL, etc. In addition, being located in relatively smaller locations ensures lower labour, land and
overhead costs, thereby providing significant cost advantage. For instance, labour cost at a facility in Pune, NCR or
Chennai which are Auto hubs would be significantly higher. Also, as majority of labour demand is met from nearby
villages, where primarily there are only two major industrial factories at Jabalpur (Defense Factory and CEBB), it
ensures high labour retention. On flip side, CEBB has to focus on imparting extensive training to unskilled workforce.
Forays into Railways and Power: Another growth opportunity; though currently nascent
The company has recently forayed into the Railways and Power segments. Wagon manufacturing and refurbishment
represents an extension of CEBB’s expertise in design, fabrication, motion technology and integration in its FBV
business. Foray into railways offers the company an opportunity to participate in Rs1,578 bn rolling stock manufacturing
opportunity i.e. manufacturing (including replacement) of wagons, coaches, diesel locos and electric locos (source:
Working Group Report on Railways – XIIth 5-year Plan).
CEBB currently has wagon manufacturing capacity of 1,200 units on 2 shift basis, which can go up to 2,000 units on 3
shifts. Following is the company’s internal estimate of wagon manufacturing opportunity. Even assuming CEBB sells full
capacity of 2,000 wagons, it will only be addressing ~7% of Indian Railways’ requirements.
Table: Wagon manufacturing: Huge opportunity
Particulars FY12 FY13E FY14E FY15E
Demand estimation based on 12th 5-year
Plan and vision 2020 of Indian Railways
18,000 28,431 28,265 28,845
Realisation/wagon (Rs mn) 2 2 2 2
Market size (Rs bn) 36 57 57 58
CEBB output (wagons) 10 500 1,200 2,000
CEBB’s market share (Rs mn) 20 1,000 2,400 4,000
Market share (%) 0.1 1.8 4.2 6.9
Source: Company
40
80 100
80
10 15
0
10
20
30
40
50
60
70
80
90
100
Tata Motors Defence Factory VECV MAN Force AMW Ashok Leyland
% share in clients' FBV business

Company Report – Commercial Engineers & Body Builders Co. Ltd.
5
Fungible wagon capacity to maximise revenue
The company has utilised only 20 acres of land out of the 100 acres available with them for railway plant. Also,
out of these 20 acres, only one section is dedicated to railway manufacturing whereas the remaining plant is
fungible with FBVs. This is done to mitigate risk of delay in wagon orders, when the plant could be utilised for its
FBV or Power segments. For instance 1,200 wagons capacity is equipped to produce ~10,000 FBV bodies, if
need be.
We factor in 400/500 wagons sales in FY13/14. We don’t project Railways to be significant contributor over our
projection period of FY13-14.
In addition, CEBB also manufactures Power Structurals of electrostatic precipitators and boilers and has received
small orders from L&T and BHEL. This business is at nascent stage currently and is an extension of CEBB’s expertise
in design and fabrication. It is unlikely to have significant bearing on the company’s earnings in the near future.
Project Replica: 4 mn vehicles replacement opportunity
CEBB has recently entered the replacement market for body building, being the first organised player to do so. We
believe this opens up a huge addressable market for the company and also de-risks its business model from vagaries
of CV cyclicality. Industry estimates ~4 mn non-passenger CVs on road that need replacement (>=15 years old
vehicles). Currently the replacement market is highly unorganised and fragmented. Where CEBB scores is with its
promoters being one of the largest Tata Motors dealers, it can reach out to a larger replacement market. Also,
this segment is likely to earn higher EBITDA margin estimated at 30-35%, in turn improving blended
profitability – the impact is already visible in H1FY13 results, with margin expanding 540bps to 19.7% (replica
bodies share at 14% vs. 0% YoY).
TRIFAC: Potential boost to bottom line
CEBB benefits under the TRIFAC policy of Madhya Pradesh, which provides for sales tax subsidy on payment of state
sales, central sales tax and entry tax to the extent of capital investment made. CEBB has made Rs1 bn investment in
CV expansion and Rs1.3 bn investment in railway project and hence is eligible for subsidy of Rs2.3 bn over FY12-18.
This would contribute directly to the company’s bottom line. We have not factored the same in our projections.
Nonetheless, if we account for the same and assume that it will receive Rs300 mn/Rs350 mn subsidy in
FY13/14, our earnings after adjusting for tax on subsidy will get revised upwards by 31%/27%.

6
Company Report – Commercial Engineers & Body Builders Co. Ltd.
P&L analysis
Revenue growth witnessed a strong CAGR of 37% over FY07-12 led by robust growth volume CAGR of 23% CAGR
in volumes, which compares favourably with 4% growth CAGR in CVs. Strong growth in FBV volumes (30-40% over
FY12-14E) on the back of capacity expansion (30k units by FY13) and fungible railway capacity of 1,200 wagons
(equivalent to ~10k FBVs) will lead to 34% revenue CAGR over FY12-14E. Entry into high margin replacement
market with Project Replica, operating leverage & diversification into other business segments will aid margin
expansion of ~510bps to 19% in FY14E. Earnings, which registered a strong CAGR of 41% over FY07-12, will
continue to outpace revenue with 47% CAGR over FY12-14E led by strong operating performance.
Table: Income Statement (Rs mn)
Year-end: March FY10 FY11 FY12 FY13E FY14E
Net sales 1,829 2,122 4,631 6,328 8,266
Growth (%) 63.2 16.0 118.3 36.7 30.6
Operating expenses (1,464) (1,992) (3,984) (5,126) (6,694)
EBITDA 365 130 646 1,202 1,572
Growth (%) 688.6 (64.4) 397.8 86.0 30.8
Depreciation (36) (39) (64) (172) (203)
EBIT 329 91 583 1,029 1,370
Interest paid (68) (93) (93) (151) (151)
Other income 48 74 78 78 78
Pre-tax profit 308 73 568 957 1,297
Tax (105) (16) (160) (306) (415)
Effective tax rate (%) 34.1 21.6 28.1 32.0 32.0
Net profit 203 57 408 651 882
Adjusted net profit 203 57 408 651 882
Growth (%) 1,334.3 (71.8) 613.6 59.5 35.6
Shares o/s (mn nos.) 43 55 55 55 55
Source: Company; IDBI Capital Research
Strong growth in FBV volumes and other segments to drive revenue
Revenue witnessed 37% CAGR over FY07-FY12 and we expect CEBB to grow 34% CAGR over FY12-14E, driven
by strong growth in FBV volumes of 30-40% over FY12-14E on the back of capacity expansion to 30k units and
fungible railway capacity of 1,200 wagons (equivalent to ~10k FBVs). Average realizations is estimated to see a drop of
10% in FY13 due to higher share of lower realization non-tipper load bodies as against tippers, evident in H1FY13
results, which saw realization dip of 12% YoY. Historically, realization growth has seen a dip in FY09 due to the global
slowdown and in FY11 when a slump in tipper demand had an adverse impact on the company. We expect Railways
segment with capacity of ~1,200 wagons to execute 400/500 wagons in FY13/14 as part of trial orders from Indian
Railways. Railways capacity is fungible (1,200 wagons is equivalent to ~10,000 FBVs) which may aid in sustaining FBV
growth, if there is any delay in orders from Indian Railways.

Company Report – Commercial Engineers & Body Builders Co. Ltd.
7
Figure: Strong revenue growth to continue
Source: Company; IDBI Capital Research
EBITDA margin expansion of ~510bps led by better mix
Removal from Tata Motors’ bill discounting scheme (Tata Motors won’t charge 1.65% discount charge from CEBB,
which will positively impact margins by 50-60bps after accounting for higher interest cost on working capital) and
venturing into replacement market with Project Replica (replacement market margins considerably higher at 30-35%).
Better workforce management and operating leverage will keep employee cost, which has hovered around 3-5% of
sales over FY07-12, under check at 2.3%/2.5% in FY13/14 (employee cost as % of sales dropped to 2% in H1FY13 vs.
3.2% in FY12). We expect RMC/sales to improve to 70.9% in FY14E from 75.4% in FY12, largely accounting for
~510bps margin expansion over FY12-14 to 19% (CEBB clocked 19.7% OPM in H1FY13).
Figure: Better mix leading to higher Gross and EBITDA margin
Source: Company; IDBI Capital Research
1,120 1,829 2,122
4,631
6,328
8,266
(20.0)%
0.0%
20.0%
40.0%
60.0%
80.0%
100.0%
120.0%
140.0%
0
1,000
2,000
3,000
4,000
5,000
6,000
7,000
8,000
9,000
FY09 FY10 FY11 FY12 FY13E FY14E
Revenue - Rs mn (LHS)
Growth in Revenue - % (RHS)
8,730 8,201 10,657
21,900
30,660
39,858
(20.0)%
(10.0)%
0.0%
10.0%
20.0%
30.0%
40.0%
50.0%
0
5,000
10,000
15,000
20,000
25,000
30,000
35,000
40,000
45,000
FY09 FY10 FY11 FY12 FY13E FY14E
FBV - units (LHS)
Avg. realization growth YoY - % (RHS)
0
10
20
30
40
50
60
70
80
FY09 FY10 FY11 FY12 FY13E FY14E
RMC/sales (%) Gross margin (%) EBITDA Margin (%)

8
Company Report – Commercial Engineers & Body Builders Co. Ltd.
Earnings to outpace revenue with 47% CAGR
Strong revenue CAGR of 34% and margin expansion of ~510bps would enable 47% CAGR in earnings over FY12-14E.
Earnings growth is without considering subsidy benefits under the TRIFAC policy (sales tax subsidy), which
would have resulted in earnings being higher by 31%/27%.
Figure: Strong earnings growth over FY12-14E
Source: Company; IDBI Capital Research
1,829 2,122
4,631
6,328
8,266
365 130 646
1,202 1,572
203 57 408 651 882
0.0%
5.0%
10.0%
15.0%
20.0%
25.0%
0
1,000
2,000
3,000
4,000
5,000
6,000
7,000
8,000
9,000
FY10 FY11 FY12 FY13E FY14E
Revenue (Rs mn) EBITDA (Rs mn) PAT (Rs mn) EBITDA (%) PAT (%)

Company Report – Commercial Engineers & Body Builders Co. Ltd.
9
Balance sheet analysis
CEBB continues to operate at 100% capacity utilization (expanded capacity at 30k units in FY13) backed by strong
growth in FBV demand coupled with a healthy balance sheet (net D/E of 0.1x in FY11/12) and stable return ratios
(RoE/RoCE at 17%/21% in FY12). We don’t expect any significant change in working capital cycle as benefits
arising out of removal from Tata Motors bill discounting scheme would largely be offset by foray into railways
where payments usually take some time. We expect CEBB’s RoE/RoCE to improve to 23%/31% and 26%/34% in
FY13E and FY14E respectively led by strong revenue traction and improved profitability.
Table: Balance Sheet (Rs mn)
Year-end: March FY10 FY11 FY12 FY13E FY14E
Net fixed assets 450 735 2,314 2,642 2,939
Investments 6 384 7 7 7
Other non-curr assets - - - - -
Current assets 1,502 2,152 2,353 3,076 3,951
Inventories 534 692 497 812 1,061
Sundry Debtors 582 306 1,037 1,300 1,585
Cash and Bank 34 260 57 115 254
Marketable Securities - - - - -
Loans and advances 351 894 761 848 1,051
Total assets 1,958 3,270 4,674 5,724 6,897
Shareholders’ funds 712 2,173 2,581 3,081 3,709
Share capital 429 549 549 549 549
Reserves & surplus 283 1,624 2,032 2,532 3,159
Total Debt 548 5 303 503 503
Secured loans 545 5 303 303 303
Unsecured loans 3 - - 200 200
Other liabilities 6 12 85 85 85
Curr Liab & prov 693 1,081 1,705 2,055 2,600
Current liabilities 632 1,074 1,658 2,008 2,554
Provisions 61 7 46 46 46
Total liabilities 1,247 1,097 2,093 2,643 3,188
Total equity & liabilities 1,958 3,270 4,674 5,724 6,897
Book Value (Rs) 17 40 47 56 68
Source: Company; IDBI Capital Research
Return ratios slated to strengthen
We expect its RoE/RoCE to strengthen 26%/34% in FY14E vs. 17%/21% in FY12, led by strong revenue traction and
improved profitability and high capacity utilisation.
Figure: Improved margin, high capacity utilisation to boost return ratios
Source: Company; IDBI Capital Research
2.8%
33.0%
4.0%
17.2%
23.0%26.0%
4.2%
35.4%
5.3%
22.6%
31.0%34.4%
0.0%
10.0%
20.0%
30.0%
40.0%
FY09 FY10 FY11 FY12 FY13E FY14E
RoE (%) RoCE (%)
10
Company Report – Commercial Engineers & Body Builders Co. Ltd.
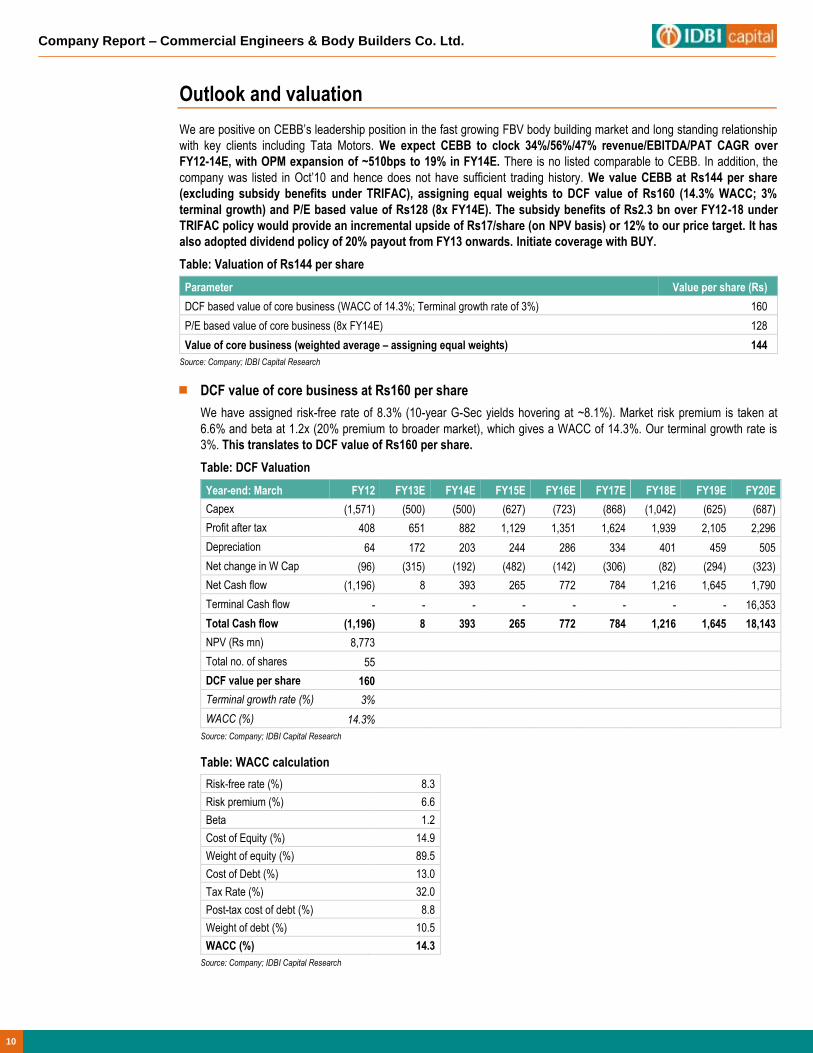
Outlook and valuation
We are positive on CEBB’s leadership position in the fast growing FBV body building market and long standing relationship
with key clients including Tata Motors. We expect CEBB to clock 34%/56%/47% revenue/EBITDA/PAT CAGR over
FY12-14E, with OPM expansion of ~510bps to 19% in FY14E. There is no listed comparable to CEBB. In addition, the
company was listed in Oct’10 and hence does not have sufficient trading history. We value CEBB at Rs144 per share
(excluding subsidy benefits under TRIFAC), assigning equal weights to DCF value of Rs160 (14.3% WACC; 3%
terminal growth) and P/E based value of Rs128 (8x FY14E). The subsidy benefits of Rs2.3 bn over FY12-18 under
TRIFAC policy would provide an incremental upside of Rs17/share (on NPV basis) or 12% to our price target. It has
also adopted dividend policy of 20% payout from FY13 onwards. Initiate coverage with BUY.
Table: Valuation of Rs144 per share
Parameter Value per share (Rs)
DCF based value of core business (WACC of 14.3%; Terminal growth rate of 3%) 160
P/E based value of core business (8x FY14E) 128
Value of core business (weighted average – assigning equal weights) 144
Source: Company; IDBI Capital Research
DCF value of core business at Rs160 per share
We have assigned risk-free rate of 8.3% (10-year G-Sec yields hovering at ~8.1%). Market risk premium is taken at
6.6% and beta at 1.2x (20% premium to broader market), which gives a WACC of 14.3%. Our terminal growth rate is
3%. This translates to DCF value of Rs160 per share.
Table: DCF Valuation
Year-end: March FY12 FY13E FY14E FY15E FY16E FY17E FY18E FY19E FY20E
Capex (1,571) (500) (500) (627) (723) (868) (1,042) (625) (687)
Profit after tax 408 651 882 1,129 1,351 1,624 1,939 2,105 2,296
Depreciation 64 172 203 244 286 334 401 459 505
Net change in W Cap (96) (315) (192) (482) (142) (306) (82) (294) (323)
Net Cash flow (1,196) 8 393 265 772 784 1,216 1,645 1,790
Terminal Cash flow - - - - - - - - 16,353
Total Cash flow (1,196) 8 393 265 772 784 1,216 1,645 18,143
NPV (Rs mn) 8,773
Total no. of shares 55
DCF value per share 160
Terminal growth rate (%) 3%
WACC (%) 14.3%
Source: Company; IDBI Capital Research
Table: WACC calculation
Risk-free rate (%) 8.3
Risk premium (%) 6.6
Beta 1.2
Cost of Equity (%) 14.9
Weight of equity (%) 89.5
Cost of Debt (%) 13.0
Tax Rate (%) 32.0
Post-tax cost of debt (%) 8.8
Weight of debt (%) 10.5
WACC (%) 14.3
Source: Company; IDBI Capital Research

Company Report – Commercial Engineers & Body Builders Co. Ltd.
11
Table: DCF sensitivity table
WACC
12.3% 13.3% 14.3% 15.3% 16.3%
Terminal growth rate
1.0% 179 159 143 129 117
2.0% 191 169 150 135 122
3.0% 207 207 160 142 128
4.0% 226 195 171 151 135
5.0% 250 213 184 161 143
Source: Company; IDBI Capital Research
P/E based valuation of core business at Rs128 per share
We assign P/E multiple of 8x (PEG of 0.17x) to FY14 EPS of Rs16.1 (without considering subsidy benefits under
TRIFAC policy), which gives value of Rs128 per share.
NPV of subsidy benefits at Rs17 per share – not considered in our price target
The subsidy benefits of Rs2.3 bn over FY12-18 under the TRIFAC policy would provide an incremental upside of Rs17
per share (on NPV basis with WACC of 15%), not considered in our price target.
Table: NPV of TRIFAC subsidy benefit at Rs17 per share (Rs mn)
Year-end: March FY13 FY14 FY15 FY16 FY17 FY18
Sales Tax benefit 300 350 400 400 400 450
Post Tax Benefit 204 238 272 272 272 306
NPV @ 15% WACC 959
Per share value (Rs) 17
Source: IDBI Capital Research

12
Company Report – Commercial Engineers & Body Builders Co. Ltd.
Risks and concerns
Revenue and client concentration
Though CEBB is the largest organized player in the FBV industry catering to most OEMs, ~55% of its FBV volumes
come from Tata Motors. Also, FBV comprises >95% of the company’s revenue. Cyclical CV industry could result in a
dip in chassis supply from OEMs during downturn, which could adversely affect performance as was evident during
FY11. However, the company has been de-risking its business model by diversifying into other business segments like
Railways and Power fabrication. It has set up a fungible wagon manufacturing facility with a capacity of ~1,200 wagons
and has also received orders from notable clients like L&T and BHEL in its power fabrication segment. Also, its foray
into Project Replica is one more instance of revenue diversification.
Scale-up in revenue from Railways may take time
CEBB, a new entrant in wagon manufacturing space, has received RDSO approval for its wagon manufacturing facility
with a capacity of ~1,200 wagons and is in the process of executing a trial order of 247 wagons from Braithwaite & Co.
(subsidiary of Indian Railways). The company is eligible to participate only for trial orders during the first two years of
operations. Considering the uncertainty in wagon orders from Railway Board and the lower scale of operations, we
expect the company to register revenue of Rs0.8 bn/Rs1 bn in FY13E/14E. However, this will help the company
partially de-risk its business operations going forward.
Unorganised nature of business limits our ability to analyse and cross verify
Since body building both in OEMs and replacement segments is largely unorganized (more so in case of replacement
segment), it limits our ability to analyse and cross verify operational data and industry dynamics. Consequently, in few
cases our analysis and projections are based on our interactions with industry participants and company managements
and our on the ground channel checks.
Company Report – Commercial Engineers & Body Builders Co. Ltd.
13
Company background
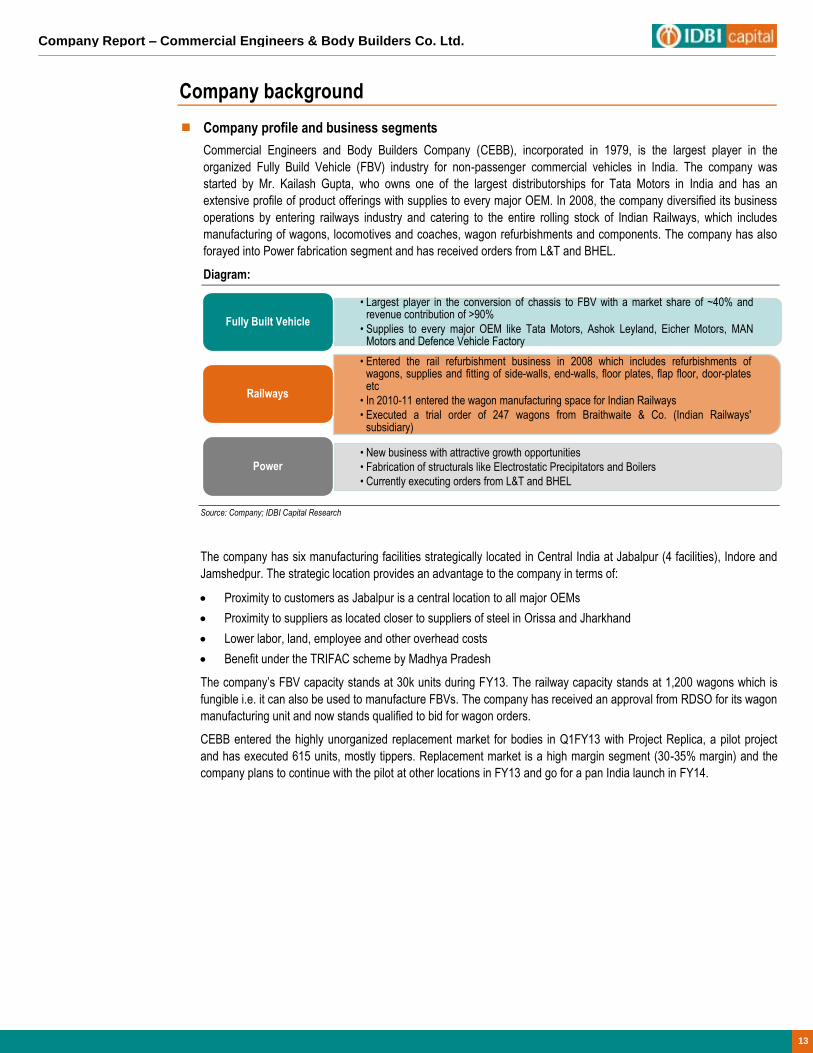
Company profile and business segments
Commercial Engineers and Body Builders Company (CEBB), incorporated in 1979, is the largest player in the
organized Fully Build Vehicle (FBV) industry for non-passenger commercial vehicles in India. The company was
started by Mr. Kailash Gupta, who owns one of the largest distributorships for Tata Motors in India and has an
extensive profile of product offerings with supplies to every major OEM. In 2008, the company diversified its business
operations by entering railways industry and catering to the entire rolling stock of Indian Railways, which includes
manufacturing of wagons, locomotives and coaches, wagon refurbishments and components. The company has also
forayed into Power fabrication segment and has received orders from L&T and BHEL.
Diagram:
Source: Company; IDBI Capital Research
The company has six manufacturing facilities strategically located in Central India at Jabalpur (4 facilities), Indore and
Jamshedpur. The strategic location provides an advantage to the company in terms of:
Proximity to customers as Jabalpur is a central location to all major OEMs
Proximity to suppliers as located closer to suppliers of steel in Orissa and Jharkhand
Lower labor, land, employee and other overhead costs
Benefit under the TRIFAC scheme by Madhya Pradesh
The company’s FBV capacity stands at 30k units during FY13. The railway capacity stands at 1,200 wagons which is
fungible i.e. it can also be used to manufacture FBVs. The company has received an approval from RDSO for its wagon
manufacturing unit and now stands qualified to bid for wagon orders.
CEBB entered the highly unorganized replacement market for bodies in Q1FY13 with Project Replica, a pilot project
and has executed 615 units, mostly tippers. Replacement market is a high margin segment (30-35% margin) and the
company plans to continue with the pilot at other locations in FY13 and go for a pan India launch in FY14.
• Largest player in the conversion of chassis to FBV with a market share of ~40% and revenue contribution of >90%
• Supplies to every major OEM like Tata Motors, Ashok Leyland, Eicher Motors, MAN Motors and Defence Vehicle Factory
Fully Built Vehicle
• Entered the rail refurbishment business in 2008 which includes refurbishments of wagons, supplies and fitting of side-walls, end-walls, floor plates, flap floor, door-plates etc
• In 2010-11 entered the wagon manufacturing space for Indian Railways
• Executed a trial order of 247 wagons from Braithwaite & Co. (Indian Railways' subsidiary)
Railways
• New business with attractive growth opportunities
• Fabrication of structurals like Electrostatic Precipitators and Boilers
• Currently executing orders from L&T and BHEL
Power

14
Company Report – Commercial Engineers & Body Builders Co. Ltd.
Product profile
CEBB produces extensive range of >400 vehicle and locomotive shells for diverse applications on road & railways
transportation and manufactures non-passenger CV bodies for most OEMs in the country.
Table: Extensive portfolio of product offerings
Product/services Applications
Commercial Vehicles Tipper bodies Mining and road construction
Tanker bodies
Load cargo bodies
Goods transportation Refrigerator-fitted vehicle bodies and containers
Trailer bodies (including box trailers, tip trailers, skeletal trailers and
flat bed trailers)
Skip loaders Solid waste management
Garbage bin collectors
Water tanker bodies
Municipal applications Light recovery vehicle bodies
Garbage tippers
Troop carrier vehicle bodies
Defense Prison van bodies
Water browser bodies
Vehicle bodies for the transportation of animals
Miscellaneous Fire engine bodies
Ambulance bodies
Railways Up-gradation and refurbishment of BOXN wagons
Components for locomotives
Components for BOXN wagons
Components for coaches
Power Structurals for boilers and Electrostatic Precipitators (ESPs)
Table: Management team
Dr. Kailash Gupta Chairman &
Managing Director
Associated with the company since 1979. He has over 30 years of experience and
has been the President of Federation of Automobile Dealers Association (FADA).
Currently, he is an active member of FADA Governing Council.
Mr. Ajay Gupta Whole Time
Executive Director
Joined the company in 2005. He has been instrumental in diversifying the business to
Railways and achieving strong growth for the company. A commerce graduate from
Mumbai University with Business Leadership program from IIM Kolkata, he is a first
generation entrepreneur.
Mr. Abhishek
Jaiswal
Executive Vice
President
Responsible for overall operations of all units of the company. He has been with
CEBB for more than 18 years and has a rich industry experience.
Mr. Abhijit Kanvinde Chief Financial
Officer
A qualified Chartered Accountant with over 18 years of experience in finance,
accounts and taxation. He joined CEBB in 2007 and has worked across various
companies like Novartis, L’Oreal and Mafatlal.
Mr. Pradeep Gupta Executive Vice
President (Railways)
Has been with CEBB since 2010. He has over 30 years of experience in project
management, manufacturing, marketing, product engineering, quality assurance,
vendor development and export execution in the railway industry.

Company Report – Commercial Engineers & Body Builders Co. Ltd.
15
SWOT
Strengths:
More than 50 years of relationship with Tata Motors, largest CV player in India.
Extensive profile of product offerings with supplies to every major OEM.
Largest player in the fast growing FBV sector with a market share of 35-40%.
Weaknesses:
Business concentration on one major client with ~55% sales from Tata Motors.
Late entrant in the wagon manufacturing space.
Opportunities:
FBV sector to grow at >6 times in next 5-7 years.
Targeting the highly unorganized replacement market with Project Replica. ~4 mn vehicles with ~0.6 mn tippers
alone need replacement thus offering a huge potential.
Diversifying to high growth Railways and Power fabrication businesses to fuel growth and de-risk business
model.
Threats:
Slowdown in CV segment may see a decline in chassis supply from OEMs, thus affecting growth.
Delay in wagon orders from the Railway board.
Less technology intensive industry with low entry barriers may attract competition, thereby putting pressure on
margins.

16
Company Report – Commercial Engineers & Body Builders Co. Ltd.
Financial summary
Profit & Loss Account (Rs mn)
Year-end: March FY10 FY11 FY12 FY13E FY14E
Net sales 1,829 2,122 4,631 6,328 8,266
Growth (%) 63.2 16.0 118.3 36.7 30.6
Operating expenses (1,464) (1,992) (3,984) (5,126) (6,694)
EBITDA 365 130 646 1,202 1,572
Growth (%) 688.6 (64.4) 397.8 86.0 30.8
Depreciation (36) (39) (64) (172) (203)
EBIT 329 91 583 1,029 1,370
Interest paid (68) (93) (93) (151) (151)
Other income 48 74 78 78 78
Pre-tax profit 308 73 568 957 1,297
Tax (105) (16) (160) (306) (415)
Effective tax rate (%) 34.1 21.6 28.1 32.0 32.0
Net profit 203 57 408 651 882
Adjusted net profit 203 57 408 651 882
Growth (%) 1,334.3 (71.8) 613.6 59.5 35.6
Shares o/s (mn nos) 43 55 55 55 55
Balance Sheet (Rs mn)
Year-end: March FY10 FY11 FY12 FY13E FY14E
Net fixed assets 450 735 2,314 2,642 2,939
Investments 6 384 7 7 7
Other non-curr assets - - - - -
Current assets 1,502 2,152 2,353 3,076 3,951
Inventories 534 692 497 812 1,061
Sundry Debtors 582 306 1,037 1,300 1,585
Cash and Bank 34 260 57 115 254
Loans and advances 351 894 761 848 1,051
Total assets 1,958 3,270 4,674 5,724 6,897
Shareholders' funds 712 2,173 2,581 3,081 3,709
Share capital 429 549 549 549 549
Reserves & surplus 283 1,624 2,032 2,532 3,159
Total Debt 548 5 303 503 503
Secured loans 545 5 303 303 303
Unsecured loans 3 - - 200 200
Other liabilities 6 12 85 85 85
Curr Liab & prov 693 1,081 1,705 2,055 2,600
Current liabilities 632 1,074 1,658 2,008 2,554
Provisions 61 7 46 46 46
Total liabilities 1,247 1,097 2,093 2,643 3,188
Total equity & liabilities 1,958 3,270 4,674 5,724 6,897
Book Value (Rs) 17 40 47 56 68
Source: Company; IDBI Capital Research
Cash Flow Statement (Rs mn)
Year-end: March FY10 FY11 FY12 FY13E FY14E
Pre-tax profit 308 73 568 957 1,297
Depreciation 34 37 63 172 203
Tax paid (99) (10) (86) (306) (415)
Chg in working capital (553) (36) 221 (315) (192)
Other operating activities 97 92 (197) (0) 0
Cash flow from operations (a) (212) 155 569 508 893
Capital expenditure (159) (322) (1,643) (500) (500)
Chg in investments 0 (377) 377 - -
Other investing activities (40) (29) (516) - -
Cash flow from investing (b) (198) (729) (1,782) (500) (500)
Equity raised/(repaid) 368 120 - - -
Debt raised/(repaid) 476 (543) 298 200 -
Dividend (incl. tax) - - - (150) (255)
Chg in minorities - - - - -
Other financing activities (436) 1,221 713 - -
Cash flow from financing (c) 408 799 1,011 50 (255)
Net chg in cash (a+b+c) (3) 225 (202) 58 138
Financial Ratios
Year-end: March FY10 FY11 FY12 FY13E FY14E
Adj EPS (Rs) 4.7 1.0 7.4 11.8 16.1
Adj EPS growth (%) 104.9 (78.0) 613.6 59.5 35.6
EBITDA margin (%) 20.0 6.1 14.0 19.0 19.0
Pre-tax margin (%) 16.8 3.4 12.3 15.1 15.7
RoE (%) 33.0 4.0 17.2 23.0 26.0
RoCE (%) 35.4 5.3 22.6 31.0 34.4
Turnover & Leverage ratios (x)
Asset turnover 1.2 0.8 1.2 1.2 1.3
Leverage factor 2.5 1.8 1.7 1.8 1.9
Net margin (%) 11.1 2.7 8.8 10.3 10.7
Net Debt/Equity 0.7 (0.1) 0.1 0.1 0.1
Working Capital & Liquidity ratios
Inventory days 107 119 39 47 47
Receivable days 116 53 82 75 70
Payable days 150 106 63 74 86
Valuation ratios
Year-end: March FY10 FY11 FY12 FY13E FY14E
PER (x) 21.9 99.5 13.9 8.7 6.4
Price/Book value (x) 6.2 2.6 2.2 1.8 1.5
PCE (x) 18.5 59.4 12.1 6.9 5.2
EV/Net sales (x) 2.7 2.6 1.3 1.0 0.7
EV/EBITDA (x) 13.6 41.8 9.2 5.1 3.8
Dividend Yield (%) 21.9 99.5 13.9 8.7 6.4

Road Show Update – Commercial Engineers & Body Builders Co. Ltd.
17
Notes
Sonam H. Udasi – Head Research (91-22) 4322 1375 [email protected]
Dealing (91-22) 6637 1150 [email protected]
Key to Ratings
Stocks:
BUY: Absolute return of 15% and above; ACCUMULATE: 5% to 15%; HOLD: Upto ±5%; REDUCE: -5% to -15%; SELL: -15% and below.
IDBI Capital Market Services Ltd. (A wholly owned subsidiary of IDBI Ltd.) Equity Research Desk
3rd Floor, Mafatlal Centre, Nariman Point, Mumbai – 400 021. Phones: (91-22) 4322 1212; Fax: (91-22) 2285 0785; Email: [email protected]
SEBI Registration: NSE CM – INB230706631, NSE F&O – INF230706631, BSE CM – INB010706639, BSE F&O – INF010706639, NSDL – IN-DP-NSDL-12-96
Compliance Officer: Christina Fernandes; Email: [email protected]; Telephone: (91-22) 4322 1212 Disclaimer This document has been prepared by IDBI Capital Market Services Ltd (IDBI Capital) and is meant for the recipient only for use as intended and not for circulation. This document should not be reproduced or copied or made available to others. No person associated with IDBI Capital is obligated to call or initiate contact with you for the purposes of elaborating or following up on the information contained in this document.
Recipients may not receive this report at the same time as other recipients. IDBI Capital will not treat recipients as customers by virtue of their receiving this report.
The information contained herein is from the public domain or sources believed to be reliable. While reasonable care has been taken to ensure that information given is at the time believed to be fair and correct and opinions based thereupon are reasonable, due to the very nature of research it cannot be warranted or represented that it is accurate or complete and it should not be relied upon as such. In so far as this report includes current or historical information, it is believed to be reliable, although its accuracy and completeness cannot be guaranteed.
Opinions expressed are current opinions as of the date appearing on this material only. While we endeavor to update on a reasonable basis, the information discussed in this material, IDBI Capital, its directors, employees are under no obligation to update or keep the information current. Further there may be regulatory, compliance, or other reasons that prevent us from doing so.
Prospective investors and others are cautioned that any forward-looking statements are not predictions and may be subject to change without notice.
IDBI Capital, its directors and employees and any person connected with it, will not in any way be responsible for the contents of this report or for any losses, costs, expenses, charges, including notional losses/lost opportunities incurred by a recipient as a result of acting or non acting on any information/material contained in the report .
This is not an offer to sell or a solicitation to buy any securities or an attempt to influence the opinion or behaviour of investors or recipients or provide any investment/tax advice.
This report is for information only and has not been prepared based on specific investment objectives. The securities discussed in this report may not be suitable for all investors. Investors must make their own investment decision based on their own investment objectives, goals and financial position and based on their own analysis.
Trading in stocks, stock derivatives, and other securities is inherently risky and the recipient agrees to assume complete and full responsibility for the outcomes of all trading decisions that the recipient makes, including but not limited to loss of capital.
Opinions, projections and estimates in this report solely constitute the current judgment of the author of this report as of the date of this report and do not in any way reflect the views of IDBI Capital, its directors, officers, or employees.
This report is not directed or intended for distribution to, or use by, any person or entity who is a citizen or resident of or located in any locality, state, country or other jurisdiction, where such distribution, publication, availability or use would be contrary to law, regulation or which would subject IDBI Capital and affiliates to any registration or licensing requirement within such jurisdiction. The securities described herein may or may not be eligible for sale in all jurisdictions or to certain category of investors. Persons in whose possession this document may come are required to inform themselves of and to observe such restriction.
IDBI Capital, its directors or employees or affiliates, may from time to time, have positions in, or options on, and buy and sell securities referred to herein. IDBI Capital or its affiliates, during the normal course of business, from time to time, may solicit from or perform investment banking or other services for any company mentioned in this document or their connected persons or be engaged in any other transaction involving such securities and earn brokerage or other compensation or act as a market maker in the financial instruments of the company(ies) discussed herein or their affiliate companies or act as advisor or lender / borrower to such company(ies)/affiliate companies or have other potential conflict of interest.
This report may provide hyperlinks to other websites. Except to the extent to which the report refers to the website of IDBI Capital, IDBI Capital states that it has not reviewed the linked site and takes no responsibility for the content contained in such other websites. Accessing such websites shall be at recipient's own risk.
E-mail is not a secure method of communication. IDBI Capital Market Services Limited cannot accept responsibility for the accuracy or completeness of any e-mail message or any attachment(s). This transmission could contain viruses, be corrupted, destroyed, incomplete, intercepted, lost or arrive late. IDBI Capital, its directors or employees or affiliates accept no liability for any damage caused, directly or indirectly, by this email.