Embed Size (px)
Citation preview

Comment on: „Productivity Growth, Wage Growth and Unions“ by Kügler, Schönberg and Schreiner
Michael C. Burda Humboldt-Universität zu Berlin, CEPR and IZA
ECB Forum Sintra, 20 June 2018
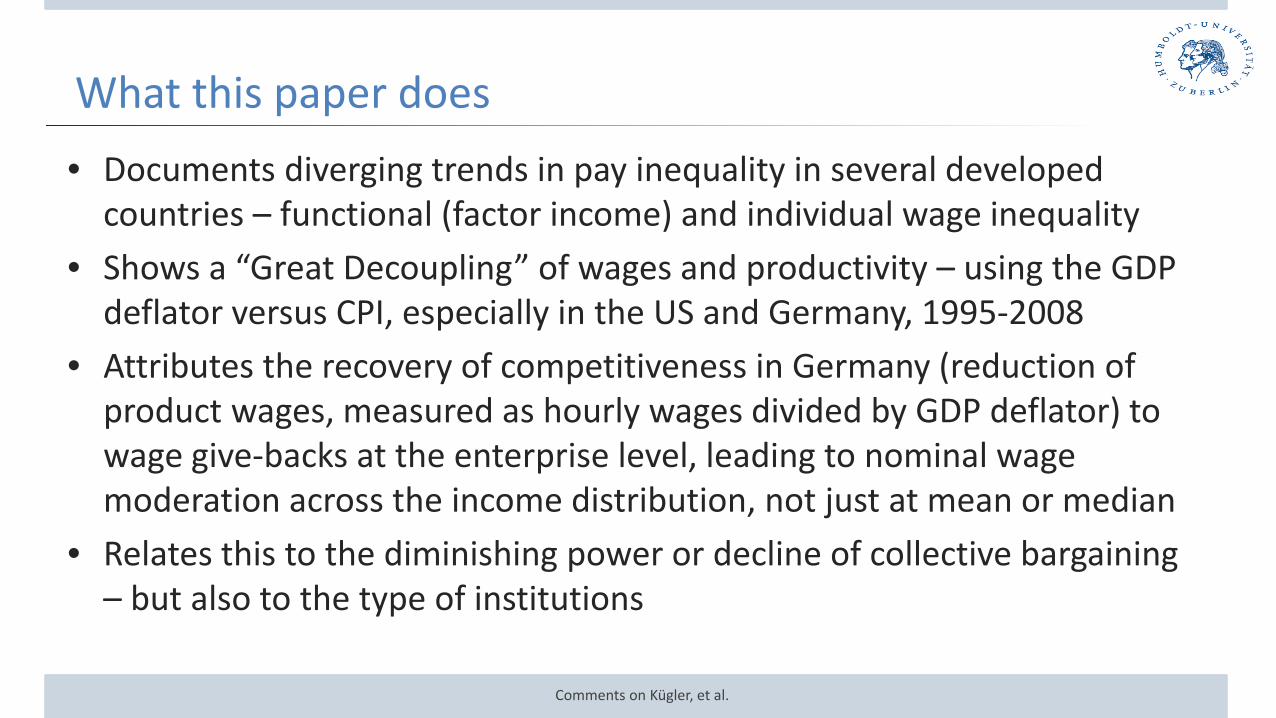
What this paper does • Documents diverging trends in pay inequality in several developed
countries – functional (factor income) and individual wage inequality • Shows a “Great Decoupling” of wages and productivity – using the GDP
deflator versus CPI, especially in the US and Germany, 1995-2008 • Attributes the recovery of competitiveness in Germany (reduction of
product wages, measured as hourly wages divided by GDP deflator) to wage give-backs at the enterprise level, leading to nominal wage moderation across the income distribution, not just at mean or median
• Relates this to the diminishing power or decline of collective bargaining – but also to the type of institutions
Comments on Kügler, et al.

a) Unemployment rate, OECD/ILO definition, percent of labor force (Eurostat)
c) Labor force participation rate, OECD/ILO definition, percent of labor force (Eurostat)
c) Employment ratio as percent of the working-aged population (Eurostat)
d) Real GDP, in 2010 prices 2010=100 (Eurostat)
Germany France Germany France
Germany France Germany France
Contrast: Germany v. France, 1970-2016 Pe
rcen
t
Perc
ent
Perc
ent
Cha
in in
dex

My comments: Macro
• Important to study the behavior of the labor share • It is well-known that the secular behavior of the wage share and is related
to employment performance in Europe (Thimann 2015)
• But the role of different prices indexes and the “wedge” in wage formation is an old idea (Sachs 1979, Bruno and Sachs 1985, Burda and Sachs 1987)
• Still, what is competitiveness? Total nominal wage costs relative to nominal productivity – levels or changes? – Composition effects means that levels and even changes are meaningless at times – Real consumption wages do not reflect true competitiveness
Comments on Kügler, et al.
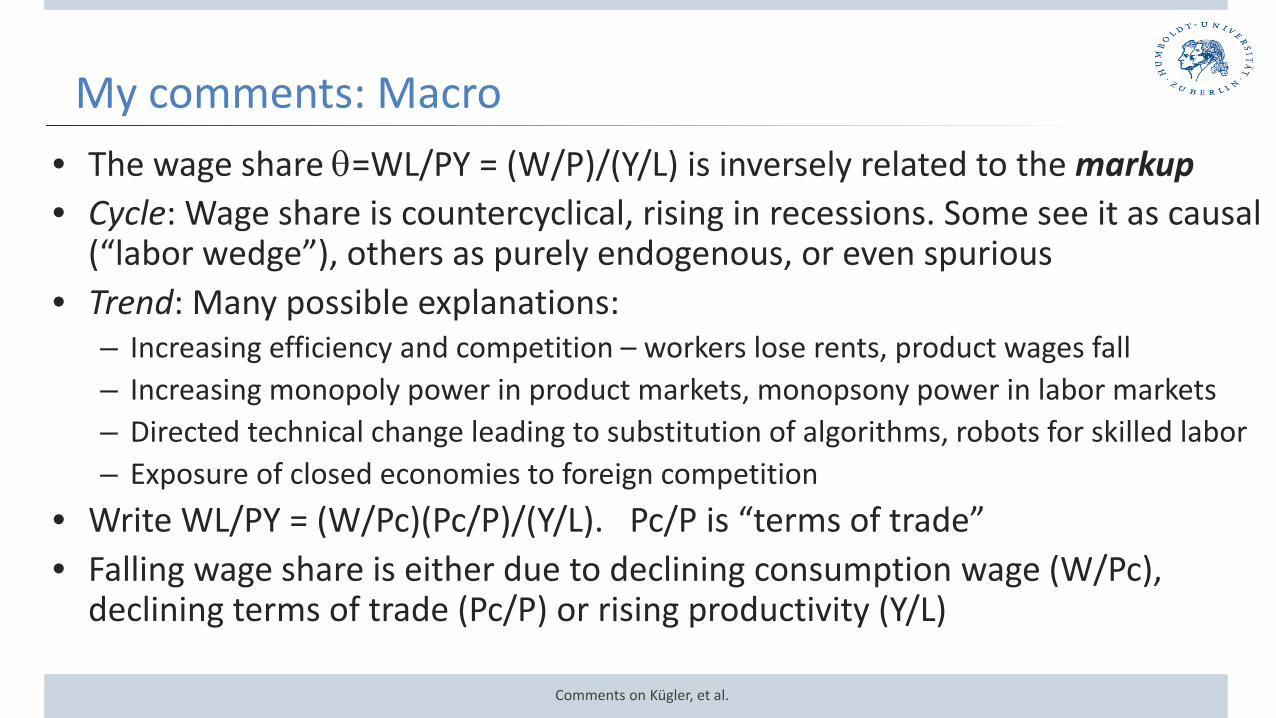
My comments: Macro • The wage share θ=WL/PY = (W/P)/(Y/L) is inversely related to the markup • Cycle: Wage share is countercyclical, rising in recessions. Some see it as causal
(“labor wedge”), others as purely endogenous, or even spurious • Trend: Many possible explanations:
– Increasing efficiency and competition – workers lose rents, product wages fall – Increasing monopoly power in product markets, monopsony power in labor markets – Directed technical change leading to substitution of algorithms, robots for skilled labor – Exposure of closed economies to foreign competition
• Write WL/PY = (W/Pc)(Pc/P)/(Y/L). Pc/P is “terms of trade” • Falling wage share is either due to declining consumption wage (W/Pc),
declining terms of trade (Pc/P) or rising productivity (Y/L)
Comments on Kügler, et al.

0
10
20
30
40
50
60
70
1960
1962
1964
1966
1968
1970
1972
1974
1976
1978
1980
1982
1984
1986
1988
1990
1992
1994
1996
1998
2000
2002
2004
2006
2008
2010
2012
2014
2016
2018
% o
f GDP
Gross adjusted labor share WL/PY (AMECO)
France Germany
Source: AMECO
Wage share in D and F look remarkably stable…

0.7
0.8
0.9
1
1.1
1.2
1.3
1.4
1960
1961
1962
1963
1964
1965
1966
1967
1968
1969
1970
1971
1972
1973
1974
1975
1976
1977
1978
1979
1980
1981
1982
1983
1984
1985
1986
1987
1988
1989
1990
1991
1992
1993
1994
1995
1996
1997
1998
1999
2000
2001
2002
2003
2004
2005
2006
2007
2008
2009
2010
2011
2012
2013
2014
2015
2016
2017
Terms of Trade (P/CPI)
Germany France
Terms of trade not so much, but much more stable in F than D…

0.7
0.8
0.9
1
1.1
1.2
1.3
1.4
1960
1961
1962
1963
1964
1965
1966
1967
1968
1969
1970
1971
1972
1973
1974
1975
1976
1977
1978
1979
1980
1981
1982
1983
1984
1985
1986
1987
1988
1989
1990
1991
1992
1993
1994
1995
1996
1997
1998
1999
2000
2001
2002
2003
2004
2005
2006
2007
2008
2009
2010
2011
2012
2013
2014
2015
2016
2017
Terms of Trade (P/CPI)
Germany France USA Norway Sweden
…than in USA, Norway or Sweden
My comments: Micro
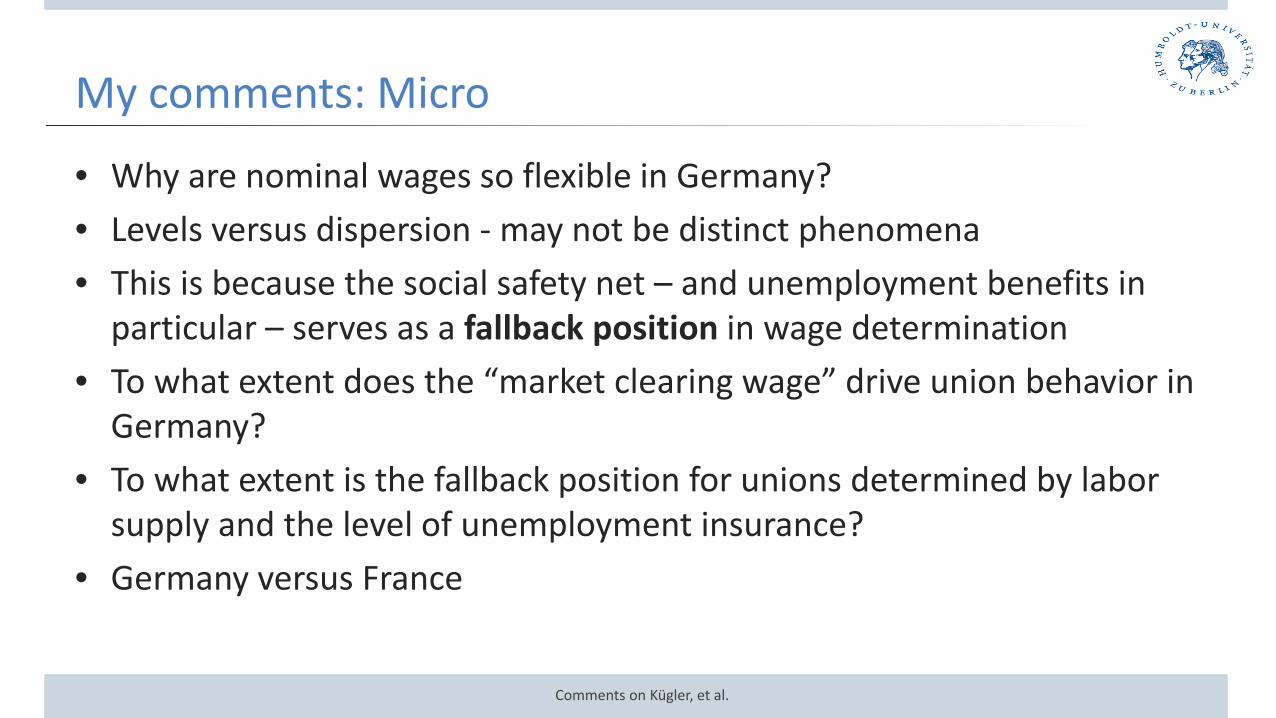
• Why are nominal wages so flexible in Germany? • Levels versus dispersion - may not be distinct phenomena • This is because the social safety net – and unemployment benefits in
particular – serves as a fallback position in wage determination • To what extent does the “market clearing wage” drive union behavior in
Germany? • To what extent is the fallback position for unions determined by labor
supply and the level of unemployment insurance? • Germany versus France
Comments on Kügler, et al.

05.05.17
a) Employment (millions of persons)
a) Total hours worked (billions of hours)
c) Hourly productivity, total economy (2010 Euros)
Aggregate employment growth with zero growth in hours
Total hours worked in Germany: 1994: 49.5 billion 2016: 51.0 billion (+3% in 22 years!) How? Share of part-time workers rose from 22% to 39% of total employment Source: Institut für Arbeitsmarktforschung (IAB), Arbeitszeitrechnung, July 2017
Germany France
Germany France
Germany France
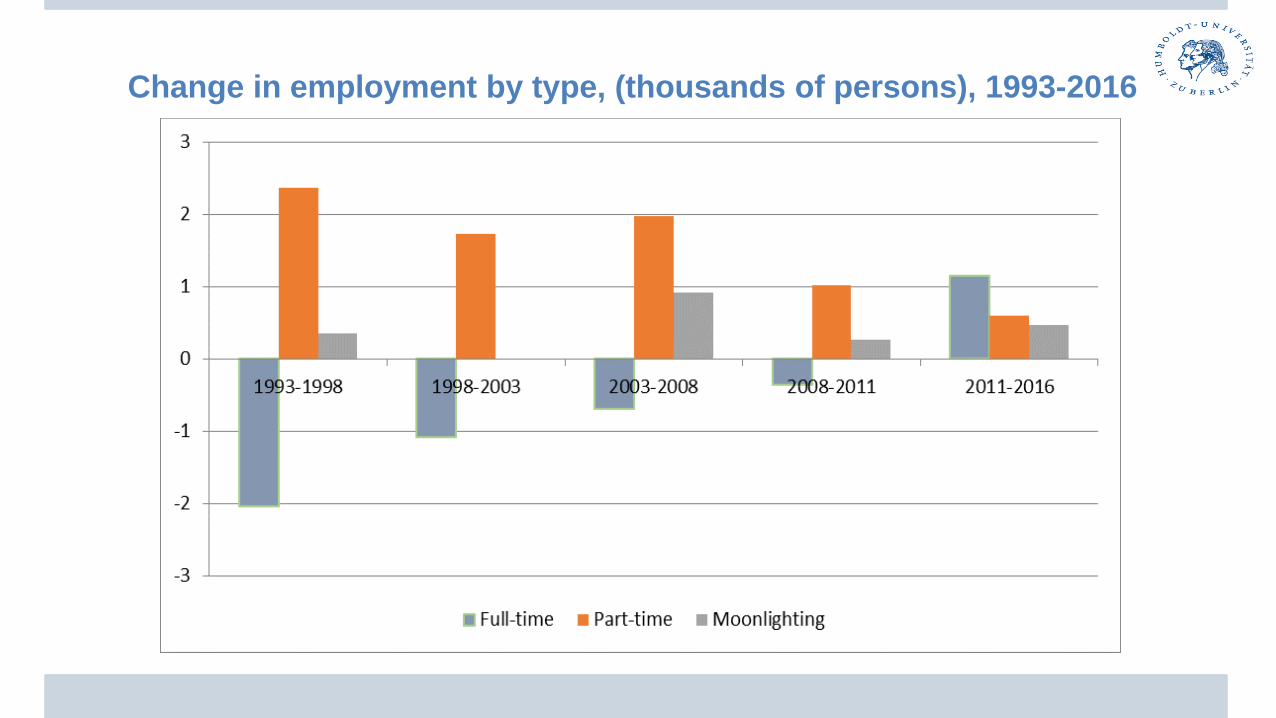
Change in employment by type, (thousands of persons), 1993-2016

Increasing low wage dispersion began with Hartz reforms
Comments on Kügler, et al.
Source: Dustmann, Fitzenberger, Schönberg, and Spitz-Oener (2014)
Indexed real (CPI) hourly wage growth, full-time workers, West Germany only
Comments on Kügler, et al.
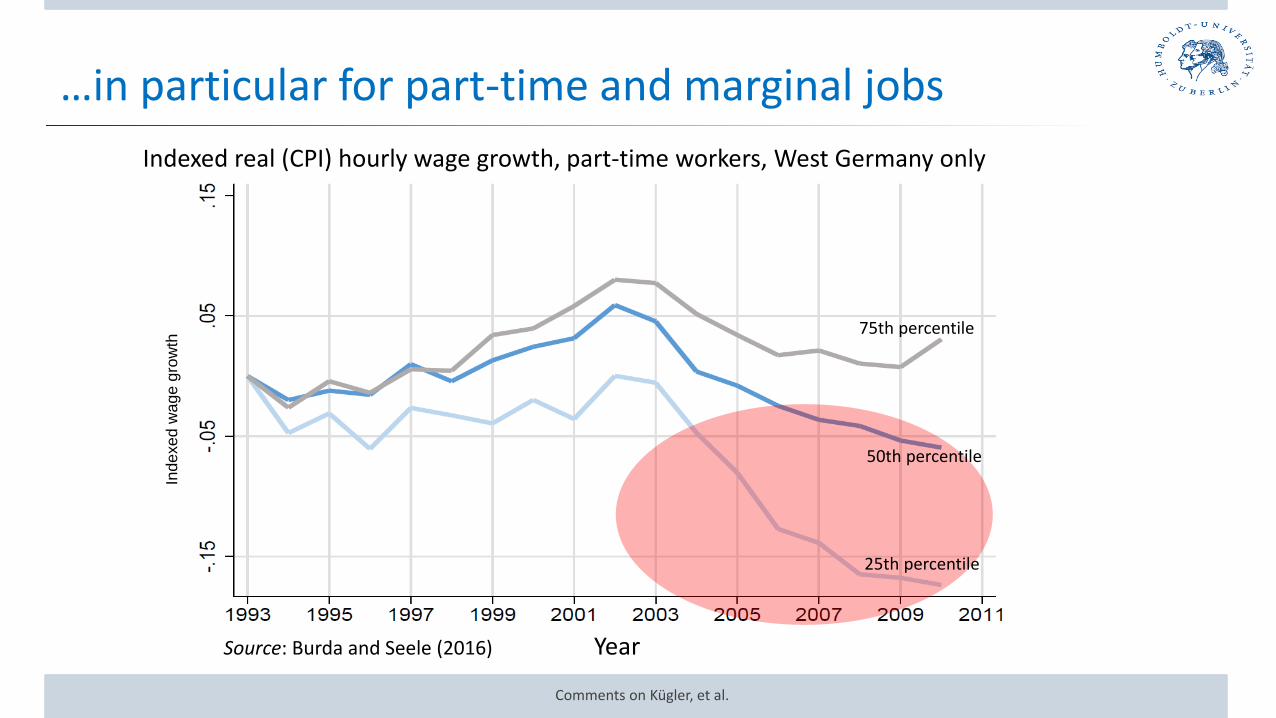
…in particular for part-time and marginal jobs
Source: Burda and Seele (2016) Year
Indexed real (CPI) hourly wage growth, part-time workers, West Germany only In
dexe
d w
age
grow
th 75th percentile
50th percentile
25th percentile

Increase in low pay dispersion after 2003
Comments on Kügler, et al.
Source: Burda and Seele (2017)

Hourly wage dispersion in East and West rises after 2003
Comments on Kügler, et al.
Source: Burda and Seele (2017). Indexed cumulative real (CPI) imputed wage growth of full and part-time employees
Indexed cumulative real (CPI) wage growth of full and part-time employees, West and East

1.2
1.7
2.2
2.7
3.2
3.719
95
1996
1997
1998
1999
2000
2001
2002
2003
2004
2005
2006
2007
2008
2009
2010
2011
2012
90-10 Percentile ratios, full-time workers
Germany Sweden FranceSource: OECD
Evident in international comparisons
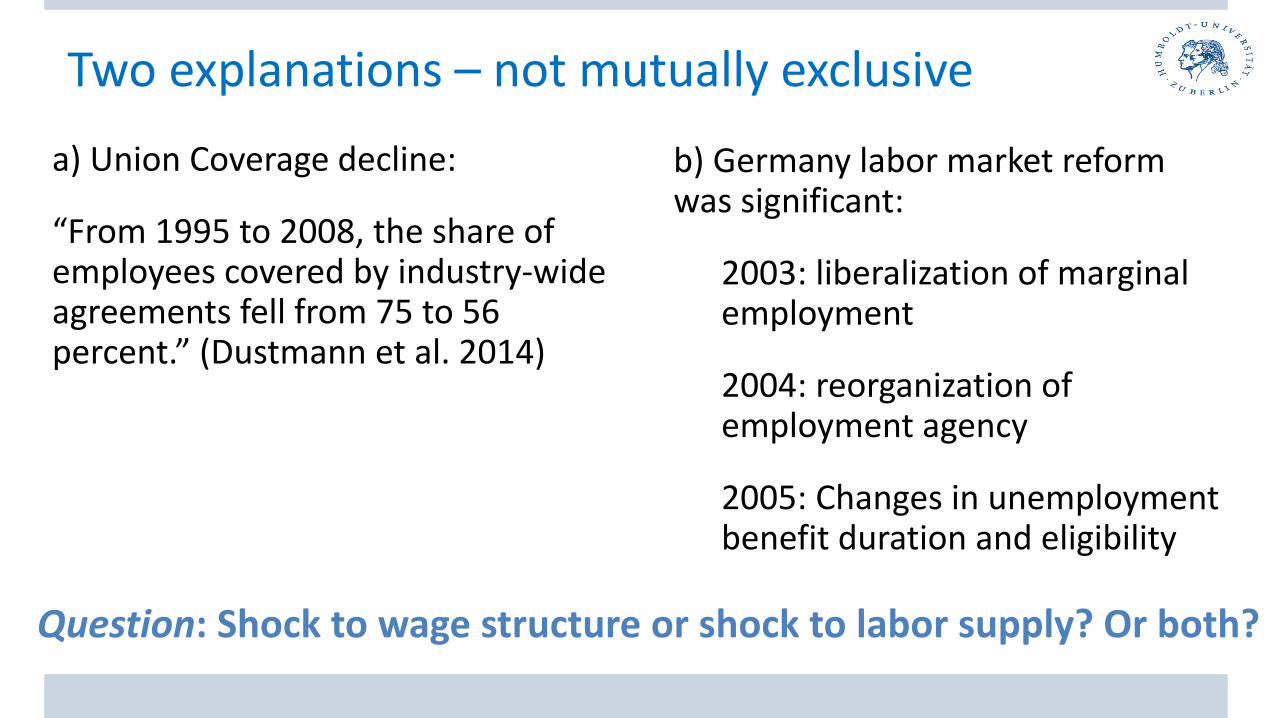
Two explanations – not mutually exclusive
a) Union Coverage decline:
“From 1995 to 2008, the share of employees covered by industry-wide agreements fell from 75 to 56 percent.” (Dustmann et al. 2014)
b) Germany labor market reform was significant:
2003: liberalization of marginal employment
2004: reorganization of employment agency
2005: Changes in unemployment benefit duration and eligibility
Question: Shock to wage structure or shock to labor supply? Or both?

Katz and Murphy (1992) Assume market clearing (Marshallian perspective)
If
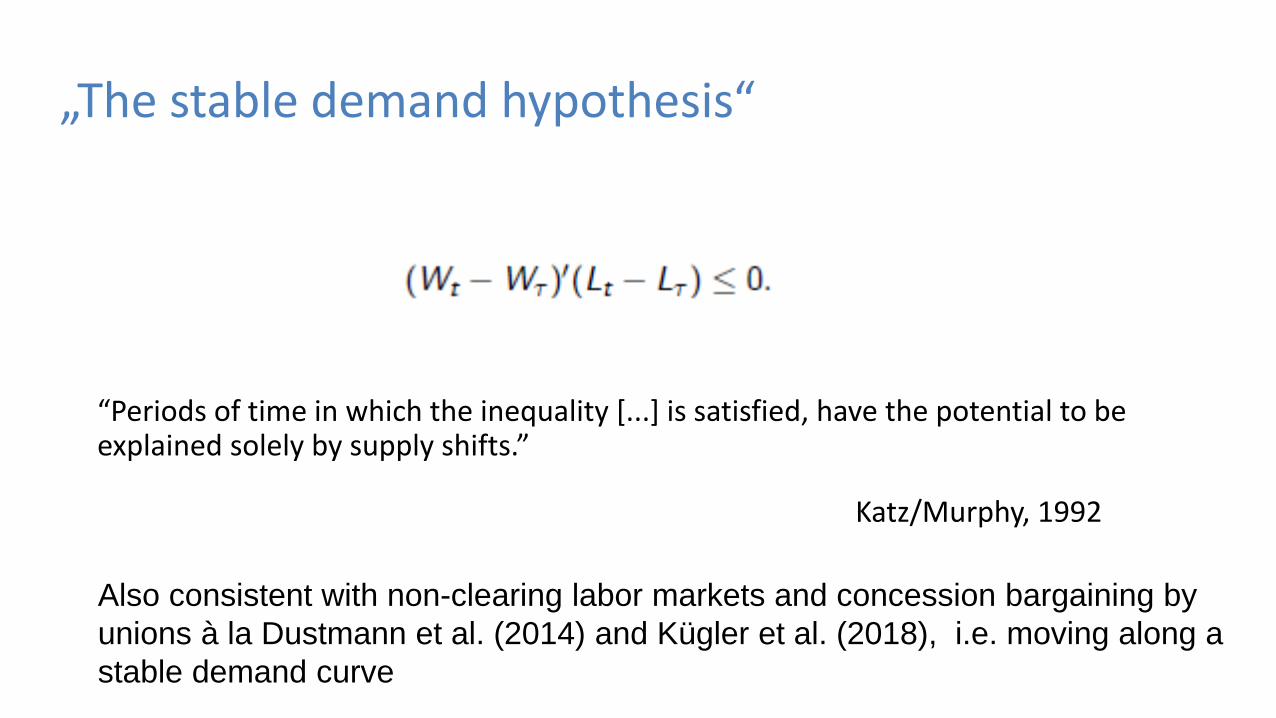
“Periods of time in which the inequality [...] is satisfied, have the potential to be explained solely by supply shifts.”
Katz/Murphy, 1992
„The stable demand hypothesis“
Also consistent with non-clearing labor markets and concession bargaining by unions à la Dustmann et al. (2014) and Kügler et al. (2018), i.e. moving along a stable demand curve

implies
(Wt-W τ)´(Lt - Lτ) ≤ 0 and (Wt-W τ)´(Pt -Pτ) ≥ 0 (8)
implies
„The stable demand hypothesis“ plus labor market clearing (Marshall) v. rigid wages (Pigou) (Burda and Seele 2017)
where P denotes the labor force participation rate.

„Pigou“ „Marshall“

Results: Stable demand hypothesis
Year around which 5-year interval is centered
(number of cells in parentheses)

Results: Stable demand hypothesis (fewer cells, analysis with employment and participation rates)

Results: Pigou v. Marshall (fewer cells, analysis with employment and participation rates)
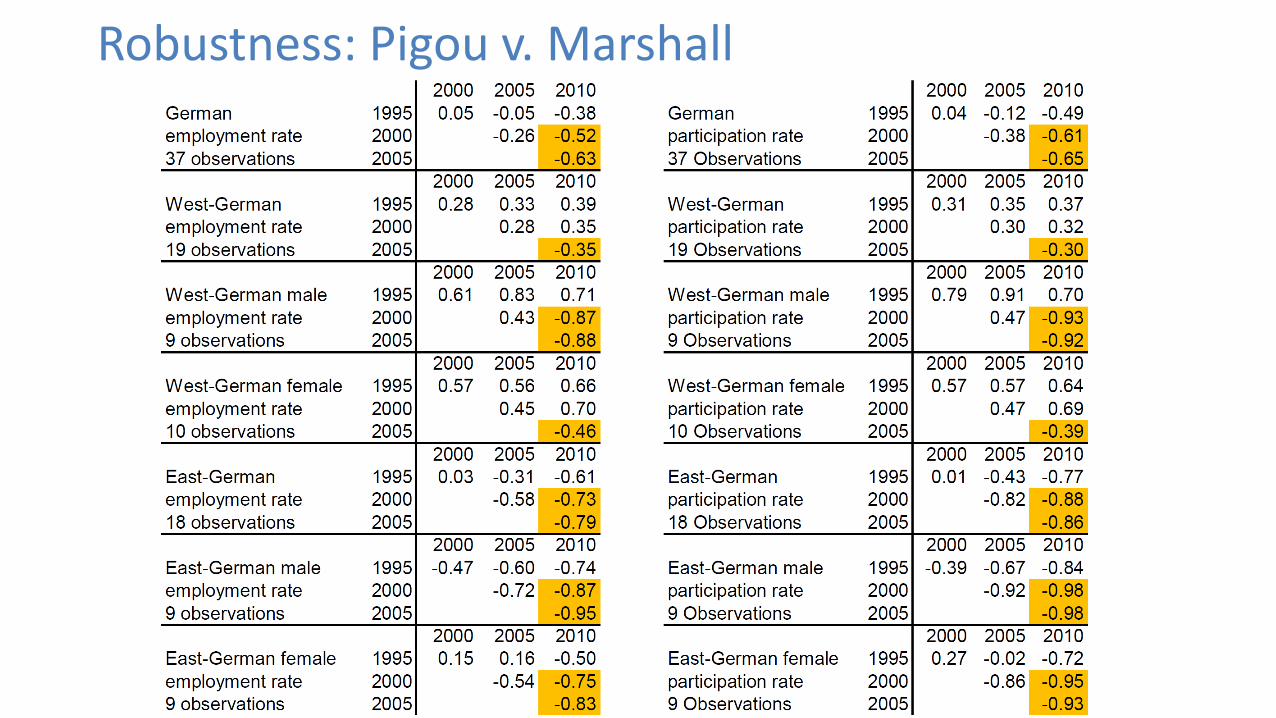
Robustness: Pigou v. Marshall

Wage versus personal income inequality

27
Income Inequality in international comparison (Gini)
Source: OECD. Value of 1 = maximal inequality, 0 = complete equality
Country 1986 1996 2004 2008 2010 2014 Canada 0,29 0,30 0,32 0,32 0,32 0,32 Chile 0,53 0.52** 0,50 0.48** 0,47 Denmark 0,22 0,22 0,23 0,24 0,25 0,25 France 0,28 0,28 0,29 0,30 0,29 Germany 0,25 0,26 0,28 0,29 0,29 0,29 Greece 0.34* 0,33 0,33 0,34 0,34 Iceland 0,26 0,31 0,27 0,24 Italy 0.30* 0.32** 0,35 0,34 0,32 0,33 Japan 0,30 0.32* 0.32** 0.34** 0,33 Korea 0.30*** 0,31 0,31 0,30 Mexiko 0.45* 0,50 0,47 0,48 0,47 0,46 Sweden 0,20 0,22 0,24 0,26 0,27 0,28 United Kingdom 0.32** 0.33** 0,33 0,34 0,34 0,36 United States 0,34 0,36 0,36 0,38 0,38 0,39 * Data from 2 years before ** Data from 1 year before *** Data from 2006
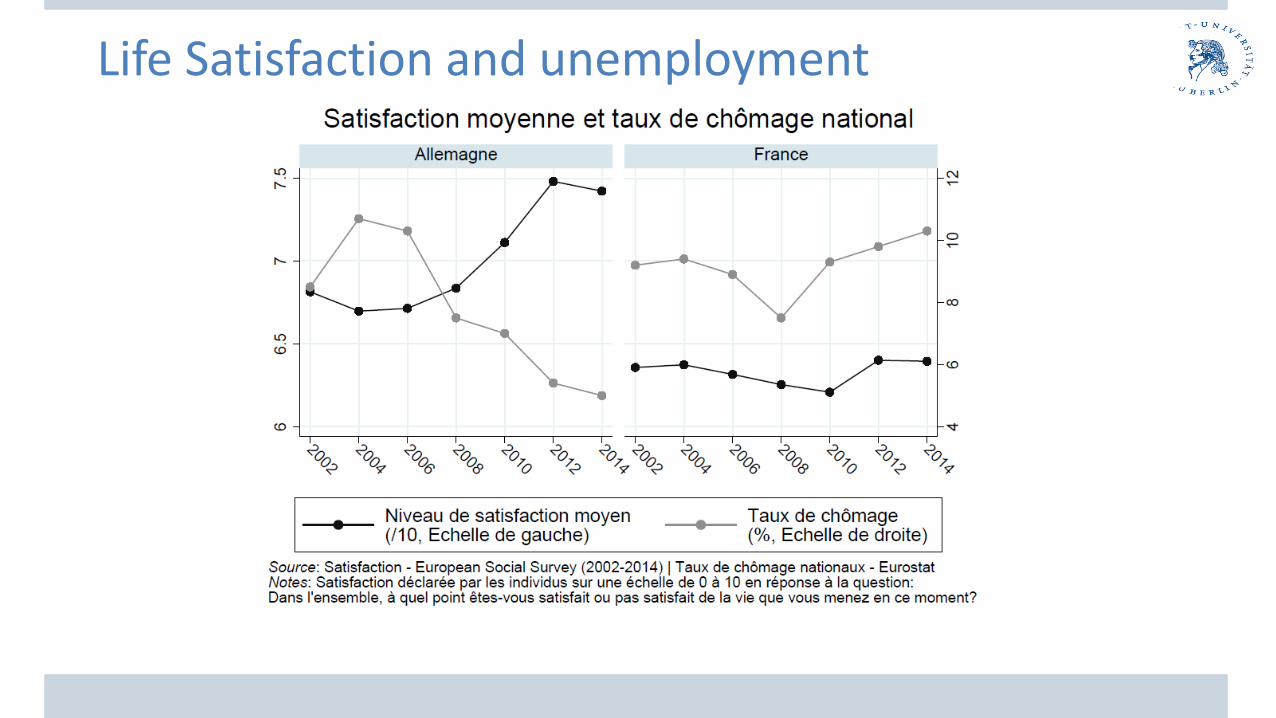
Life Satisfaction and unemployment

Concluding remarks • The authors show convincingly that nominal wage behavior – and not
productivity or terms of trade – was crucial for the German labor market • Other margins of flexibility were equally important in Germany:
– Part-time work wages were more flexible, employment more elastic – Incentives to work part-time were raised in 2002 – The Hartz reforms (2003-2005) sharply reduced reservation wages and increased
labor force participation, increasing labor supply
• Correlation of relative wages and employment in Germany turned sharply negative during the period 2005-2010, and confirming an exogenous shift in labor supply (combined with wage flexibility)
• May be difficult to transplant institutions from Germany to other countries Comments on Kügler, et al.

Comment on: „Productivity Growth, Wage Growth and Unions“ by Kügler, Schönberg and Schreiner
Michael C. Burda Humboldt-Universität zu Berlin, CEPR and IZA
ECB Forum Sintra, 20 June 2018


A deconstruction of the employment expansion in Germany deconstructed