Embed Size (px)
Citation preview
Combustion Science Data Management NeedsCombustion Science Data Management Needs
Jacqueline H. Chen
Combustion Research Facility
Sandia National [email protected]
DOE Data Management Workshop
SLAC
Stanford, CA
March 16-18, 2004
Sponsored by the Division of Chemical Sciences Geosciences, and Biosciences, the Office of Basic Energy Sciences, the U. S. Department of Energy

Challenges in combustion understanding and modelingChallenges in combustion understanding and modeling
Diesel Engine Autoignition, Laser IncandescenceChuck Mueller, Sandia National Laboratories
Stiffness: wide range of length and time scales
– turbulence
– flames and ignition fronts
– high pressure
Chemical complexity– large number of species and
reactions
Multi-physics complexity – multiphase (liquid spray, gas
phase, soot)
– thermal radiation
– acoustics ...

Direct Numerical Simulation (DNS) Approach
High-fidelity computer-based observations of micro-physics of chemistry-turbulence interactions
Resolve all relevant scales
At low error tolerances, high-order methods are more efficient
Laboratory scale configurations: homogeneous turbulence, v-flame turbulent jets, counterflow
Complex chemistry - gas phase/heterogeneous (catalytic)
Turbulent methane-air diffusion flame
HO2
CH3O
CH4
O
Oxidizer
Fuel

. S3D0: F90 MPP 3D
. S3D1: GrACE-based
. S3D2: CCA-compliant
Software design developments
. IMEX ARK
. IBM
. AMR
Numerical developments
. Thermal radiation
. Soot particles
. Liquid droplets
Model developments
CFRFS
CCA
Post-processors: flamelet, statistical
CMCS DM
MPP S3D
Arnaud Trouvé, U. Maryland Jacqueline Chen, SandiaChris Rutland, U. WisconsinHong Im, U. MichiganR. Reddy and R. Gomez, PSC
High-fidelity Simulations of Turbulent Combustion (TSTC) http://scidac.psc.edu

3D DNS Code (S3D) scales to over a thousand processors
Scalability benchmark test for S3D on MPP platforms - 3D laminar
hydrogen/air flame/vortex problem (8 reactive scalars)
Ported to IBM-SP3, SP4, Compaq SC, SGI Origin, Cray T3E,
Intel Xeon Linux clusters

A Computational Facility for Reacting Flow Science (CFRFS)A Computational Facility for Reacting Flow Science (CFRFS)
• Develop a flexible, maintainable, toolkit for high-fidelity Adaptive Mesh Refinement (AMR) Massively-Parallel low Mach number reacting flow computations
• Develop an associated CSP data analysis and reduction toolkit for multidimensional reacting flow
• Use CSP and a PRISM tabulation approach to enable adaptive chemistry reacting flow computations
– PRISM = Piecewise Reusable Implementation of Solution Mapping (M. Frenklach)
CCA GUI showing connections
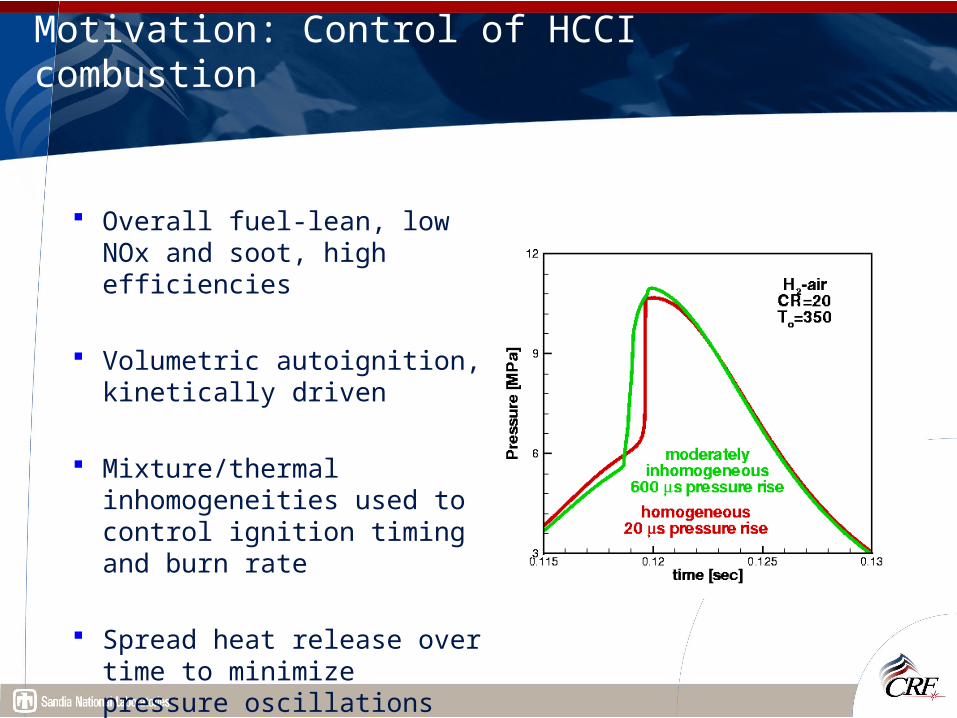
Motivation: Control of HCCI combustion
Overall fuel-lean, low NOx and soot, high efficiencies
Volumetric autoignition, kinetically driven
Mixture/thermal inhomogeneities used to control ignition timing and burn rate
Spread heat release over time to minimize pressure oscillations
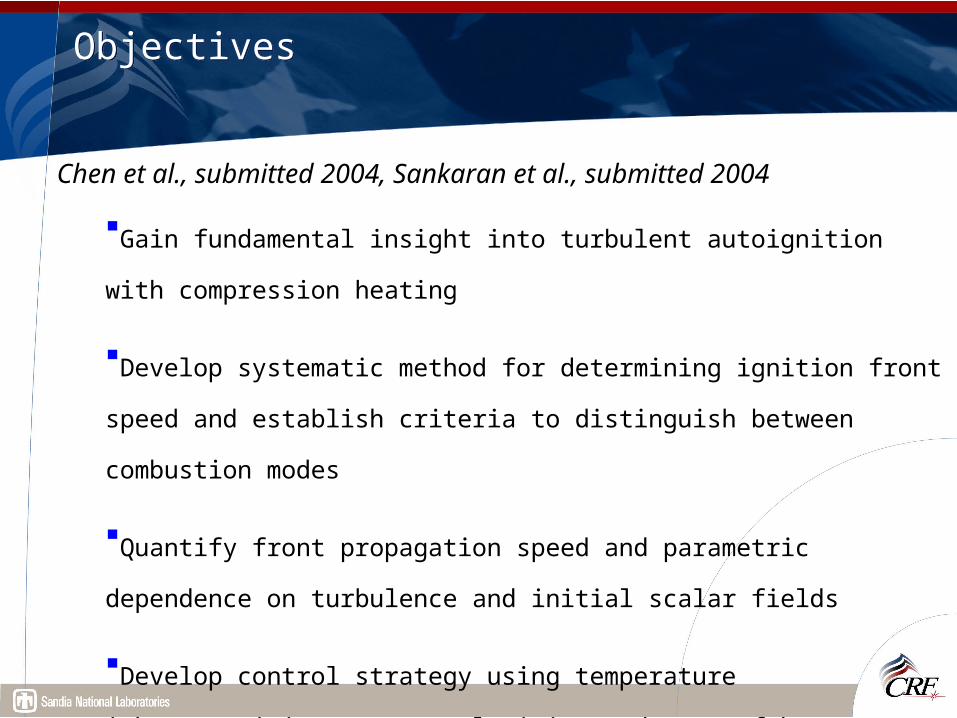
Objectives Objectives
Gain fundamental insight into turbulent autoignition with compression
heating
Develop systematic method for determining ignition front speed and
establish criteria to distinguish between combustion modes
Quantify front propagation speed and parametric dependence on
turbulence and initial scalar fields
Develop control strategy using temperature inhomogeneities to control
timing and rate of heat release in HCCI combustion
deflagration
spontaneous ignition
detonation
Chen et al., submitted 2004, Sankaran et al., submitted 2004

Initial conditionsInitial conditions
x (cm)
y(c
m)
0 0.1 0.2 0.3 0.40
0.05
0.1
0.15
0.2
0.25
0.3
0.35
0.4
T (K)110711011096109110861080107510701065105910541049104310381033
Baseline symmetric case
x (cm)
y(c
m)
0 0.1 0.2 0.3 0.40
0.05
0.1
0.15
0.2
0.25
0.3
0.35
0.4
T (K)110110951090108410781072106610601054104810421036103010241018
Cold core gas
x (cm)
y(c
m)
0 0.1 0.2 0.3 0.40
0.05
0.1
0.15
0.2
0.25
0.3
0.35
0.4
T (K)111411091103109810931088108210771072106610611056105110451040
Hot core gas
Same mean T (1070K) Different T skewness and variance (15,30K) Pressure 41 – 55 atm Lean hydrogen/air

Temperature skewness effect on heat release rateTemperature skewness effect on heat release rate
Heat release, HighT, positive skewness
2.0 ms
2.4 ms
2.6 ms
2.8 ms
Symm Hot core Cold core

Temperature skewness effect on ignition delay and burn timeTemperature skewness effect on ignition delay and burn time
Temperature distribution influences ignition and duration of burning.
Hot core gas Ignited earlier Burns longer
Cold core gas Ignited later Slow end gas combustion
t [ms]In
teg
rate
dH
RR
[MW
/g]
1 1.5 2 2.5 3 3.5
0.1
0.2
0.3
0.4
0.5
0.6
0.7
0.8
BaselineHot coreCold core
DNS Cases Baseline Hot Cold
Burn time [ms] 0.894 1.085 0.953

Ignition front tracking methodIgnition front tracking method
cd
DtDss
od
*
YH2 = 8.5x10⁻⁴ isocontour – location of maximum heat release
Laminar reference speed, sL based on freely propagating premixed flame at local enthalpy and pressure conditions at front surface
Density-weighted displacement speed (Echekki and Chen, 1999):

Species balance and normalized front speed criteria for propagation mode Species balance and normalized front speed criteria for propagation mode
Black lines – s*d/sL < 1.1 (deflagration)White lines – s*d/sL > 1.1 (spontaneous ignition)
A – deflagration B, C – spontaneous ignition
A C
B
Heat release isocontours

Fraction of front length and burnt gas area production due to deflagrationFraction of front length and burnt gas area production due to deflagration
•Solid line front length
•Dashed line – burnt area production

Comparison of experimental and DNS data for ignition/edge flame dataComparison of experimental and DNS data for ignition/edge flame data
H2 + O = OH + HO2 + H = O + OHslow OH recombination
RP
LP
DF
OH
H st
Normalized OH Expt
H2
Heated air
H2/N2
Normalized OH DNS Flow divergence effect – (Ruetsch et al. 1994) upstream divergence of flow due to increase in normal component of flow resulting from heat release
Curvature – preferential diffusion focusing effect at leading edge

Apriori testing of reaction models using DNS of turbulent jet flamesApriori testing of reaction models using DNS of turbulent jet flames
Sutherland et al., submitted 2004
CO/H2/air jet flame, scalar dissipation rate

Joint experiment/computation of turbulent premixed methane/air V-flameJoint experiment/computation of turbulent premixed methane/air V-flame
Stationary statistics required for turbulent premixed flame model development LES/RANS
Flame topology – curvature stretch statistics
Complex chemistry versus simple or tabulated chemistry (heat release, radicals, minor species)
Is preheat zone thickening due to small scales or higher curvatures in thin reaction zone regime? V-flame, expt. Renou 2003
and DNS, Vervisch 2003

Data management challenges for combustion scienceData management challenges for combustion science
• 2D complex chemistry simulations today: 200 restart files (x,y,Z1,…Z50) skeletal n-heptane 41 species, 2000x2000 grid, 1.6 Gbytes/time x200 files = 0.32 Tbyte, 5 runs in parametric study 1.6 Tbytes raw data
• Processed data: 2 Tbyte data
• 3D complex chemistry simulations in 5 years: 200 restart files (x,y,Z1,…Z50) skeletal n-heptane 41 species, 2000x2000x2000 grid, 3.2 Tbytes/time x 200 files = 640 Tbytes per run, 5 runs = 3.2 Petabytes raw data
• Processed data: 3 Petabytes
• Combustion regions of interest are spatially sparse
• Feature-borne analysis and redundant subsetting of data for storage
• Provenance of subsetted data
• Temporal analysis must be done on-the-fly
• Remote access to transport subsets of data for local analysis and viz.

FeaturesFeatures
• Feature is an overloaded word
• A feature in this context is a subset of the data grid that is interesting for some reason.
• Might call it a “Region of Interest” (ROI)
• Also might call it a “structure”

Why Feature Tracking?Why Feature Tracking?
• Reduce size of data– How do you find small ROI’s in a large 3D domain?
– Retrieve and analyze only what you need
• Provide quantification– Can exactly define ROI chosen & do specific statistics
• Enhance visualization– Can visualize features individually
– Can color code features
• Facilitate event searching– Events are feature interactions

Feature DetectionFeature Detection
• Detection = Identify features in each time step
• FDTOOLS tests each cell & groups connected ones
• There are many possible algorithms including pattern recognition

Feature TrackingFeature Tracking
• Tracking = Identify relationships between features in different time steps
• Again, there are many different algorithms, and knowing about how your features interact helps

EventsEvents
• Merge
• (Birth)
• (Death)
• Split
• Other domain specific events like hard-body collision, vorticity tube reconnect, etc. …

Design Goal: Flexible & ReusableDesign Goal: Flexible & Reusable
• Callable from running programs
• Independent of visualization package
• Modular– Detector plug-ins
– Tracker plug-ins
– Other plug-ins …
• CCA compatible
• Output interface for further analysis

DataSet TypesDataSet Types
fdRegular 2 & 3D of all
fdRefined structured(AMR)

FDTOOLS Design (Wendy Koegler SNL)FDTOOLS Design (Wendy Koegler SNL)
FDTOOLS Component
Director Feature Manager
Tracker
RepresenterDetector
Data Interface Output Interface
Analyzer
Visualizer

Detection and tracking of autoignition features
FDTools (Koegler, 2002): evolution of ignition features
Hydroperoxy mass fraction

Feature graph tracks evolution of ignition featuresFeature graph tracks evolution of ignition features
time

Feature-borne analysisFeature-borne analysis
800
1000
1200
1400
1600
1800
2000
2200
2400
2600
2800
0 0.02 0.04 0.06 0.08 0.1Time (msec)
Max
Tem
pera
ture
(K) #5
#46#39#47
#45#40 #11
#18,#52#27
#41,#68

Ignition feature classificationIgnition feature classification
0.000
0.001
0.002
0.003
0.004
0.005
0.006
0.007
0.008
0.009
0.010
1090 1100 1110 1120 1130 1140 1150Average Temperature (K)
Ave
rage
. H2 C
onc.
(mas
s fr
acti
on)
extinquishes
consumed
ignites

Terascale virtual combustion analysis facilityTerascale virtual combustion analysis facility

Data management framework for combustion science – IData management framework for combustion science – I
• Distributed data mining tools: feature ID and tracking
• Distributed analysis tools operating on regions of interest– Reaction source term and Jacobian evaluation
– Conditional statistics
– Isolevel surface of multiply-connected 3D surfaces• Interpolate, integrate, differentiate in principle directions to surface
– Computational singular perturbation analysis
– Reaction flux analysis
– Principal component analysis
– Spectral analysis

Data management framework for combustion science – IIData management framework for combustion science – II
• Data objects, which interface to metadata and data– Enabling writing and reading data with various flexible formats
– Standard data formats
– Automatic conversion utilities
• Flexible, user-configurable, user-friendly GUI’s to enable user to specify desired operations on data
• General structured and unstructured adaptive mesh data
• Real-time feature-borne detection, tracking and analysis for computational steering (e.g. adaptive IO, temporal statistics)

Data management framework for combustion science – IIIData management framework for combustion science – III
• Distributed visualization tools scalar and non-scalar data
• Non-scalar data, i.e. vector or tensor• Heterogeneous data – combined experimental
and computational data• Iso-surface rendering and interpolating data
onto user-specified slices• Streamlines, information overlays• Uncertainty• Viz reduced-order representations of flow and
combustion features