Embed Size (px)
Citation preview
Combustion and Flame 161 (2014) 3073–3084
Contents lists available at ScienceDirect
Combustion and Flame
journal homepage: www.elsevier .com/locate /combustflame
Heat release rate markers for premixed combustion
http://dx.doi.org/10.1016/j.combustflame.2014.05.0190010-2180/� 2014 The Combustion Institute. Published by Elsevier Inc. All rights reserved.
⇑ Corresponding author.E-mail addresses: [email protected] (Z.M. Nikolaou), [email protected]
(N. Swaminathan).
Zacharias M. Nikolaou ⇑, Nedunchezhian SwaminathanCambridge University, Department of Engineering, Trumpington Street, Cambridge CB2 1PZ, UK
a r t i c l e i n f o
Article history:Received 18 November 2013Received in revised form 18 March 2014Accepted 21 May 2014Available online 16 June 2014
Keywords:Heat release rate imagingPremixed combustionFlame markersLaser diagnosticsDirect numerical simulationMild combustion
a b s t r a c t
The validity of the commonly used flame marker for heat release rate (HRR) visualization, namely the rateof the reaction OH + CH2O, HCO + H2O is re-examined. This is done both for methane–air and multi-component fuel–air mixtures for lean and stoichiometric conditions. Two different methods are usedto identify HRR correlations, and it is found that HRR correlations vary strongly with stoichiometry.For the methane mixture there exist alternative HRR markers, while for the multi-component fuel flamethe above correlation is found to be inadequate. Alternative markers for the HRR visualization are thusproposed and their performance under turbulent conditions is evaluated using DNS data.
� 2014 The Combustion Institute. Published by Elsevier Inc. All rights reserved.
1. Introduction
Heat release rate (HRR) is a very important quantity in thestudy of laminar and turbulent reacting flows. From a practicalview point, the spatial distribution of heat release is useful to dis-cern flames and their locations. This spatial distribution directlyinfluences important physical processes such as flame–turbulenceinteraction, sound generation [1] and its interaction with flamesresulting in combustion instabilities [2,3], determining the behav-iour of practical devices such as industrial or aero gas turbines.Although a quantitative measurement of HRR is of great impor-tance from both theoretical and practical view points, it is a chal-lenging task as it involves accurate measurement of the order of50 or more scalar concentrations and temperature simultaneously,since the local heat release rate is given by:
_Q ¼XN
a¼1
_xah0f ;a ð1Þ
where N P 50 is the number of species involved in the oxidation ofthe fuel species, h0
f ;a is the standard enthalpy of formation for spe-cies a and _xa is its reaction rate. A quantitative measurement ofHRR is a daunting task at this time and has been attempted rarely.However, useful correlations for qualitative estimates of local HRRhave been proposed in past studies [4–6]. The primary aims of those
studies [4–6], were to identify a scalar having good, possibly linearcorrelation with the local heat release rate. It was observed by Najmand his co-workers [4–6] that the formyl radical, HCO, showed agood correlation with the local heat release rate for stoichiometricand slightly rich (equivalence ratio, /, of 1.2) methane and dimeth-ylether–air laminar flames. This correlation was also found to beinsensitive to flame stretch (strain and curvature) effects resultingfrom flame–vortex interaction. As Eq. (1) suggests, the chemicalkinetics model used in the computations of laminar flames wouldalso impart due influences on this correlation. Thus, two chemicalmechanisms, one involving 46 reactions and 16 species [7], andGRI Mech 1.2 involving 177 reactions and 32 species, were testedand it was concluded that the correlation of HCO with local HRRwas not disturbed. This reasonably robust correlation, at least forthe conditions tested in [4–6] was attributed to the following tworeasons: (1) HCO is a major intermediate species in the oxidationof CH4 to CO2 and (2) the production of HCO from formaldehyde,CH2O, is directly dependent on the rate of the reactionO + CH3, H + CH2O, which was found to have the largest fractionalcontribution to the local HRR. The production of HCO from CH2Ooccurs through OH + CH2O, HCO + H2O and H + CH2O, HCO +H2. Since the formyl radical is produced in these elementary reac-tions and the signal to noise ratio for laser induced fluorescenceof HCO is generally low compared to OH and CH2O, the product ofOH and CH2O signals was proposed to be an indicator for theHRR. However, a recent study [8] showed that these correlationsinvolving the formyl radical and, the formaldehyde and hydroxylradicals, are inadequate for fuel rich mixtures of unsaturated hydro-carbons and for oxygenated fuels. Also, it was suggested [8] that the
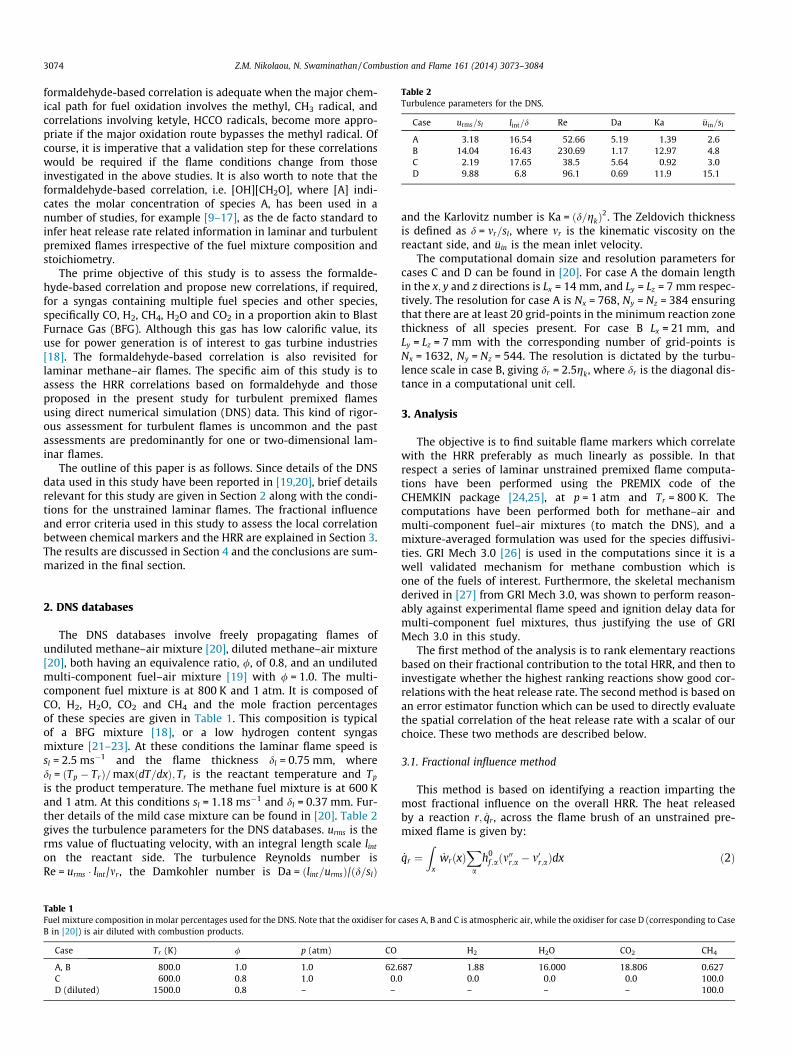
Table 2Turbulence parameters for the DNS.
Case urms=sl lint=d Re Da Ka �uin=sl
A 3.18 16.54 52.66 5.19 1.39 2.6B 14.04 16.43 230.69 1.17 12.97 4.8C 2.19 17.65 38.5 5.64 0.92 3.0D 9.88 6.8 96.1 0.69 11.9 15.1
3074 Z.M. Nikolaou, N. Swaminathan / Combustion and Flame 161 (2014) 3073–3084
formaldehyde-based correlation is adequate when the major chem-ical path for fuel oxidation involves the methyl, CH3 radical, andcorrelations involving ketyle, HCCO radicals, become more appro-priate if the major oxidation route bypasses the methyl radical. Ofcourse, it is imperative that a validation step for these correlationswould be required if the flame conditions change from thoseinvestigated in the above studies. It is also worth to note that theformaldehyde-based correlation, i.e. [OH][CH2O], where [A] indi-cates the molar concentration of species A, has been used in anumber of studies, for example [9–17], as the de facto standard toinfer heat release rate related information in laminar and turbulentpremixed flames irrespective of the fuel mixture composition andstoichiometry.
The prime objective of this study is to assess the formalde-hyde-based correlation and propose new correlations, if required,for a syngas containing multiple fuel species and other species,specifically CO, H2, CH4, H2O and CO2 in a proportion akin to BlastFurnace Gas (BFG). Although this gas has low calorific value, itsuse for power generation is of interest to gas turbine industries[18]. The formaldehyde-based correlation is also revisited forlaminar methane–air flames. The specific aim of this study is toassess the HRR correlations based on formaldehyde and thoseproposed in the present study for turbulent premixed flamesusing direct numerical simulation (DNS) data. This kind of rigor-ous assessment for turbulent flames is uncommon and the pastassessments are predominantly for one or two-dimensional lam-inar flames.
The outline of this paper is as follows. Since details of the DNSdata used in this study have been reported in [19,20], brief detailsrelevant for this study are given in Section 2 along with the condi-tions for the unstrained laminar flames. The fractional influenceand error criteria used in this study to assess the local correlationbetween chemical markers and the HRR are explained in Section 3.The results are discussed in Section 4 and the conclusions are sum-marized in the final section.
2. DNS databases
The DNS databases involve freely propagating flames ofundiluted methane–air mixture [20], diluted methane–air mixture[20], both having an equivalence ratio, /, of 0.8, and an undilutedmulti-component fuel–air mixture [19] with / = 1.0. The multi-component fuel mixture is at 800 K and 1 atm. It is composed ofCO, H2, H2O, CO2 and CH4 and the mole fraction percentagesof these species are given in Table 1. This composition is typicalof a BFG mixture [18], or a low hydrogen content syngasmixture [21–23]. At these conditions the laminar flame speed issl = 2.5 ms�1 and the flame thickness dl = 0.75 mm, wheredl = ðTp � TrÞ=maxðdT=dxÞ; Tr is the reactant temperature and Tp
is the product temperature. The methane fuel mixture is at 600 Kand 1 atm. At this conditions sl = 1.18 ms�1 and dl = 0.37 mm. Fur-ther details of the mild case mixture can be found in [20]. Table 2gives the turbulence parameters for the DNS databases. urms is therms value of fluctuating velocity, with an integral length scale lint
on the reactant side. The turbulence Reynolds number isRe = urms � lint/mr , the Damkohler number is Da = ðlint=urmsÞ/ðd=slÞ
Table 1Fuel mixture composition in molar percentages used for the DNS. Note that the oxidiser forB in [20]) is air diluted with combustion products.
Case Tr (K) / p (atm) CO
A, B 800.0 1.0 1.0 62.6C 600.0 0.8 1.0 0.0D (diluted) 1500.0 0.8 – –
and the Karlovitz number is Ka = ðd=gkÞ2. The Zeldovich thickness
is defined as d = mr=sl, where mr is the kinematic viscosity on thereactant side, and �uin is the mean inlet velocity.
The computational domain size and resolution parameters forcases C and D can be found in [20]. For case A the domain lengthin the x; y and z directions is Lx = 14 mm, and Ly = Lz = 7 mm respec-tively. The resolution for case A is Nx = 768, Ny = Nz = 384 ensuringthat there are at least 20 grid-points in the minimum reaction zonethickness of all species present. For case B Lx = 21 mm, andLy = Lz = 7 mm with the corresponding number of grid-points isNx = 1632, Ny = Nz = 544. The resolution is dictated by the turbu-lence scale in case B, giving dr = 2.5gk, where dr is the diagonal dis-tance in a computational unit cell.
3. Analysis
The objective is to find suitable flame markers which correlatewith the HRR preferably as much linearly as possible. In thatrespect a series of laminar unstrained premixed flame computa-tions have been performed using the PREMIX code of theCHEMKIN package [24,25], at p = 1 atm and Tr = 800 K. Thecomputations have been performed both for methane–air andmulti-component fuel–air mixtures (to match the DNS), and amixture-averaged formulation was used for the species diffusivi-ties. GRI Mech 3.0 [26] is used in the computations since it is awell validated mechanism for methane combustion which isone of the fuels of interest. Furthermore, the skeletal mechanismderived in [27] from GRI Mech 3.0, was shown to perform reason-ably against experimental flame speed and ignition delay data formulti-component fuel mixtures, thus justifying the use of GRIMech 3.0 in this study.
The first method of the analysis is to rank elementary reactionsbased on their fractional contribution to the total HRR, and then toinvestigate whether the highest ranking reactions show good cor-relations with the heat release rate. The second method is based onan error estimator function which can be used to directly evaluatethe spatial correlation of the heat release rate with a scalar of ourchoice. These two methods are described below.
3.1. Fractional influence method
This method is based on identifying a reaction imparting themost fractional influence on the overall HRR. The heat releasedby a reaction r; _qr , across the flame brush of an unstrained pre-mixed flame is given by:
_qr ¼Z
x
_wrðxÞX
ah0
f ;aðm00r;a � m0r;aÞdx ð2Þ
cases A, B and C is atmospheric air, while the oxidiser for case D (corresponding to Case
H2 H2O CO2 CH4
87 1.88 16.000 18.806 0.6270.0 0.0 0.0 100.0– – – 100.0
Z.M. Nikolaou, N. Swaminathan / Combustion and Flame 161 (2014) 3073–3084 3075
where _wr is the net reaction rate of reaction r; h0f ;a is the formation
enthalpy of species a, and m00r;a and m0r;a, are the stoichiometriccoefficients of species a in reaction r in the products and reactantsrespectively. The standard state of 1 atm and 298.15 K is used forthe calculation of the species formation enthalpies. Having calcu-lated _qr each reaction is then ranked according to its fractionalcontribution on the total HRR, fqr ¼ 100 � j _qr j/ _jQtj, where _Qt is thetotal HRR across the flame brush:
_Q t ¼X
r
_qr ð3Þ
Thus,P
r f qr ¼ 100 and, positive and negative values of fqr respec-tively denote endothermic and exothermic reactions. This fractionis not the same as those used in earlier studies of Najm and hisco-workers [4–6] and in [8], where a particular location inside aflame was considered. Although both of these methods are equallygood, the integral method gives an overall measure to identify areaction having the largest fractional influence on the total inte-grated heat release rate. The reaction identified thus is then usedto find chemical markers for the HRR and the performance of thesemarkers for turbulent conditions is evaluated using the DNS datadescribed briefly in Section 2.
3.2. Error estimator method
In this approach, an error measure ZðvÞ for a variable v, whichmay be a reliable HRR marker is defined as:
ZðvÞ ¼Z
x
j _QðxÞjmaxðj _QðxÞjÞ
� jvðxÞjmaxðjvðxÞjÞ
!2
dx ð4Þ
where v can be any variable of our choice such as the concentrationof a species or the rate of a reaction. This error, Z, may then beranked for every variable v using Zþ ¼ 100 � Z=maxðZÞ. It is clearthat the function Z gives an estimate of the error associated withthe variable v, normalized using its maximum value as in Eq. (4),and spatially matched normalized HRR. The choice of v is of coursenot unique, however for any given variable v the one which mini-mizes Z would imply the best correlation with the HRR. The massdensity qYa of a species a, and the net rate of a reaction r; _wr , areused for v to find good HRR markers associated with the concentra-tion of a species and with the rate of a reaction respectively. In thecase v = _wr , this may not be an exact method since the rate of a reac-tion r may have both positive and negative parts thus contributingambiguously to the error estimator Z. However, the top-correlatingreactions when v = _wr were found to have either only positive ornegative contributions across the flame brush, thus not influencingthe above definition.
4. Results and discussion
4.1. Methane fuel–air mixtures
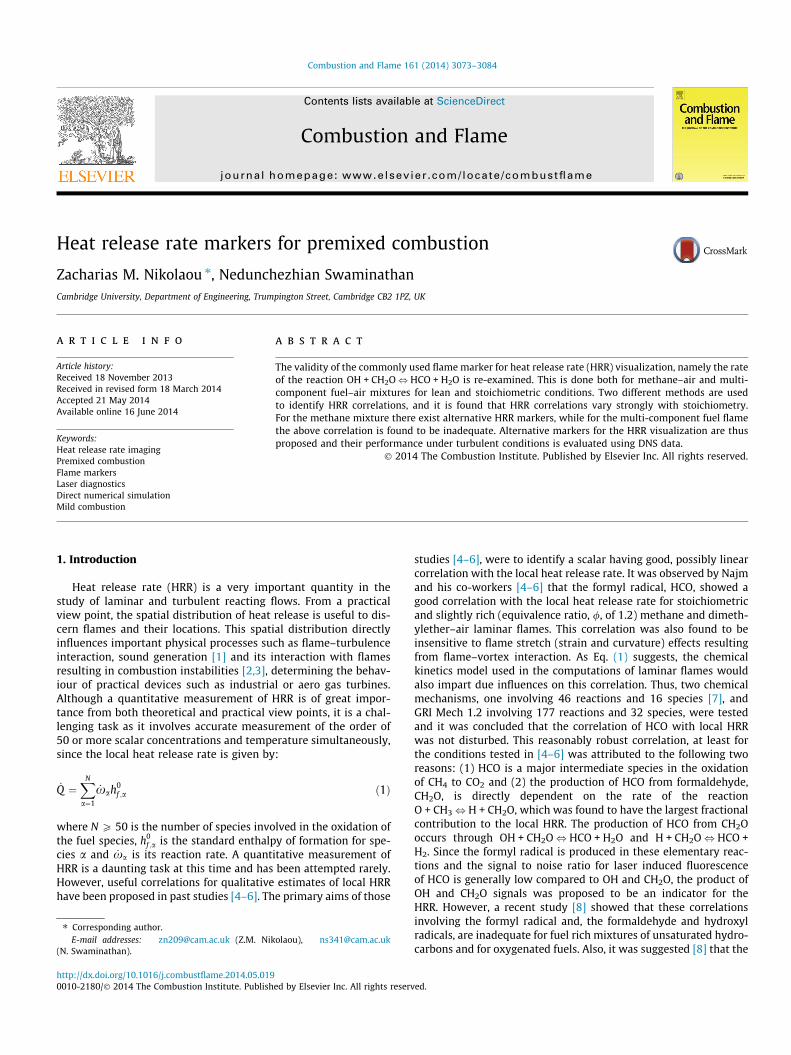
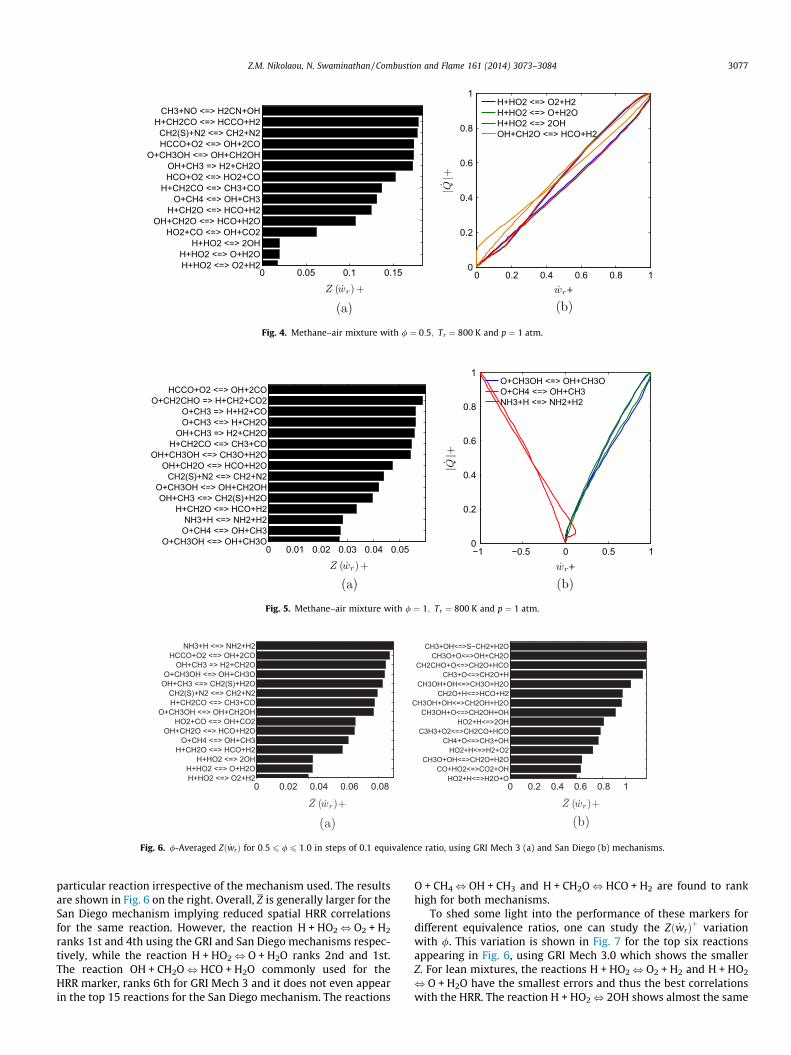
Figures 1(a) and 2(a) show fqr for the methane–air mixtureshaving / = 0.5 and 1.0 respectively. Only the top 15 reactions areshown for convenience. For all conditions the major heat consum-ing reaction is the chain branching reaction H + O2, O + OH. For/ = 0.5 the major heat releasing reactions are OH + CO, H + CO2
followed by O + CH3, H + CH2O. For / = 1.0 this balance is chan-ged. It is important to note that the reaction O + CH3, H + CH2Owas also found to have the largest fractional influence on theHRR in [4], and also in [8] who used a more detailed mechanism[28]. What is noteworthy is that the reaction OH + CH2O,HCO + H2O does not contribute largely to the HRR for / = 0.5, andit does not even appear in the top 15 reactions for / = 1.0 as onecan see from Fig. 2. Furthermore, the relatively small contribution
of the reaction OH + CH2O, HCO + H2O to the HRR was alsoobserved in [8]. The variation of j _Q jþ = j _Q j=maxðj _Q jÞ with the nor-malized net rates _wþr = _wr=maxð _wrÞ, of the top three reactions isshown in Figs. 1(b) and 2(b). It is clear that a large fractional con-tribution of a reaction to the HRR does not automatically implythat this will have a good correlation with the HRR. For examplethe reaction OH + CO, H + CO2 having the highest exothermicfractional influence for the / = 0.5 flame, shows a poorer correla-tion than the reaction O + CH3, H + CH2O which has the secondlargest exothermic fractional influence. Similar arguments applyfor the stoichiometric case also, and thus this method does not helpto identify HRR markers.
Consequently, we use the error measure ZðqYkÞ, defined in Eq.(4). The results are shown in Fig. 3 for the / = 1 case, where theerror measure is normalized using Zþ ¼ 100 � Z=maxðZÞ as notedearlier. Of all the species, the HCO concentration minimizes Zþ
suggesting that this species is expected to have the best possiblecorrelation with the HRR. HCO was also found to give the best cor-relation for the / = 0.5 case (not shown). Indeed one observes thisin the corresponding figure on the right. This result for [HCO] isconsistent with previous studies [4–6]. One also observes fromFig. 3(b) that as Zþ increases the linearity of the correlation withthe HRR becomes poorer, and overall these results help justifyingthe use of Eq. (4) for systematically identifying heat release ratecorrelations.
As noted in the introduction, the signal to noise ratio for HCO inlaser diagnostics is generally low, and thus alternative markerswere proposed for the HRR. This proposition was based on thereactions which are thought to be responsible for the majority ofHCO production [4–6], and one of these reactions is OH + CH2O,HCO + H2O. Thus measuring [OH][CH2O] which is proportional tothe rate of this reaction was expected to give an estimate of theHCO concentration and thus serve as a good marker for the heatrelease rate. In this study, this hypothesis is re-examined usingZð _wrÞ. The results of this analysis are shown in Figs. 4 and 5. Forthe / = 0.5 case, the chain-terminating reaction H + HO2, O2 + H2
has the minimum error as per Eq. (4), followed by the chain-carrying reaction H + HO2, O + H2O. Both of these reactions areexothermic and despite the fact that they do not contribute muchto the overall HRR (see Fig. 1) they have good spatial correlationswith the heat release rate. Also shown in Fig. 4 for comparison, isthe rate of OH + CH2O, HCO + H2O. This reaction has an overalllarger error than the reactions H + HO2, O2 + H2 and H + HO2
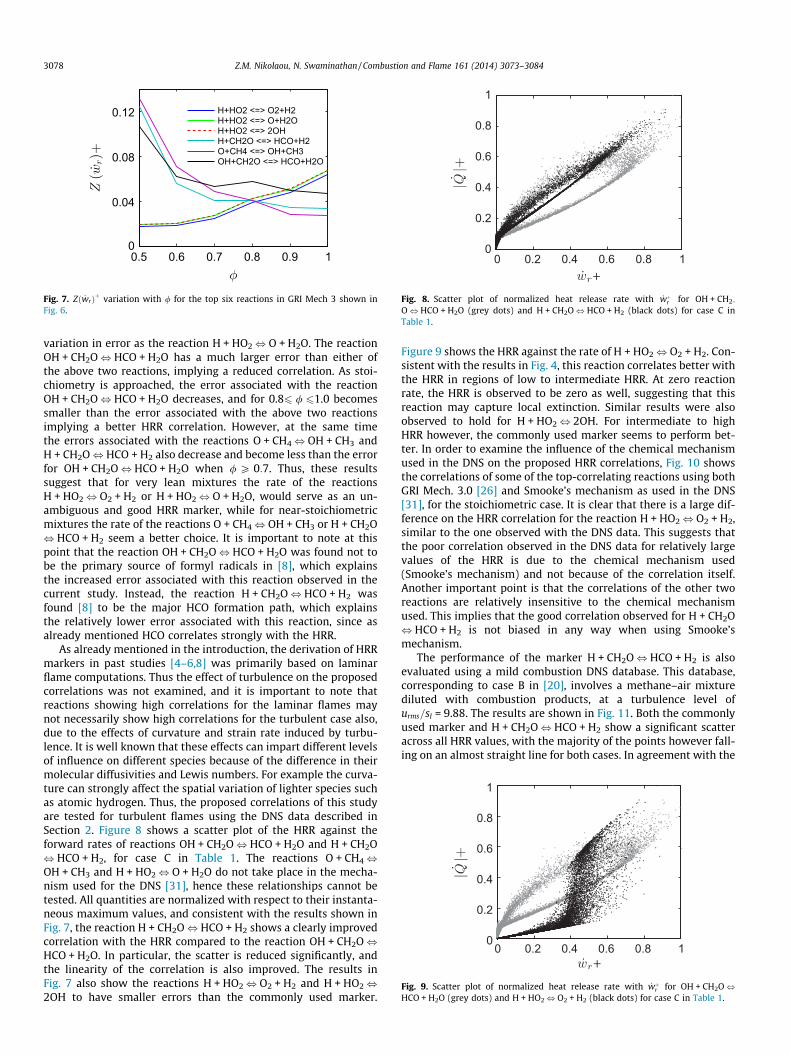
, O + H2O. As one can see from Fig. 4 this error occurs for rela-tively low heat release rates where the correlation of this reactionis observed to be poorer relative to H + HO2, O2 + H2 andH + HO2, O + H2O. For large heat release rates the correlation ofOH + CH2O, HCO + H2O is observed to be better than eitherH + HO2 = O2 + H2 and H + HO2, O + H2O, however since Zð _wrÞgives a measure of the spatial correlation across the whole of theflame brush this is smallest for H + HO2, O2 + H2 and H + HO2,O + H2O implying an overall better correlation with the HRR. Fur-thermore, the rate of the reaction OH + CH2O, HCO + H2O showsa non-zero HRR for zero reaction rate, as one can see from Fig. 4which is consistent with previous studies [4–6,8]. Thus the corre-lation based on this reaction cannot be used to identify localextinction. H + HO2, O2 + H2 and H + HO2, O + H2O on the otherhand show zero HRR at zero rates, implying that these markers cancapture local extinction as well if they can be identified using laserdiagnostics. For the / = 1.0 case, the values of Zþ are altered signif-icantly, with the endothermic reactions O + CH3OH, OH + CH3Oand O + CH4, OH + CH3 having the smallest errors thus implyingthe best correlations with the HRR.
Therefore it is clear that HRR correlation is strongly dependenton the equivalence ratio. In the hope to find a reasonable correla-tion across /, the /-averaged error Z =
P/ Z=N/ where N/ is the
−10 −5 0 5 10H+HO2 <=> O2+H2
H+CH3(+M) <=> CH4(+M)H+O2+N2 <=> HO2+N2
H+HO2 <=> 2OHOH+H2 <=> H+H2O
OH+CH2O <=> HCO+H2OOH+CH4 <=> CH3+H2O
OH+HO2 <=> O2+H2OHCO+O2 <=> HO2+CO
H+O2+H2O <=> HO2+H2OO+CH3 => H+H2+CO
OH+HO2 <=> O2+H2OO+CH3 <=> H+CH2OOH+CO <=> H+CO2
H+O2 <=> O+OH
0 0.2 0.4 0.6 0.8 10
0.2
0.4
0.6
0.8
1H+O2 <=> O+OHOH+CO <=> H+CO2O+CH3 <=> H+CH2O
Fig. 1. Methane–air mixture with / ¼ 0:5; Tr ¼ 800 K and p ¼ 1 atm.
Fig. 2. Methane–air mixture with / ¼ 1; Tr ¼ 800 K and p ¼ 1 atm.
Fig. 3. Methane–air mixture with / ¼ 1; Tr ¼ 800 K and p ¼ 1 atm.
3076 Z.M. Nikolaou, N. Swaminathan / Combustion and Flame 161 (2014) 3073–3084
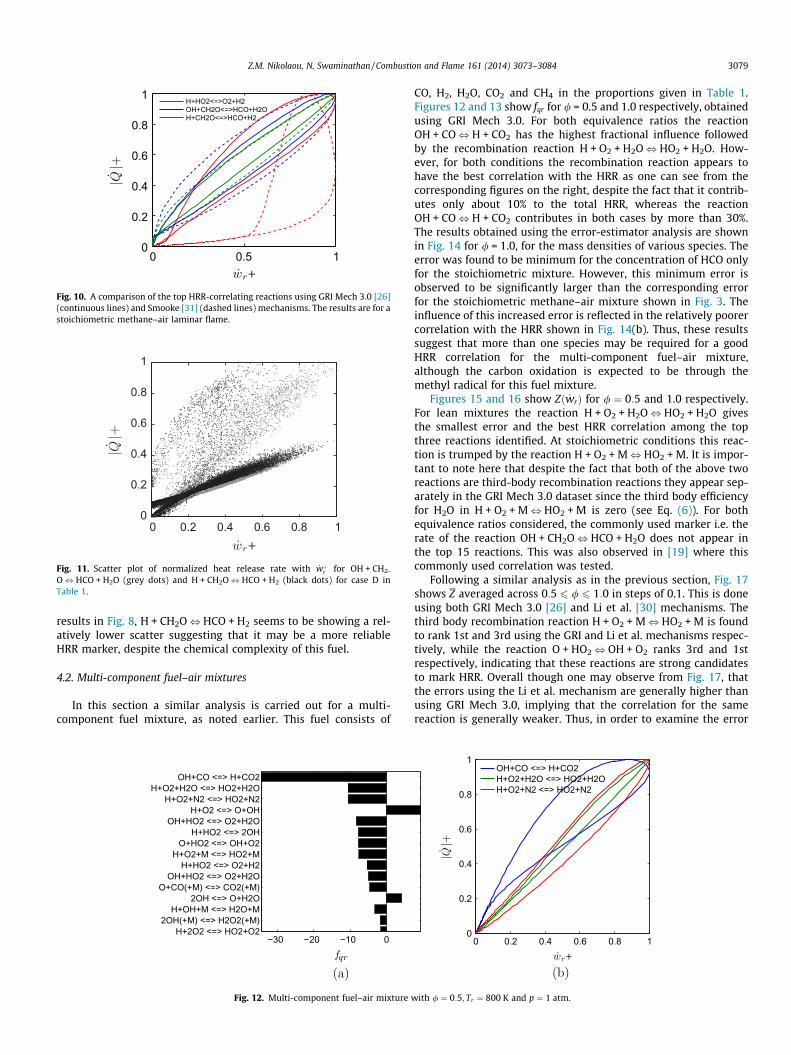
total number of / samples considered, can be used to extract thereaction with the best overall correlation across different stoichi-ometry. Towards this goal, and with lean combustion in mind,computations of laminar premixed flames for 0:5 6 / 6 1:0 insteps of 0.1 have been conducted and Z calculated for all reactions.In a similar manner to the analysis using Z, the reactions are rankedbased on the value of Z. The results are shown in Fig. 6, using the
GRI Mech 3 [26] and the San Diego [29] mechanisms. As noted inthe introduction, the observed correlations depend on the chemicalmechanism used. The use of the San Diego mechanism will help toelucidate this dependence and to see whether the same reactionsshowing the smallest Z for GRI Mech 3.0, also show the same trendfor a different mechanism. Reactions ranking high in both mecha-nisms would thus imply possibly good HRR correlations for that
0 0.05 0.1 0.15H+HO2 <=> O2+H2H+HO2 <=> O+H2O
H+HO2 <=> 2OHHO2+CO <=> OH+CO2
OH+CH2O <=> HCO+H2OH+CH2O <=> HCO+H2
O+CH4 <=> OH+CH3H+CH2CO <=> CH3+CO
HCO+O2 <=> HO2+COOH+CH3 => H2+CH2O
O+CH3OH <=> OH+CH2OHHCCO+O2 <=> OH+2COCH2(S)+N2 <=> CH2+N2
H+CH2CO <=> HCCO+H2CH3+NO <=> H2CN+OH
0 0.2 0.4 0.6 0.8 10
0.2
0.4
0.6
0.8
1H+HO2 <=> O2+H2H+HO2 <=> O+H2OH+HO2 <=> 2OHOH+CH2O <=> HCO+H2
Fig. 4. Methane–air mixture with / ¼ 0:5; Tr ¼ 800 K and p ¼ 1 atm.
0 0.01 0.02 0.03 0.04 0.05O+CH3OH <=> OH+CH3O
O+CH4 <=> OH+CH3NH3+H <=> NH2+H2
H+CH2O <=> HCO+H2OH+CH3 <=> CH2(S)+H2O
O+CH3OH <=> OH+CH2OHCH2(S)+N2 <=> CH2+N2
OH+CH2O <=> HCO+H2OOH+CH3OH <=> CH3O+H2O
H+CH2CO <=> CH3+COOH+CH3 => H2+CH2O
O+CH3 <=> H+CH2OO+CH3 => H+H2+CO
O+CH2CHO => H+CH2+CO2HCCO+O2 <=> OH+2CO
−1 −0.5 0 0.5 10
0.2
0.4
0.6
0.8
1O+CH3OH <=> OH+CH3OO+CH4 <=> OH+CH3NH3+H <=> NH2+H2
Fig. 5. Methane–air mixture with / ¼ 1; Tr ¼ 800 K and p ¼ 1 atm.
0 0.02 0.04 0.06 0.08H+HO2 <=> O2+H2H+HO2 <=> O+H2O
H+HO2 <=> 2OHH+CH2O <=> HCO+H2
O+CH4 <=> OH+CH3OH+CH2O <=> HCO+H2O
HO2+CO <=> OH+CO2O+CH3OH <=> OH+CH2OH
H+CH2CO <=> CH3+COCH2(S)+N2 <=> CH2+N2
OH+CH3 <=> CH2(S)+H2OO+CH3OH <=> OH+CH3O
OH+CH3 => H2+CH2OHCCO+O2 <=> OH+2CO
NH3+H <=> NH2+H2
0 0.2 0.4 0.6 0.8 1HO2+H<=>H2O+O
CO+HO2<=>CO2+OHCH3O+OH<=>CH2O+H2O
HO2+H<=>H2+O2CH4+O<=>CH3+OH
C3H3+O2<=>CH2CO+HCOHO2+H<=>2OH
CH3OH+O<=>CH2OH+OHCH3OH+OH<=>CH2OH+H2O
CH2O+H<=>HCO+H2CH3OH+OH<=>CH3O+H2O
CH3+O<=>CH2O+HCH2CHO+O<=>CH2O+HCO
CH3O+O<=>OH+CH2OCH3+OH<=>S−CH2+H2O
Fig. 6. /-Averaged Zð _wrÞ for 0:5 6 / 6 1:0 in steps of 0.1 equivalence ratio, using GRI Mech 3 (a) and San Diego (b) mechanisms.
Z.M. Nikolaou, N. Swaminathan / Combustion and Flame 161 (2014) 3073–3084 3077
particular reaction irrespective of the mechanism used. The resultsare shown in Fig. 6 on the right. Overall, Z is generally larger for theSan Diego mechanism implying reduced spatial HRR correlationsfor the same reaction. However, the reaction H + HO2, O2 + H2
ranks 1st and 4th using the GRI and San Diego mechanisms respec-tively, while the reaction H + HO2, O + H2O ranks 2nd and 1st.The reaction OH + CH2O, HCO + H2O commonly used for theHRR marker, ranks 6th for GRI Mech 3 and it does not even appearin the top 15 reactions for the San Diego mechanism. The reactions
O + CH4, OH + CH3 and H + CH2O, HCO + H2 are found to rankhigh for both mechanisms.
To shed some light into the performance of these markers fordifferent equivalence ratios, one can study the Zð _wrÞþ variationwith /. This variation is shown in Fig. 7 for the top six reactionsappearing in Fig. 6, using GRI Mech 3.0 which shows the smallerZ. For lean mixtures, the reactions H + HO2, O2 + H2 and H + HO2
, O + H2O have the smallest errors and thus the best correlationswith the HRR. The reaction H + HO2, 2OH shows almost the same
0.5 0.6 0.7 0.8 0.9 10
0.04
0.08
0.12 H+HO2 <=> O2+H2H+HO2 <=> O+H2OH+HO2 <=> 2OHH+CH2O <=> HCO+H2O+CH4 <=> OH+CH3OH+CH2O <=> HCO+H2O
Fig. 7. Zð _wrÞþ variation with / for the top six reactions in GRI Mech 3 shown inFig. 6.
0 0.2 0.4 0.6 0.8 10
0.2
0.4
0.6
0.8
1
Fig. 8. Scatter plot of normalized heat release rate with _wþr for OH + CH2-
O, HCO + H2O (grey dots) and H + CH2O, HCO + H2 (black dots) for case C inTable 1.
0 0.2 0.4 0.6 0.8 10
0.2
0.4
0.6
0.8
1
Fig. 9. Scatter plot of normalized heat release rate with _wþr for OH + CH2O,HCO + H2O (grey dots) and H + HO2, O2 + H2 (black dots) for case C in Table 1.
3078 Z.M. Nikolaou, N. Swaminathan / Combustion and Flame 161 (2014) 3073–3084
variation in error as the reaction H + HO2, O + H2O. The reactionOH + CH2O, HCO + H2O has a much larger error than either ofthe above two reactions, implying a reduced correlation. As stoi-chiometry is approached, the error associated with the reactionOH + CH2O, HCO + H2O decreases, and for 0.86 / 61.0 becomessmaller than the error associated with the above two reactionsimplying a better HRR correlation. However, at the same timethe errors associated with the reactions O + CH4, OH + CH3 andH + CH2O, HCO + H2 also decrease and become less than the errorfor OH + CH2O, HCO + H2O when / P 0:7. Thus, these resultssuggest that for very lean mixtures the rate of the reactionsH + HO2, O2 + H2 or H + HO2, O + H2O, would serve as an un-ambiguous and good HRR marker, while for near-stoichiometricmixtures the rate of the reactions O + CH4, OH + CH3 or H + CH2O, HCO + H2 seem a better choice. It is important to note at thispoint that the reaction OH + CH2O, HCO + H2O was found not tobe the primary source of formyl radicals in [8], which explainsthe increased error associated with this reaction observed in thecurrent study. Instead, the reaction H + CH2O, HCO + H2 wasfound [8] to be the major HCO formation path, which explainsthe relatively lower error associated with this reaction, since asalready mentioned HCO correlates strongly with the HRR.
As already mentioned in the introduction, the derivation of HRRmarkers in past studies [4–6,8] was primarily based on laminarflame computations. Thus the effect of turbulence on the proposedcorrelations was not examined, and it is important to note thatreactions showing high correlations for the laminar flames maynot necessarily show high correlations for the turbulent case also,due to the effects of curvature and strain rate induced by turbu-lence. It is well known that these effects can impart different levelsof influence on different species because of the difference in theirmolecular diffusivities and Lewis numbers. For example the curva-ture can strongly affect the spatial variation of lighter species suchas atomic hydrogen. Thus, the proposed correlations of this studyare tested for turbulent flames using the DNS data described inSection 2. Figure 8 shows a scatter plot of the HRR against theforward rates of reactions OH + CH2O, HCO + H2O and H + CH2O, HCO + H2, for case C in Table 1. The reactions O + CH4,OH + CH3 and H + HO2, O + H2O do not take place in the mecha-nism used for the DNS [31], hence these relationships cannot betested. All quantities are normalized with respect to their instanta-neous maximum values, and consistent with the results shown inFig. 7, the reaction H + CH2O, HCO + H2 shows a clearly improvedcorrelation with the HRR compared to the reaction OH + CH2O,HCO + H2O. In particular, the scatter is reduced significantly, andthe linearity of the correlation is also improved. The results inFig. 7 also show the reactions H + HO2, O2 + H2 and H + HO2,2OH to have smaller errors than the commonly used marker.
Figure 9 shows the HRR against the rate of H + HO2, O2 + H2. Con-sistent with the results in Fig. 4, this reaction correlates better withthe HRR in regions of low to intermediate HRR. At zero reactionrate, the HRR is observed to be zero as well, suggesting that thisreaction may capture local extinction. Similar results were alsoobserved to hold for H + HO2, 2OH. For intermediate to highHRR however, the commonly used marker seems to perform bet-ter. In order to examine the influence of the chemical mechanismused in the DNS on the proposed HRR correlations, Fig. 10 showsthe correlations of some of the top-correlating reactions using bothGRI Mech. 3.0 [26] and Smooke’s mechanism as used in the DNS[31], for the stoichiometric case. It is clear that there is a large dif-ference on the HRR correlation for the reaction H + HO2, O2 + H2,similar to the one observed with the DNS data. This suggests thatthe poor correlation observed in the DNS data for relatively largevalues of the HRR is due to the chemical mechanism used(Smooke’s mechanism) and not because of the correlation itself.Another important point is that the correlations of the other tworeactions are relatively insensitive to the chemical mechanismused. This implies that the good correlation observed for H + CH2O, HCO + H2 is not biased in any way when using Smooke’smechanism.
The performance of the marker H + CH2O, HCO + H2 is alsoevaluated using a mild combustion DNS database. This database,corresponding to case B in [20], involves a methane–air mixturediluted with combustion products, at a turbulence level ofurms=sl = 9.88. The results are shown in Fig. 11. Both the commonlyused marker and H + CH2O, HCO + H2 show a significant scatteracross all HRR values, with the majority of the points however fall-ing on an almost straight line for both cases. In agreement with the
0 0.5 10
0.2
0.4
0.6
0.8
1H+HO2<=>O2+H2OH+CH2O<=>HCO+H2OH+CH2O<=>HCO+H2
Fig. 10. A comparison of the top HRR-correlating reactions using GRI Mech 3.0 [26](continuous lines) and Smooke [31] (dashed lines) mechanisms. The results are for astoichiometric methane–air laminar flame.
0 0.2 0.4 0.6 0.8 10
0.2
0.4
0.6
0.8
1
Fig. 11. Scatter plot of normalized heat release rate with _wþr for OH + CH2-
O, HCO + H2O (grey dots) and H + CH2O, HCO + H2 (black dots) for case D inTable 1.
Z.M. Nikolaou, N. Swaminathan / Combustion and Flame 161 (2014) 3073–3084 3079
results in Fig. 8, H + CH2O, HCO + H2 seems to be showing a rel-atively lower scatter suggesting that it may be a more reliableHRR marker, despite the chemical complexity of this fuel.
4.2. Multi-component fuel–air mixtures
In this section a similar analysis is carried out for a multi-component fuel mixture, as noted earlier. This fuel consists of
−30 −20 −10 0H+2O2 <=> HO2+O2
2OH(+M) <=> H2O2(+M)H+OH+M <=> H2O+M
2OH <=> O+H2OO+CO(+M) <=> CO2(+M)
OH+HO2 <=> O2+H2OH+HO2 <=> O2+H2
H+O2+M <=> HO2+MO+HO2 <=> OH+O2
H+HO2 <=> 2OHOH+HO2 <=> O2+H2O
H+O2 <=> O+OHH+O2+N2 <=> HO2+N2
H+O2+H2O <=> HO2+H2OOH+CO <=> H+CO2
Fig. 12. Multi-component fuel–air mixture w
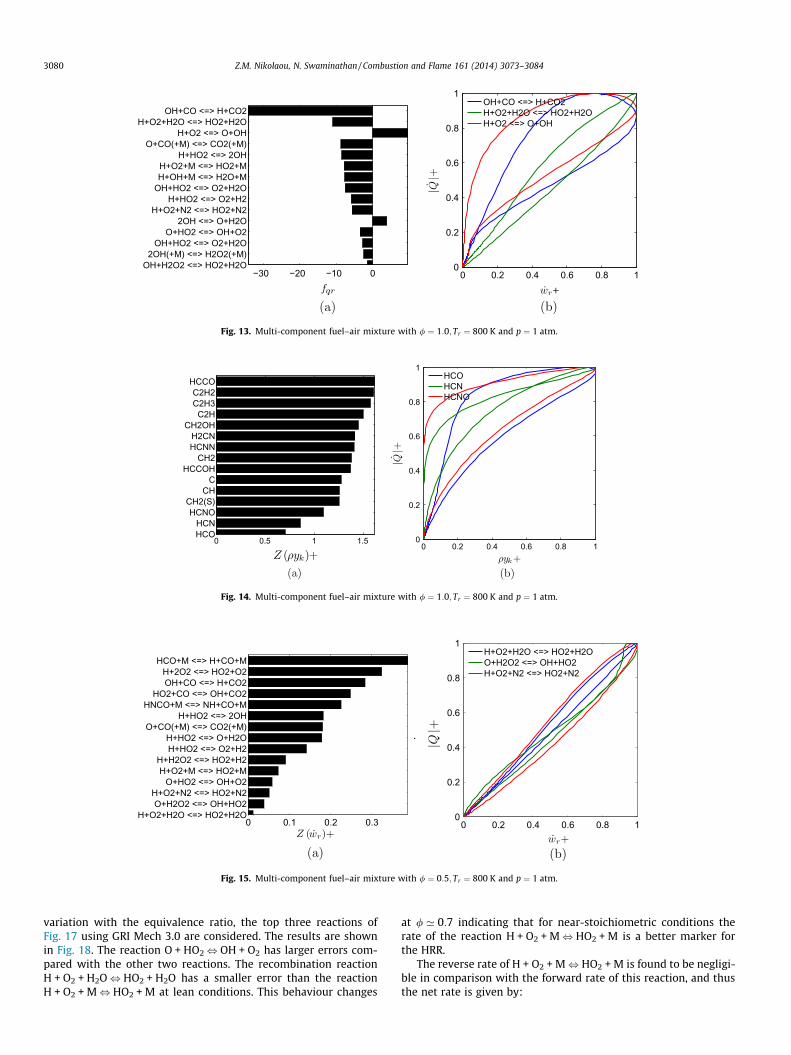
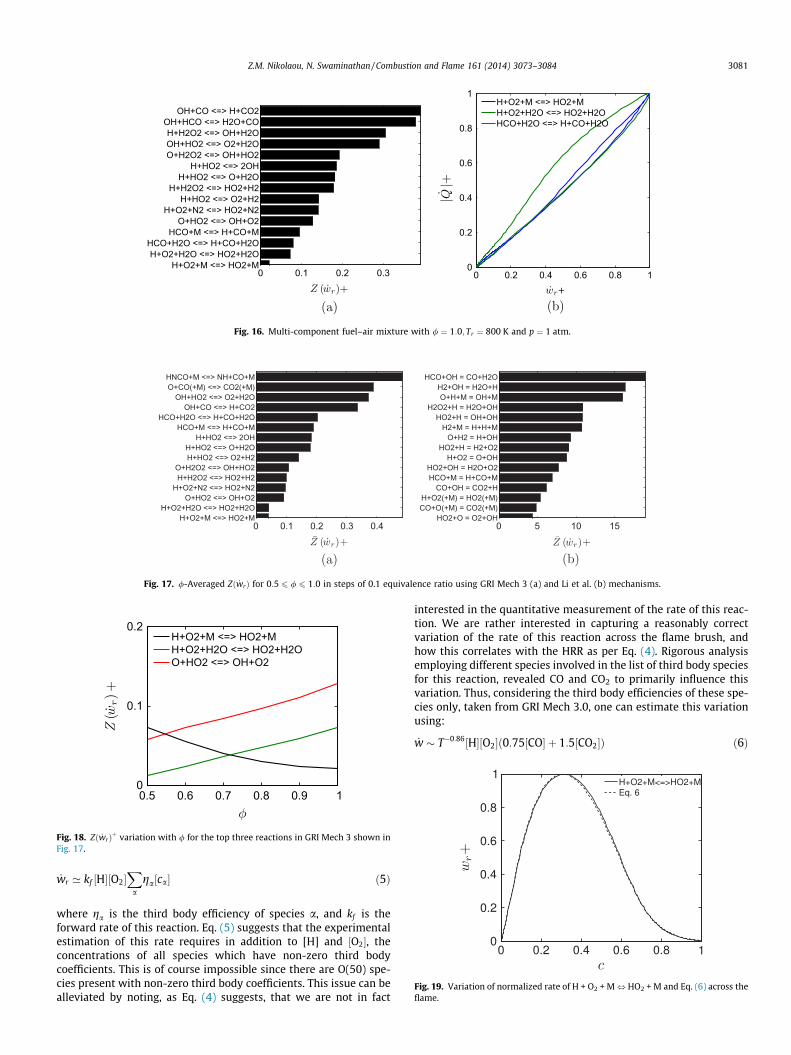
CO, H2, H2O, CO2 and CH4 in the proportions given in Table 1.Figures 12 and 13 show fqr for / = 0.5 and 1.0 respectively, obtainedusing GRI Mech 3.0. For both equivalence ratios the reactionOH + CO, H + CO2 has the highest fractional influence followedby the recombination reaction H + O2 + H2O, HO2 + H2O. How-ever, for both conditions the recombination reaction appears tohave the best correlation with the HRR as one can see from thecorresponding figures on the right, despite the fact that it contrib-utes only about 10% to the total HRR, whereas the reactionOH + CO, H + CO2 contributes in both cases by more than 30%.The results obtained using the error-estimator analysis are shownin Fig. 14 for / = 1.0, for the mass densities of various species. Theerror was found to be minimum for the concentration of HCO onlyfor the stoichiometric mixture. However, this minimum error isobserved to be significantly larger than the corresponding errorfor the stoichiometric methane–air mixture shown in Fig. 3. Theinfluence of this increased error is reflected in the relatively poorercorrelation with the HRR shown in Fig. 14(b). Thus, these resultssuggest that more than one species may be required for a goodHRR correlation for the multi-component fuel–air mixture,although the carbon oxidation is expected to be through themethyl radical for this fuel mixture.
Figures 15 and 16 show Zð _wrÞ for / ¼ 0:5 and 1.0 respectively.For lean mixtures the reaction H + O2 + H2O, HO2 + H2O givesthe smallest error and the best HRR correlation among the topthree reactions identified. At stoichiometric conditions this reac-tion is trumped by the reaction H + O2 + M, HO2 + M. It is impor-tant to note here that despite the fact that both of the above tworeactions are third-body recombination reactions they appear sep-arately in the GRI Mech 3.0 dataset since the third body efficiencyfor H2O in H + O2 + M, HO2 + M is zero (see Eq. (6)). For bothequivalence ratios considered, the commonly used marker i.e. therate of the reaction OH + CH2O, HCO + H2O does not appear inthe top 15 reactions. This was also observed in [19] where thiscommonly used correlation was tested.
Following a similar analysis as in the previous section, Fig. 17shows Z averaged across 0:5 6 / 6 1:0 in steps of 0.1. This is doneusing both GRI Mech 3.0 [26] and Li et al. [30] mechanisms. Thethird body recombination reaction H + O2 + M, HO2 + M is foundto rank 1st and 3rd using the GRI and Li et al. mechanisms respec-tively, while the reaction O + HO2, OH + O2 ranks 3rd and 1strespectively, indicating that these reactions are strong candidatesto mark HRR. Overall though one may observe from Fig. 17, thatthe errors using the Li et al. mechanism are generally higher thanusing GRI Mech 3.0, implying that the correlation for the samereaction is generally weaker. Thus, in order to examine the error
0 0.2 0.4 0.6 0.8 10
0.2
0.4
0.6
0.8
1OH+CO <=> H+CO2H+O2+H2O <=> HO2+H2OH+O2+N2 <=> HO2+N2
ith / ¼ 0:5; Tr ¼ 800 K and p ¼ 1 atm.
−30 −20 −10 0OH+H2O2 <=> HO2+H2O
2OH(+M) <=> H2O2(+M)OH+HO2 <=> O2+H2O
O+HO2 <=> OH+O22OH <=> O+H2O
H+O2+N2 <=> HO2+N2H+HO2 <=> O2+H2
OH+HO2 <=> O2+H2OH+OH+M <=> H2O+MH+O2+M <=> HO2+M
H+HO2 <=> 2OHO+CO(+M) <=> CO2(+M)
H+O2 <=> O+OHH+O2+H2O <=> HO2+H2O
OH+CO <=> H+CO2
0 0.2 0.4 0.6 0.8 10
0.2
0.4
0.6
0.8
1OH+CO <=> H+CO2H+O2+H2O <=> HO2+H2OH+O2 <=> O+OH
Fig. 13. Multi-component fuel–air mixture with / ¼ 1:0; Tr ¼ 800 K and p ¼ 1 atm.
0 0.5 1 1.5HCOHCN
HCNOCH2(S)
CHC
HCCOHCH2
HCNNH2CN
CH2OHC2H
C2H3C2H2
HCCO
0 0.2 0.4 0.6 0.8 10
0.2
0.4
0.6
0.8
1HCOHCNHCNO
Fig. 14. Multi-component fuel–air mixture with / ¼ 1:0; Tr ¼ 800 K and p ¼ 1 atm.
0 0.1 0.2 0.3H+O2+H2O <=> HO2+H2O
O+H2O2 <=> OH+HO2H+O2+N2 <=> HO2+N2
O+HO2 <=> OH+O2H+O2+M <=> HO2+M
H+H2O2 <=> HO2+H2H+HO2 <=> O2+H2H+HO2 <=> O+H2O
O+CO(+M) <=> CO2(+M)H+HO2 <=> 2OH
HNCO+M <=> NH+CO+MHO2+CO <=> OH+CO2
OH+CO <=> H+CO2H+2O2 <=> HO2+O2
HCO+M <=> H+CO+M
0 0.2 0.4 0.6 0.8 10
0.2
0.4
0.6
0.8
1H+O2+H2O <=> HO2+H2OO+H2O2 <=> OH+HO2H+O2+N2 <=> HO2+N2
Fig. 15. Multi-component fuel–air mixture with / ¼ 0:5; Tr ¼ 800 K and p ¼ 1 atm.
3080 Z.M. Nikolaou, N. Swaminathan / Combustion and Flame 161 (2014) 3073–3084
variation with the equivalence ratio, the top three reactions ofFig. 17 using GRI Mech 3.0 are considered. The results are shownin Fig. 18. The reaction O + HO2, OH + O2 has larger errors com-pared with the other two reactions. The recombination reactionH + O2 + H2O, HO2 + H2O has a smaller error than the reactionH + O2 + M, HO2 + M at lean conditions. This behaviour changes
at / ’ 0:7 indicating that for near-stoichiometric conditions therate of the reaction H + O2 + M, HO2 + M is a better marker forthe HRR.
The reverse rate of H + O2 + M, HO2 + M is found to be negligi-ble in comparison with the forward rate of this reaction, and thusthe net rate is given by:
0 0.1 0.2 0.3H+O2+M <=> HO2+M
H+O2+H2O <=> HO2+H2OHCO+H2O <=> H+CO+H2O
HCO+M <=> H+CO+MO+HO2 <=> OH+O2
H+O2+N2 <=> HO2+N2H+HO2 <=> O2+H2
H+H2O2 <=> HO2+H2H+HO2 <=> O+H2O
H+HO2 <=> 2OHO+H2O2 <=> OH+HO2OH+HO2 <=> O2+H2OH+H2O2 <=> OH+H2O
OH+HCO <=> H2O+COOH+CO <=> H+CO2
0 0.2 0.4 0.6 0.8 10
0.2
0.4
0.6
0.8
1H+O2+M <=> HO2+MH+O2+H2O <=> HO2+H2OHCO+H2O <=> H+CO+H2O
Fig. 16. Multi-component fuel–air mixture with / ¼ 1:0; Tr ¼ 800 K and p ¼ 1 atm.
0 0.1 0.2 0.3 0.4H+O2+M <=> HO2+M
H+O2+H2O <=> HO2+H2OO+HO2 <=> OH+O2
H+O2+N2 <=> HO2+N2H+H2O2 <=> HO2+H2
O+H2O2 <=> OH+HO2H+HO2 <=> O2+H2H+HO2 <=> O+H2O
H+HO2 <=> 2OHHCO+M <=> H+CO+M
HCO+H2O <=> H+CO+H2OOH+CO <=> H+CO2
OH+HO2 <=> O2+H2OO+CO(+M) <=> CO2(+M)HNCO+M <=> NH+CO+M
0 5 10 15HO2+O = O2+OH
CO+O(+M) = CO2(+M)H+O2(+M) = HO2(+M)
CO+OH = CO2+HHCO+M = H+CO+MHO2+OH = H2O+O2
H+O2 = O+OHHO2+H = H2+O2
O+H2 = H+OHH2+M = H+H+M
HO2+H = OH+OHH2O2+H = H2O+OH
O+H+M = OH+MH2+OH = H2O+H
HCO+OH = CO+H2O
Fig. 17. /-Averaged Zð _wrÞ for 0:5 6 / 6 1:0 in steps of 0.1 equivalence ratio using GRI Mech 3 (a) and Li et al. (b) mechanisms.
0.5 0.6 0.7 0.8 0.9 10
0.1
0.2H+O2+M <=> HO2+MH+O2+H2O <=> HO2+H2OO+HO2 <=> OH+O2
Fig. 18. Zð _wrÞþ variation with / for the top three reactions in GRI Mech 3 shown inFig. 17.
Fig. 19. Variation of normalized rate of H + O2 + M, HO2 + M and Eq. (6) across theflame.
Z.M. Nikolaou, N. Swaminathan / Combustion and Flame 161 (2014) 3073–3084 3081
_wr ’ kf ½H�½O2�X
aga½ca� ð5Þ
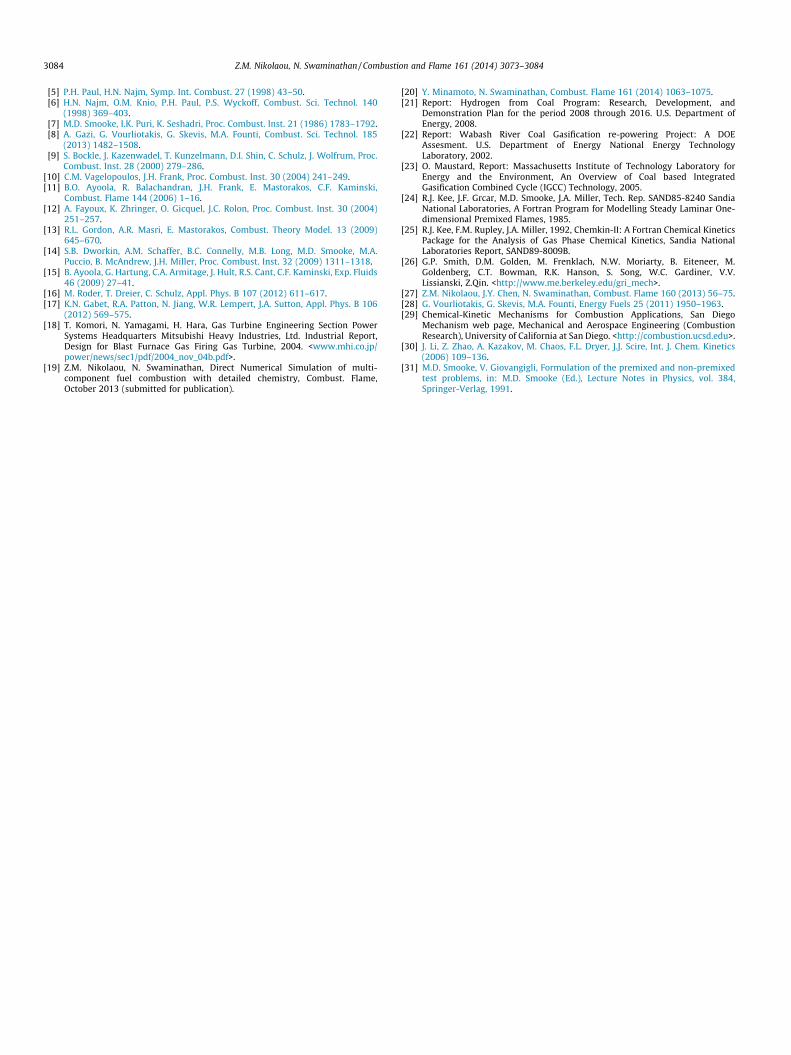
where ga is the third body efficiency of species a, and kf is theforward rate of this reaction. Eq. (5) suggests that the experimentalestimation of this rate requires in addition to [H] and ½O2�, theconcentrations of all species which have non-zero third bodycoefficients. This is of course impossible since there are O(50) spe-cies present with non-zero third body coefficients. This issue can bealleviated by noting, as Eq. (4) suggests, that we are not in fact
interested in the quantitative measurement of the rate of this reac-tion. We are rather interested in capturing a reasonably correctvariation of the rate of this reaction across the flame brush, andhow this correlates with the HRR as per Eq. (4). Rigorous analysisemploying different species involved in the list of third body speciesfor this reaction, revealed CO and CO2 to primarily influence thisvariation. Thus, considering the third body efficiencies of these spe-cies only, taken from GRI Mech 3.0, one can estimate this variationusing:
_w � T�0:86½H�½O2� 0:75½CO� þ 1:5½CO2�ð Þ ð6Þ
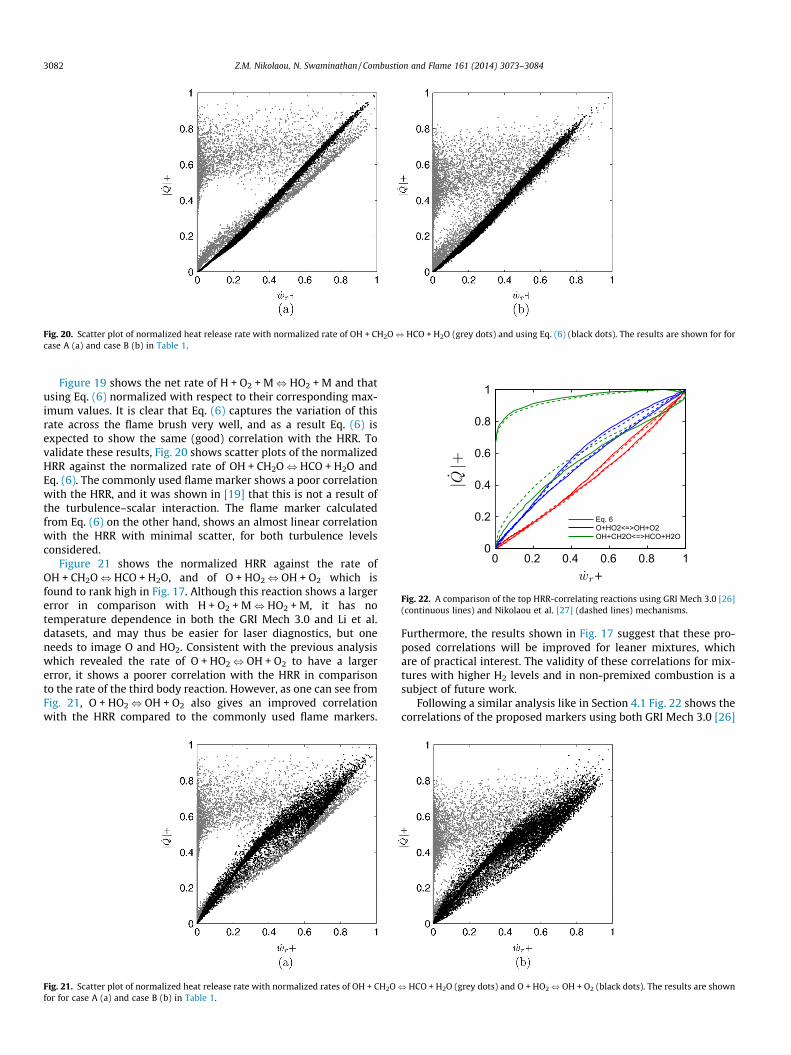
Fig. 20. Scatter plot of normalized heat release rate with normalized rate of OH + CH2O, HCO + H2O (grey dots) and using Eq. (6) (black dots). The results are shown for forcase A (a) and case B (b) in Table 1.
0 0.2 0.4 0.6 0.8 10
0.2
0.4
0.6
0.8
1
Eq. 6O+HO2<=>OH+O2OH+CH2O<=>HCO+H2O
Fig. 22. A comparison of the top HRR-correlating reactions using GRI Mech 3.0 [26](continuous lines) and Nikolaou et al. [27] (dashed lines) mechanisms.
3082 Z.M. Nikolaou, N. Swaminathan / Combustion and Flame 161 (2014) 3073–3084
Figure 19 shows the net rate of H + O2 + M, HO2 + M and thatusing Eq. (6) normalized with respect to their corresponding max-imum values. It is clear that Eq. (6) captures the variation of thisrate across the flame brush very well, and as a result Eq. (6) isexpected to show the same (good) correlation with the HRR. Tovalidate these results, Fig. 20 shows scatter plots of the normalizedHRR against the normalized rate of OH + CH2O, HCO + H2O andEq. (6). The commonly used flame marker shows a poor correlationwith the HRR, and it was shown in [19] that this is not a result ofthe turbulence–scalar interaction. The flame marker calculatedfrom Eq. (6) on the other hand, shows an almost linear correlationwith the HRR with minimal scatter, for both turbulence levelsconsidered.
Figure 21 shows the normalized HRR against the rate ofOH + CH2O, HCO + H2O, and of O + HO2, OH + O2 which isfound to rank high in Fig. 17. Although this reaction shows a largererror in comparison with H + O2 + M, HO2 + M, it has notemperature dependence in both the GRI Mech 3.0 and Li et al.datasets, and may thus be easier for laser diagnostics, but oneneeds to image O and HO2. Consistent with the previous analysiswhich revealed the rate of O + HO2, OH + O2 to have a largererror, it shows a poorer correlation with the HRR in comparisonto the rate of the third body reaction. However, as one can see fromFig. 21, O + HO2, OH + O2 also gives an improved correlationwith the HRR compared to the commonly used flame markers.
Fig. 21. Scatter plot of normalized heat release rate with normalized rates of OH + CH2Ofor for case A (a) and case B (b) in Table 1.
Furthermore, the results shown in Fig. 17 suggest that these pro-posed correlations will be improved for leaner mixtures, whichare of practical interest. The validity of these correlations for mix-tures with higher H2 levels and in non-premixed combustion is asubject of future work.
Following a similar analysis like in Section 4.1 Fig. 22 shows thecorrelations of the proposed markers using both GRI Mech 3.0 [26]
, HCO + H2O (grey dots) and O + HO2, OH + O2 (black dots). The results are shown
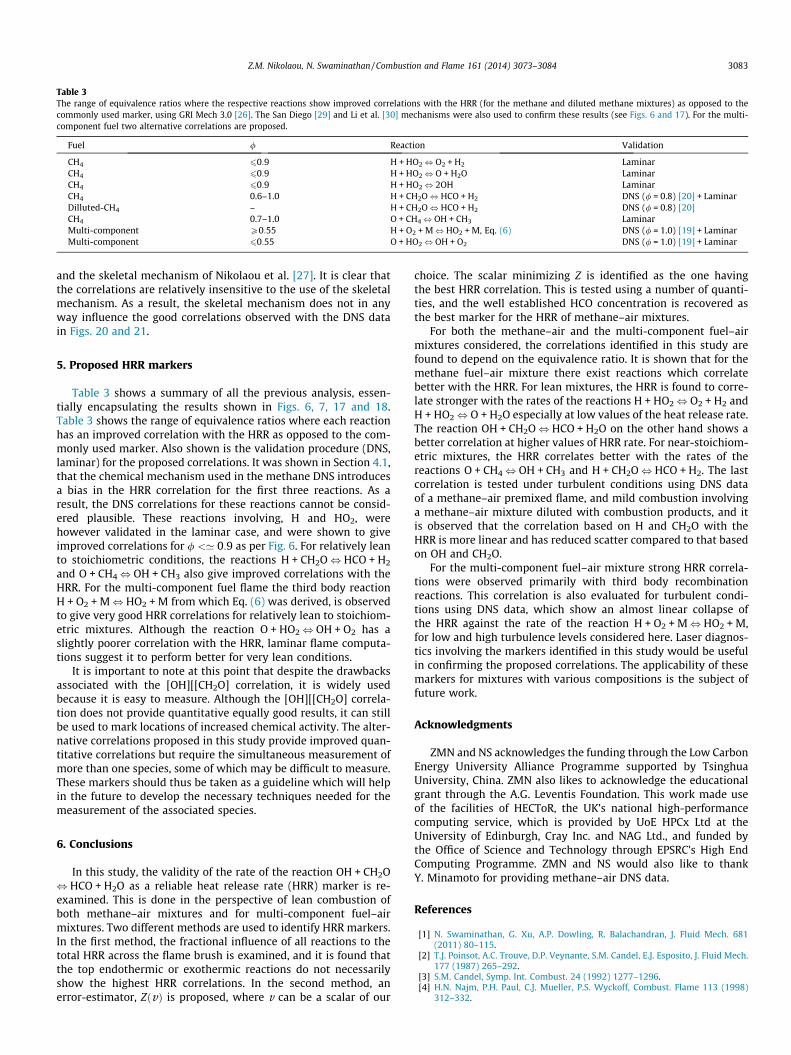
Table 3The range of equivalence ratios where the respective reactions show improved correlations with the HRR (for the methane and diluted methane mixtures) as opposed to thecommonly used marker, using GRI Mech 3.0 [26]. The San Diego [29] and Li et al. [30] mechanisms were also used to confirm these results (see Figs. 6 and 17). For the multi-component fuel two alternative correlations are proposed.
Fuel / Reaction Validation
CH4 60:9 H + HO2, O2 + H2 LaminarCH4 60:9 H + HO2, O + H2O LaminarCH4 60:9 H + HO2, 2OH LaminarCH4 0.6–1.0 H + CH2O, HCO + H2 DNS (/ = 0.8) [20] + LaminarDilluted-CH4 – H + CH2O, HCO + H2 DNS (/ = 0.8) [20]CH4 0.7–1.0 O + CH4, OH + CH3 LaminarMulti-component P0:55 H + O2 + M, HO2 + M, Eq. (6) DNS (/ = 1.0) [19] + LaminarMulti-component 60:55 O + HO2, OH + O2 DNS (/ = 1.0) [19] + Laminar
Z.M. Nikolaou, N. Swaminathan / Combustion and Flame 161 (2014) 3073–3084 3083
and the skeletal mechanism of Nikolaou et al. [27]. It is clear thatthe correlations are relatively insensitive to the use of the skeletalmechanism. As a result, the skeletal mechanism does not in anyway influence the good correlations observed with the DNS datain Figs. 20 and 21.
5. Proposed HRR markers
Table 3 shows a summary of all the previous analysis, essen-tially encapsulating the results shown in Figs. 6, 7, 17 and 18.Table 3 shows the range of equivalence ratios where each reactionhas an improved correlation with the HRR as opposed to the com-monly used marker. Also shown is the validation procedure (DNS,laminar) for the proposed correlations. It was shown in Section 4.1,that the chemical mechanism used in the methane DNS introducesa bias in the HRR correlation for the first three reactions. As aresult, the DNS correlations for these reactions cannot be consid-ered plausible. These reactions involving, H and HO2, werehowever validated in the laminar case, and were shown to giveimproved correlations for / <’ 0:9 as per Fig. 6. For relatively leanto stoichiometric conditions, the reactions H + CH2O, HCO + H2
and O + CH4, OH + CH3 also give improved correlations with theHRR. For the multi-component fuel flame the third body reactionH + O2 + M, HO2 + M from which Eq. (6) was derived, is observedto give very good HRR correlations for relatively lean to stoichiom-etric mixtures. Although the reaction O + HO2, OH + O2 has aslightly poorer correlation with the HRR, laminar flame computa-tions suggest it to perform better for very lean conditions.
It is important to note at this point that despite the drawbacksassociated with the [OH][[CH2O] correlation, it is widely usedbecause it is easy to measure. Although the [OH][[CH2O] correla-tion does not provide quantitative equally good results, it can stillbe used to mark locations of increased chemical activity. The alter-native correlations proposed in this study provide improved quan-titative correlations but require the simultaneous measurement ofmore than one species, some of which may be difficult to measure.These markers should thus be taken as a guideline which will helpin the future to develop the necessary techniques needed for themeasurement of the associated species.
6. Conclusions
In this study, the validity of the rate of the reaction OH + CH2O, HCO + H2O as a reliable heat release rate (HRR) marker is re-examined. This is done in the perspective of lean combustion ofboth methane–air mixtures and for multi-component fuel–airmixtures. Two different methods are used to identify HRR markers.In the first method, the fractional influence of all reactions to thetotal HRR across the flame brush is examined, and it is found thatthe top endothermic or exothermic reactions do not necessarilyshow the highest HRR correlations. In the second method, anerror-estimator, ZðvÞ is proposed, where v can be a scalar of our
choice. The scalar minimizing Z is identified as the one havingthe best HRR correlation. This is tested using a number of quanti-ties, and the well established HCO concentration is recovered asthe best marker for the HRR of methane–air mixtures.
For both the methane–air and the multi-component fuel–airmixtures considered, the correlations identified in this study arefound to depend on the equivalence ratio. It is shown that for themethane fuel–air mixture there exist reactions which correlatebetter with the HRR. For lean mixtures, the HRR is found to corre-late stronger with the rates of the reactions H + HO2, O2 + H2 andH + HO2, O + H2O especially at low values of the heat release rate.The reaction OH + CH2O, HCO + H2O on the other hand shows abetter correlation at higher values of HRR rate. For near-stoichiom-etric mixtures, the HRR correlates better with the rates of thereactions O + CH4, OH + CH3 and H + CH2O, HCO + H2. The lastcorrelation is tested under turbulent conditions using DNS dataof a methane–air premixed flame, and mild combustion involvinga methane–air mixture diluted with combustion products, and itis observed that the correlation based on H and CH2O with theHRR is more linear and has reduced scatter compared to that basedon OH and CH2O.
For the multi-component fuel–air mixture strong HRR correla-tions were observed primarily with third body recombinationreactions. This correlation is also evaluated for turbulent condi-tions using DNS data, which show an almost linear collapse ofthe HRR against the rate of the reaction H + O2 + M, HO2 + M,for low and high turbulence levels considered here. Laser diagnos-tics involving the markers identified in this study would be usefulin confirming the proposed correlations. The applicability of thesemarkers for mixtures with various compositions is the subject offuture work.
Acknowledgments
ZMN and NS acknowledges the funding through the Low CarbonEnergy University Alliance Programme supported by TsinghuaUniversity, China. ZMN also likes to acknowledge the educationalgrant through the A.G. Leventis Foundation. This work made useof the facilities of HECToR, the UK’s national high-performancecomputing service, which is provided by UoE HPCx Ltd at theUniversity of Edinburgh, Cray Inc. and NAG Ltd., and funded bythe Office of Science and Technology through EPSRC’s High EndComputing Programme. ZMN and NS would also like to thankY. Minamoto for providing methane–air DNS data.
References
[1] N. Swaminathan, G. Xu, A.P. Dowling, R. Balachandran, J. Fluid Mech. 681(2011) 80–115.
[2] T.J. Poinsot, A.C. Trouve, D.P. Veynante, S.M. Candel, E.J. Esposito, J. Fluid Mech.177 (1987) 265–292.
[3] S.M. Candel, Symp. Int. Combust. 24 (1992) 1277–1296.[4] H.N. Najm, P.H. Paul, C.J. Mueller, P.S. Wyckoff, Combust. Flame 113 (1998)
312–332.
3084 Z.M. Nikolaou, N. Swaminathan / Combustion and Flame 161 (2014) 3073–3084
[5] P.H. Paul, H.N. Najm, Symp. Int. Combust. 27 (1998) 43–50.[6] H.N. Najm, O.M. Knio, P.H. Paul, P.S. Wyckoff, Combust. Sci. Technol. 140
(1998) 369–403.[7] M.D. Smooke, I.K. Puri, K. Seshadri, Proc. Combust. Inst. 21 (1986) 1783–1792.[8] A. Gazi, G. Vourliotakis, G. Skevis, M.A. Founti, Combust. Sci. Technol. 185
(2013) 1482–1508.[9] S. Bockle, J. Kazenwadel, T. Kunzelmann, D.I. Shin, C. Schulz, J. Wolfrum, Proc.
Combust. Inst. 28 (2000) 279–286.[10] C.M. Vagelopoulos, J.H. Frank, Proc. Combust. Inst. 30 (2004) 241–249.[11] B.O. Ayoola, R. Balachandran, J.H. Frank, E. Mastorakos, C.F. Kaminski,
Combust. Flame 144 (2006) 1–16.[12] A. Fayoux, K. Zhringer, O. Gicquel, J.C. Rolon, Proc. Combust. Inst. 30 (2004)
251–257.[13] R.L. Gordon, A.R. Masri, E. Mastorakos, Combust. Theory Model. 13 (2009)
645–670.[14] S.B. Dworkin, A.M. Schaffer, B.C. Connelly, M.B. Long, M.D. Smooke, M.A.
Puccio, B. McAndrew, J.H. Miller, Proc. Combust. Inst. 32 (2009) 1311–1318.[15] B. Ayoola, G. Hartung, C.A. Armitage, J. Hult, R.S. Cant, C.F. Kaminski, Exp. Fluids
46 (2009) 27–41.[16] M. Roder, T. Dreier, C. Schulz, Appl. Phys. B 107 (2012) 611–617.[17] K.N. Gabet, R.A. Patton, N. Jiang, W.R. Lempert, J.A. Sutton, Appl. Phys. B 106
(2012) 569–575.[18] T. Komori, N. Yamagami, H. Hara, Gas Turbine Engineering Section Power
Systems Headquarters Mitsubishi Heavy Industries, Ltd. Industrial Report,Design for Blast Furnace Gas Firing Gas Turbine, 2004. <www.mhi.co.jp/power/news/sec1/pdf/2004_nov_04b.pdf>.
[19] Z.M. Nikolaou, N. Swaminathan, Direct Numerical Simulation of multi-component fuel combustion with detailed chemistry, Combust. Flame,October 2013 (submitted for publication).
[20] Y. Minamoto, N. Swaminathan, Combust. Flame 161 (2014) 1063–1075.[21] Report: Hydrogen from Coal Program: Research, Development, and
Demonstration Plan for the period 2008 through 2016. U.S. Department ofEnergy, 2008.
[22] Report: Wabash River Coal Gasification re-powering Project: A DOEAssesment. U.S. Department of Energy National Energy TechnologyLaboratory, 2002.
[23] O. Maustard, Report: Massachusetts Institute of Technology Laboratory forEnergy and the Environment, An Overview of Coal based IntegratedGasification Combined Cycle (IGCC) Technology, 2005.
[24] R.J. Kee, J.F. Grcar, M.D. Smooke, J.A. Miller, Tech. Rep. SAND85-8240 SandiaNational Laboratories, A Fortran Program for Modelling Steady Laminar One-dimensional Premixed Flames, 1985.
[25] R.J. Kee, F.M. Rupley, J.A. Miller, 1992, Chemkin-II: A Fortran Chemical KineticsPackage for the Analysis of Gas Phase Chemical Kinetics, Sandia NationalLaboratories Report, SAND89-8009B.
[26] G.P. Smith, D.M. Golden, M. Frenklach, N.W. Moriarty, B. Eiteneer, M.Goldenberg, C.T. Bowman, R.K. Hanson, S. Song, W.C. Gardiner, V.V.Lissianski, Z.Qin. <http://www.me.berkeley.edu/gri_mech>.
[27] Z.M. Nikolaou, J.Y. Chen, N. Swaminathan, Combust. Flame 160 (2013) 56–75.[28] G. Vourliotakis, G. Skevis, M.A. Founti, Energy Fuels 25 (2011) 1950–1963.[29] Chemical-Kinetic Mechanisms for Combustion Applications, San Diego
Mechanism web page, Mechanical and Aerospace Engineering (CombustionResearch), University of California at San Diego. <http://combustion.ucsd.edu>.
[30] J. Li, Z. Zhao, A. Kazakov, M. Chaos, F.L. Dryer, J.J. Scire, Int. J. Chem. Kinetics(2006) 109–136.
[31] M.D. Smooke, V. Giovangigli, Formulation of the premixed and non-premixedtest problems, in: M.D. Smooke (Ed.), Lecture Notes in Physics, vol. 384,Springer-Verlag, 1991.


![Akin david[1]](https://img.pdfslide.us/doc/110x75/5590c48d1a28ab95718b45e9/akin-david1.jpg)