Embed Size (px)
Citation preview
IEEE ROBOTICS AND AUTOMATION LETTERS. PREPRINT VERSION. ACCEPTED JANUARY, 2016 1
Combining Semantic and Geometric Features forObject Class Segmentation of Indoor Scenes
Farzad Husain, Hannes Schulz, Babette Dellen, Carme Torras and Sven Behnke
Abstract—Scene understanding is a necessary prerequisite forrobots acting autonomously in complex environments. Low-costRGB-D cameras such as Microsoft Kinect enabled new methodsfor analyzing indoor scenes and are now ubiquitously used inindoor robotics. We investigate strategies for efficient pixelwiseobject class labeling of indoor scenes that combine bothpretrained semantic features transferred from a large color imagedataset and geometric features, computed relative to the roomstructures, including a novel distance-from-wall feature, whichencodes the proximity of scene points to a detected major wallof the room. We evaluate our approach on the popular NYUv2 dataset. Several deep learning models are tested, which aredesigned to exploit different characteristics of the data. Thisincludes feature learning with two different pooling sizes. Ourresults indicate that combining semantic and geometric featuresyields significantly improved results for the task of object classsegmentation.
Index Terms—Semantic scene understanding, categorization,segmentation.
I. INTRODUCTION
UNDERSTANDING complex scenes has gained muchin importance as the applications of service robots for
homes and offices is increasing. Dense structural description ofthe indoor scenes is vital for performing accurate analyses. Toserve this purpose, the usage of RGB-D cameras is becomingubiquitous, as they provide color images and dense depth mapsof the scene. Tasks such as “picking up objects” and “planningmanipulation actions” [1–3] are simplified once the preciselocation of objects in the scene is identified. One way tofacilitate object localization is to perform pixelwise semanticlabeling of the scene [4]. This involves identification andlabeling of different object classes based on the semantics ofthe scene. Recently, Convolutional Neural Networks (CNNs)have shown impressive results for semantic labeling [5, 6]. Thearchitecture of the CNN together with the used input featuresare important factors determining the quality of learned scenesemantics. This work addresses these aspects with proposednovelties to improve the accuracy in semantic labeling.
Manuscript received: August 31, 2015; Revised December 18, 2015;Accepted January, 28, 2016. This paper was recommended for publicationby Editor Jana Kosecka upon evaluation of the reviewers’ comments. Thisresearch is partially funded by the CSIC project MANIPlus (201350E102),and the project RobInstruct (TIN2014-58178-R).
F. Husain and C. Torras are with the Institut de Robotica i InformaticaIndustrial, CSIC-UPC, Llorens i Artigas 4-6, 08028, Barcelona, Spain (e-mail:{shusain, torras}@iri.upc.edu).
H. Schulz and S. Behnke are with the Institute of Computer Science VI,University of Bonn, Germany (email: {schulz, behnke}@ais.uni-bonn.de)
B. Dellen is with the RheinAhrCampus der HochschuleKoblenz, Joseph-Rovan-Allee 2, 53424 Remagen, Germany (e-mail:[email protected]).
Digital Object Identifier (DOI): see top of this page.
(a) (b)
(c) (d)
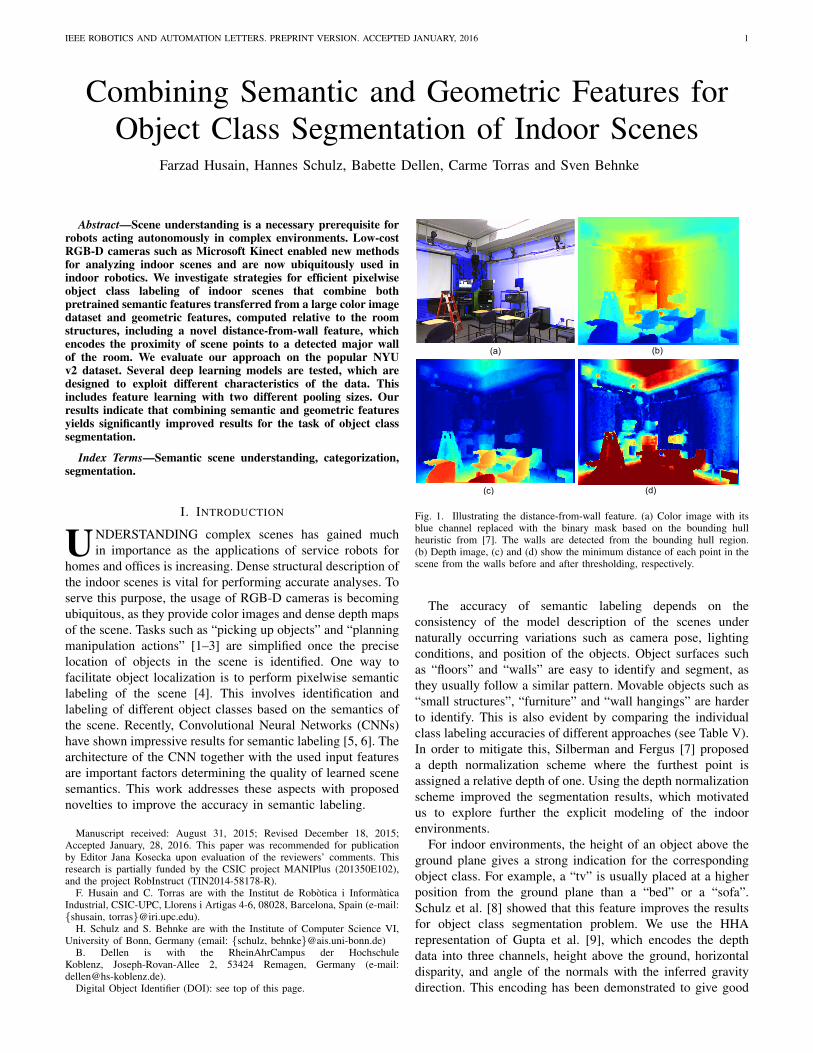
Fig. 1. Illustrating the distance-from-wall feature. (a) Color image with itsblue channel replaced with the binary mask based on the bounding hullheuristic from [7]. The walls are detected from the bounding hull region.(b) Depth image, (c) and (d) show the minimum distance of each point in thescene from the walls before and after thresholding, respectively.
The accuracy of semantic labeling depends on theconsistency of the model description of the scenes undernaturally occurring variations such as camera pose, lightingconditions, and position of the objects. Object surfaces suchas “floors” and “walls” are easy to identify and segment, asthey usually follow a similar pattern. Movable objects such as“small structures”, “furniture” and “wall hangings” are harderto identify. This is also evident by comparing the individualclass labeling accuracies of different approaches (see Table V).In order to mitigate this, Silberman and Fergus [7] proposeda depth normalization scheme where the furthest point isassigned a relative depth of one. Using the depth normalizationscheme improved the segmentation results, which motivatedus to explore further the explicit modeling of the indoorenvironments.
For indoor environments, the height of an object above theground plane gives a strong indication for the correspondingobject class. For example, a “tv” is usually placed at a higherposition from the ground plane than a “bed” or a “sofa”.Schulz et al. [8] showed that this feature improves the resultsfor object class segmentation problem. We use the HHArepresentation of Gupta et al. [9], which encodes the depthdata into three channels, height above the ground, horizontaldisparity, and angle of the normals with the inferred gravitydirection. This encoding has been demonstrated to give good
2 IEEE ROBOTICS AND AUTOMATION LETTERS. PREPRINT VERSION. ACCEPTED JANUARY, 2016
results for object detection and labeling tasks.
As the indoor scenes are always captured in a confinedenvironment, i.e., in the presence of surrounding walls,we propose to exploit this structural information. Basedon a bounding hull heuristic developed by Silberman andFergus [7], we construct a novel feature that we namedistance-from-wall, which indicates the proximity of scenepoints to some major detected room wall. This feature isdefined as the minimum point-to-plane distance between ascene point and the planes detected at the outermost regionof a scene, saturated beyond a certain distance threshold.Figure 1 shows an example of the computed distances fromtwo walls for a sample taken from the NYU v2 dataset [10]. Itcan be observed that—compared to the original depth imagein Fig. 1(b)—the objects closer to the wall become moredistinguishable after thresholding in Fig. 1(d). Wall distancesgreater than a fixed threshold are clipped, since we canassume that their precise wall distance is not informative. Theproposed distance-from-wall feature facilitates the detectionof objects such as “windows”, “wall hangings” and “tv”which are usually found in close proximity to the walls. As aresult, we observed an improvement in the overall object classsegmentation accuracies.
One issue arising when training CNNs on RGB-D inputsis the limited size of the available RGB-D data sets.It has been shown that semantic CNN features obtainedby training classification tasks on large data sets can betransferred to related tasks, such as object detection [11, 12],subcategorization, domain adaptation, scene recognition [13],attribute detection, and instance retrieval [12]. This transferof pretrained semantic features proved also to be useful forRGB-D object categorization, instance recognition and poseestimation [14], and for the task of RGB-D object classsegmentation [5].
Our objective is to build a robust CNN architecture thatpredicts a semantic label for each pixel in the scene. Wetrain CNN models with two different sets of pooling sizesend-to-end with the color image, the HHA encoding [9],and our proposed distance-from-wall feature. We transferpre-trained semantic features from a CNN model trained onthe ImageNet dataset 1. The parameters of the networks arelearned so that they minimize the pixelwise cross-entropyloss between the predicted labels and the ground truth. Wedemonstrate the effectiveness of our approach by evaluatingeach of the proposed modalities separately and also comparingit with the other state-of-the-art approaches on the widely usedNYU v2 dataset [10].
The main contributions of this paper are:
• proposal of a new feature termed distance-from-wall,• a novel CNN architecture using two different pooling
sizes, yielding improved results, and• evaluation and comparison with other state-of-the-art
approaches, showing improved overall performance.
1http://www.image-net.org/
II. RELATED WORK
The conventional approach to semantic labeling is carriedout in multiple stages [4, 15–19]. This involves presegmentingthe scene into smaller patches followed by feature extractionand classification. The final classification results are dependenton the results obtained at each stage of the approach. Anotherway is to train a deep CNN in an end-to-end fashion, i.e.,directly from input pixels to semantic labels [5, 8, 20].
Zhang et al. [4] performed a multiscale segmentation ofimage and point cloud followed by extraction of featurevectors. The feature vectors were classified separately permodality by a random forest (RF) and the classificationresults were fused and further refined using a pairwise CRF(Conditional Random Field) to enforce spatial consistency.Handcrafted features such as “area,” “diameter” and“orientation” were used to identify different features. However,feature learning from combined raw data and hand-craftedfeatures often yields better results as it exploits both thehidden cues and human knowledge. Muller and Behnke[19] is an example of such an approach, where the authorscombine a height-above-ground feature with pixel-wise RFclassification [21] and learn binary potentials betweensuperpixels based on manually designed features.
Wu et al. [22] and Hermans et al. [17] presegmenta scene and afterwards build a model that exploits theirsemantic relations. Wu et al. [22] used a CRF-based modelto relate pixel-wise and pair-wise observations to labels forhierarchical semantic labeling. Hermans et al. [17] used arandomized decision forest for semantic segmentation, wherethe results were further refined using a dense CRF. Similarly,segmentation followed by a random forest classification toinitialize the unary potentials of a CRF was proposed by Wolfet al. [18].
Schulz et al. [8] trained a deep CNN using image patchesas input to the network, where the patch size was adjustedaccording to the measured depth of the patch center. Thisincreased scale invariance and led to improved object classsegmentation results.
In order to increase scale invariance in deep CNNs, Farabetet al. [20] and Eigen and Fergus [5] used input at multiplescales. A simplified version of the histogram of orientedgradient (HOG) descriptor applied to the depth channelprovided depth information to the CNN of Hoft et al. [23].
To increase the spatial accuracy of semantic segmentation,Eigen and Fergus [5] and Long et al. [6] proposed twodifferent CNN models. Eigen and Fergus [5] divided a CNNinto three sub-networks which gradually predicted outputfrom a coarse to fine level. The network is initializedwith ImageNet-trained AlexNet [24]. Additionally, looselyrelated computer vision tasks—estimating depths and surfacenormals—were optimized by adjusting the loss function. Longet al. [6] combined upsampled predictions from intermediatelayers with the final layer which lead to more refinedresults. A single-image classification network was adapted toa fully convolutional network and fine tuned for semanticsegmentation.
Another line of research is to exploit temporal integrationfrom RGB-D video sequences. For example, Stuckler et al.
HUSAIN et al.: OBJECT CLASS SEGMENTATION OF INDOOR SCENES 3
[25] perform RGB-D SLAM to estimate the camera motionand aggregate semantic segmentations from multiple viewsin 3D. Pavel et al. [26] directly train hierarchical recurrentconvolutional neural networks on object class segmentationfrom RGB-D video. In this work, we do not address temporalintegration and process only individual RGB-D frames.
III. PROBLEM FORMULATION
Given a color image and a dense depth map X of a scene,our goal is to obtain a label yp ∈ C for each pixel locationxp ∈X that corresponds to the object class at the pixel location.
In our task, we deal with natural indoor scenes which areusually unbalanced with respect to the size and number ofobjects. For example, the number of pixels belonging to thefloor class is much greater than that of those in the furnitureclass. Hence we use a weighted, multiclass cross entropy lossfunction [5]:
L =−∑i∈X
∑b∈C
αbci,b ln(ci,b),
where
αb = median-freq(C )/ freq(b),
ci,· is the predicted class distribution at location i, and ci,· is therespective ground truth class distribution. The factor α weighseach class according to its frequency with which it appears inthe training set, and median-freq(C ) is the median of all classfrequencies.
IV. APPROACH
We use a convolutional neural network in two stages, asillustrated in Figs. 2 and 3. In the first stage, we train thenetwork with two different sets of pooling-operator sizes. Inthe second stage, we concatenate the feature maps of the lastlayer of the two networks from the previous stage and train thenetwork again. This two-stage approach yields refined results(see Sec. IV-A). Finally, we enrich the set of concatenatedfeatures with geometric wall proximity information from thedistance-from-wall feature (Sec. IV-B).
A. Network architecture
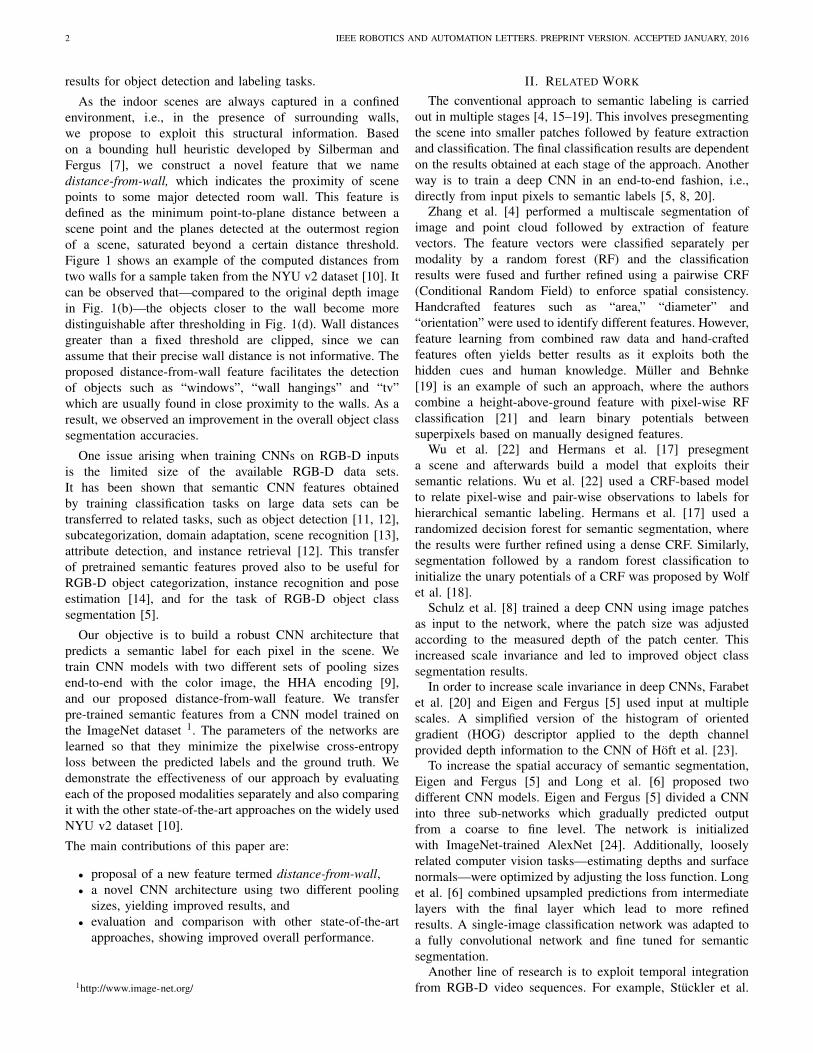
Our network takes three inputs, i.e., color image, HHAencoding, and distance-from-wall feature. The color imageis passed through a stack of five convolutional layers. TheHHA encoding and distance-from-wall feature are processedby only four and three convolutional layers, respectively. Thisscheme is illustrated in Fig. 2. The weights of the first twolayers for color image and the first layer for HHA encodingare transferred from the OverFeat network [27]. This networkwas designed by the CILVR Lab at NYU2 and was trainedon the ImageNet dataset for color image categorization. Theweights of these two layers are kept fixed during our trainingand serve as semantic feature extractor. The network alsocontains pooling layers, a dropout layer and is divided into fourconfigurations as described in Table I. We train the network
2http://cilvr.nyu.edu/doku.php
Fig. 2. First stage of our proposed model architecture for object classsegmentation. Inputs are the color image, the HHA encoding [9], and thedistance-from-wall feature (Sec. IV-B). Layer 1 (96 feature maps) and Layer 2(256 feature maps) for color image and Layer 1 for HHA (96 feature maps)have filters pretrained on the ImageNet dataset which are not changed duringtraining. Afterwards, the feature maps together with the distance-from-wallfeature are concatenated and fed to a 3-layer trainable CNN. The output layerhas the same number of feature maps as the number of object class labels.The output maps for the two different pooling sizes are used as input forStage 2.
Fig. 3. Second stage of our proposed CNN architecture for object classsegmentation. The output feature maps obtained after training the CNN in thefirst stage (Fig. 2) are used as input. The pooling operation in Stage 1 is donewith two sets of sizes. Hence, two sets of output feature maps are obtainedwhich are here referred to as (1/4) and (1/8). These maps are concatenatedand used as an input for training a single-layer network. The output layer forthis network has the same number of feature maps as the number of objectclass labels.
with two different pool sizes after the first convolutional layer.Hence, the final feature map size in Configuration A is eitherfour times or eight times smaller, depending on the poolsize. The same applies to configuration B. ConfigurationsA and B do not need training as the filters are transferredfrom the OverFeat network. Configuration C contains only thedistance-from-wall feature. The outputs from ConfigurationsA, B and C are concatenated and fed to Configuration D,which we train using the labeled training examples.
The networks are trained for two different sets of pool sizes.The final output from Configuration D is concatenated andtrained again as shown in Fig. 3 before the upsampling. Asingle convolutional layer with the number of filters equal tothe number of object classes and a size of (3×3) is learned. Byconcatenating networks with different pool sizes, we exploitinvariance to local deformations while preserving informationon spatial location, which increases the segmentation accuracy.
B. Distance-from-wall
We have devised a simple yet robust heuristic to detect thewalls at the outermost region of an indoor scene. This involvessegmenting the point cloud and picking up those segments thatlie within the outermost boundary region. Afterwards, the two
4 IEEE ROBOTICS AND AUTOMATION LETTERS. PREPRINT VERSION. ACCEPTED JANUARY, 2016
TABLE ICONVOLUTIONAL NEURAL NETWORK CONFIGURATIONS
Layer Filter Size Stride No. of maps Map size
Configuration AInput (color) - - 3 image sizeConv1 11×11 1 96 image sizePool1 2×2, 4×4 2,4 96 image size/(2,4)Conv2 11×11 256 image size/(2,4)Pool2 2×2 2 256 image size/(4,8)
Configuration BInput (HHA) - - 3 image sizeConv1 11×11 1 96 image sizePool1 4×4, 8×8 4,8 96 image size/(4,8)
Configuration CInput (Dist-from-wall) - - 1 image size/(4,8)
Configuration DInput (Conf. A+B+C) - - 256+96+1 image size/(4,8)Conv1 11×11 1 128 image size/(4,8)Dropout (0.25) - - - -Conv2 11×11 1 64 image size/(4,8)Conv3 11×11 1 No. of classes image size/(4,8)Upsample - - No. of classes image size
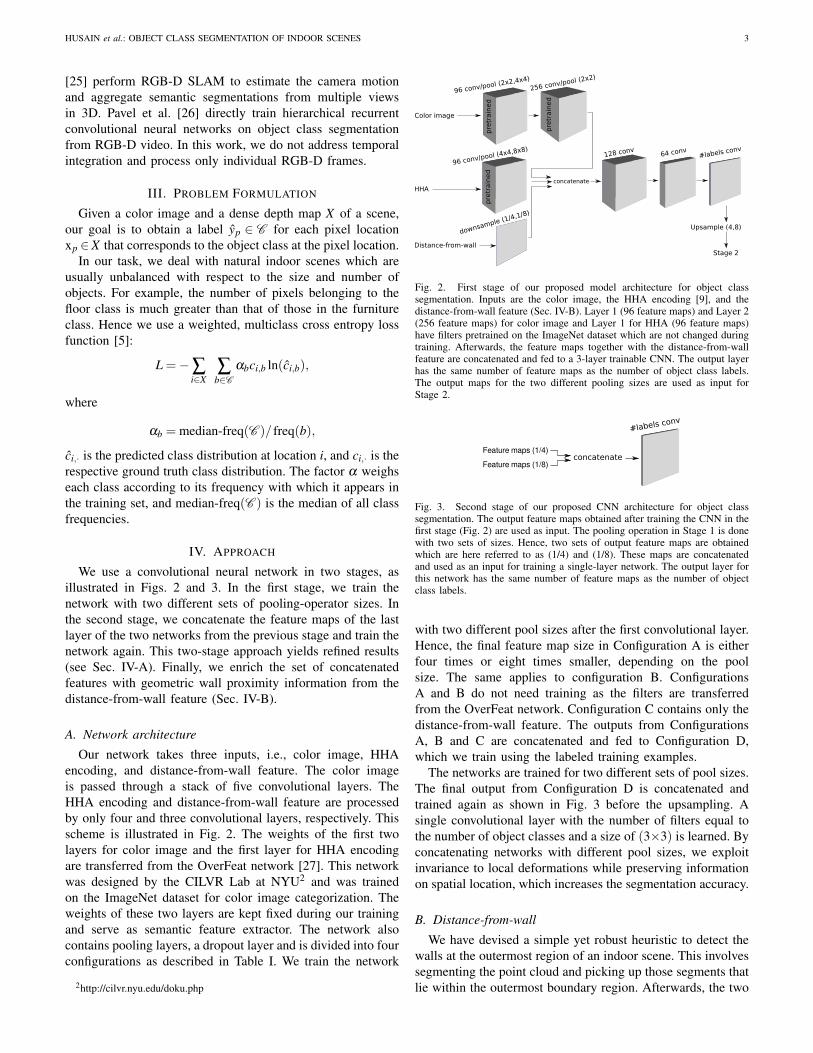
largest segments are selected and a planar surface model isused to compute the distance from each point to those planarsurfaces. The steps are illustrated in Fig. 4 and are detailedbelow.
1) Segment the point cloud: We partition the point cloudinto surface segments using two different approaches. The firstapproach fits planes to the point cloud using RANSAC (seeFig. 4(c)). The second approach segments the 3D points basedon quadratic surface fitting as described by Husain et al. [28](see Fig. 4(d)). We use these two different approaches, becausedepending on the complexity of the scene, one approachperformed better than the other. The method by Husain et al.[28] performed better in complex scenes containing mostlynon-planar surfaces, whereas RANSAC performed better whenthe scene was dominated by planar surfaces.
2) Detect the outermost boundary: In order to detectthe outermost boundary, we use the technique describedby Silberman and Fergus [7], i.e., if the depth of a point iswithin 4% of the maximum depth within each column of theimage grid then it is marked as the boundary region. Fig. 4(a)shows the boundary region shaded in blue color. We only takethe segments that lie in the outermost boundary as possiblecandidates for walls as shown in Figs. 4(e) and (f).
3) Select the largest two segments when viewed from thetop: To generate an approximate top view, we assume thatthe vertical camera-axis always points towards the upwardsdirection. We select at most two segments from the segmentedpoint cloud that have the largest triangular width and are notcoplanar, when viewed from the top. Afterwards we selectthe segments that have the largest sum of widths. Hence,among Figs. 4(g) and (h), the two segments from Fig. 4(g)are selected.
4) Computing the distance from the wall feature: Once thetwo segments are selected, we compute for all scene pointsthe minimum point-to-plane distance using a planar-surfaceequation. Since in each scene we have at most two planes
(a) (b)
(c) (d)
(e) (f)
(g) (h)
(i) (j)
(k) (l)
1.5
2
2.5
3
3.5
4
4.5
0.1
0.2
0.3
0.4
0.5
0.6
0.7
0.8
0.9
1
0.5
1
1.5
2
2.5
0
0.5
1
1.5
2
2.5
3
0
0.5
1
1.5
2
2.5
Fig. 4. Illustrating the procedure for the computation of thedistance-from-wall feature. (a) Color image with the boundary regionshaded in blue, (b) depth image, (c) segmentation using RANSAC, (d)segmentation of depth image using the method proposed by Husain et al.[28], (e) and (f) selecting only the segments from the boundary region,(g) and (h) are top views of the point clouds based on the two largestsingle-colored plane segments from (e) and (f), respectively, (g) is selectedbecause it has the largest sum of the widths (the double sided arrows in(g) and (h)) of the enclosed segments, (i) and (j) are the distances of eachpoint from the two planes detected based on the two segments in (g), (k) isthe minimum distance for each point from both planes and (l) is the finaldistance feature after thresholding. The color image is shown for illustrationonly and not used in computing the distance feature.
HUSAIN et al.: OBJECT CLASS SEGMENTATION OF INDOOR SCENES 5
yielding a point-plane distance value each (see Figs. 4(i) and(j)), we take the minimum to get the final distance-from-wall(see Fig. 4(k)),
Dx∈pixel = min(π1x ,π
2x ),
where π1x and π2
x are the point to plane distances of point xto plane π1 and π2, respectively. We use a threshold valueof one meter. All points whose value exceeds the thresholdare clipped as shown in Fig. 4(l). The rationale behind thisparticular value is that the objects within a 1 meter proximityof walls are likely to have depth readings differing slightly,but distinctly from the wall itself, such as “lamps”, “wallhangings”, and “cupboard”. Such objects are highlighted fromthe rest of the scene after applying this threshold. Objectsfurther away than one meter do not typically occur in specificdistances to the wall and the feature becomes meaningless.
V. EXPERIMENTS
In this section, we describe the evaluation results on theNYU v2 dataset. We use the four object classes [10] inSec. V-A and the 13 object classes [29] in Sec. V-B.
The dataset contains a total of 1449 samples of differentindoor scenes. We use the training/test split as provided bythe dataset authors. The parameters for gradient descent, i.e.,the learning rate, momentum and the number of iterations areadjusted by first separating 10 % of the training examples andusing them for validation.
In order to evaluate our approach, we use two commonmeasures of performance:• average pixel accuracy ∑i nii/∑i ti and• average class accuracy (1/ncl)∑i(nii/ti),
where nii is the number of correctly classified pixels for classi, ti is the total number of pixels for class i, and ncl is thenumber of classes.
In order to get an insight on the benefits of ourproposed models, we evaluate different aspects separately.This includes the network from first stage, referred to asnet-ABCD and without the distance-from-wall feature asnet-ABD, the network from second stage referred to asnet-ABCD-combined and also without the distance-from-wallfeature as net-ABD-combined. We distinguish between the twoupsampling factors for the different pooling sizes in the firststage as U4 and U8.
A. NYU v2 with four classes
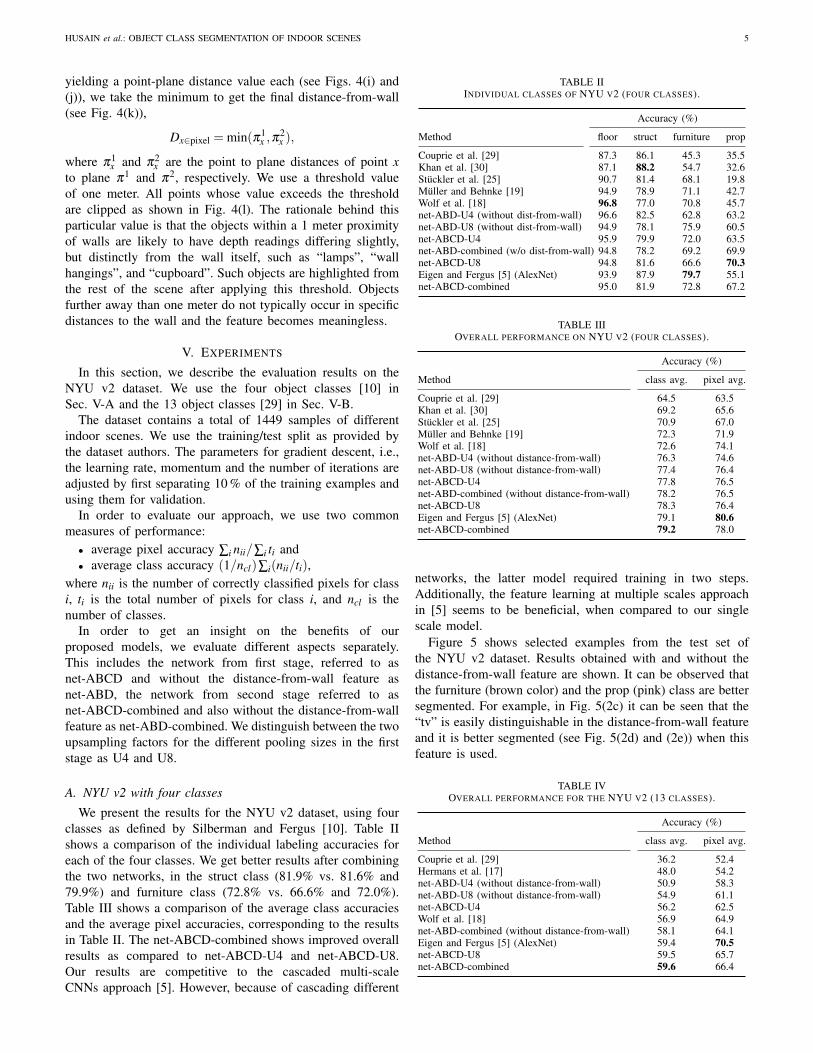
We present the results for the NYU v2 dataset, using fourclasses as defined by Silberman and Fergus [10]. Table IIshows a comparison of the individual labeling accuracies foreach of the four classes. We get better results after combiningthe two networks, in the struct class (81.9% vs. 81.6% and79.9%) and furniture class (72.8% vs. 66.6% and 72.0%).Table III shows a comparison of the average class accuraciesand the average pixel accuracies, corresponding to the resultsin Table II. The net-ABCD-combined shows improved overallresults as compared to net-ABCD-U4 and net-ABCD-U8.Our results are competitive to the cascaded multi-scaleCNNs approach [5]. However, because of cascading different
TABLE IIINDIVIDUAL CLASSES OF NYU V2 (FOUR CLASSES).
Accuracy (%)
Method floor struct furniture prop
Couprie et al. [29] 87.3 86.1 45.3 35.5Khan et al. [30] 87.1 88.2 54.7 32.6Stuckler et al. [25] 90.7 81.4 68.1 19.8Muller and Behnke [19] 94.9 78.9 71.1 42.7Wolf et al. [18] 96.8 77.0 70.8 45.7net-ABD-U4 (without dist-from-wall) 96.6 82.5 62.8 63.2net-ABD-U8 (without dist-from-wall) 94.9 78.1 75.9 60.5net-ABCD-U4 95.9 79.9 72.0 63.5net-ABD-combined (w/o dist-from-wall) 94.8 78.2 69.2 69.9net-ABCD-U8 94.8 81.6 66.6 70.3Eigen and Fergus [5] (AlexNet) 93.9 87.9 79.7 55.1net-ABCD-combined 95.0 81.9 72.8 67.2
TABLE IIIOVERALL PERFORMANCE ON NYU V2 (FOUR CLASSES).
Accuracy (%)
Method class avg. pixel avg.
Couprie et al. [29] 64.5 63.5Khan et al. [30] 69.2 65.6Stuckler et al. [25] 70.9 67.0Muller and Behnke [19] 72.3 71.9Wolf et al. [18] 72.6 74.1net-ABD-U4 (without distance-from-wall) 76.3 74.6net-ABD-U8 (without distance-from-wall) 77.4 76.4net-ABCD-U4 77.8 76.5net-ABD-combined (without distance-from-wall) 78.2 76.5net-ABCD-U8 78.3 76.4Eigen and Fergus [5] (AlexNet) 79.1 80.6net-ABCD-combined 79.2 78.0
networks, the latter model required training in two steps.Additionally, the feature learning at multiple scales approachin [5] seems to be beneficial, when compared to our singlescale model.
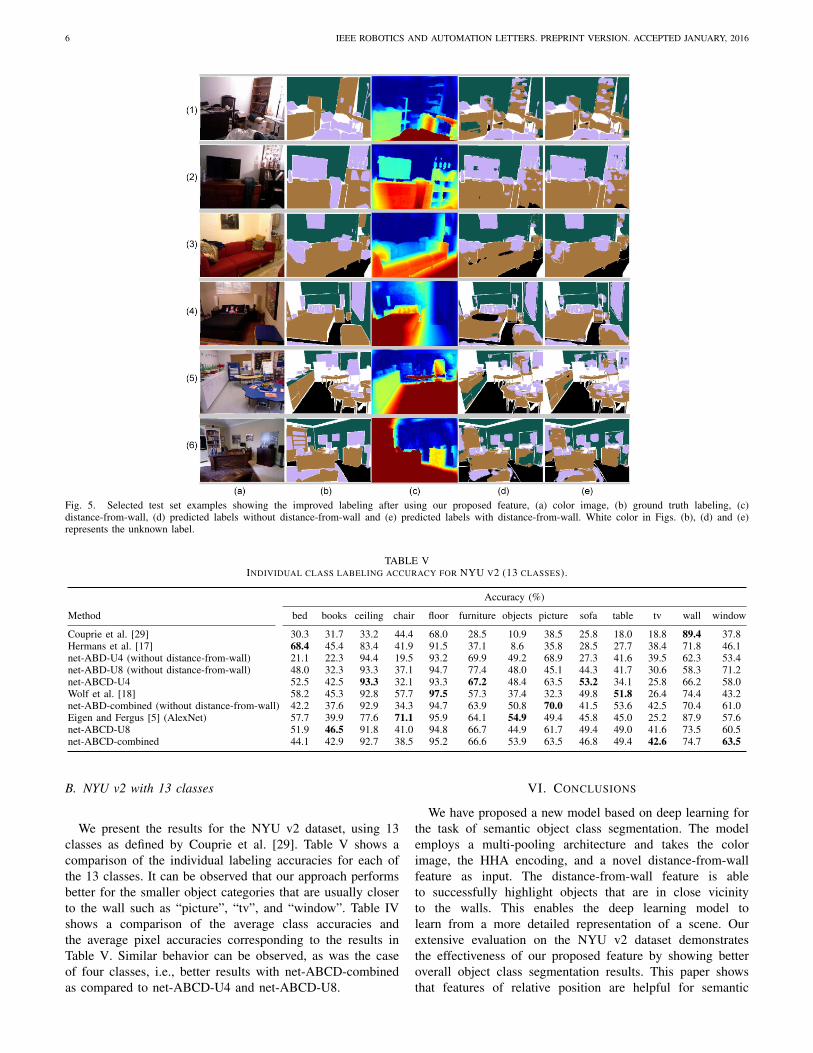
Figure 5 shows selected examples from the test set ofthe NYU v2 dataset. Results obtained with and without thedistance-from-wall feature are shown. It can be observed thatthe furniture (brown color) and the prop (pink) class are bettersegmented. For example, in Fig. 5(2c) it can be seen that the“tv” is easily distinguishable in the distance-from-wall featureand it is better segmented (see Fig. 5(2d) and (2e)) when thisfeature is used.
TABLE IVOVERALL PERFORMANCE FOR THE NYU V2 (13 CLASSES).
Accuracy (%)
Method class avg. pixel avg.
Couprie et al. [29] 36.2 52.4Hermans et al. [17] 48.0 54.2net-ABD-U4 (without distance-from-wall) 50.9 58.3net-ABD-U8 (without distance-from-wall) 54.9 61.1net-ABCD-U4 56.2 62.5Wolf et al. [18] 56.9 64.9net-ABD-combined (without distance-from-wall) 58.1 64.1Eigen and Fergus [5] (AlexNet) 59.4 70.5net-ABCD-U8 59.5 65.7net-ABCD-combined 59.6 66.4
6 IEEE ROBOTICS AND AUTOMATION LETTERS. PREPRINT VERSION. ACCEPTED JANUARY, 2016
Fig. 5. Selected test set examples showing the improved labeling after using our proposed feature, (a) color image, (b) ground truth labeling, (c)distance-from-wall, (d) predicted labels without distance-from-wall and (e) predicted labels with distance-from-wall. White color in Figs. (b), (d) and (e)represents the unknown label.
TABLE VINDIVIDUAL CLASS LABELING ACCURACY FOR NYU V2 (13 CLASSES).
Accuracy (%)
Method bed books ceiling chair floor furniture objects picture sofa table tv wall window
Couprie et al. [29] 30.3 31.7 33.2 44.4 68.0 28.5 10.9 38.5 25.8 18.0 18.8 89.4 37.8Hermans et al. [17] 68.4 45.4 83.4 41.9 91.5 37.1 8.6 35.8 28.5 27.7 38.4 71.8 46.1net-ABD-U4 (without distance-from-wall) 21.1 22.3 94.4 19.5 93.2 69.9 49.2 68.9 27.3 41.6 39.5 62.3 53.4net-ABD-U8 (without distance-from-wall) 48.0 32.3 93.3 37.1 94.7 77.4 48.0 45.1 44.3 41.7 30.6 58.3 71.2net-ABCD-U4 52.5 42.5 93.3 32.1 93.3 67.2 48.4 63.5 53.2 34.1 25.8 66.2 58.0Wolf et al. [18] 58.2 45.3 92.8 57.7 97.5 57.3 37.4 32.3 49.8 51.8 26.4 74.4 43.2net-ABD-combined (without distance-from-wall) 42.2 37.6 92.9 34.3 94.7 63.9 50.8 70.0 41.5 53.6 42.5 70.4 61.0Eigen and Fergus [5] (AlexNet) 57.7 39.9 77.6 71.1 95.9 64.1 54.9 49.4 45.8 45.0 25.2 87.9 57.6net-ABCD-U8 51.9 46.5 91.8 41.0 94.8 66.7 44.9 61.7 49.4 49.0 41.6 73.5 60.5net-ABCD-combined 44.1 42.9 92.7 38.5 95.2 66.6 53.9 63.5 46.8 49.4 42.6 74.7 63.5
B. NYU v2 with 13 classes
We present the results for the NYU v2 dataset, using 13classes as defined by Couprie et al. [29]. Table V shows acomparison of the individual labeling accuracies for each ofthe 13 classes. It can be observed that our approach performsbetter for the smaller object categories that are usually closerto the wall such as “picture”, “tv”, and “window”. Table IVshows a comparison of the average class accuracies andthe average pixel accuracies corresponding to the results inTable V. Similar behavior can be observed, as was the caseof four classes, i.e., better results with net-ABCD-combinedas compared to net-ABCD-U4 and net-ABCD-U8.
VI. CONCLUSIONS
We have proposed a new model based on deep learning forthe task of semantic object class segmentation. The modelemploys a multi-pooling architecture and takes the colorimage, the HHA encoding, and a novel distance-from-wallfeature as input. The distance-from-wall feature is ableto successfully highlight objects that are in close vicinityto the walls. This enables the deep learning model tolearn from a more detailed representation of a scene. Ourextensive evaluation on the NYU v2 dataset demonstratesthe effectiveness of our proposed feature by showing betteroverall object class segmentation results. This paper showsthat features of relative position are helpful for semantic
HUSAIN et al.: OBJECT CLASS SEGMENTATION OF INDOOR SCENES 7
segmentation. In the future, we plan to increase invariance tocamera position even further by taking into account additionalproperties such as 3D room layout.
REFERENCES
[1] A Dragan, N Ratliff, and S Srinivasa. “Manipulation planning withgoal sets using constrained trajectory optimization”. In: Int. Conf. onRobotics and Automation (ICRA). 2011, pp. 4582–4588.
[2] D Martınez, G Alenya, and C Torras. “Planning robot manipulationto clean planar surfaces”. In: Engineering Applications of ArtificialIntelligence (EAAI) 39 (2015), pp. 23–32.
[3] F Husain, A Colome, B Dellen, G Alenya, and C Torras. “Realtimetracking and grasping of a moving object from range video”. In: Int.Conf. on Robotics and Automation (ICRA). 2014, pp. 2617–2622.
[4] R Zhang, S Candra, K Vetter, and A Zakhor. “Sensor fusion forsemantic segmentation of urban scenes”. In: Int. Conf. on Roboticsand Automation (ICRA). 2015, pp. 1850–1857.
[5] D Eigen and R Fergus. “Predicting depth, surface normalsand semantic labels with a common multi-scale convolutionalarchitecture”. In: Int. Conf. on Computer Vision (ICCV). 2015,pp. 2650–2658.
[6] J Long, E Shelhamer, and T Darrell. “Fully convolutional networks forsemantic segmentation”. In: Computer Vision and Pattern Recognition(CVPR), Conf. on. 2015, pp. 3431–3440.
[7] N Silberman and R Fergus. “Indoor scene segmentation using astructured light sensor”. In: ICCV Workshop on 3D Representationand Recognition. 2011.
[8] H Schulz, N Hoft, and S Behnke. “Depth and height aware semanticRGB-D perception with convolutional neural networks”. In: Europ.Conf. on Neural Networks (ESANN). 2015.
[9] S Gupta, R Girshick, P Arbelaez, and J Malik. “Learning richfeatures from RGB-D images for object detection and segmentation”.In: Europ. Conf. on Computer Vision (ECCV). Vol. 8695. 2014,pp. 345–360.
[10] N Silberman, D Hoiem, P Kohli, and R Fergus. “Indoor segmentationand support inference from RGBD images”. In: Europ. Conf. onComputer Vision (ECCV). 2012, pp. 746–760.
[11] R Girshick, J Donahue, T Darrell, and J Malik. Rich featurehierarchies for accurate object detection and semantic segmentation.2013. arXiv: 1311.2524.
[12] AS Razavian, H Azizpour, J Sullivan, and S Carlsson. “CNN featuresoff-the-shelf: An astounding baseline for recognition”. In: CVPRDeepVision Workshop (2014).
[13] J Donahue, Y Jia, O Vinyals, J Hoffman, N Zhang, E Tzeng, and TDarrell. “DeCAF: A deep convolutional activation feature for genericvisual recognition”. In: Proceedings of International Conference onMachine Learning (ICML). 2014, pp. 647–655.
[14] M Schwarz, H Schulz, and S Behnke. “RGB-D object recognition andpose estimation based on pre-trained convolutional neural networkfeatures”. In: Int. Conf. on Robotics and Automation (ICRA). 2015,pp. 1329–1335.
[15] C Cadena and J Kosecka. “Semantic segmentation with heterogeneoussensor coverages”. In: Int. Conf. on Robotics and Automation (ICRA).2014, pp. 2639–2645.
[16] X Xiong, D Munoz, J Bagnell, and M Hebert. “3-D scene analysisvia sequenced predictions over points and regions”. In: Int. Conf. onRobotics and Automation (ICRA). 2011, pp. 2609–2616.
[17] A Hermans, G Floros, and B Leibe. “Dense 3D semantic mapping ofindoor scenes from RGB-D images”. In: Int. Conf. on Robotics andAutomation (ICRA). 2014, pp. 2631–2638.
[18] D Wolf, J Prankl, and M Vincze. “Fast semantic segmentation of 3Dpoint clouds using a dense CRF with learned parameters”. In: Int.Conf. on Robotics and Automation (ICRA). 2015, pp. 4867–4873.
[19] A Muller and S Behnke. “Learning depth-sensitive conditionalrandom fields for semantic segmentation of RGB-D images”. In: Int.Conf. on Robotics and Automation (ICRA). 2014, pp. 6232–6237.
[20] C Farabet, C Couprie, L Najman, and Y Lecun. “Scene parsing withmultiscale feature learning, purity trees, and optimal covers”. In: Int.Conf. on Machine Learning (ICML). New York, NY, USA: ACM,2012, pp. 575–582.
[21] H Schulz, B Waldvogel, R Sheikh, and S Behnke. “CURFIL:Random forests for image labeling on GPU”. In: 10th InternationalConference on Computer Vision Theory and Applications (VISAPP).2015, pp. 156–164.
[22] C Wu, I Lenz, and A Saxena. “Hierarchical semantic labeling fortask-relevant RGB-D perception”. In: Robotics: Science and Systems(RSS). 2014, pp. 1–9.
[23] N Hoft, H Schulz, and S Behnke. “Fast semantic segmentation ofRGB-D scenes with GPU-accelerated deep neural networks”. In:German Conf. on Artificial Intelligence (KI). Vol. 8736. Lecture Notesin Computer Science. 2014, pp. 80–85.
[24] A Krizhevsky, I Sutskever, and GE Hinton. “ImageNet classificationwith deep convolutional neural networks”. In: Advances in NeuralInformation Processing Systems (NIPS). 2012, pp. 1097–1105.
[25] J Stuckler, B Waldvogel, H Schulz, and S Behnke. “Dense real-timemapping of object-class semantics from RGB-D video”. In: Journalof Real-Time Image Processing (2015), pp. 599–609.
[26] MS Pavel, H Schulz, and S Behnke. “Recurrent convolutionalneural networks for object-class segmentation of RGB-D video”. In:International Joint Conference on Neural Networks (IJCNN). 2015,pp. 1–8.
[27] P Sermanet, D Eigen, X Zhang, M Mathieu, R Fergus, and Y LeCun.“OverFeat: Integrated recognition, localization and detection usingconvolutional networks”. In: Int. Conf. on Learning Representations(ICLR). 2014, pp. 1–16.
[28] F Husain, B Dellen, and C Torras. “Consistent depth videosegmentation using adaptive surface models”. In: IEEE Transactionson Cybernetics 45.2 (2015), pp. 266–278.
[29] C Couprie, C Farabet, L Najman, and Y LeCun. “Indoor semanticsegmentation using depth information”. In: Int. Conf. on LearningRepresentations (ICLR). 2013, pp. 1–8.
[30] S Khan, M Bennamoun, F Sohel, and R Togneri. “Geometry drivensemantic labeling of indoor scenes”. In: Europ. Conf. on ComputerVision (ECCV). 2014, pp. 679–694.


![S4Net: Single stage salient-instance segmentation · rather than instance segments. 2.3 Semantic instance segmentation Earlier semantic instance segmentation methods [22–24, 54]](https://img.pdfslide.us/doc/110x75/5fa63c2f83ae5a0cdb44c66e/s4net-single-stage-salient-instance-segmentation-rather-than-instance-segments.jpg)