Embed Size (px)
Citation preview

New York City Water & Sewer System 2021 1
New York City Water and Sewer System
A Component Unit of the City of new york
Comprehensive Annual Financial Report
For the Fiscal Year Ended June 30, 2021

New York City Water & Sewer System 2021 2
The New York City Municipal Water Finance Authority (“NYW”) is a public benefit corporation created in 1985 pursuant to the New York City Municipal Water Finance Authority Act.
NYW’s purpose is to finance the capital needs of the water and sewer system of The City of New York (the “System”) which is operated by the New York City Department of Environmental Protection.
Our Mission
Cover: East Basin of
Ashokan Reservoir
Right: Aerial view of the
Schoharie Reservoir

New York City Water & Sewer System 2021 3
INTRODUCTION05 Letter of Transmittal14 Organizational Chart17 Certificate of Achievement18 System Officials
FINANCIAL20 Report of Independent Certified Public Accountants22 Management’s Discussion and Analysis (Unaudited)
Combining Financial Statements as of and for the years ended June 30, 2021 and 2020
32 Combining Statements of Net Position (Deficit)36 Combining Statements of Revenues, Expenses and Changes
In Net Position (Deficit)38 Combining Statements of Cash Flows42 Notes To Combining Financial Statements
Required Supplementary Information (Unaudited)
75 Schedule of Changes For Total OPEB Plan Liability and Related Ratios76 Schedule of The Authority’s Proportionate Share of The Net Pension Liability76 Schedule of The Authority’s Pension Contributions
STATISTICAL78 Contents79 Schedules of Financial Trends Information80 Revenue Capacity Information82 Schedules of Debt Capacity Information83 Demographic and Economic Information85 Operating Information
Table of Contents
New York City Water & Sewer System 2021 4
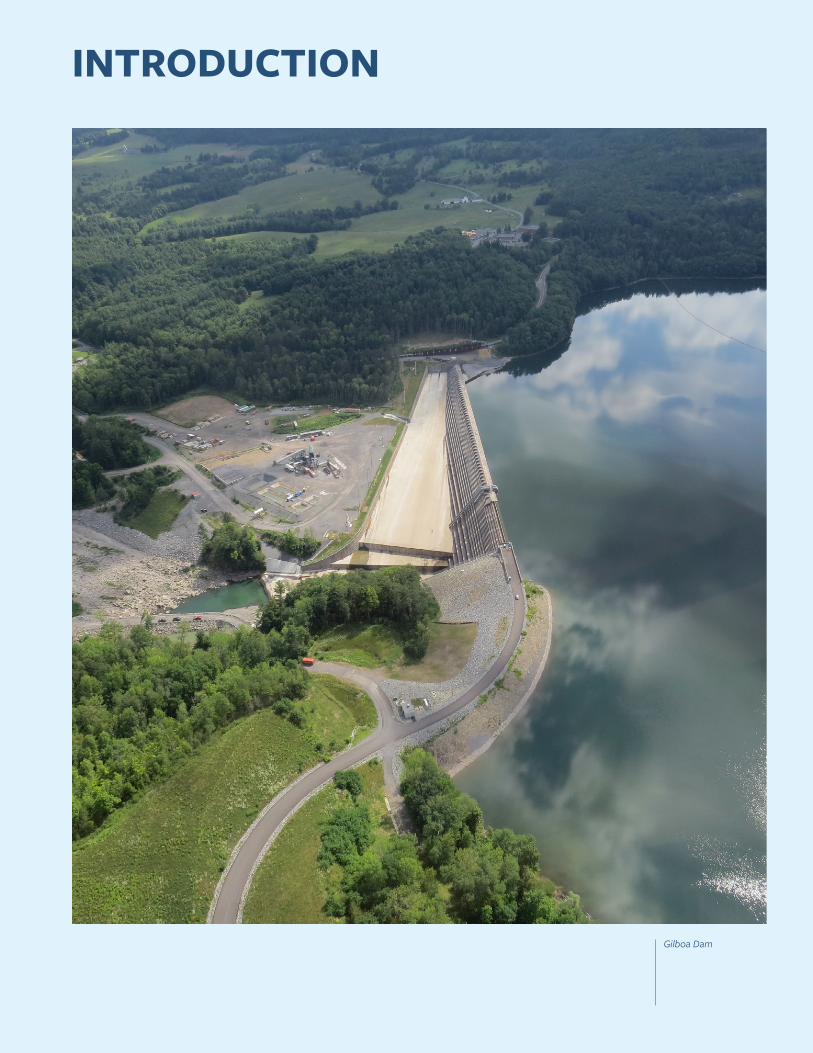
Gilboa Dam
INTRODUCTION

New York City Water & Sewer System 2021 5
We are pleased to submit to you this Comprehensive Annual Financial Report of the New York City Water and Sewer System (the “System”) for the year ended June 30, 2021. The financial section of this Comprehensive Annual Financial Report includes management’s discussion and analysis, the combining financial statements and schedules, as well as the independent auditors’ report on these financial statements.
The System is responsible for the accuracy, completeness, and fairness of the presentation, including all disclosures. This letter of transmittal and the management’s discussion and analysis, which provides an overview of the System’s financial results and is located in the financial section, are intended to complement one another.
The reporting entity consists of two separate and independent corporate bodies that are combined for reporting purposes: the New York City Municipal Water Finance Authority (the “Authority”) and the New York City Water Board (the “Water Board”). In addition, the New York City Department of Environmental Protection (“DEP”) operates the System. The passage of the New York City Municipal Finance Authority Act of 1984 (the “Act”) by the New York State Legislature authorized this financing and operating relationship. The System is a component unit of the City of New York (“the City”) for financial reporting purposes.
The Authority is authorized to issue bonds and other debt instruments for construction of and improvements to the System. The Authority also has the power to refund its bonds and notes. The Authority is administered by a Board of Directors composed of seven members, four of whom serve ex-officio, two of whom are appointed by the Mayor of the City, and one of whom is appointed by the Governor of the State of New York (the “State”). The staff of the Authority operates under the direction of its Executive Director.
The Water Board leases the System from the City, sets rates, and collects the System’s revenue. The Lease Agreement dated July 1, 1985 (the “Lease”), continues until the later of the fortieth anniversary of the commencement of the Lease or the date on which all bonds, notes or other obligations of the Authority are paid in full or provision for such payment has been made pursuant to the applicable debt instrument. The Water Board is obligated to first allocate the revenues of the System to debt service on the Authority’s bonds and to the Authority’s expense budget, after which revenues are allocated to the Water Board’s expenses, DEP’s cost of operating and maintaining the System, and to the rental payment paid to the City, if requested, under the terms of the Lease. The Lease requires the Water Board to make the rental payment to the City, if requested, which is no more than the greater of: i) principal and interest for the
Letter of Transmittal
November 15, 2021
To the
- Members of the Board of the New York City Municipal Water Finance Authority
- Members of the New York City Water Board
- The Commissioner of the New York City Department of Environmental Protection
Statue of Liberty

New York City Water & Sewer System 2021 6
fiscal year on the City general obligation bonds issued for water and sewer purposes, or ii) fifteen percent of principal and interest on the Authority’s debt for the fiscal year. The rental payment is currently capped at fifteen percent of principal and interest on the Authority’s debt for the fiscal year because that is the greater of the two amounts calculated pursuant to the Lease. For three years beginning in fiscal year 2017, the City did not request a rental payment. However, as a result of the outbreak of the novel coronavirus, in fiscal years 2020 and 2021, the City requested and the Water Board paid as required, a rental payment of $128 million and $137 million, respectively.
The Water Board consists of seven members who are appointed by the Mayor. The Act requires that at least one member has experience in the science of water resource development. Members of the Water Board cannot be members of the Board of Directors of the Authority. The Mayor appoints the Chairman. The staff of DEP supports the operations of the Water Board under the direction of the Water Board’s Executive Director.
The operation and maintenance of the water and sewer system is performed by DEP. DEP is managed by a Commissioner who is appointed by the Mayor and oversees a workforce of over 5,600 people. DEP works to protect the environmental welfare and health of the City’s residents and natural resources, manages the City’s water supply, treatment, transmission and distribution system, and collects, treats, and disposes of waste and storm water. DEP supplies water and sewer service to the Boroughs of the Bronx, Brooklyn, Manhattan, Queens and Staten Island, an area of over 300 square miles, and serves approximately 8.8 million people. The City is also required by state law to sell water in counties where its water supply facilities are located. The System currently provides water to approximately 1 million people located in Westchester, Putnam, Orange, and Ulster Counties.
The System provides an average of approximately one billion gallons of water per day. Water consumption has decreased since 1980 when an average of approximately 1.6 billion gallons per day was provided by the water system, at a time when the population of the City was 7.1 million. DEP maintains a system of dams, reservoirs, aqueducts, and water tunnels in addition to approximately 6,800 miles of water mains. DEP also maintains approximately 7,500 miles of sewers that collect and transport waste and storm water for treatment at the City’s 14 wastewater treatment plants. Additionally, the System operates combined sewer overflow retention facilities, wastewater pump stations, laboratories, sludge dewatering facilities, and inner-harbor vessels, which transport sludge between facilities. The System collects and treats an average of approximately 1.2 billion gallons per day of sewage. Sewer service is provided to virtually the entire City, except for parts of the Borough of Staten Island and the Borough of Queens community of Breezy Point. Sewer service is also provided to certain upstate communities in the System’s watershed areas.
Dividing Weir Bridge from East Basin into West Basin, Ashokan Reservoir

New York City Water & Sewer System 2021 7
Impact of the Novel Coronavirus OutbreakThe outbreak of the coronavirus disease (COVID-19), referred to herein as “COVID-19,” has been declared a pandemic by the World Health Organization. The Governor declared a state of emergency in the State on March 7, 2020 and the Mayor declared a state of emergency in the City on March 12, 2020. While the Governor ended the state of emergency in the State on June 24, 2021, the state of emergency in the City remains in effect. The outbreak of COVID-19 has altered the behavior of businesses and people in a manner that has had negative effects on the City and its economy. Drinking water quality, water supply and wastewater treatment have not been affected by the outbreak of the virus, however, the outbreak has negatively affected revenues of the System.
Credit RatingsThe Authority’s bonds are highly rated by three rating agencies. The Authority’s ratings, among other things, reflect the credit strengths resulting from the strong legal protections provided to bondholders and structural features, which provide a gross pledge of the System revenue to bondholders for debt payments. Standard and Poor’s Ratings Services rates the Authority’s first (general) resolution debt ‘AAA,’ their highest rating. The Authority’s second general resolution debt is rated ‘AA+’ by Standard and Poor’s Ratings Services. Fitch Ratings and Moody’s Investors Service rate both the Authority’s first and second general resolution debt ‘AA+’ and ‘Aa1,’ respectively.
New York State Environmental Facilities Corporation (“EFC”) Clean Water and Drinking Water Revolving Funds Revenue Bonds, issued for eligible System projects are rated ‘AAA’ by the three rating agencies. EFC’s subordinated state revolving fund bonds are also rated ‘AAA.’ The bonds that the Authority places with EFC are an element of security for EFC’s bonds but are unrated second general resolution bonds of the Authority.
Internal ControlsThe managements of the Water Board and the Authority are responsible for establishing and maintaining an internal control structure designed to provide reasonable, but not absolute, assurance that the assets of the System are protected from loss, theft or misuse, and that accounting policies are complied with and the preparation of financial statements conforms with accounting principles generally accepted in the United States of America. Because the cost of internal controls should not exceed anticipated benefits, the objective is to provide reasonable, rather than absolute, assurance that the financial statements are free of any material misstatements. Internal controls cannot provide absolute assurance of achieving financial reporting objectives due to their inherent limitations. Internal controls involve human diligence and compliance; it is subject to human failures and may be circumvented. Because of such limitations, the Authority and the Water Board have designed into the process safeguards to reduce, though not eliminate, this risk.
DEP is subject to the internal control directives and memorandums that originate from the New York City Office of the Comptroller. These directives establish internal controls and accountability, which safeguard the City’s assets. In addition, DEP is subject to audit by the City Comptroller’s Office, whose auditors periodically audit the City’s agencies adherence to internal control policies and procedures.
New Croton Dam Spilling
New York City Water & Sewer System 2021 8
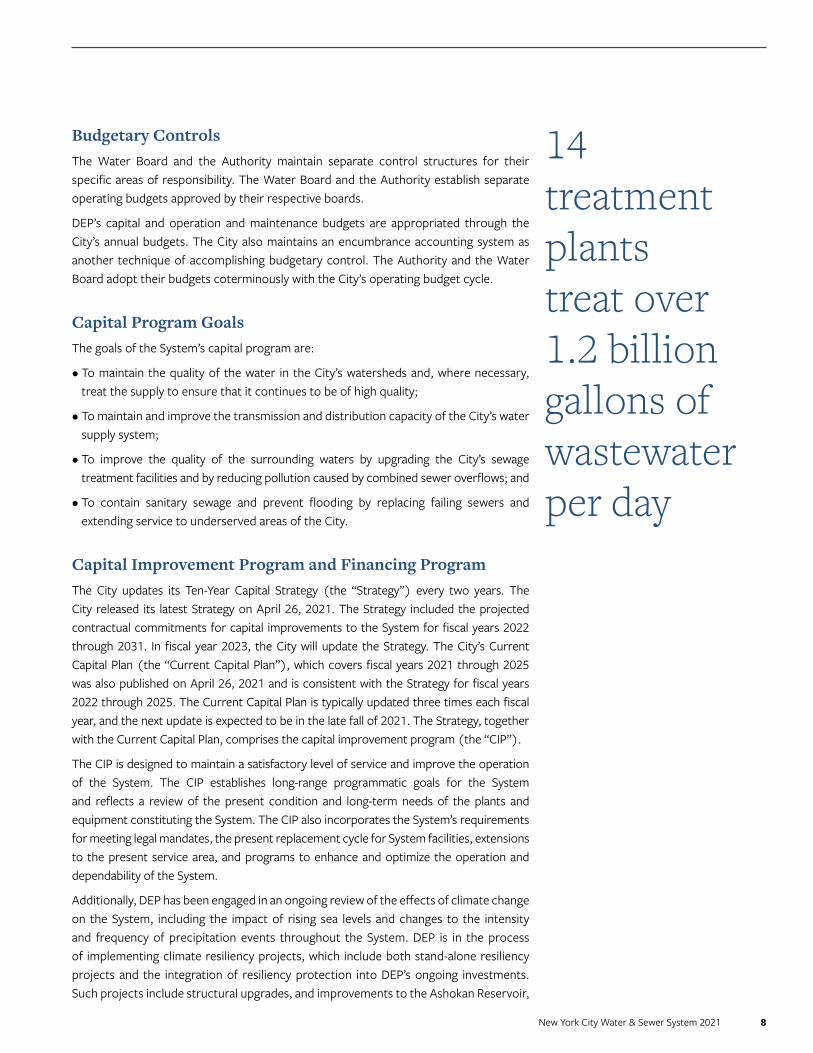
Budgetary ControlsThe Water Board and the Authority maintain separate control structures for their specific areas of responsibility. The Water Board and the Authority establish separate operating budgets approved by their respective boards.
DEP’s capital and operation and maintenance budgets are appropriated through the City’s annual budgets. The City also maintains an encumbrance accounting system as another technique of accomplishing budgetary control. The Authority and the Water Board adopt their budgets coterminously with the City’s operating budget cycle.
Capital Program GoalsThe goals of the System’s capital program are:
• To maintain the quality of the water in the City’s watersheds and, where necessary, treat the supply to ensure that it continues to be of high quality;
• To maintain and improve the transmission and distribution capacity of the City’s water supply system;
• To improve the quality of the surrounding waters by upgrading the City’s sewage treatment facilities and by reducing pollution caused by combined sewer overflows; and
• To contain sanitary sewage and prevent flooding by replacing failing sewers and extending service to underserved areas of the City.
Capital Improvement Program and Financing ProgramThe City updates its Ten-Year Capital Strategy (the “Strategy”) every two years. The City released its latest Strategy on April 26, 2021. The Strategy included the projected contractual commitments for capital improvements to the System for fiscal years 2022 through 2031. In fiscal year 2023, the City will update the Strategy. The City’s Current Capital Plan (the “Current Capital Plan”), which covers fiscal years 2021 through 2025 was also published on April 26, 2021 and is consistent with the Strategy for fiscal years 2022 through 2025. The Current Capital Plan is typically updated three times each fiscal year, and the next update is expected to be in the late fall of 2021. The Strategy, together with the Current Capital Plan, comprises the capital improvement program (the “CIP”).
The CIP is designed to maintain a satisfactory level of service and improve the operation of the System. The CIP establishes long-range programmatic goals for the System and reflects a review of the present condition and long-term needs of the plants and equipment constituting the System. The CIP also incorporates the System’s requirements for meeting legal mandates, the present replacement cycle for System facilities, extensions to the present service area, and programs to enhance and optimize the operation and dependability of the System.
Additionally, DEP has been engaged in an ongoing review of the effects of climate change on the System, including the impact of rising sea levels and changes to the intensity and frequency of precipitation events throughout the System. DEP is in the process of implementing climate resiliency projects, which include both stand-alone resiliency projects and the integration of resiliency protection into DEP’s ongoing investments. Such projects include structural upgrades, and improvements to the Ashokan Reservoir,
14 treatment plants treat over 1.2 billion gallons of wastewater per day

New York City Water & Sewer System 2021 9
improvement to wastewater treatment assets to protect them from flooding, and resiliency projects along the East River. DEP expects that additional resiliency projects will be identified and implemented in the coming years.
The total capital commitments projected to be provided from the System funds is nearly $24.3 billion for the 11-year period from fiscal year 2021 through 2031. The capital commitments shown in each year represent capital contracts authorized to be entered into each year that will be paid from the City funds and reimbursed by the Authority, largely from bond proceeds. Actual expenditures from such capital contracts and the issuance of the Authority’s bonds to fund such expenditures occur in the current and subsequent years. The following table reflects the CIP as of April 2021. For a number of reasons, including unforeseen cost inflation and changes in plans, actual costs may vary from the CIP set forth in the table. The CIP is divided into five project types, each discussed below.
Water Supply and TransmissionThis component of the CIP includes over $1.2 billion for Stage 2 of the City’s Water Tunnel No. 3 and upgrades at the Hillview Reservoir. The Hillview Reservoir upgrades include new chemical addition facilities and flow control improvements. In May 2019, the federal court approved a federal Consent Decree that requires DEP to cover the Hillview Reservoir by 2049. The CIP does not include funding to construct a cover.
Stage 2 of the City’s Water Tunnel No. 3 extends from the end of Stage 1 to supply Queens, Brooklyn and the Richmond Tunnel servicing Staten Island, and from the valve chamber at Central Park into Lower Manhattan. Water Tunnel No. 3 will augment the transmission capacity from the watersheds into the City, permit the inspection and rehabilitation of Tunnels No. 1 and 2, and provide delivery alternatives to the City in the event of disruption in Tunnels No. 1 or 2, which were put into operation in 1917 and 1936, respectively. Stage 1 of Tunnel No. 3 commenced operation in July 1998. The Manhattan leg of Stage 2 was completed and activated in October 2013. The tunnel and most of the infrastructure work for the Brooklyn/Queens segment of Stage 2 are
Capital Improvement Program($ in 000’s)
2021 2022 2023 2024 2025 2026 2027 2028 2029 2030 2031 TOTAL
Water Supply and Transmission 497 49 16 757 634 47 441 140 2 150 150 $ 2,884
Water Distribution 463 377 462 714 693 554 660 520 504 546 523 $ 6,015
Water Pollution Control 785 1,638 1,113 738 1,131 868 999 530 653 218 219 $ 8,892
Sewers 436 769 472 430 650 529 235 688 600 500 518 $ 5,826
Equipment 65 55 19 24 215 94 148 10 46 — — $ 677
Total City Funds $ 2,246 $ 2,888 $ 2,081 $ 2,663 $ 3,322 $ 2,093 $ 2,483 $ 1,888 $ 1,805 $ 1,414 $ 1,410 $ 24,292
The Staten Island Bluebelt is an award winning, ecologically sound and cost-effective storm water management.
1/3 of Staten Island’s land area is managed by the Bluebelt.
Staten Island Bluebelt
New York City Water & Sewer System 2021 10
complete, with two final shafts to be constructed. Designs are also underway to connect the Brooklyn/Queens segment to the Richmond Downtake Chamber, which will provide water from Tunnel No. 3 to Staten Island.
The CIP also includes nearly $1.6 billion for the Kensico-Eastview Connection, which was previously referred to as “Stage III of the City’s Water Tunnel No. 3.” The Kensico-Eastview Connection will connect the Kensico Reservoir to the Catskill/Delaware ultraviolet facility, which is necessary to provide redundancy in the water supply system.
The CIP includes approximately $73 million for water conveyance projects. Funds included in the CIP for conveyance include DEP’s Water for the Future program, which consists of repair and replacement of the Rondout-West Branch Tunnel of the Delaware Aqueduct, as well as water supply augmentation projects required to ensure an adequate water supply to the City during the shut-down of the tunnel starting in 2022. Water supply augmentation includes the rehabilitation of the Catskill Aqueduct and a water demand management program to reduce the City water consumption. Shaft construction for the bypass tunnel is underway and funds for construction were committed in prior years.
Water Distribution and Treatment The System’s drinking water is among the best in the country. The CIP includes approximately $6.0 billion for the protection, expansion, and distribution of the City’s water supply, including nearly $2.8 billion for trunk and distribution water main replacements and extensions. Also included is nearly $1.3 billion for the dam safety program, including the reconstruction of Gilboa Dam, improvements at the Ashokan Reservoir, including upgrading and stabilizing the thirteen dikes and dams to bring them up to modern standards.
The program also calls for approximately $1.5 billion to be committed to ongoing water quality preservation and protection. To ensure its continuing quality and to comply with federal and state standards, DEP is pursuing a comprehensive program to protect the Catskill and Delaware watersheds. DEP continues to acquire and manage environmentally sensitive property in the upstate watershed and undertake other ongoing projects in partnership with watershed residents, as part of the Filtration Avoidance Determination (“FAD”) issued by the U.S. Environmental Protection Agency (“USEPA”). The FAD allows the City to avoid filtering water from the Catskill and Delaware systems. In July 2007, USEPA issued, for the first time, a 10-year FAD to the City, extending to 2017. In December 2017, the New York State Department of Health issued a new 10-year FAD. The estimated remaining cost of complying with the 2017 FAD is $227 million, all of which is included in the CIP. USEPA has previously issued a series of FADs to the City for shorter terms, since 1993.
Water Pollution ControlTo improve the quality of the City’s estuaries and surrounding waterways and to comply with federal Clean Water Act mandates, approximately $8.9 billion is included in the CIP for water pollution control programs. Investments in water pollution control are primarily responsible for the improvements to water quality in New York Harbor and the Jamaica Bay watershed.
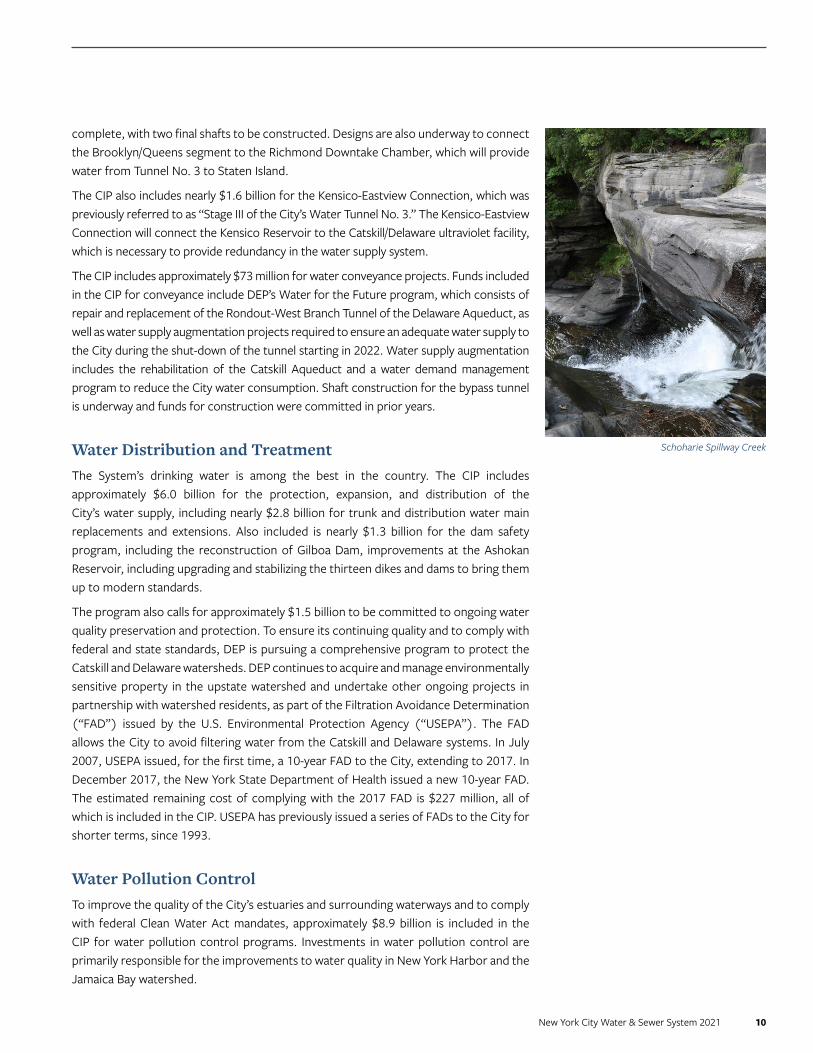
Schoharie Spillway Creek

New York City Water & Sewer System 2021 11
The CIP allocates approximately $5.5 billion for the replacement or reconstruction of components at the City’s wastewater resource recovery facilities to ensure their continuous and reliable operations. The plant upgrades, including the retrofitting of seven plants to achieve additional nitrogen treatment have been completed. Pursuant to the recent modification of the related consent order, construction at the Coney Island plant must be completed by October 2022.
DEP’s CIP also includes over $3.4 billion for mandated projects, which will reduce combined sewer overflow (“CSO”). CSOs are currently a source of pollution in the waterways surrounding the City. CSO events occur during and after heavy rainstorms, when the flow of wastewater and storm water in the sewers exceeds the treatment capacity of a wastewater treatment plant and enters surrounding waterways untreated. In September 2010, DEP released a green infrastructure plan presenting an alternative approach to reducing CSOs. The plan uses a mix of green infrastructure to prevent storm water from reaching the sewers and cost-effective traditional infrastructure that will reduce sewer overflows into waterways. On March 8, 2012, DEP signed a groundbreaking agreement with the New York State Department of Environmental Conservation to reduce CSOs, which incorporated the goals of this innovative plan. As required by the agreement, DEP submitted eleven CSO long-term control plans to ensure the water bodies comply with Clean Water Act requirements and received approval for nine of the submitted plans.
SewersApproximately $5.8 billion is projected in the CIP to be committed to replace existing sewers in areas requiring increased capacity, to extend sewers to unserved or underserved areas, and to replace failing, flawed, or collapsed sewer mains.
Certain parts of the City, including areas of southeast Queens and Staten Island, do not have built-out storm sewer infrastructure. The CIP allocates $1.8 billion to construction of storm sewer infrastructure in southeast Queens. The complete cost estimate for the buildout, which is expected to take forty-five years, is not available.
On May 11, 2021, the City issued a Stormwater Resiliency Plan that includes the City’s first city-wide analysis of flooding caused by extreme rainfall events. The Stormwater Resiliency Plan also outlines goals and initiatives for the City to implement over a period of 10 years. In addition, following significant rainfall and severe flooding in parts of the City brought about by Hurricane Ida, on September 3, 2021 the Mayor created the Extreme Weather Response Taskforce. On September 27, 2021, the taskforce released its report, which includes recommendations to improve emergency preparedness and response, to protect occupants of basement apartments, and to expedite investment in infrastructure, including sewers. To support the report’s recommendations, the Mayor has announced plans to increase capital spending through fiscal year 2031 by $2.5 billion and to accelerate to fiscal years 2022 through 2024 approximately $200 million in capital funding previously expected to be spent in fiscal years 2025 through 2028. Approximately $2.1 billion of the new capital spending, and all of the accelerated funding, would be in DEP’s capital budget and is expected to be reflected in the next Current Capital Plan.
NYW bonds pay for projects in the capital program of the City’s Water and Sewer System. This capital investment maintains the quality of New York City’s drinking water, which each day delivers more than:
1 Billion gallons of fresh, clean water from the City’s watersheds
125as far out as 125 miles from the City
9.8 Million people
$10M Drainage Upgrade for Bay Terrace, Staten Island

New York City Water & Sewer System 2021 12
EquipmentPrograms in this category of the CIP include reconstruction and rehabilitation of various water and sewer filed operations facilities and DEP administrative offices, utility relocation for sewer and water mains, management information systems, water meter installation and replacement, and the procurement of vehicles and equipment. About $677 million is included in the CIP for these projects.
Approximately 96% of total accounts and approximately 75% of total revenues, are billed on a metered basis. The automated meter reading system transmits water usage information by radio signal to DEP. DEP has installed approximately 829,800 transmitters, representing 99% of DEP’s installation target. All customers whose accounts have been upgraded for automated meter reading can now access details of their water usage through DEP’s website.
Independent AuditSection 6.11 (b) of the Financing Agreement by and among the City, the Authority, and the Water Board dated as of July 1, 1985, requires that the Authority shall submit to the Mayor, the Comptroller and the Director of Management and Budget of the City, audited annual financial statements of the Authority and the Water Board. The financial section of this 2021 Comprehensive Annual Financial Report begins with the report of our independent auditors, Grant Thornton LLP. This report expresses an unmodified opinion as to the fairness of the presentation of our financial statements.
AwardGovernment Finance Officers Association of the United States and Canada (“GFOA”) awarded a Certificate of Achievement for Excellence in Financial Reporting to New York City Water and Sewer System for its comprehensive annual financial report for the fiscal year ended June 30, 2020. This was the 25th consecutive year that the government has achieved this prestigious award. In order to be awarded a Certificate of Achievement, a government must publish an easily readable and efficiently organized comprehensive annual financial report. This report must satisfy both generally accepted accounting principles and applicable legal requirements.
A Certificate of Achievement is valid for a period of one year only. We believe that our current comprehensive annual financial report continues to meet the Certificate of Achievement Program’s requirements and we are submitting it to GFOA to determine its eligibility for another certificate.
Respectfully submitted,
oLGA ChernAt Executive Director
roBert L. BALDUCCi Comptroller
Freedom Tower
New York City Water & Sewer System 2021 13
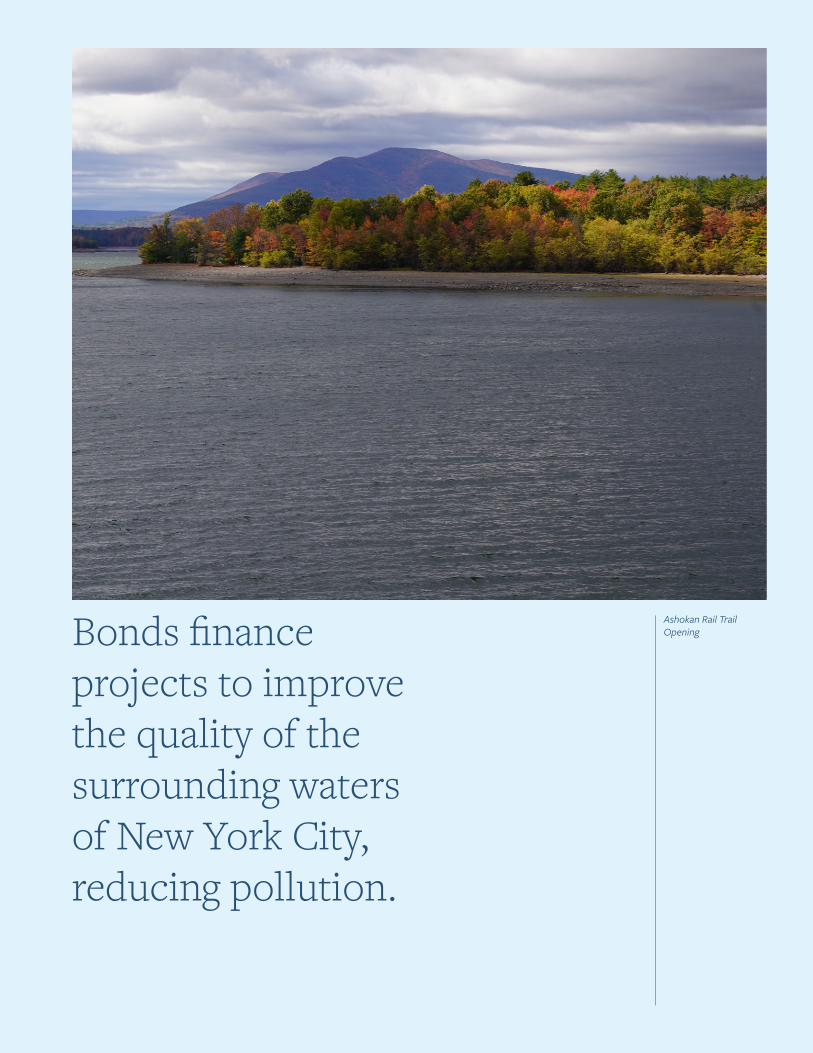
Ashokan Rail Trail OpeningBonds finance
projects to improve the quality of the surrounding waters of New York City, reducing pollution.
New York City Water & Sewer System 2021 14
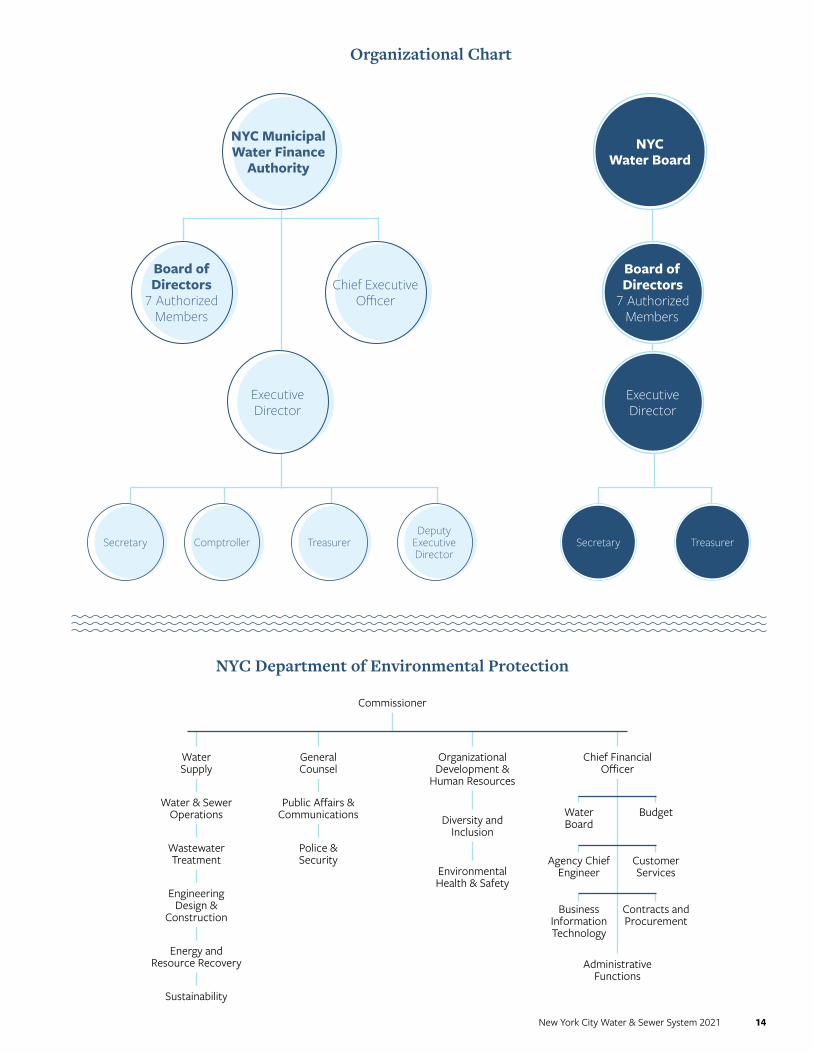
Organizational Chart
Board of Directors
7 Authorized Members
Chief Executive Officer
NYC Municipal Water Finance
Authority
NYC Water Board
Executive Director
Board of Directors
7 Authorized Members
Executive Director
Secretary Comptroller Treasurer Secretary TreasurerDeputy
Executive Director
Business Information Technology
Contracts and Procurement
Agency Chief Engineer
Customer Services
Water Board
Budget
Chief Financial Officer
Administrative Functions
NYC Department of Environmental Protection
Commissioner
Environmental Health & Safety
Diversity and Inclusion
Organizational Development &
Human Resources
Water Supply
Water & Sewer Operations
Engineering Design &
Construction
Energy and Resource Recovery
Wastewater Treatment
Sustainability
General Counsel
Public Affairs & Communications
Police & Security
New York City Water & Sewer System 2021 15
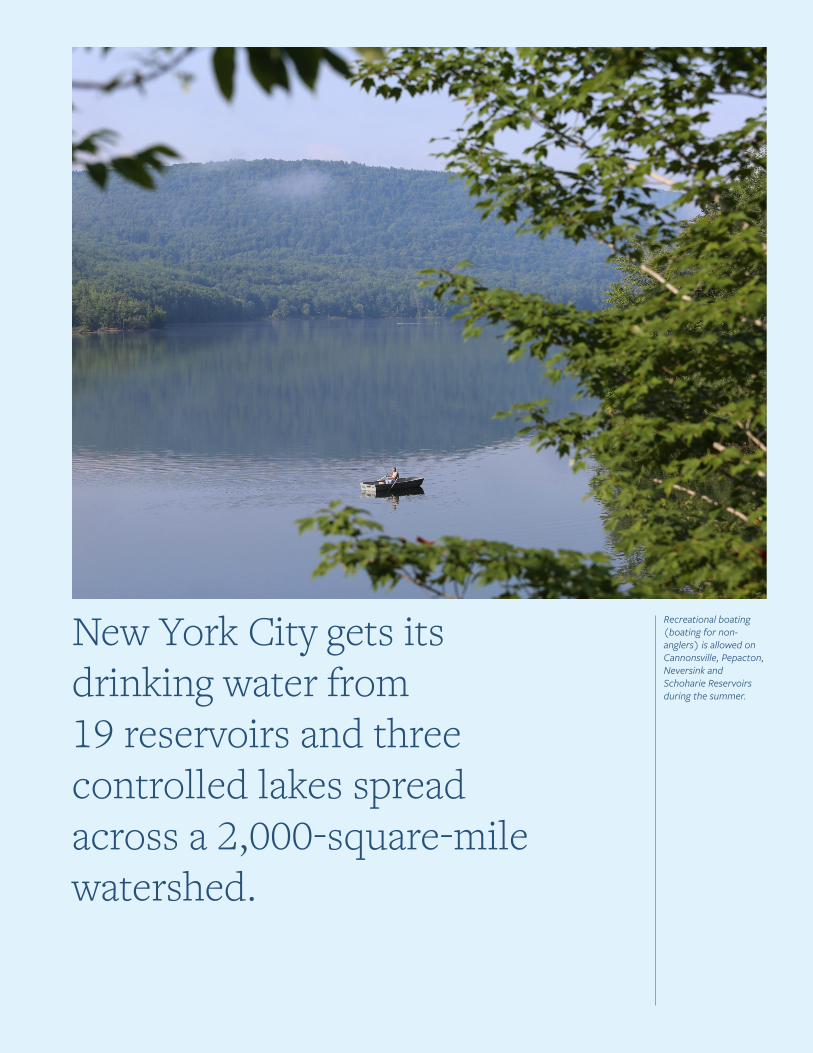
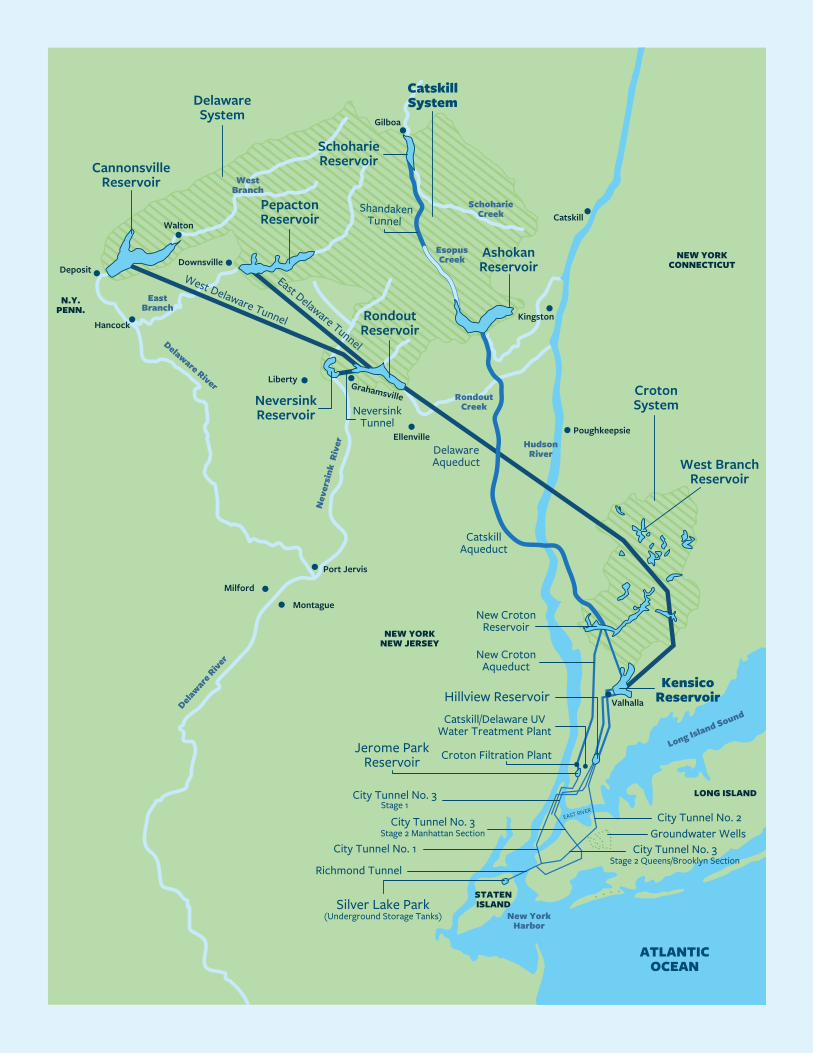
Recreational boating (boating for non-anglers) is allowed on Cannonsville, Pepacton, Neversink and Schoharie Reservoirs during the summer.
New York City gets its drinking water from 19 reservoirs and three controlled lakes spread across a 2,000-square-mile watershed.
New York City Water & Sewer System 2021 16
DelawareSystem
Catskill System
Schoharie Reservoir
Pepacton Reservoir
Ashokan Reservoir
Rondout Reservoir
Neversink Reservoir
Cannonsville Reservoir
Croton System
West Branch Reservoir
Kensico ReservoirHillview Reservoir
Jerome Park Reservoir
New Croton Reservoir
New Croton Aqueduct
City Tunnel No. 3Stage 1
City Tunnel No. 3
City Tunnel No. 1
Richmond Tunnel
Stage 2 Manhattan Section
Silver Lake Park(Underground Storage Tanks)
STATEN ISLAND
City Tunnel No. 3
City Tunnel No. 2Groundwater Wells
Stage 2 Queens/Brooklyn Section
LONG ISLAND
NEW YORKNEW JERSEY
Montague
Milford
Port Jervis
Ellenville
Liberty
Downsville
Hancock
Deposit
Walton
Gilboa
Catskill
Poughkeepsie
ATLANTIC OCEAN
NEW YORKCONNECTICUT
N.Y.PENN.
Catskill Aqueduct
Delaware Aqueduct
Neversink Tunnel
East Branch
West Branch
Schoharie Creek
Hudson River
Rondout Creek
Esopus Creek
Kingston
Catskill/Delaware UV Water Treatment Plant
Valhalla
New YorkHarbor
Croton Filtration Plant

New York City Water & Sewer System 2021 17
Government Finance Officers Association
Certificate of Achievementfor Excellence
in Financial Reporting
Presented to
New York City Water and Sewer SystemNew York
For its Comprehensive AnnualFinancial Report
For the Fiscal Year Ended
June 30, 2020
Executive Director/CEO

New York City Water & Sewer System 2021 18
New York City Municipal Water Finance Authority
BOARD OF DIRECTORS
Jacques Jiha, Ex Officio Member
Basil Seggos, Ex Officio Member
Sherif Soliman, Ex Officio Member
Vincent Sapienza, P.E., Ex Officio Member
Marc V. Shaw, Member
Max Von Hollweg, Member
STAFF
David Womack, Chief Executive Officer
Olga Chernat, Executive Director
Sanna Wong-Chen, Deputy Executive Director
Prescott D. Ulrey, Secretary
Robert L. Balducci, Comptroller
Nameca Sharma, Assistant Comptroller
Jeffrey M. Werner, Assistant Secretary
Albert M. Rodriguez, Assistant Secretary
Laura Tarbox, Assistant Treasurer
New York City Water Board
MEMBERS
Alfonso L. Carney Jr., Chairman
Evelyn Fernandez-Ketcham, Member
Adam Freed, Member
Jonathan E. Goldin, Member
Jukay Hsu, Member
Arlene M. Shaw, Member
Daniel A. Zarrilli, Member
STAFF
Joseph Murin, Executive Director
Omar A. Nazem, Treasurer
Greg L. Ascierto, Deputy Treasurer
Albert M. Rodriguez, Secretary
New York City Department of Environmental ProtectionVincent Sapienza, P.E., Commissioner
Joseph Murin, Chief Financial Officer
CUSTOMER SERVICES
Jeff Lynch, Deputy Commissioner
LEGAL AFFAIRS
Elissa Stein Cushman, General Counsel
WASTEWATER TREATMENT
Pamela Elardo, P.E., Deputy Commissioner
WATER AND SEWER OPERATIONS
Anastasos Georgelis, P.E., Deputy Commissioner
SUSTAINABILITY
Angela Licata, Deputy Commissioner
POLICE AND SECURITY
John Cosgrove, Deputy Commissioner
ENGINEERING DESIGN AND CONSTRUCTIONAna Barrio, Deputy Commissioner
ORGANIZATIONAL DEVELOPMENT AND HUMAN RESOURCES
Zoe Ann Campbell, Deputy Commissioner
WATER SUPPLY
Paul V. Rush, P.E., Deputy Commissioner
BUSINESS INFORMATION TECHNOLOGY
Cecil McMaster, Chief Information Officer
PUBLIC AFFAIRS & COMMUNICATIONS
Michael DeLoach, Deputy Commissioner
System Officials
Harbor Water Quality Sampling
New York City Water & Sewer System 2021 19
Living Shoreline restoration project, Jamaica Bay
FINANCIAL

GT.COM Grant Thornton LLP is the U.S. member firm of Grant Thornton International Ltd (GTIL). GTIL and each of its member firms are separate legal entities and are not a worldwide partnership.
To the Members of the Joint Audit Committee of the New York City Municipal Water Finance Authority and New York City Water Board
Report on the combining financial statements We have audited the accompanying combining financial statements of the New York City Municipal Water Finance Authority and the New York City Water Board, which collectively comprise the New York City Water and Sewer System (the “System”), a component unit of The City of New York, which collectively comprise the combining statements of net position (deficit), the related combining statements of revenues, expenses, and changes in net position (deficit), and the combining statements of cash flows as of and for the years ended June 30, 2021 and 2020, and the related notes to the combining financial statements.
Management’s responsibility for the combining financial statements Management is responsible for the preparation and fair presentation of these combining financial statements in accordance with accounting principles generally accepted in the United States of America; this includes the design, implementation, and maintenance of internal control relevant to the preparation and fair presentation of combining financial statements that are free from material misstatement, whether due to fraud or error.
Auditor’s responsibility Our responsibility is to express an opinion on these combining financial statements based on our audits. We conducted our audits in accordance with auditing standards generally accepted in the United States of America. Those standards require that we plan and perform the audit to obtain reasonable assurance about whether the combining financial statements are free from material misstatement.
An audit involves performing procedures to obtain audit evidence about the amounts and disclosures in the combining financial statements. The procedures selected depend on the auditor’s judgment, including the assessment of the risks of material misstatement of the combining financial statements, whether due to fraud or error. In making those risk assessments, the auditor considers internal control relevant to the System’s preparation and fair presentation of the combining financial statements in order to design audit procedures that are appropriate in the circumstances, but not for the purpose of expressing an opinion on the effectiveness of the System’s internal control. Accordingly, we express no such opinion. An audit also includes evaluating the appropriateness of accounting policies used and the reasonableness of significant accounting estimates made by management, as well as evaluating the overall presentation of the combining financial statements.
REPORT OF INDEPENDENT CERTIFIED PUBLIC ACCOUNTANTS
GRANT THORNTON LLP 757 Third Avenue, 9th Floor New York, NY 10017 D +1 212 599 0100 F +1 212 370 4520
New York City Water & Sewer System 2021 20

We believe that the audit evidence we have obtained is sufficient and appropriate to provide a basis for our audit opinion.
Opinion In our opinion, the combining financial statements referred to above present fairly, in all material respects, the financial position of the New York City Municipal Water Finance Authority and the New York City Water Board as of June 30, 2021 and 2020, and the results of their changes in financial position and their cash flows for the years then ended in accordance with accounting principles generally accepted in the United States of America.
Other matters
Required supplementary information Accounting principles generally accepted in the United States of America require that the management’s discussion and analysis on pages 22 through 31, the schedule of changes for total OPEB plan liability and related ratios on page 75, the schedule of the Authority’s proportionate share of the net pension liability on page 76, and the schedule of the Authority’s pension contributions on page 76 be presented to supplement the basic combining financial statements. Such information, although not a required part of the basic combining financial statements, is required by the Governmental Accounting Standards Board who considers it to be an essential part of financial reporting for placing the basic combining financial statements in an appropriate operational, economic, or historical context. This required supplementary information is the responsibility of management. We have applied certain limited procedures to the required supplementary information in accordance with auditing standards generally accepted in the United States of America. These limited procedures consisted of inquiries of management about the methods of preparing the information and comparing the information for consistency with management’s responses to our inquiries, the basic combining financial statements, and other knowledge we obtained during our audits of the basic combining financial statements. We do not express an opinion or provide any assurance on the required supplementary information because the limited procedures do not provide us with sufficient evidence to express an opinion or provide any assurance.
Other information The accompanying introductory section and statistical sections are presented for purposes of additional analysis and are not a required part of the basic combining financial statements. The introductory and statistical sections have not been subjected to the auditing procedures applied in the audit of the basic combining financial statements, and accordingly, we do not express an opinion or provide any assurance on them.
New York, New York October 14, 2021
New York City Water & Sewer System 2021 21

New York City Water & Sewer System 2021 22
Overview of the Combining Financial StatementsThe following is an overview of the financial activities of the New York City Water and Sewer System (the “System”) as of and for the fiscal years ended June 30, 2021 and 2020. The System is a joint operation consisting of two legally separate and independent entities: the New York City Municipal Water Finance Authority (the “Authority”) and the New York City Water Board (the “Water Board”). The System is a component unit of the City of New York (the “City”).
The combining financial statements consist of four parts: (1) management’s discussion and analysis (this section), (2) the basic combining financial statements, (3) the notes to the combining financial statements and (4) required supplementary information.
The basic combining financial statements of the System, which include the combining statements of net position (deficit), the combining statements of revenues, expenses and changes in net position (deficit) and the combining statements of cash flows, are presented for the purposes of displaying entity-wide information in accordance with Governmental Accounting Standards Board (“GASB”) requirements. These combining financial statements are prepared using the economic resources measurement focus and the accrual basis of accounting. Accordingly, revenues are recognized when earned, and expenses are recorded when a liability is incurred, regardless of the timing of the related cash flows.
Management’s Discussion and Analysis (Unaudited)June 30, 2021 and 2020

Management’s Discussion and Analysis (Unaudited) June 30, 2021 and 2020
New York City Water & Sewer System 2021 23
Financial Analysis and Results of OperationsThe following summarizes the activities of the System for the fiscal years 2021, 2020, and 2019, respectively (in thousands):
Variance
2021 2020 2019 2021 vs 2020 2020 vs 2019
REVENUES:Operating revenues:
Water supply and distribution $ 1,375,769 $ 1,421,636 $ 1,416,713 $ (45,867) $ 4,923
Sewer collection and treatment 2,187,473 2,260,401 2,252,574 (72,928) 7,827
Bad debt expense (81,390) (31,481) 852 (49,909) (32,333)
Other operating revenues 174,139 180,336 149,660 (6,197) 30,676 Total operating revenues 3,655,991 3,830,892 3,819,799 (174,901) 11,093
Non-operating revenues:
Subsidy income 154,105 165,570 176,346 (11,465) (10,776)
Investment income 1,949 79,993 91,712 (78,044) (11,719)
Total non-operating revenues 156,054 245,563 268,058 (89,509) (22,495)TOTAL REVENUES 3,812,045 4,076,455 4,087,857 (264,410) (11,402)
EXPENSES:
Other operating expenses 128,064 70,994 76,051 57,070 (5,057)
Operations and maintenance 1,687,273 1,614,828 1,469,601 72,445 145,227
General and administrative 46,600 48,550 52,504 (1,950) (3,954)
Depreciation and amortization 973,433 1,023,186 908,355 (49,753) 114,831
Capital distributions 23,090 26,566 110,750 (3,476) (84,185)
Net loss on retirement and impairment of capital assets 3,540 3,676 2,423 (136) 1,253
(Gain)/loss on defeasance (11,568) (10,107) 26,058 (1,461) (36,165)Interest expense and cost of issuance 1,075,697 1,154,105 1,198,849 (78,408) (44,745)
TOTAL EXPENSES 3,926,129 3,931,798 3,844,591 (5,669) 87,207
Net income (loss) before capital contributions (114,084) 144,657 243,266 (258,741) (98,609)
Capital contributions 24,463 48,062 12,448 (23,599) 35,614
CHANGE IN NET POSITION (DEFICIT) (89,621) 192,719 255,714 (282,340) (62,995)
NET POSITION (DEFICIT)—BEGINNING 1,532,176 1,339,457 1,083,743 192,719 255,714
NET POSITION (DEFICIT)—ENDING $ 1,442,555 $ 1,532,176 $ 1,339,457 $ (89,621) $ 192,719

Management’s Discussion and Analysis (Unaudited) June 30, 2021 and 2020
New York City Water & Sewer System 2021 24
Operating RevenuesOperating revenues are comprised of water supply and distribution, sewer collection and treatment, bad debt expense, and other operating revenues.
2021–2020
Operating revenues decreased by $175 million, or 4.6% compared to fiscal year 2020. The decrease in revenues reflects a combination of (a) no rate increase for fiscal year 2021, (b) a 3.8% year over year decline in water consumption by customers billed at metered rates and (c) an increase in customer delinquencies.
2020–2019
Operating revenues increased by $11.1 million, or 0.3% compared to fiscal year 2019. The increase in revenues reflects a combination of a 2.3% rate increase adopted by the Water Board for fiscal year 2020, mostly offset by a 3.1% year over year decline in water consumption by customers billed at metered rates.
Other Operating RevenuesThe following further details other operating revenues for fiscal years 2021, 2020, and 2019, respectively (in thousands):
Variance
2021 2020 2019 2021 vs 2020 2020 vs 2019
Upstate water fees $ 89,016 $ 85,114 $ 66,180 $ 3,902 $ 18,934
Late payment fees 31,854 39,211 38,842 (7,357) 369
Change in residual interest in sold liens (4,653) 2,662 (11,752) (7,315) 14,414
Connection fees and permits 13,569 11,809 18,682 1,760 (6,873)
Service line protection program 44,353 41,540 37,708 2,813 3,832
TOTAL OTHER OPERATING REVENUES $ 174,139 $ 180,336 $ 149,660 $ (6,197) $ 30,676
2021–2020
Upstate water fees increased by $3.9 million. This was due primarily to a 1.6% increase in the volume of water supplied to these customers, including increases to the volume of water sold at both the entitlement and excess rates.
Late payment fees decreased by $7.4 million compared to fiscal year 2020 due to fewer payments made for delinquent accounts. This amount fluctuates depending on the timeliness of customer payment.
The change in residual interest in sold liens decreased by $7.3 million compared to fiscal year 2020. Due to coronavirus pandemic (COVID-19), referred to herein as “COVID-19,” the City did not complete lien sales during fiscal year 2020 and 2021, respectively.
The amounts received for the service line protection program increased by $2.8 million. The number of effective policies decreased from approximately 278,000 on June 30, 2020 to approximately 272,500 by the end of fiscal year 2021, and a price increase for water and sewer warranties of 16.7% went into effect on January 6, 2020.

Management’s Discussion and Analysis (Unaudited) June 30, 2021 and 2020
New York City Water & Sewer System 2021 25
2020–2019
Upstate water fees increased by $18.9 million. This is due primarily to a 3.8% increase in the volume of water supplied to these customers, including increases to the volume of water sold at both the entitlement and excess rates.
Late payment fees remained constant compared to fiscal year 2019. The interest rate charged on delinquent water and sewer payments remained unchanged at 7.0%.
The change in residual interest in sold liens increased by $14.4 million compared to fiscal year 2019. This is due to fewer collection and enforcement activities being pursued during the COVID-19 pandemic, as well as the closing of the fiscal year 2019 lien sale occurring after the start of fiscal year 2020; the residual value of the liens remaining in the portfolio was higher at the end of fiscal year 2020 compared to the end of fiscal year 2019.
The amounts received for the service line protection program increased by $3.8 million. The number of effective policies increased from approximately 274,000 on June 30, 2019 to approximately 278,000 by the end of fiscal year 2020. Also, on January 6, 2020, a combined water and sewer line protection price increase of 16.7% went into effect.
Non-Operating RevenuesNon-operating revenues are comprised of subsidy income and investment income.
2021–2020
Investment income decreased by $78.0 million compared to fiscal year 2020. The decline was due to lower interest rates on invested assets, and a higher interest rate forward curve than a year ago, which resulted in unrealized loss on certain investment contracts. In addition, investment income in fiscal year 2020 included a one-time payment of $7.5 million due to an early termination of an investment agreement.
2020–2019
Investment income decreased by $11.7 million compared to fiscal year 2019. The decrease was due to lower interest rates on invested assets.
Operating ExpensesOperating expenses are comprised of operations and maintenance, general and administrative, depreciation and amortization, and other operating expenses.
2021–2020
Total operations and maintenance expense increased by $72.4 million or 4.5% compared to fiscal year 2020. This is due primarily to an increase in the wastewater operating cost.
Depreciation and amortization decreased by $49.8 million compared to fiscal year 2020.
2020–2019
Total operations and maintenance expense increased by $145 million or 9.9% compared to fiscal year 2019. This is due primarily to a rental payment of $128 million and an increase in the wastewater operating cost.
Depreciation and amortization expense increased by $115 million compared to fiscal year 2019. In fiscal year 2020, a total of $1.3 billion of completed projects were removed from construction in progress into depreciable utility plant asset in service which resulted in the higher depreciation expense in fiscal year 2020.

Management’s Discussion and Analysis (Unaudited) June 30, 2021 and 2020
New York City Water & Sewer System 2021 26
Non-Operating ExpensesNon-operating expenses are comprised of interest expense, gain (loss) on defeasance, cost of issuance, net loss on retirement of capital assets, and capital distribution.
2021–2020
Capital distribution decreased by $3.5 million in fiscal year 2021 compared to fiscal year 2020. This amount varies each year based on the land acquired and then granted to the City.
Interest expense and cost of issuance decreased by $78.4 million. This decrease was primarily due to the amortization of bond premium, and lower interest rates on variable rate bonds compared to fiscal year 2020.
Fiscal year 2021 cash defeasance resulted in an accounting gain of $11.6 million. This represents the difference between the carrying value of the defeased bonds and the amount transferred to fund the escrow account (using current resources) to defease the bonds. This gain was reported in the System’s combining statement of revenues, expenses and changes in net position (deficit).
2020–2019
Capital distribution decreased by $84.2 million in fiscal year 2020 compared to fiscal year 2019. Fiscal year 2019 was exceptionally large as the System acquired additional land around the Gowanus Canal area and then granted it to the City.
Interest expense and cost of issuance decreased by $44.7 million. This decrease was primarily due to the amortization of bond premium, lower interest rate on variable rate bonds compared to fiscal year 2019 and offset by an increase of the cost of issuance on bonds.
Fiscal year 2020 cash defeasance resulted in an accounting gain of $10.1 million. This represents the difference between the carrying value of the defeased bonds and the amount transferred to fund the escrow account (using current resources) to defease the bonds. This gain was reported in the System’s combining statement of revenues, expenses and changes in net position (deficit).
Capital ContributionsCapital Contributions are comprised of federal, state and other contributions to the System’s capital projects.
2021–2020
Capital contributions decreased by $23.6 million in fiscal year 2021. Fiscal year 2020 was notably high due to a $30 million note, the repayment of which was forgiven by the Environmental Facilities Corporation (“EFC”) in accordance with the terms of the note.
2020–2019
Capital contributions increased by $35.6 million in fiscal year 2020, mainly due to a $30 million note that was forgiven by the EFC as per the note agreement.
Change in Net Position (Deficit)
2021–2020
The change in net position (deficit) represents the net total of operating revenue and expenses, non-operating revenues and expenses, and capital contributions. The change in net position (deficit) decreased by $282 million in fiscal year 2021 compared to fiscal year 2020. As explained in more details above, in fiscal year 2021 total revenues decreased by $264 million, partially offset by a $5.7 million reduction in total expenses. In addition, capital contribution decreased by $23.6 million.
2020–2019
The change in net position (deficit) represents the net total of operating revenue and expenses, non-operating revenues and expenses, and capital contributions. The change in net position (deficit) decreased by $63 million in fiscal year 2020 compared to fiscal year 2019.
Management’s Discussion and Analysis (Unaudited) June 30, 2021 and 2020
New York City Water & Sewer System 2021 27
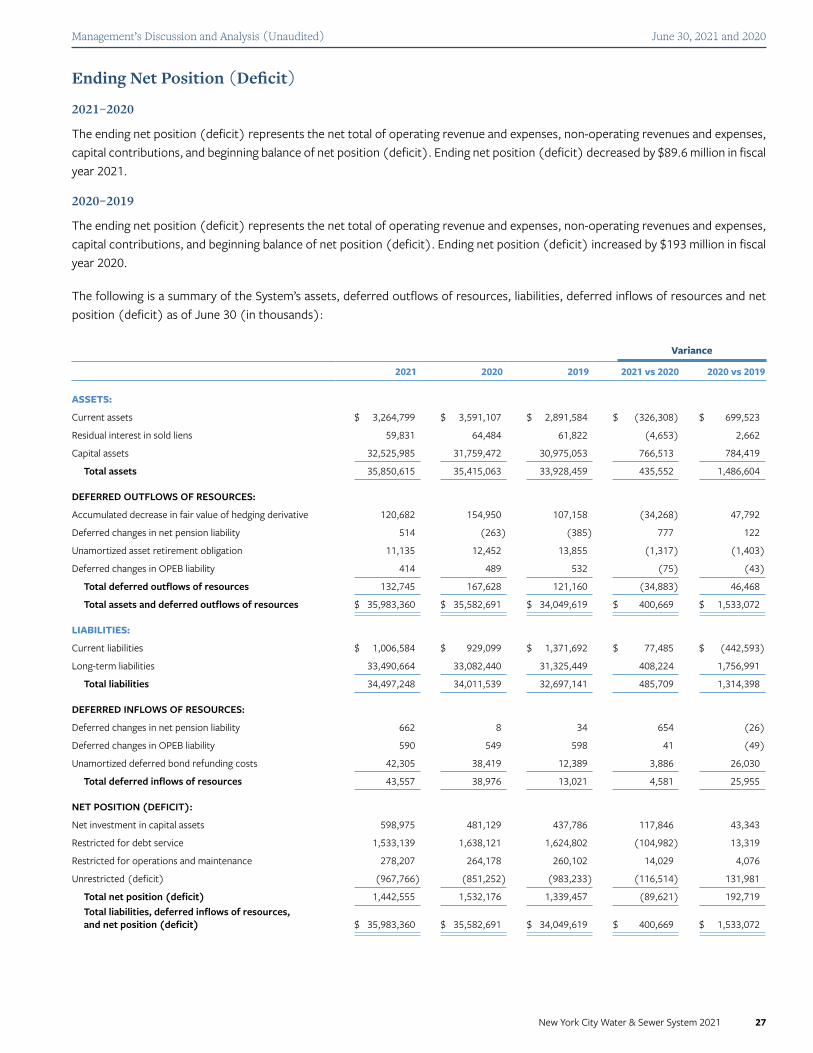
Ending Net Position (Deficit)
2021–2020
The ending net position (deficit) represents the net total of operating revenue and expenses, non-operating revenues and expenses, capital contributions, and beginning balance of net position (deficit). Ending net position (deficit) decreased by $89.6 million in fiscal year 2021.
2020–2019
The ending net position (deficit) represents the net total of operating revenue and expenses, non-operating revenues and expenses, capital contributions, and beginning balance of net position (deficit). Ending net position (deficit) increased by $193 million in fiscal year 2020.
The following is a summary of the System’s assets, deferred outflows of resources, liabilities, deferred inflows of resources and net position (deficit) as of June 30 (in thousands):
Variance
2021 2020 2019 2021 vs 2020 2020 vs 2019
ASSETS:
Current assets $ 3,264,799 $ 3,591,107 $ 2,891,584 $ (326,308) $ 699,523
Residual interest in sold liens 59,831 64,484 61,822 (4,653) 2,662
Capital assets 32,525,985 31,759,472 30,975,053 766,513 784,419
Total assets 35,850,615 35,415,063 33,928,459 435,552 1,486,604
DEFERRED OUTFLOWS OF RESOURCES:
Accumulated decrease in fair value of hedging derivative 120,682 154,950 107,158 (34,268) 47,792
Deferred changes in net pension liability 514 (263) (385) 777 122
Unamortized asset retirement obligation 11,135 12,452 13,855 (1,317) (1,403)
Deferred changes in OPEB liability 414 489 532 (75) (43)
Total deferred outflows of resources 132,745 167,628 121,160 (34,883) 46,468
Total assets and deferred outflows of resources $ 35,983,360 $ 35,582,691 $ 34,049,619 $ 400,669 $ 1,533,072
LIABILITIES:
Current liabilities $ 1,006,584 $ 929,099 $ 1,371,692 $ 77,485 $ (442,593)
Long-term liabilities 33,490,664 33,082,440 31,325,449 408,224 1,756,991
Total liabilities 34,497,248 34,011,539 32,697,141 485,709 1,314,398
DEFERRED INFLOWS OF RESOURCES:
Deferred changes in net pension liability 662 8 34 654 (26)
Deferred changes in OPEB liability 590 549 598 41 (49)
Unamortized deferred bond refunding costs 42,305 38,419 12,389 3,886 26,030
Total deferred inflows of resources 43,557 38,976 13,021 4,581 25,955
NET POSITION (DEFICIT):
Net investment in capital assets 598,975 481,129 437,786 117,846 43,343
Restricted for debt service 1,533,139 1,638,121 1,624,802 (104,982) 13,319
Restricted for operations and maintenance 278,207 264,178 260,102 14,029 4,076
Unrestricted (deficit) (967,766) (851,252) (983,233) (116,514) 131,981
Total net position (deficit) 1,442,555 1,532,176 1,339,457 (89,621) 192,719 Total liabilities, deferred inflows of resources, and net position (deficit) $ 35,983,360 $ 35,582,691 $ 34,049,619 $ 400,669 $ 1,533,072

Management’s Discussion and Analysis (Unaudited) June 30, 2021 and 2020
New York City Water & Sewer System 2021 28
Current AssetsCurrent assets are comprised of restricted cash and cash equivalents, restricted investments, accrued interest and subsidy receivable, receivable from the City of New York, and accounts receivable.
2021–2020
Current assets decreased by $326 million or 9.1%. Restricted investments, including restricted cash and cash equivalents, decreased by $320 million primarily in the construction fund and escrow accounts. Construction fund balances fluctuate due to the timing of bonds issuances and payments to the City for capital costs. Net receivable increased by $78.2 million and receivable from the City decreased by $54.8 million.
2020–2019
Current assets increased by $700 million or 24%. Restricted investments, including restricted cash and cash equivalents, increased by $469 million primarily in the construction fund. Construction fund balances fluctuate due to the timing of bonds issuances and payments to the City for capital costs. Net receivable increased by $35 million and receivable from the City increased by $94 million.
Current LiabilitiesCurrent liabilities are comprised of accounts payable, interest payable, revenue received in advance, current portion of bonds and notes payable, payable to the City of New York, and service credits on customer accounts.
2021–2020
Current liabilities increased by $77.5 million, or 8.3%, compared to fiscal year 2020. This was primarily due to an increase in the current portion of bonds and notes payable.
2020–2019
Current liabilities decreased by $443 million, or 32%, compared to fiscal year 2019. This was primarily due to a decrease of $128 million payable to the City and a decrease of $295 million in the current portion of bonds and notes payable.
Long-Term LiabilitiesLong-term liabilities are comprised of bonds and notes payable, pollution remediation obligation, interest rate swap agreement—net, revenue requirements payable to the Authority, net pension liability, net OPEB liability, and other long-term liabilities.
2021–2020
Long-term liabilities increased by $408 million, or 1.2%, primarily due to the issuance of new debt to fund capital projects.
2020–2019
Long-term liabilities increased by $1.8 billion, or 5.6%, primarily due to the issuance of new debt to fund capital projects offset by the defeasance of debt using current revenues.
Capital AssetsThe System’s capital assets include buildings, machinery and equipment, vehicles, water supply and wastewater treatment systems, and water distribution and sewage collection systems, as well as utility construction.
The Authority issues debt to pay for the capital improvements to the System and related costs. Costs related to the System’s filtration avoidance determination, including land acquisition in the upstate watershed area and certain costs associated with pollution remediation, are financed with debt but are not recorded as the System’s assets on the combining statements of net position (deficit). The cumulative amount of expenses not capitalized as assets as of June 30, 2021 was $1.72 billion. These costs or distributions are expensed in the System’s combining statements of revenues, expenses, and changes in net position (deficit) in the years incurred. The land purchased is granted to the City and becomes the City’s capital asset because it is not subject to the method of capitalization under which the System reports its capital assets.

Management’s Discussion and Analysis (Unaudited) June 30, 2021 and 2020
New York City Water & Sewer System 2021 29
Capital assets as of June 30 are detailed as follows (in thousands):
Variance
2021 2020 2019 2021 vs 2020 2020 vs 2019
NONDEPRECIABLE ASSETS:
Utility construction in progress $ 5,769,893 $ 5,242,563 $ 4,717,989 $ 527,330 $ 524,574
DEPRECIABLE ASSETS:
Utility plant in service:
Buildings 35,821 35,821 35,821 — —
Machinery and equipment 5,338,988 5,216,995 4,893,559 121,993 323,436
Vehicles 277,890 274,757 263,639 3,133 11,118 Water supply and distribution and wastewater
treatment and sewage collection systems 38,752,739 37,674,403 36,749,341 1,078,337 925,062
Total utility plant in service 44,405,438 43,201,976 41,942,360 1,203,462 1,259,616
LESS ACCUMULATED DEPRECIATION FOR:
Buildings 30,618 30,335 29,602 283 733
Machinery and equipment 2,890,886 2,636,524 2,369,280 254,362 267,244
Vehicles 135,200 124,056 112,509 11,144 11,548 Water supply and distribution and wastewater
treatment and sewage collection systems 14,592,642 13,894,152 13,173,905 698,490 720,247
Total accumulated depreciation 17,649,346 16,685,067 15,685,296 964,279 999,771
TOTAL UTILITY PLANT IN SERVICE—NET 26,756,092 26,516,909 26,257,064 239,183 259,844
TOTAL CAPITAL ASSETS—NET $ 32,525,985 $ 31,759,472 $ 30,975,053 $ 766,513 $ 784,419
2021–2020
Total gross additions to non-depreciable assets utility construction in progress were $1.74 billion and a total of $1.21 billion of completed projects were moved from construction in progress into depreciable assets utility plant in service. This resulted in a $527 million increase in construction in progress, representing a 10% net increase compared to fiscal year 2020. The System completed installation of four shafts for the Third Water Tunnel of $125 million, upgrade and improvement of sewer pumps and infrastructure at various plants and pumping station of $114 million, a combined sewer installation in the South Bronx of $81 million, and facility reconstruction of $19 million. Total capital assets, net of depreciation, increased by $767 million, a 2.4% increase from fiscal year 2020 (see Note 3).
2020–2019
Total gross additions to non-depreciable assets utility construction in progress were $1.8 billion and a total of $1.3 billion of completed projects were moved from construction in progress into depreciable assets utility plant in service. This resulted in a $525 million increase in construction in progress, representing a 11% net increase compared to fiscal year 2019. Total capital assets, net of depreciation, increased by $784 million, a 2.5% increase from fiscal year 2019 (see Note 3).

Management’s Discussion and Analysis (Unaudited) June 30, 2021 and 2020
New York City Water & Sewer System 2021 30
Deferred Outflows of ResourcesDeferred outflows of resources are comprised of accumulated decrease in fair value of hedging derivative, deferred changes in net pension liability, unamortized asset retirement obligation, and deferred changes in OPEB liability.
2021–2020
Deferred outflows from hedging decreased by $34.3 million, or 22.1%, compared to fiscal year 2020 due to an increase in the fair value of the hedging derivative instrument.
2020–2019
Deferred outflows from hedging increased by $48 million, or 45%, compared to fiscal year 2019 due to a decline in the fair value of the hedging derivative instrument.
Debt AdministrationThe debt program of the Authority includes commercial paper notes and long-term debt issued to the public, as well as bond anticipation notes (“BANs”) and interest-subsidized bonds issued to the New York State EFC. Commercial paper notes and BANs are interim financing instruments. In fiscal years 2021 and 2020, the Authority did not issue any commercial paper notes, relying instead on bond and BANs proceeds to reimburse the City for payments made for water and sewer capital projects. The Authority periodically issues long-term debt to retire outstanding BANs and commercial paper notes. The Authority also issues refunding bonds to refinance higher coupon debt and uses current revenues to defease debt.
As of June 30, 2021, the total outstanding debt of the System was $31.0 billion, which comprised of adjustable rate and fixed-rate long-term bonds. The following table summarizes debt program activities for the fiscal year ending June 30, 2021 (in thousands) (see Note 9):
OUTSTANDING PRINCIPAL
BALANCE AT JUNE 30, 2020 ISSUED
PRINCIPAL RETIRED
PRINCIPAL DEFEASED
OUTSTANDING PRINCIPAL
BALANCE AT JUNE 30, 2021
First Resolution Bonds $ 1,314,871 $ — $ — $ (425,000) $ 889,871
Second Resolution Bonds 29,574,002 2,974,540 (214,664) (2,331,980) 30,001,898
Second Resolution BANs — 155,029 — — 155,029
Total Bonds Payable $ 30,888,873 $ 3,129,569 $ (214,664) $ (2,756,980) $ 31,046,798
In fiscal year 2021, the Authority issued $2.64 billion of water and sewer system revenue bonds to the public, including $1.66 billion of refunding bonds and $981 million of new money bonds. Additionally, the Authority issued $337 million of refunding water and sewer system revenue bonds to EFC. The Authority also drew down $155 million of proceeds from BANs issued to EFC. The Authority used new money bond proceeds to finance capital improvements to the System and to pay for bond issuance costs.
During fiscal year 2021, the Authority issued $1.99 billion of bonds to refund $2.38 billion of outstanding bonds. These refundings resulted in an accounting gain of $11.3 million. This amount is deferred and amortized over the shorter of the remaining life of the old debt or the life of the new debt. The Authority reduced its aggregate debt service for principal and interest by $642 million and obtained an economic benefit (present value savings) of $554 million.
During fiscal year 2021, the Authority legally defeased $381 million of outstanding bonds using current resources. This resulted in an accounting gain of $11.6 million and a gross debt service savings of $409 million.

Management’s Discussion and Analysis (Unaudited) June 30, 2021 and 2020
New York City Water & Sewer System 2021 31
The following table summarize debt program activities for the fiscal year ending June 30, 2020 (in thousands):
In fiscal year 2020, the Authority issued $3.2 billion of water and sewer system revenue bonds to the public, including $1.5 billion of refunding bonds and $1.7 billion of new money bonds. Additionally, the Authority issued $425 million of new money and $352 million of refunding water and sewer system revenue bonds to EFC. The Authority used new money bond proceeds to finance capital improvements to the System to provide long-term financing of BANs that previously financed capital improvements to the System, and to pay for bond issuance costs.
During fiscal year 2020, the Authority issued $1.9 billion of bonds to refund $2.3 billion of outstanding bonds. These refundings resulted in an accounting gain of $31.7 million. The Authority reduced its aggregate debt service for principal and interest by $693 million and obtained an economic benefit (present value savings) of $544 million.
During fiscal year 2020, the Authority legally defeased $350 million of outstanding bonds using current resources. This resulted in an accounting gain of $11 million and a gross debt service savings of $352 million.
During fiscal year 2020, $30 million of Fiscal 2012 Series 1 Bond anticipation note principal was forgiven by EFC in accordance with the terms of the note.
Economic OutlookThe outbreak of COVID-19 has been declared a pandemic by the World Health Organization. The Governor of the State of New York declared a state of emergency in the state on March 7, 2020 and the Mayor of the City of New York declared a state of emergency in the city on March 12, 2020, each of which is still in effect. The City of New York (the “City”) was an epicenter of the outbreak at its onset. The outbreak of COVID-19 has altered the behavior of businesses and people in a manner that has had, and is expected to continue to have, negative effects on the City and its economy. Drinking water quality, water supply and wastewater treatment have not been affected by the outbreak of the virus; however, the impact of the virus is projected to negatively affect revenues of the System. In addition, after not requesting base rental payments from the System in fiscal years 2017, 2018 and 2019, as a result of the outbreak of COVID-19, the City requested base rental payments of $128 million and $137 million in fiscal years 2020 and 2021, respectively, as permitted under its lease with the Water Board (the “Lease”). No assurance can be provided that the COVID-19 pandemic and resulting economic disruption will not negatively impact the System’s combining financial position in the future, including, but not limited to, the City’s decision to request additional base rental payments up to the maximum amounts set forth in the Lease.
Request for InformationThis financial report is provided as an overview of the System’s finances. Questions concerning any of the information in this report or requests for additional information should be directed to Investor Relations, New York City Municipal Water Finance Authority, 255 Greenwich Street, New York, New York 10007 or to [email protected].
OUTSTANDING PRINCIPAL
BALANCE AT JUNE 30, 2019 ISSUED
PRINCIPAL RETIRED
PRINCIPAL DEFEASED
OUTSTANDING PRINCIPAL
BALANCE AT JUNE 30, 2020
First Resolution Bonds $ 1,580,766 $ — $ (81,550) $ (184,345) $ 1,314,871
Second Resolution Bonds 28,437,542 3,959,301 (400,836) (2,422,005) 29,574,002
Second Resolution BANs 27,598 467,219 — (494,816) —
Total Bonds Payable $ 30,045,906 $ 4,426,520 $ (482,386) $ (3,101,166) $ 30,888,873
* * * * * *
New York City Water & Sewer System 2021 32
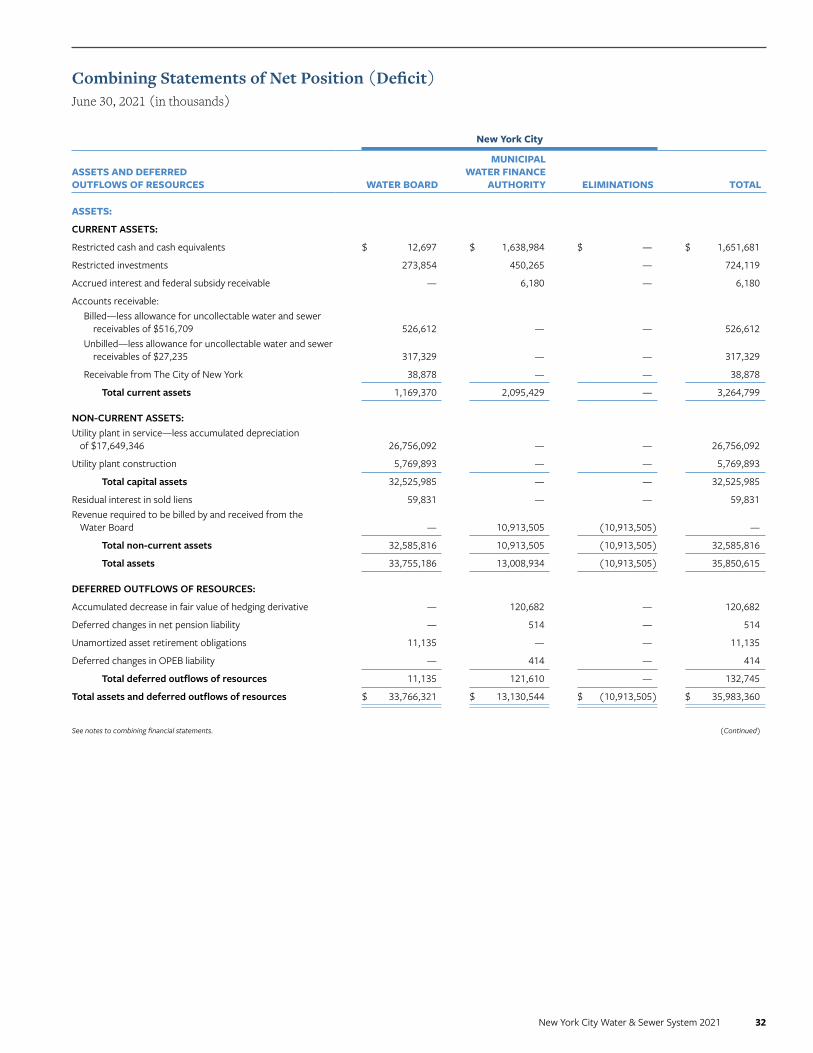
New York City
ASSETS AND DEFERRED OUTFLOWS OF RESOURCES WATER BOARD
MUNICIPAL WATER FINANCE
AUTHORITY ELIMINATIONS TOTAL
ASSETS:
CURRENT ASSETS:
Restricted cash and cash equivalents $ 12,697 $ 1,638,984 $ — $ 1,651,681
Restricted investments 273,854 450,265 — 724,119
Accrued interest and federal subsidy receivable — 6,180 — 6,180
Accounts receivable:Billed—less allowance for uncollectable water and sewer
receivables of $516,709 526,612 — — 526,612 Unbilled—less allowance for uncollectable water and sewer
receivables of $27,235 317,329 — — 317,329
Receivable from The City of New York 38,878 — — 38,878
Total current assets 1,169,370 2,095,429 — 3,264,799
NON-CURRENT ASSETS:Utility plant in service—less accumulated depreciation
of $17,649,346 26,756,092 — — 26,756,092
Utility plant construction 5,769,893 — — 5,769,893
Total capital assets 32,525,985 — — 32,525,985
Residual interest in sold liens 59,831 — — 59,831 Revenue required to be billed by and received from the
Water Board — 10,913,505 (10,913,505) —
Total non-current assets 32,585,816 10,913,505 (10,913,505) 32,585,816
Total assets 33,755,186 13,008,934 (10,913,505) 35,850,615
DEFERRED OUTFLOWS OF RESOURCES:
Accumulated decrease in fair value of hedging derivative — 120,682 — 120,682
Deferred changes in net pension liability — 514 — 514
Unamortized asset retirement obligations 11,135 — — 11,135
Deferred changes in OPEB liability — 414 — 414
Total deferred outflows of resources 11,135 121,610 — 132,745
Total assets and deferred outflows of resources $ 33,766,321 $ 13,130,544 $ (10,913,505) $ 35,983,360
Combining Statements of Net Position (Deficit)June 30, 2021 (in thousands)
See notes to combining financial statements. (Continued)

New York City Water & Sewer System 2021 33
New York City
LIABILITIES, DEFERRED INFLOWS OF RESOURCES AND NET POSITION (DEFICIT) WATER BOARD
MUNICIPAL WATER FINANCE
AUTHORITY ELIMINATIONS TOTAL
LIABILITIES:
CURRENT LIABILITIES:
Accounts payable $ 8,305 $ 7,789 $ — $ 16,094
Interest payable — 51,079 — 51,079
Revenue received in advance 8,336 — — 8,336
Current portion of bonds and notes payable — 297,665 — 297,665
Payable to the City of New York — 565,434 — 565,434
Service credits on customer accounts 67,976 — — 67,976
Total current liabilities 84,617 921,967 — 1,006,584
LONG-TERM LIABILITIES:
Bonds and notes payable — 33,300,223 — 33,300,223
Pollution remediation obligation 45,432 — — 45,432
Interest rate swap agreement—net — 120,682 — 120,682
Revenue requirements payable to the Authority 10,913,505 — (10,913,505) —
Net pension liability — 342 — 342
Net OPEB liability — 1,928 — 1,928
Other long-term liability 17,751 4,306 — 22,057
Total long-term liabilities 10,976,688 33,427,481 (10,913,505) 33,490,664
Total liabilities 11,061,305 34,349,448 (10,913,505) 34,497,248
DEFERRED INFLOWS OF RESOURCES:
Unamortized deferred bond refunding costs — 42,305 — 42,305
Deferred changes in net pension liability — 662 — 662
Deferred changes in OPEB liability — 590 — 590
Total deferred inflows of resources — 43,557 — 43,557
NET POSITION (DEFICIT):
Net investment in capital assets 32,525,985 (31,927,010) — 598,975
Restricted for debt service — 1,533,139 — 1,533,139
Restricted for operations and maintenance 278,207 — — 278,207
Unrestricted (deficit) (10,099,176) 9,131,410 — (967,766)
Total net position (deficit) 22,705,016 (21,262,461) — 1,442,555 Total liabilities, deferred inflows of resources and net position (deficit) $ 33,766,321 $ 13,130,544 $ (10,913,505) $ 35,983,360
Combining Statements of Net Position (Deficit)June 30, 2021 (in thousands)
See notes to combining financial statements. (Concluded)

New York City Water & Sewer System 2021 34
New York City
ASSETS AND DEFERRED OUTFLOWS OF RESOURCES WATER BOARD
MUNICIPAL WATER FINANCE
AUTHORITY ELIMINATIONS TOTAL
ASSETS:
CURRENT ASSETS:
Restricted cash and cash equivalents $ 13,094 $ 1,778,177 $ — $ 1,791,272
Restricted investments 264,152 640,096 — 904,248
Accrued interest and subsidy receivable 3 36,114 — 36,116
Accounts receivable:Billed—less allowance for uncollectable water and sewer
receivables of $435,199 457,646 — — 457,646Unbilled—less allowance for uncollectable water and
sewer receivables of $27,355 308,140 — — 308,140
Receivable from The City of New York 93,685 — — 93,685
Total current assets 1,136,720 2,454,387 — 3,591,107
NON-CURRENT ASSETS:Utility plant in service—less accumulated
depreciation of $16,685,067 26,516,909 — — 26,516,909
Utility plant construction 5,242,563 — — 5,242,563
Total capital assets 31,759,472 — — 31,759,472
Residual interest in sold liens 64,484 — — 64,484 Revenue required to be billed by and received
from the Water Board — 10,997,726 (10,997,726) —
Total non-current assets 31,823,956 10,997,726 (10,997,726) 31,823,956
Total assets 32,960,676 13,452,113 (10,997,726) 35,415,063
DEFERRED OUTFLOWS of RESOURCES:
Accumulated decrease in fair value of hedging derivative — 154,950 — 154,950
Deferred changes in net pension liability — (263) — (263)
Unamortized asset retirement obligations 12,452 — — 12,452
Deferred changes in OPEB liability — 489 — 489
Total deferred outflows of resources 12,452 155,176 — 167,628
Total assets and deferred outflows of resources $ 32,973,128 $ 13,607,289 $ (10,997,726) $ 35,582,691
Combining Statements of Net Position (Deficit)June 30, 2020 (in thousands)
See notes to combining financial statements. (Continued)

New York City Water & Sewer System 2021 35
New York City
LIABILITIES, DEFERRED INFLOWS OF RESOURCES AND NET POSITION (DEFICIT) WATER BOARD
MUNICIPAL WATER FINANCE
AUTHORITY ELIMINATIONS TOTAL
LIABILITIES:
CURRENT LIABILITIES:
Accounts payable $ 4,068 $ 7,580 $ — $ 11,648
Interest payable — 51,495 — 51,495
Revenue received in advance 10,477 — — 10,477
Current portion of bonds and notes payable — 214,664 — 214,664
Payable to the City of New York — 567,644 — 567,644
Service credits on customer accounts 73,171 — — 73,171
Total current liabilities 87,716 841,383 — 929,099
LONG-TERM LIABILITIES:
Bonds and notes payable — 32,875,741 — 32,875,741
Pollution remediation obligation 29,068 — — 29,068
Interest rate swap agreement—net — 154,950 — 154,950
Revenue requirements payable to the Authority 10,997,726 — (10,997,726) —
Net pension liability — 422 — 422
Net OPEB liability — 1,929 — 1,929
Other long-term liability 17,760 2,570 — 20,330
Total long-term liabilities 11,044,554 33,035,612 (10,997,726) 33,082,440
Total liabilities 11,132,270 33,876,995 (10,997,726) 34,011,539
DEFERRED INFLOWS OF RESOURCES:
Unamortized deferred bond refunding costs — 38,419 — 38,419
Deferred changes in net pension liability — 8 — 8
Deferred changes in OPEB liability — 549 — 549
Total deferred inflows of resources — 38,976 — 38,976
NET POSITION (DEFICIT):
Net investment in capital assets 31,759,472 (31,278,343) — 481,129
Restricted for debt service — 1,638,121 — 1,638,121
Restricted for operations and maintenance 264,178 — — 264,178
Unrestricted (deficit) (10,182,792) 9,331,540 — (851,252)
Total net position (deficit) 21,840,858 (20,308,682) — 1,532,176 Total liabilities, deferred inflows of resources and net position (deficit) $ 32,973,128 $ 13,607,289 $ (10,997,726) $ 35,582,691
Combining Statements of Net Position (Deficit)June 30, 2020 (in thousands)
See notes to combining financial statements. (Concluded)
New York City Water & Sewer System 2021 36
New York City
WATER BOARDMUNICIPAL WATER
FINANCE AUTHORITY TOTAL
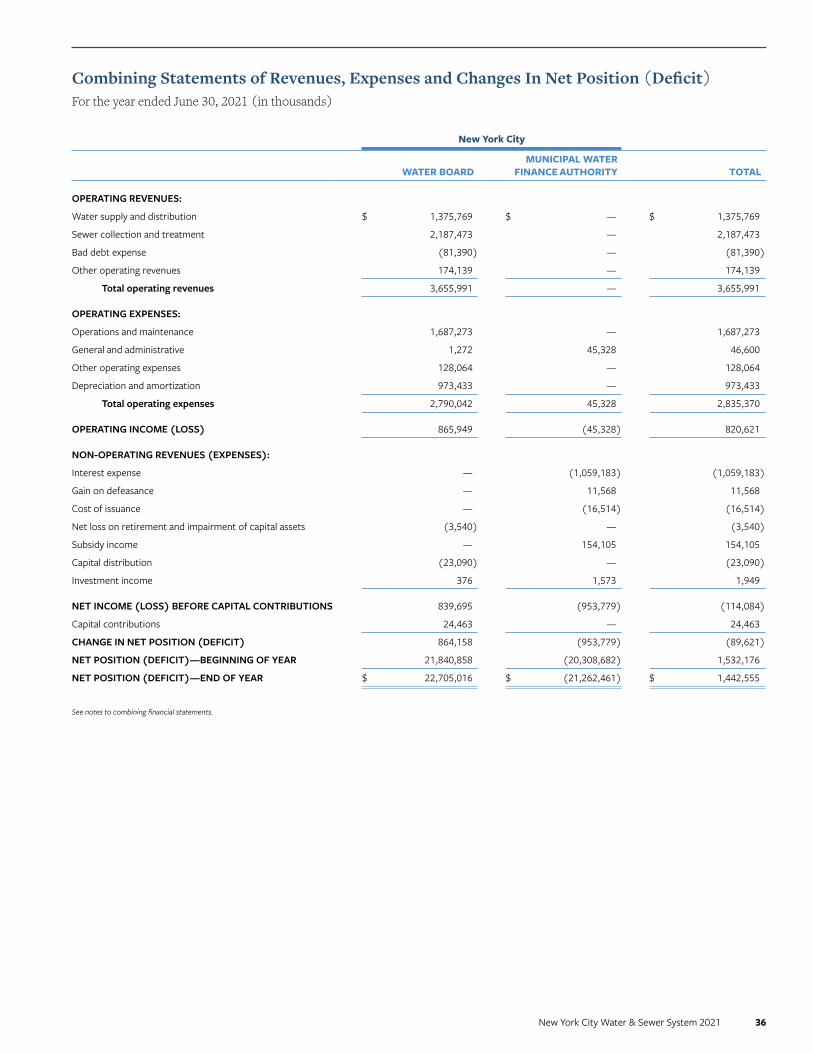
OPERATING REVENUES:
Water supply and distribution $ 1,375,769 $ — $ 1,375,769
Sewer collection and treatment 2,187,473 — 2,187,473
Bad debt expense (81,390) — (81,390)
Other operating revenues 174,139 — 174,139
Total operating revenues 3,655,991 — 3,655,991
OPERATING EXPENSES:
Operations and maintenance 1,687,273 — 1,687,273
General and administrative 1,272 45,328 46,600
Other operating expenses 128,064 — 128,064
Depreciation and amortization 973,433 — 973,433
Total operating expenses 2,790,042 45,328 2,835,370
OPERATING INCOME (LOSS) 865,949 (45,328) 820,621
NON-OPERATING REVENUES (EXPENSES):
Interest expense — (1,059,183) (1,059,183)
Gain on defeasance — 11,568 11,568
Cost of issuance — (16,514) (16,514)
Net loss on retirement and impairment of capital assets (3,540) — (3,540)
Subsidy income — 154,105 154,105
Capital distribution (23,090) — (23,090)
Investment income 376 1,573 1,949
NET INCOME (LOSS) BEFORE CAPITAL CONTRIBUTIONS 839,695 (953,779) (114,084)
Capital contributions 24,463 — 24,463
CHANGE IN NET POSITION (DEFICIT) 864,158 (953,779) (89,621)
NET POSITION (DEFICIT)—BEGINNING OF YEAR 21,840,858 (20,308,682) 1,532,176
NET POSITION (DEFICIT)—END OF YEAR $ 22,705,016 $ (21,262,461) $ 1,442,555
Combining Statements of Revenues, Expenses and Changes In Net Position (Deficit)For the year ended June 30, 2021 (in thousands)
See notes to combining financial statements.
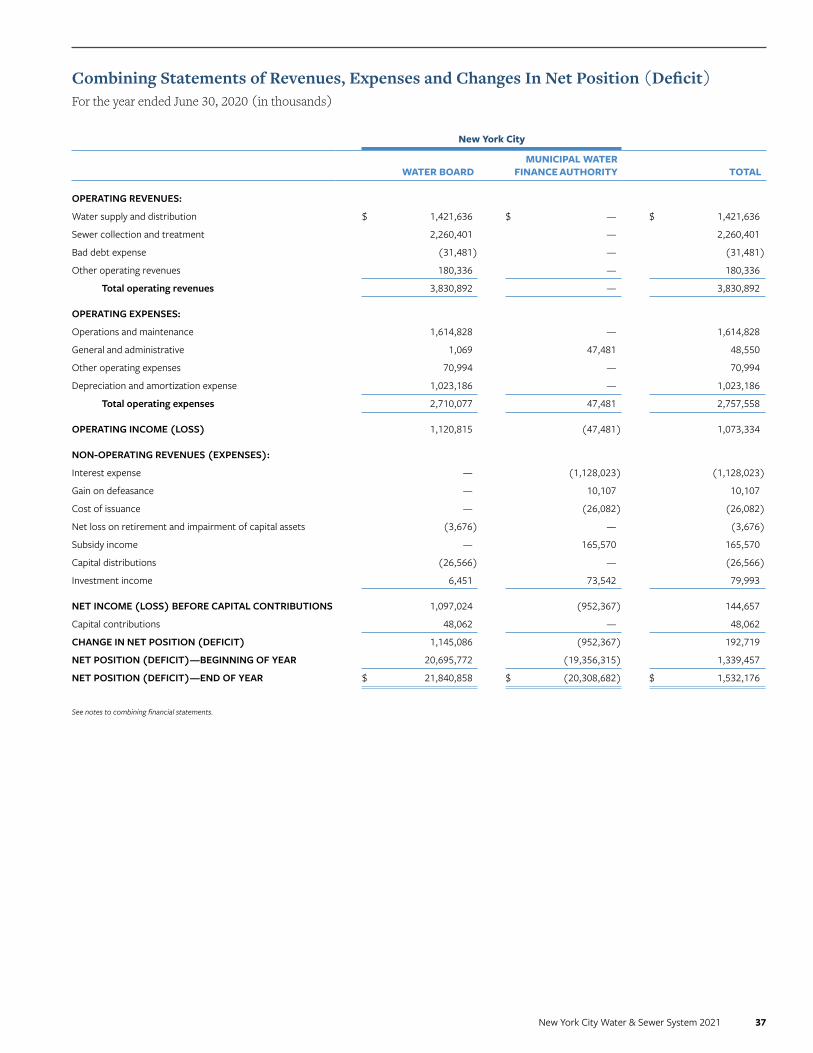
New York City Water & Sewer System 2021 37
New York City
WATER BOARDMUNICIPAL WATER
FINANCE AUTHORITY TOTAL
OPERATING REVENUES:
Water supply and distribution $ 1,421,636 $ — $ 1,421,636
Sewer collection and treatment 2,260,401 — 2,260,401
Bad debt expense (31,481) — (31,481)
Other operating revenues 180,336 — 180,336
Total operating revenues 3,830,892 — 3,830,892
OPERATING EXPENSES:
Operations and maintenance 1,614,828 — 1,614,828
General and administrative 1,069 47,481 48,550
Other operating expenses 70,994 — 70,994
Depreciation and amortization expense 1,023,186 — 1,023,186
Total operating expenses 2,710,077 47,481 2,757,558
OPERATING INCOME (LOSS) 1,120,815 (47,481) 1,073,334
NON-OPERATING REVENUES (EXPENSES):
Interest expense — (1,128,023) (1,128,023)
Gain on defeasance — 10,107 10,107
Cost of issuance — (26,082) (26,082)
Net loss on retirement and impairment of capital assets (3,676) — (3,676)
Subsidy income — 165,570 165,570
Capital distributions (26,566) — (26,566)
Investment income 6,451 73,542 79,993
NET INCOME (LOSS) BEFORE CAPITAL CONTRIBUTIONS 1,097,024 (952,367) 144,657
Capital contributions 48,062 — 48,062
CHANGE IN NET POSITION (DEFICIT) 1,145,086 (952,367) 192,719
NET POSITION (DEFICIT)—BEGINNING OF YEAR 20,695,772 (19,356,315) 1,339,457
NET POSITION (DEFICIT)—END OF YEAR $ 21,840,858 $ (20,308,682) $ 1,532,176
Combining Statements of Revenues, Expenses and Changes In Net Position (Deficit) For the year ended June 30, 2020 (in thousands)
See notes to combining financial statements.

New York City Water & Sewer System 2021 38
New York City
WATER BOARDMUNICIPAL WATER
FINANCE AUTHORITY TOTAL
CASH FLOWS FROM OPERATING ACTIVITIES:
Receipts from customers $ 3,575,152 $ — $ 3,575,152
Payments for operations and maintenance (1,674,516) — (1,674,516)
Payments for administration (1,035) (45,855) (46,890)Net cash provided by (used in)
operating activities 1,899,601 (45,855) 1,853,746
CASH FLOWS FROM CAPITAL AND RELATED FINANCING ACTIVITIES:
Proceeds from issuing bonds, notes and other borrowings—net of issuance costs — 3,704,071 3,704,071
Receipts from contribution made by other organization 503 — 503
Acquisition and construction of capital assets — (1,809,168) (1,809,168)
Payments by the Water Board to the Authority (1,891,178) 1,891,178 —
Repayments of bonds, notes and other borrowings — (3,011,606) (3,011,606)
Interest paid on bonds, notes and other borrowings — (1,062,136) (1,062,136)Net cash used in capital and related
financing activities (1,890,675) (287,661) (2,178,336)
CASH FLOWS FROM INVESTING ACTIVITIES:
Sales and maturities of investments 342,878 209,213 552,091
Purchases of investments (353,617) (35,013) (388,630)
Interest on investments 1,416 20,123 21,539
Net cash (used in) provided by investing activities (9,323) 194,323 185,000
NET DECREASE IN CASH AND CASH EQUIVALENTS (397) (139,193) (139,590)
CASH AND CASH EQUIVALENTS—BEGINNING OF YEAR 13,094 1,778,177 1,791,271
CASH AND CASH EQUIVALENTS—END OF YEAR $ 12,697 $ 1,638,984 $ 1,651,681
Combining Statements of Cash FlowsFor the year ended June 30, 2021 (in thousands)
See notes to combining financial statements. (Continued)

New York City Water & Sewer System 2021 39
New York City
WATER BOARDMUNICIPAL WATER
FINANCE AUTHORITY TOTAL
RECONCILIATION OF OPERATING INCOME (LOSS) TO NET CASH PROVIDED BY (USED IN) OPERATING ACTIVITIES:
Operating income (loss) $ 865,949 $ (45,328) $ 820,621 Adjustments to reconcile operating income (loss) to
net cash provided by (used in) operating activities:
Amortization 1,308 — 1,308
Depreciation 972,125 — 972,125
Other operating expenses paid for with bond proceeds 60,484 — 60,484
Pollution remediation expense 5,166 — 5,166
Changes in assets and liabilities:
Pollution remediation liability 16,364 — 16,364
Receivables—net (78,156) — (78,156)
Receivable from the City 54,807 — 54,807
Residual interest in sold liens 4,653 — 4,653
Accounts payable 4,237 (527) 3,710
Revenues received in advance (2,141) — (2,141)
Refunds payable (5,195) — (5,195)
NET CASH PROVIDED BY (USED IN) OPERATING ACTIVITIES $ 1,899,601 $ (45,855) $ 1,853,746
The following are the noncash capital and related financing activities (in thousands):
— Interest expense includes the amortization of net (premium) and discount in the amount of $179,318 at June 30, 2021.
— Capital expenditures in the amount of $565,434 had been incurred but not paid at June 30, 2021.
— The Water Board received federal, state, and other capital contributions of $23,961 in fiscal year 2021.
Combining Statements of Cash FlowsFor the year ended June 30, 2021 (in thousands)
See notes to combining financial statements. (Concluded)

New York City Water & Sewer System 2021 40
New York City
WATER BOARDMUNICIPAL WATER
FINANCE AUTHORITY TOTAL
CASH FLOWS FROM OPERATING ACTIVITIES:
Receipts from customers $ 3,799,880 $ — $ 3,799,880
Payments for operations and maintenance (1,777,701) — (1,777,701)
Payments for administration (1,160) (47,581) (48,741)
Net cash provided by (used in) operating activities 2,021,019 (47,581) 1,973,438
CASH FLOWS FROM CAPITAL AND RELATED FINANCING ACTIVITIES:
Proceeds from issuing bonds, notes and other borrowings—net of issuance costs — 5,180,518 5,180,518
Receipts from contribution made by other organization 82 — 82
Acquisition and construction of capital assets — (1,978,169) (1,978,169)
Payments by the Water Board to the Authority (2,022,671) 2,022,671 —
Repayments of bonds, notes and other borrowings — (3,575,196) (3,575,196)
Interest paid on bonds, notes and other borrowings — (1,140,609) (1,140,609)Net cash (used in) provided by capital and related
financing activities (2,022,589) 509,215 (1,513,374)
CASH FLOWS FROM INVESTING ACTIVITIES:
Sales and maturities of investments 432,716 60,033 492,749
Purchases of investments (442,654) (109,564) (522,218)
Interest on investments 8,938 59,697 68,635 Net cash (used by) provided by
investing activities (1,000) 10,166 9,166 NET (DECREASE) INCREASE IN CASH AND
CASH EQUIVALENTS (2,570) 471,800 469,230
CASH AND CASH EQUIVALENTS—Beginning of year 15,664 1,306,377 1,322,041
CASH AND CASH EQUIVALENTS—End of year $ 13,094 $ 1,778,177 $ 1,791,271
Combining Statements of Cash FlowsFor the year ended June 30, 2020 (in thousands)
See notes to combining financial statements. (Continued)

New York City Water & Sewer System 2021 41
New York City
WATER BOARDMUNICIPAL WATER
FINANCE AUTHORITY TOTAL
RECONCILIATION OF OPERATING INCOME (LOSS) TO NET CASH PROVIDED BY (USED IN) OPERATING ACTIVITIES:
Operating income (loss) $ 1,120,815 $ (47,481) $ 1,073,334 Adjustments to reconcile operating income (loss) to
net cash (used in) provided by operating activities:
Amortization 1,329 — 1,329
Depreciation 1,021,856 — 1,021,856
Other operating expenses paid for with bond proceeds 25,935 — 25,935
Pollution remediation expense 5,998 — 5,998
Changes in assets and liabilities:
Pollution remediation liability (3,954) — (3,954)
Receivables—net (34,948) — (34,948)
Receivable from the City (113,590) — (113,590)
Residual interest in sold liens (2,662) — (2,662)
Accounts payable (6,690) (100) (6,790)
Revenues received in advance (4,907) — (4,907)
Refunds payable 11,839 — 11,839
NET CASH PROVIDED BY (USED IN) OPERATING ACTIVITIES $ 2,021,020 $ (47,581) $ 1,973,439
The following are the noncash capital and related financing activities (in thousands):
— Interest expense includes the amortization of net (premium) and discount in the amount of $141,590 at June 30, 2020.
— Capital expenditures in the amount of $567,644 had been incurred but not paid at June 30, 2020.
— The Water Board received federal, state, and other capital contributions of $47,981 in fiscal year 2020.
Combining Statements of Cash FlowsFor the year ended June 30, 2020 (in thousands)
See notes to combining financial statements. (Concluded)

New York City Water & Sewer System 2021 42
1. OrganizationThe New York City Water and Sewer System (the “System”) provides water supply, treatment and distribution, and sewage collection, treatment, and disposal for the citizenry of the City of New York (the “City”). The System, as presented in the accompanying combining financial statements, began operations on July 1, 1985, and is a joint operation consisting of two legally separate and independent entities: the New York City Municipal Water Finance Authority (the “Authority”) and the New York City Water Board (the “Water Board”). The Authority is a public benefit corporation created in accordance with the New York City Municipal Water Finance Act (the “Act”), duly enacted into law as Chapter 513 of the laws of 1984 of the State of New York (the “State”), as amended by Chapter 514 of the laws of 1984 of the State of New York. The Water Board was created by Chapter 515 of the laws of 1984 of the State of New York. The Act also empowers the Authority to issue debt to finance the cost of capital improvements to the System and to refund any and all outstanding bonds and general obligation bonds that the City issued for water and sewer purposes. The Act empowers the Water Board to lease the System from the City and to set and collect water rates, fees, rents and other charges for use of, or for services furnished, rendered, or made available by, the System to generate enough revenue to pay debt service on the Authority’s debt and to place the System on a self-sustaining basis.
The Financing Agreement by and among the City of New York, the New York City Municipal Water Finance Authority and the New York City Water Board dated as of July 1, 1985 (the “Agreement”) provides that the Authority will issue bonds to finance the cost of capital investment and related costs of the System. It also sets forth the funding priority for debt service costs of the Authority, operating costs of the System, and the rental payment to the City.
The physical operation and capital improvements of the System are performed by the City’s Department of Environmental Protection (“DEP”) subject to contractual agreements with the Authority and the Water Board.
In accordance with Governmental Accounting Standards Board (“GASB”) standards, the Water Board and the Authority are considered to be part of the same reporting entity (the “System”) since they are fiscally interdependent. Accordingly, the accompanying combining financial statements for the System present the individual financial statements of the Water Board and the Authority as major funds. In addition, the accompanying combining financial statements present a total column, which represents the entity-wide financial statements of the System. Transactions and balances between the Water Board and the Authority are eliminated in the entity-wide combining financial statements.
2. Summary of Significant Accounting PoliciesThe accompanying financial statements of the System have been prepared using the economic resources measurement focus and the accrual basis of accounting. Revenues are recognized when earned and expenses are recognized when incurred. Other significant accounting policies are:
COMPONENT UNIT
The System is a component unit of the City. The System leases the water and sewer-related capital assets from the City, which is responsible for the operations, maintenance and capital improvement of the System. The System reimburses the City for costs incurred for operations and maintenance and issues debt to pay for capital improvements.
INVESTMENTS AND CASH EQUIVALENTS
Investments and cash equivalents primarily consist of securities of the United States and its agencies, guaranteed investment contracts, forward purchase agreements, and the State of New York obligations. All investments are carried at fair value with the exception of money market funds that are carried at cost plus accrued interest. For purposes of the combining statements of cash flows and combining statements of net position (deficit), the System generally considers all highly liquid debt instruments purchased with an original maturity of three months or less to be cash equivalents.
Notes To Combining Financial StatementsAs of and for the years ended June 30, 2021 and 2020

Notes To Combining Financial Statements as of and for the years ended June 30, 2021 and 2020
New York City Water & Sewer System 2021 43
2. Summary of Significant Accounting Policies (Continued)
RESTRICTED ASSETS
Proceeds from the issuance of debt and monies set aside for debt service and operation and maintenance of the System are classified as restricted cash and cash equivalents and restricted investments in the combining statements of net position (deficit). These restrictions are based on the requirements of the applicable bond resolutions.
LIEN SALES AND RESIDUAL INTEREST IN SOLD LIENS
The City periodically sells tax liens secured by water and sewer rents and surcharges, for which the Water Board receives the applicable sale proceeds. At the time of sale, the Water Board recognizes the proceeds as operating revenue and removes the related receivables. The Water Board maintains a residual interest in the liens, which represents the amount estimated to be received by the Water Board if and when liens held by the purchasing trusts generate cash flows above the amounts needed by the trusts to pay their operating costs, bondholders, and satisfy reserve requirements.
BOND PREMIUM AND DISCOUNT AND BOND ISSUANCE COST
Bond premiums and discounts are capitalized and amortized over the life of the related bond issue, using the effective yield method. Bond premiums and discounts are presented as additions or reductions to the face amount of the long-term bonds payable on the combining statements of net position (deficit). The amortized bond premiums and discounts are an off-set to interest expense on the combining statements of revenues, expenses and changes in net position (deficit). Bond issuance costs are recognized and expensed in the period incurred, except for bond insurance premiums that are amortized over the life of the related bonds.
UTILITY PLANT
Utility plant acquired through purchase or internal construction is recorded at cost, net of retirements. It is the Water Board’s policy to capitalize assets with a cost of $50,000 or more and a useful life of three years or longer. Contributed utility plant is recorded at its estimated historical cost based on appraisals or other methods when historical cost information is not available, net of accumulated depreciation. Depreciation is computed using the straight-line method based upon estimated useful lives, as follows:
ASSETS: YEARS
Buildings 40–50
Water supply and wastewater treatment systems 15–50
Water distribution and sewage collection systems 15–75
Machinery and equipment 3–35
Vehicles 10
Maintenance and repairs of property are recorded as maintenance expense. Replacements and betterments are recorded as additions to utility plant. The System pays for certain improvements of assets that are not owned by the City or the System, as well as certain pollution remediation activities, through bond proceeds. These costs are shown as other operating expenses in the System’s combining statements of revenues, expenses and changes in net position (deficit).
CONTRIBUTED CAPITAL
The System received federal, state and other capital contributions of $24.5 million and $48 million in fiscal years 2021 and 2020, respectively. These amounts are reported in the System’s combining statements of revenues, expenses and changes in net position (deficit) below net income (loss) before capital contributions. In addition, the System received $503 thousand and $82 thousand in fiscal years 2021 and 2020, respectively, from Westchester County (the “County”) to compensate the System for constructing a water conduit that provides treated water to the County. The County payments are reported as capital contributions in the System’s combining statements of revenues, expenses and changes in net position (deficit) below net income (loss) before capital contributions and as receipts from contribution made by other organization in the System’s combining statements of cash flows.

Notes To Combining Financial Statements as of and for the years ended June 30, 2021 and 2020
New York City Water & Sewer System 2021 44
2. Summary of Significant Accounting Policies (Continued)
OPERATING REVENUES AND OPERATING EXPENSES
Operating revenues consist of services provided to customers of the System. Revenues are reported net of allowances, discounts and refunds and are based on billing rates imposed by the Water Board and upon customers’ water and sewer usage or, in some cases, characteristics of customer properties. The System records unbilled revenue at year end based on meter readings collected as of June 30. As of June 30, 2021 and 2020, the System reported credits of $18.8 million and $20.5 million, respectively.
Operating expenses include, but are not limited to costs incurred for maintenance, repair, and operations of the System; administration costs of the Water Board and the Authority; and rental payments to the City, if requested. In fiscal years 2021 and 2020, the System made rental payments of $137 million and $128 million, respectively.
REVENUES RECEIVED IN ADVANCE
Revenues received in advance of the period to which they relate are unearned and recorded as revenue when earned. Customer account credit balances are reported as a current liability “service credits on customer accounts” and are not included in accounts receivable.
UNAMORTIZED DEFERRED BOND REFUNDING COSTS
Deferred bond refunding costs represent the accounting gains or losses incurred in bond refundings. They are reported as deferred outflows of resources or deferred inflows of resources and are amortized over the lesser of the remaining life of the old debt or the life of the new debt. The amortized deferred bond refunding cost is an off-set to interest expense on the combining statements of revenues, expenses and changes in net position (deficit).
USE OF ESTIMATES
The preparation of the combining financial statements in accordance with accounting principles generally accepted in the United States of America, requires management to make estimates and assumptions in determining the amounts of assets, deferred outflows of resources, liabilities, deferred inflows of resources, and disclosure of contingent liabilities at the date of the financial statements and the reported amounts of revenues and expenses during the reporting period. Actual results could differ from those estimates.
PENSIONS
Net pension liabilities are required to be recognized and disclosed using the accrual basis of accounting. The Authority recognizes a net pension liability for New York City Employee Retirement System Qualified Pension Plan (“NYCERS QPP” or “Pension Plan”) in which it participates, which represents the Authority’s proportional share of excess total pension liability over the Pension Plan assets, actuarially calculated, of a cost-sharing multiple-employer plan, measured as of the fiscal year end.
Changes in the net pension liability during the period are recorded as pension expense, or as deferred inflows of resources or deferred outflows of resources depending on the nature of the change, in the period incurred. Those changes in net pension liability that are recorded as deferred inflows of resources or deferred outflows of resources are amortized over the weighted-average remaining service life of all participants in the qualified Pension Plan and recorded as a component of pension expense beginning with the period in which they are incurred. The change in the Authority’s proportion of the collective net pension liability and collective deferred outflows of resources and deferred inflows of resources related to the pension since the prior measurement date is recognized in current reporting period over a closed period that is equal to the average of the expected remaining service lives of all employees provided with a pension through the Pension Plan.
For the contribution to the Pension Plan, the difference during the measurement period between the total amount of the Authority’s contribution and the amount of the Authority’s proportionate share of the total of such contributions from all employers and all nonemployee contributing entities is recognized in the Authority’s pension expense, beginning in the current reporting period, over a closed period that is equal to the average of the expected remaining service lives of all employees provided with pension through the Pension Plan. The amount not recognized in pension expense is reported as deferred outflow of resources or deferred inflow of resources related to the pension.

Notes To Combining Financial Statements as of and for the years ended June 30, 2021 and 2020
New York City Water & Sewer System 2021 45
2. Summary of Significant Accounting Policies (Continued)Projected earnings on qualified Pension Plan investments are recognized as a component (reduction) of pension expense. Differences between projected and actual investment earnings are reported as deferred inflows of resources or deferred outflows of resources and amortized as a component of pension expense on a closed basis over a five-year period beginning with the period in which the difference occurred.
Changes in total pension liability arising from changes of benefit terms are required to be included in pension expense in the period the change is first reported in the net pension liability. The changes in the total pension liability resulting from (1) differences between expected and actual experience with regard to economic and demographic factors and (2) changes of assumptions regarding the expected future behavior of economic and demographic factors or other inputs are recognized as deferred outflows of resources or deferred inflows of resources related to the pension and included in the pension expense over a period equal to the average of the expected remaining service lives of all employees that are provided with benefits through the Pension Plan.
RECENT ACCOUNTING PRONOUNCEMENTS
As a component unit of the City, the System implements new GASB standards in the same fiscal year as they are implemented by the City. The following are discussions of the standards requiring implementation in the current year and standards that may impact the System in future years.
• In June 2017, GASB issued Statement No. 87, Leases (“GASB 87”). The objective of GASB 87 is to improve accounting and financial reporting for leases by governments. This statement increases the usefulness of governments’ financial statements by requiring recognition of certain lease assets and liabilities for leases that previously were classified as operating leases and recognized as inflows of resources or outflows of resources based on the payment provisions of the contract. It establishes a single model for lease accounting based on the foundational principle that leases are a financing of the right to use an underlying asset. Under this statement, a lessee is required to recognize a lease liability and an intangible right-to-use a lease asset, and a lessor is required to recognize a lease receivable and a deferred inflows of resources, thereby enhancing the relevance and consistency of information about governments’ leasing activities. The requirements of GASB 87 are effective for fiscal years beginning after December 15, 2019 (Postponed to fiscal years beginning after June 25, 2021, see GASB 95 below). The System has not completed the process of evaluating GASB 87, but it does not expect it to have an impact on its combining financial statements.
• In January 2020, GASB issued Statement No. 92, Omnibus 2020 (“GASB 92”). GASB 92 enhances the comparability in accounting and financial reporting as well as improves the consistency of authoritative literature by addressing practice issues that have been identified during implementation and application of certain GASB Statements. The requirements for GASB 92 are effective for reporting periods beginning after June 15, 2021. The System has not completed the process of evaluating GASB 92 but it does not expect it to have an impact on the System’s combining financial statements.
• In March 2020, GASB issued Statement No. 93, Replacement of Interbank offered Rates (“GASB 93”). GASB 93 addressed accounting and financial reporting implications that result from the replacement of an interbank offered rate (“IBOR”)—most notably, the London Interbank offered Rate (“LIBOR”) resulting from global reference rate reform. LIBOR is expected to cease to exist in its current form at the end of 2021, prompting governments to amend or replace financial instruments for the purpose of replacing LIBOR with other reference rates, by either changing the reference rate or adding or changing fallback provisions related to the reference rate. The removal of LIBOR as an appropriate benchmark interest rate is effective for reporting periods ending after December 31, 2021. All other requirements of GASB 93 are effective for reporting periods beginning after June 15, 2020 (Postponed to fiscal years beginning after June 25, 2021, see GASB 95 below). The System has not completed the process of evaluating GASB 93. It is currently unclear what the impact, if any, of such a transition could be on the Authority and its Interest-Rate Exchange Agreements. The Authority is monitoring all developments related to the potential LIBOR discontinuation in order to understand how it may affect the System’s combining financial statements going forward.
• In March 2020, GASB issued Statement No. 94, Public-Private and Public-Public Partnerships and Availability Payment Arrangements (“GASB 94”). GASB 94 improves financial reporting by addressing issues related to public-private and public-public partnership arrangements (“PPPs”). The requirements for GASB 94 are effective for fiscal years beginning after June 15, 2022, and all reporting periods thereafter. The System has not completed the process of evaluating GASB 94, but it does not expect GASB 94 to have an impact on the System’s combining financial statements as it does not enter into PPPs.

Notes To Combining Financial Statements as of and for the years ended June 30, 2021 and 2020
New York City Water & Sewer System 2021 46
2. Summary of Significant Accounting Policies (Continued)• In May 2020, GASB issued Statement No. 95, Postponement of the Effective Dates of Certain Authoritative Guidance (“GASB
95”). GASB 95 provides temporary relief to governments and other stakeholders in light of the COVID-19 pandemic by postponing the effective dates of certain provisions in Statements and Implementation Guides that first became effective or are scheduled to become effective for periods beginning after June 15, 2018, and later.
• In May 2020, GASB issued Statement No. 96, Subscription-Based Information Technology Arrangements (“GASB 96”). GASB 96 provides guidance on the accounting and financial reporting for subscription-based information technology arrangements (“SBITAs”) for government end users (governments). The requirements GASB 96 are effective for fiscal years beginning after June 15, 2022, and all reporting periods thereafter. The System has not completed the process of evaluating GASB 96, but does not expect it to have an impact on the System’s combining financial statements as it does not enter into SBITAs.
• In June 2020, GASB issued Statement No. 97, Certain Component Unit Criteria, and Accounting and Financial Reporting for Internal Revenue Code Section 457 Deferred Compensation Plans (“GASB 97”). The objectives of GASB 97 are to: (1) increase consistency and comparability related to the reporting of fiduciary component units in circumstances in which a potential component unit does not have a governing board and the primary government performs the duties that a governing board typically would perform; (2) mitigate costs associated with the reporting of certain defined contribution pension plans, defined contribution other postemployment benefit (“OPEB”) plans, and employee benefit plans other than pension plans or OPEB plans (other employee benefit plans) as fiduciary component units in fiduciary fund financial statements; and (3) enhance the relevance, consistency, and comparability of the accounting and financial reporting for Internal Revenue Code (“IRC”) Section 457 deferred compensation plans (Section 457 plans) that meet the definition of a pension plan and for benefits provided through those plans. The System has not completed the process of evaluating GASB 97 but does not expect it to have an impact on the System’s combining financial statements.
3. Utility PlantThe following is a summary of utility plant activity for the fiscal years ended June 30, 2021 and 2020, respectively (in thousands):
BALANCE AT JUNE 30, 2019 ADDITIONS DELETIONS
BALANCE AT JUNE 30, 2020 ADDITIONS DELETIONS
BALANCE AT JUNE 30, 2021
NONDEPRECIABLE ASSETS:Utility construction in progress $ 4,717,989 $ 1,809,951 $ 1,285,377 $ 5,242,563 $ 1,742,179 $ 1,214,849 $ 5,769,893
DEPRECIABLE ASSETS:
Utility plant in service:
Buildings 35,821 — — 35,821 — — 35,821
Machinery and equipment 4,893,559 330,110 6,674 5,216,995 127,664 5,671 5,338,988
Vehicles 263,639 11,137 19 274,757 3,133 — 277,890 Water supply and distribution
and wastewater treatment and sewage collection systems 36,749,341 944,130 19,068 37,674,403 1,084,052 5,716 38,752,739
Total utility plant in service 41,942,360 1,285,377 25,761 43,201,976 1,214,849 11,387 44,405,438
LESS ACCUMULATED DEPRECIATION FOR:
Buildings 29,602 733 — 30,335 283 — 30,618
Machinery and equipment 2,369,280 272,481 5,237 2,636,524 257,873 3,511 2,890,886
Vehicles 112,509 11,564 17 124,056 11,144 — 135,200 Water supply and distribution
and wastewater treatment and sewage collection systems 13,173,905 737,078 16,831 13,894,152 702,827 4,337 14,592,642
Total accumulated depreciation 15,685,296 1,021,856 22,085 16,685,067 972,127 7,848 17,649,346
Total utility plant in service—net 26,257,064 263,521 3,676 26,516,909 242,722 3,539 26,756,092
Total capital assets—net $ 30,975,053 $ 2,073,472 $ 1,289,053 $ 31,759,472 $ 1,984,901 $ 1,218,388 $ 32,525,985

Notes To Combining Financial Statements as of and for the years ended June 30, 2021 and 2020
New York City Water & Sewer System 2021 47
4. Deposits and Investments
CASH AND CASH EQUIVALENTS
The System maintains deposits only at the depositary banks designated by the New York City Banking Commission. Further, as required by the Authority’s bond resolutions, every bank that holds the Authority’s cash deposits is required to have its principal office in the State of New York and have capital stock, surplus, and undivided earnings aggregating at least $100 million. As of June 30, 2021 and 2020, cash was comprised of bank deposits and there was no difference between the carrying amounts and bank balances.
At June 30, 2021 and 2020, the cash deposit balances were $177 million and $176 million, respectively. Of the June 30, 2021 and 2020 cash deposits, $500,000 was covered by federal depository insurance, $250,000 per depository, and the remaining balance was collateralized with the securities held by the Trustee in their name.
Restricted cash and cash equivalents were comprised of the following at June 30, 2021 and 2020, respectively (in thousands):
2021 2020
RESTRICTED CASH AND CASH EQUIVALENTS:
Cash $ 176,719 $ 175,603
Cash equivalents 1,474,962 1,615,669
Total restricted cash and cash equivalents $ 1,651,681 $ 1,791,272
CUSTODIAL CREDIT RISK
Custodial credit risk is the risk that, in the event of the failure of the custodian, the System may not be able to recover the value of its deposits or collateral securities that are in the possession of an outside party. Deposits are exposed to custodial credit risk if they are not covered by depository insurance and the deposits are uncollateralized, collateralized with securities held by the pledging financial institution, or collateralized with securities held by the pledging financial institution’s trust department or agent but not in the government’s name. As of June 30, 2021 and 2020, the System had $177 million and $176 million, respectively, of deposits that were collateralized with securities held by the trustee’s trust department in the trustee’s name.
INVESTMENTS
The System invests funds that are not immediately required for operations, debt service, or capital expenses. Funds held by the Authority are invested pursuant to the Authority’s bond resolutions and in accordance with its investment guidelines, which restrict investments to obligations of, or guaranteed by, the United States of America, to certain highly rated obligations of the State of New York, to certain certificates of deposit and similar instruments issued by highly rated commercial banks, to certain highly rated corporate securities or commercial paper securities, to certain repurchase agreements with highly rated institutions, to certain investment agreements with highly rated institutions, to certain highly rated money market funds, and to certain highly rated municipal obligations. All accounts held by the Water Board are invested in accordance with the Water Board’s investment guidelines, which restrict investments to obligations of, or guaranteed by, the United States of America and to certain repurchase agreements with highly rated institutions.

Notes To Combining Financial Statements as of and for the years ended June 30, 2021 and 2020
New York City Water & Sewer System 2021 48
4. Deposits and Investments (Continued)The System had the following restricted investments at June 30, 2021 and 2020 (in thousands):
2021 2020
RESTRICTED INVESTMENTS WATER BOARD
MUNICIPAL WATER FINANCE
AUTHORITY TOTAL WATER BOARD
MUNICIPAL WATER FINANCE
AUTHORITY TOTAL
U.S. Agencies securities $ — $ 149,757 $ 149,757 $ — $ 172,229 $ 172,229
U.S. Treasury securities 273,854 475,959 749,813 264,152 763,583 1,027,735
New York State instrumentalities — 49,393 49,393 — 56,069 56,069
Money market funds 102 1,131,610 1,131,712 23 1,130,758 1,130,781
Guaranteed investment contracts — 95,096 95,096 — 99,754 99,754
Forward Purchase Agreements — 23,310 23,310 — 33,349 33,349 Total investments including
cash equivalents 273,956 1,925,125 2,199,081 264,175 2,255,742 2,519,917
Less amounts reported as cash equivalents (102) (1,474,860) (1,474,962) (23) (1,615,646) (1,615,669)
Total Restricted Investments $ 273,854 $ 450,265 $ 724,119 $ 264,152 $ 640,096 $ 904,248
FAIR VALUE HIERARCHY
The System categorizes its fair value measurements within the fair value hierarchy established by generally accepted accounting principles. The hierarchy is based on the valuation inputs used to measure fair value of the assets. Level 1 inputs are quoted prices in an active market for identical assets; Level 2 inputs are significant other observable inputs; and Level 3 inputs are significant unobservable inputs.
The System has the following recurring fair value measurements as of June 30, 2021 and 2020 (in thousands):
• U.S. Agencies securities of $150 million and $172 million, respectively, are valued using a matrix-pricing model (Level 2 inputs).
• U.S. Treasury securities of $750 million and $1 billion, respectively, are valued using a matrix-pricing model (Level 2 inputs).
• New York State Instrumentalities of $49 million and $56 million, respectively, are valued using a matrix-pricing model (Level 2 inputs).
• Money Market Funds of $1.10 billion and $1.10 billion, respectively, are valued using a matrix-pricing model (Level 2 inputs).
• Guaranteed Investment Contracts (“GIC”) of $95.1 million and $99.8 million, respectively, are valued using the market approach, with observable inputs and using a matrix pricing technique (Level 2 inputs).
• Forward Purchase Agreements of $23.3 million and $33.3 million, respectively, are valued using the market approach, with observable inputs and using a matrix pricing technique (Level 2 inputs).
• Interest Rate Derivatives of ($121) million and ($155) million, respectively, are valued using the income approach (Level 2 inputs).
CREDIT RISK
Both the Water Board and the Authority have Board of Directors approved investment guidelines and policies in place designed to protect principal by limiting credit risk. This is accomplished through ratings, collateral, and diversification requirements that vary according to the type of investment. Investments held by the System at June 30, 2021, and 2020 include obligations of, or guaranteed by, the United States of America, the Federal Home Loan Mortgage Corporation, the Federal Home Loan Bank, the Federal National Mortgage Association, the Federal Agriculture Mortgage Corporation, and the Federal Farm Credit Bank. Also, held by the Authority, are direct obligations of agencies or public authorities of the State of New York, which at the time of purchase were rated in one of the two highest rating categories. In addition, the Authority has entered into investment agreements and a guaranteed investment contract with financial institutions whose long-term debt obligations, or whose obligations under such an investment agreement or guaranteed investment contract, are guaranteed by a financial institution whose senior long-term debt obligations were rated in one of the two highest rating categories for comparable types of obligations by each rating agency at the time such agreement or contract was entered into.

Notes To Combining Financial Statements as of and for the years ended June 30, 2021 and 2020
New York City Water & Sewer System 2021 49
4. Deposits and Investments (Continued)
INTEREST RATE RISK
Changes in interest rates impact fair value of investments. Investments by the System are not expected to be liquidated prior to maturity and investment agreements are not expected to be terminated prior to their expiration dates, thereby limiting cash flow exposure from rising interest rates.
CONCENTRATION OF CREDIT RISK
Concentration of credit risk is the risk of loss attributed to the magnitude of the System’s investment in a single issuer. The System’s investment policy limits the amount the System may invest in any particular issuer. As of June 30, 2021, the System had 34% of restricted investments invested in Federally Guaranteed Securities, 7% in U.S. Agency Securities, 2% in Municipal Bonds, 5% in Guaranteed Investment Contract, and 52% of First American Government Obligation Money Market Fund.
Segmented time distribution on investments and cash equivalents as of June 30, 2021 (in thousands):
MATURITY DATE FAIR VALUE AMOUNT
Under 6 months $ 1,788,188
Over 6 months to 1 year 108,881
Over 1 year to 3 years 229,387
Over 1 year to 3 years (GIC Adj.)¹ 9,059
Over 3 years and beyond 40,256
Over 3 years and beyond (Forward Purchase Agreement adj.)¹ 23,310
Total $ 2,199,081 ¹Includes the fair value of $23.3M related to Forward Purchase Agreements and $9.1M related to a GIC agreement.
CUSTODIAL CREDIT RISK
With respect to investments, custodial credit risk is the risk that, in the event of the failure of the custodian, the System may not be able to recover the value of its investment or collateral securities that are in the possession of an outside party. Investment securities are exposed to custodial credit risk if the securities are uninsured, are not registered in the name of their government, and are held by either the counterparty or the counterparty’s trust department or agent but not in the name of the government. All of the investments, except for the GIC, which had a fair value of $95.1 million and $99.8 million at June 30, 2021 and 2020, respectively, were not registered in the System’s name. The types and amounts of investments are listed in the table on page 48.
5. Derivative InstrumentsAs of June 30, 2021, the Authority had the following (in thousands):
TYPENOTIONAL
AMOUNT EFFECTIVE
DATEMATURITY
DATE TERMSFAIR
VALUE
COUNTERPARTY CREDIT RATING
(MOODY'S/ S&P/FITCH)
HEDGING DERIVATIVES
Synthetic fixed rate $ 240,600 10/24/07 6/15/36 Pay 3.439% receive67% of 1-month LIBOR
$ (72,409) Aa2/AA-/NR
Synthetic fixed rate 160,400 10/24/07 6/15/36 Pay 3.439% receive67% of 1-month LIBOR
(48,273) Aa2/A+/AA
Totals $ 401,000 $ (120,682)

Notes To Combining Financial Statements as of and for the years ended June 30, 2021 and 2020
New York City Water & Sewer System 2021 50
5. Derivative Instruments (Continued) As of June 30, 2020, the Authority had the following (in thousands):
TYPENOTIONAL
AMOUNT EFFECTIVE
DATEMATURITY
DATE TERMSFAIR
VALUE
COUNTERPARTY CREDIT RATING
(MOODY'S/ S&P/FITCH)
HEDGING DERIVATIVES
Synthetic fixed rate $ 240,600 10/24/07 6/15/36 Pay 3.439% receive67% of 1-month LIBOR
$ (92,970) Aa2/AA-/NR
Synthetic fixed rate 160,400 10/24/07 6/15/36 Pay 3.439% receive67% of 1-month LIBOR
(61,980) Aa2/A+/AA-
Totals $ 401,000 $ (154,950)
LIBOR: London Interbank offered Rate Index
HEDGING DERIVATIVE INSTRUMENTS
Effective October 24, 2007, the Authority executed two interest rate exchange agreements, in conjunction with its sale of $401 million of Adjustable Rate Fiscal 2008 Series BB Second Resolution Bonds. Under these agreements, the Authority pays a fixed interest rate of 3.439% in exchange for a floating rate based on 67% of one-month LIBOR on the combined notional amount of $401 million. The agreements are with two separate counterparties: one agreement with Goldman Sachs Mitsui Marine Derivative Products in the amount of $241 million and the second agreement with Bank of America in the amount of $160 million. These agreements allowed the Authority to achieve a fixed rate cost lower than the cost of conventional fixed rate debt at the time of issuance. The Authority’s obligations under these interest rate exchange agreements are payable on a parity with the related Second Resolution revenue bonds.
CREDIT RISK
The risk that the counterparty (or its guarantor) will default under its agreement and the Authority would be left with unhedged variable rate debt. To continue to be hedged, the Authority may have to pay another entity to assume the position of the defaulting counterparty while not receiving an offsetting payment from the defaulting counterparty (full or in part). The Authority seeks to limit credit risk by contracting with highly rated counterparties or requiring highly rated guarantees of the counterparty’s obligations. In the event that a counterparty loses its high rating, the Authority has built in two forms of protection into its swap agreements. First, the Authority has required the counterparty to post collateral if its ratings fall below ‘Aa3’ by Moody’s and ‘AA-’ by Standard and Poor’s and the mark-to-market in the Authority’s favor exceeds specified threshold amounts. Second, the Authority has the right to terminate the Interest Rate Exchange Agreement if the counterparty is downgraded below ‘A3’ and ‘A-’ by Moody’s and S&P, respectively. In addition, the Authority monitors the credit ratings and overall financial condition of its counterparties and may exercise its right to assign the agreement to another counterparty if necessary, in its judgment, to mitigate credit risk, even in the absence of a significant credit rating downgrade.
TERMINATION RISK
The counterparties can terminate the agreements upon the occurrence of certain events, when the mark-to-market value is such that the Authority would owe a termination payment to the counterparty. The counterparties may terminate the agreement only upon the occurrence of certain events, such as payment defaults by the Authority, other defaults which remain uncured for 30 days after notice, bankruptcy or insolvency of the Authority (or similar events), or a downgrade of the Authority’s credit rating below ‘Baa2’ and ‘BBB’ by Moody’s and Standard & Poor’s, respectively.
BASIS RISK
Basis risk is the risk of a mismatch between two floating rates. For example, the amount the Authority receives under an Interest Rate Exchange Agreement may be lower than the amount the Authority is required to pay on the bonds associated with the transaction, which would require the Authority to make up the shortfall.
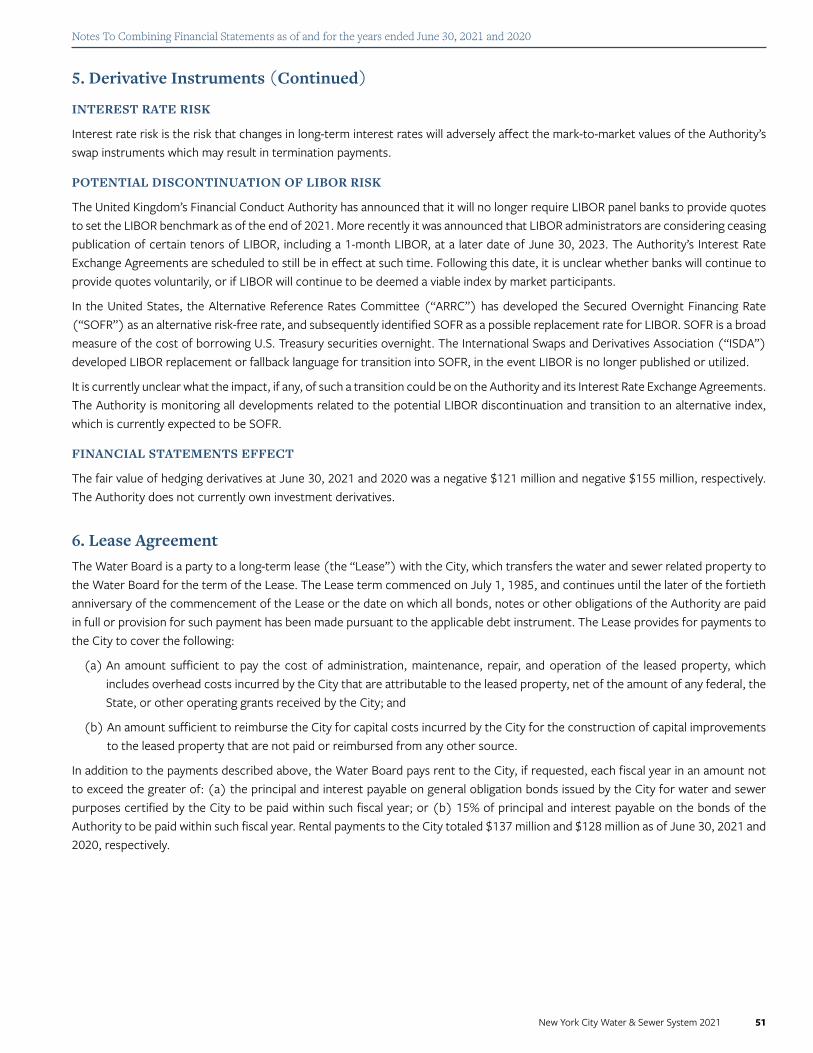
Notes To Combining Financial Statements as of and for the years ended June 30, 2021 and 2020
New York City Water & Sewer System 2021 51
5. Derivative Instruments (Continued)
INTEREST RATE RISK
Interest rate risk is the risk that changes in long-term interest rates will adversely affect the mark-to-market values of the Authority’s swap instruments which may result in termination payments.
POTENTIAL DISCONTINUATION OF LIBOR RISK
The United Kingdom’s Financial Conduct Authority has announced that it will no longer require LIBOR panel banks to provide quotes to set the LIBOR benchmark as of the end of 2021. More recently it was announced that LIBOR administrators are considering ceasing publication of certain tenors of LIBOR, including a 1-month LIBOR, at a later date of June 30, 2023. The Authority’s Interest Rate Exchange Agreements are scheduled to still be in effect at such time. Following this date, it is unclear whether banks will continue to provide quotes voluntarily, or if LIBOR will continue to be deemed a viable index by market participants.
In the United States, the Alternative Reference Rates Committee (“ARRC”) has developed the Secured Overnight Financing Rate (“SOFR”) as an alternative risk-free rate, and subsequently identified SOFR as a possible replacement rate for LIBOR. SOFR is a broad measure of the cost of borrowing U.S. Treasury securities overnight. The International Swaps and Derivatives Association (“ISDA”) developed LIBOR replacement or fallback language for transition into SOFR, in the event LIBOR is no longer published or utilized.
It is currently unclear what the impact, if any, of such a transition could be on the Authority and its Interest Rate Exchange Agreements. The Authority is monitoring all developments related to the potential LIBOR discontinuation and transition to an alternative index, which is currently expected to be SOFR.
FINANCIAL STATEMENTS EFFECT
The fair value of hedging derivatives at June 30, 2021 and 2020 was a negative $121 million and negative $155 million, respectively. The Authority does not currently own investment derivatives.
6. Lease AgreementThe Water Board is a party to a long-term lease (the “Lease”) with the City, which transfers the water and sewer related property to the Water Board for the term of the Lease. The Lease term commenced on July 1, 1985, and continues until the later of the fortieth anniversary of the commencement of the Lease or the date on which all bonds, notes or other obligations of the Authority are paid in full or provision for such payment has been made pursuant to the applicable debt instrument. The Lease provides for payments to the City to cover the following:
(a) An amount sufficient to pay the cost of administration, maintenance, repair, and operation of the leased property, which includes overhead costs incurred by the City that are attributable to the leased property, net of the amount of any federal, the State, or other operating grants received by the City; and
(b) An amount sufficient to reimburse the City for capital costs incurred by the City for the construction of capital improvements to the leased property that are not paid or reimbursed from any other source.
In addition to the payments described above, the Water Board pays rent to the City, if requested, each fiscal year in an amount not to exceed the greater of: (a) the principal and interest payable on general obligation bonds issued by the City for water and sewer purposes certified by the City to be paid within such fiscal year; or (b) 15% of principal and interest payable on the bonds of the Authority to be paid within such fiscal year. Rental payments to the City totaled $137 million and $128 million as of June 30, 2021 and 2020, respectively.

Notes To Combining Financial Statements as of and for the years ended June 30, 2021 and 2020
New York City Water & Sewer System 2021 52
2021 2020
Pollution remediation $ 21,529 $ 2,045
Payments for watershed improvements 58,164 24,032
Asset retirement obligation — (16)
Program expense 48,371 44,933
Total other operating expenses $ 128,064 $ 70,994
6. Lease Agreement (Continued)A summary of operations and maintenance and rental expenses for the years ended June 30 is as follows (in thousands):
2021 2020
Water supply, treatment, transmission and distribution $ 528,347 $ 539,908
Sewer collection and treatment systems 705,823 662,437
The City agency support cost 65,845 52,772
Fringe benefits 235,694 242,053
Judgments and claims 17,552 2,836
Reversal of prior year payables (2,988) (13,178)
Operation and maintenance 1,550,273 1,486,828
Rental payments to the City 137,000 128,000
Total operations and maintenance expenses $ 1,687,273 $ 1,614,828
7. Payable To and Receivable From The CityAs of June 30, 2021 and 2020, all utility construction and other projects financed by the Authority debt and recorded by the System, which have not been reimbursed to the City, are recorded as a payable to the City. The Authority had a payable to the City of $565 million and $568 million as of June 30, 2021 and 2020, respectively, net of the amount of state or federal and other capital grants recognized by the City.
As of June 30, 2021 and 2020, the Water Board had a receivable from the City of $39 million and $94 million, respectively. The receivable from the City is a result of the difference between budget estimates and actual expenses.
8. Other Operating ExpensesA summary of other operating expenses for the years ended June 30 is as follows (in thousands):
The City’s DEP manages both the System’s operations and its capital program, and it also manages other projects with long-term benefits to the System, which do not result in capital assets of the System and that are paid for using the Authority’s bond proceeds. Such long-term benefit projects include payment for environmental protection, related improvement in the watershed areas, and pollution remediation projects throughout the System. The System has estimated these amounts based on the current value of outlays expected to be incurred for pollution remediation, which it is currently obligated to perform. Actual future outlays will differ from the estimated amounts if the prices or techniques for remediation measures change or differ from the estimates.
The System offers its residential customers the option to enroll into a protection program on their water and sewer lines against any breakage for a monthly fee. The fee is included in the participating customer utility bill. This protection program is offered by American Water Resources. In fiscal years 2021 and 2020, the System incurred program expenses of $48.4 million and $45 million, respectively.
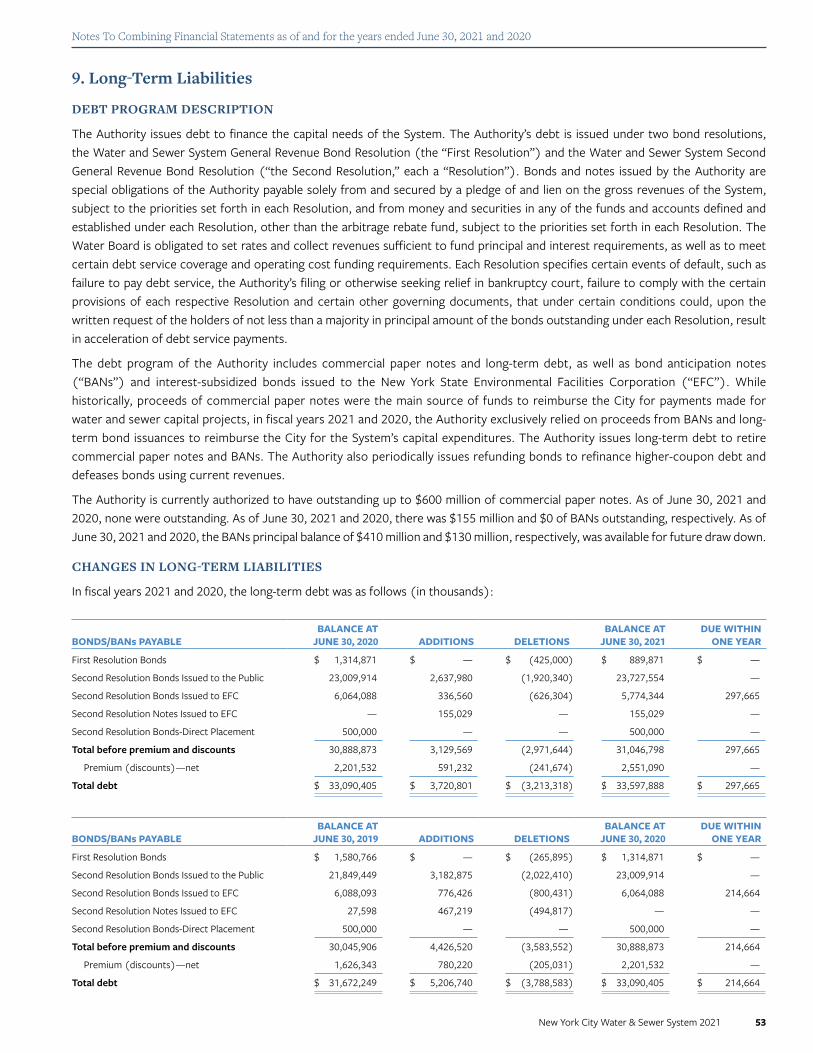
Notes To Combining Financial Statements as of and for the years ended June 30, 2021 and 2020
New York City Water & Sewer System 2021 53
9. Long-Term Liabilities
DEBT PROGRAM DESCRIPTION
The Authority issues debt to finance the capital needs of the System. The Authority’s debt is issued under two bond resolutions, the Water and Sewer System General Revenue Bond Resolution (the “First Resolution”) and the Water and Sewer System Second General Revenue Bond Resolution (“the Second Resolution,” each a “Resolution”). Bonds and notes issued by the Authority are special obligations of the Authority payable solely from and secured by a pledge of and lien on the gross revenues of the System, subject to the priorities set forth in each Resolution, and from money and securities in any of the funds and accounts defined and established under each Resolution, other than the arbitrage rebate fund, subject to the priorities set forth in each Resolution. The Water Board is obligated to set rates and collect revenues sufficient to fund principal and interest requirements, as well as to meet certain debt service coverage and operating cost funding requirements. Each Resolution specifies certain events of default, such as failure to pay debt service, the Authority’s filing or otherwise seeking relief in bankruptcy court, failure to comply with the certain provisions of each respective Resolution and certain other governing documents, that under certain conditions could, upon the written request of the holders of not less than a majority in principal amount of the bonds outstanding under each Resolution, result in acceleration of debt service payments.
The debt program of the Authority includes commercial paper notes and long-term debt, as well as bond anticipation notes (“BANs”) and interest-subsidized bonds issued to the New York State Environmental Facilities Corporation (“EFC”). While historically, proceeds of commercial paper notes were the main source of funds to reimburse the City for payments made for water and sewer capital projects, in fiscal years 2021 and 2020, the Authority exclusively relied on proceeds from BANs and long-term bond issuances to reimburse the City for the System’s capital expenditures. The Authority issues long-term debt to retire commercial paper notes and BANs. The Authority also periodically issues refunding bonds to refinance higher-coupon debt and defeases bonds using current revenues.
The Authority is currently authorized to have outstanding up to $600 million of commercial paper notes. As of June 30, 2021 and 2020, none were outstanding. As of June 30, 2021 and 2020, there was $155 million and $0 of BANs outstanding, respectively. As of June 30, 2021 and 2020, the BANs principal balance of $410 million and $130 million, respectively, was available for future draw down.
CHANGES IN LONG-TERM LIABILITIES
In fiscal years 2021 and 2020, the long-term debt was as follows (in thousands):
BONDS/BANs PAYABLEBALANCE AT
JUNE 30, 2020 ADDITIONS DELETIONSBALANCE AT
JUNE 30, 2021DUE WITHIN
ONE YEAR
First Resolution Bonds $ 1,314,871 $ — $ (425,000) $ 889,871 $ —
Second Resolution Bonds Issued to the Public 23,009,914 2,637,980 (1,920,340) 23,727,554 —
Second Resolution Bonds Issued to EFC 6,064,088 336,560 (626,304) 5,774,344 297,665
Second Resolution Notes Issued to EFC — 155,029 — 155,029 —
Second Resolution Bonds-Direct Placement 500,000 — — 500,000 —
Total before premium and discounts 30,888,873 3,129,569 (2,971,644) 31,046,798 297,665
Premium (discounts)—net 2,201,532 591,232 (241,674) 2,551,090 —
Total debt $ 33,090,405 $ 3,720,801 $ (3,213,318) $ 33,597,888 $ 297,665
BONDS/BANs PAYABLEBALANCE AT
JUNE 30, 2019 ADDITIONS DELETIONSBALANCE AT
JUNE 30, 2020DUE WITHIN
ONE YEAR
First Resolution Bonds $ 1,580,766 $ — $ (265,895) $ 1,314,871 $ —
Second Resolution Bonds Issued to the Public 21,849,449 3,182,875 (2,022,410) 23,009,914 —
Second Resolution Bonds Issued to EFC 6,088,093 776,426 (800,431) 6,064,088 214,664
Second Resolution Notes Issued to EFC 27,598 467,219 (494,817) — —
Second Resolution Bonds-Direct Placement 500,000 — — 500,000 —
Total before premium and discounts 30,045,906 4,426,520 (3,583,552) 30,888,873 214,664
Premium (discounts)—net 1,626,343 780,220 (205,031) 2,201,532 —
Total debt $ 31,672,249 $ 5,206,740 $ (3,788,583) $ 33,090,405 $ 214,664

Notes To Combining Financial Statements as of and for the years ended June 30, 2021 and 2020
New York City Water & Sewer System 2021 54
9. Long-Term Liabilities (Continued)
DEBT PROGRAM ADMINISTRATION
In fiscal year 2021, the Authority issued $981 million of new money bonds to the public. The Authority used new money bond proceeds to finance capital improvements to the System and to pay for bond issuance costs. In addition, in fiscal year 2021, the Authority drew down $155 million of BANs proceeds and applied them to finance capital improvements to the System.
During fiscal year 2021, as further detailed in the bullets below, the Authority issued $1.99 billion of bonds to refund $2.38 billion of outstanding bonds. These refunding transactions resulted in a cumulative accounting gain of $11.3 million. The Authority reduced its aggregate debt service for principal and interest by $642 million and obtained an economic benefit (present value savings) of $554 million.
The following details the Authority’s refunding activity in fiscal year 2021:
On September 30, 2020, the Authority issued $650 million of tax-exempt fixed rate Second Resolution bonds, Fiscal 2021 Series AA. $370 million of the Fiscal 2021 Series AA bonds refunded the following fixed rate Second Resolution bonds: $200 million of Fiscal 2006 Series AA, $147 million of Fiscal 2011 Series EE, and $108 million of Fiscal 2011 Series CC outstanding Build American Bonds. The Authority reduced its overall debt service by $179 million and obtained an economic benefit of $144 million.
On December 15, 2020, the Authority issued $534 million of tax-exempt fixed rate Second Resolution bonds, Fiscal 2021 Series BB. $229 million of the Fiscal 2021 Series BB bonds refunded $100 million of the First Resolution Fiscal 2008 Series B-1 variable rate demand bonds and $167 million of Fiscal 2011 Series CC outstanding Build American Bonds. The Authority reduced its overall debt service by $64.4 million and obtained an economic benefit of $50.7 million.
On March 18, 2021, the Authority issued $553 million of fixed rate Second Resolution bonds, Fiscal 2021 Series CC. $157 million of the Fiscal 2021 Series CC bonds refunded the following fixed rate Second Resolution bonds $159 million of Fiscal 2011 Series HH and $50.7 million of Fiscal 2012 Series AA. The Authority reduced its overall debt service by $81.4 million and obtained an economic benefit of $69.9 million.
On March 18, 2021, the Authority issued $575 million of fixed rate Second Resolution bonds, Fiscal 2021 Series DD. The bonds refunded the following fixed rate Second Resolution bonds: $74.6 million of Fiscal 2011 Series GG, $504 million of Fiscal 2011 Series HH, $54.1 million of Fiscal 2012 Series AA, and $85.9 million of Fiscal 2016 Series CC-2. The Authority reduced its overall debt service by $203 million and obtained an economic benefit of $185 million.
On March 31, 2021, the Authority issued $326 million of tax-exempt adjustable rate Second Resolution bonds, Fiscal 2021 Series EE. The bonds refunded $325 million of the First Resolution Adjustable Rate Fiscal 2012 Series B bonds. The Authority increased its overall debt service by $1.0 million and realized an economic loss of $0.5 million.
On June 30, 2021, the Authority issued the following fixed rate Second Resolution bonds to EFC: $285 million of Fiscal 2021 Series 2 and $51.8 million of Fiscal 2021 Series 3. Proceeds of the bonds were used to refund $350 million of Fiscal 2011 Series 1 and $51.8 million of Fiscal 2011 Series 2. The Authority reduced its overall debt service by $114 million and obtained an economic benefit of $105 million.
During fiscal year 2021, the Authority legally defeased $26.0 million of Fiscal 2012 EE bonds, $35.3 million of Fiscal 2012 FF bonds, $107 million of Fiscal 2014 DD bonds, $10.1 million of Fiscal 2016 Series 5 bonds, $111 million of Fiscal 2019 AA bonds, and $91.8 million of Fiscal 2020 CC bonds using current revenue by depositing $407 million into defeasance escrows. The defeasance transaction resulted in an accounting gain of $11.6 million that is reported in the System’s combining statements of revenues, expenses and changes in net position (deficit) and aggregate reduction of debt service of $409 million.

Notes To Combining Financial Statements as of and for the years ended June 30, 2021 and 2020
New York City Water & Sewer System 2021 55
9. Long-Term Liabilities (Continued)In fiscal year 2020, the Authority issued $1.7 billion of new money bonds to the public and issued an additional $425 million of new money bonds to EFC. The Authority used new money bond proceeds to finance capital improvements to the System, to provide long-term financing of BANs that previously financed capital improvements to the System, and to pay for bond issuance costs. In addition, in fiscal year 2020, the Authority drew down $467 million of BANs proceeds and applied them to finance capital improvement to the System.
During fiscal year 2020, the Authority issued $1.9 billion of bonds to refund $2.3 billion of outstanding bonds. These refunding transactions resulted in a cumulative accounting gain of $31.7 million. The Authority reduced its aggregate debt service for principal and interest by $693 million and obtained an economic benefit (present value savings) of $544 million.
During fiscal year 2020, the Authority legally defeased $25.0 million of Fiscal 1997 A bonds, $24.3 million accreted value of Fiscal 2001 D bonds, $2.0 million of Fiscal 2010 FF bonds, $27.1 million of Fiscal 2011 GG bonds, $9.2 million of Fiscal 2012 EE bonds, $20.0 million of Fiscal 2012 FF bonds, $33.9 million of Fiscal 2014 DD bonds, $7.7 million of Fiscal 2016 CC bonds, $9.1 million of Fiscal 2016 A bonds, $27.6 million of Fiscal 2017 A bonds, $6.0 million of Fiscal 2017 E bonds, $33.8 million of Fiscal 2018 A bonds, $30.3 million of Fiscal 2018 DD, $55.8 million of Fiscal 2018 FF bonds, $10.7 million of Fiscal 2020 AA bonds, $4.7 million of Fiscal 2019 B bonds, and $6.7 million of Fiscal 2020 CC bonds using current revenue by depositing $350 million into defeasance escrows. The defeasance transaction resulted in an accounting gain of $11 million that is reported in the System’s combining statements of revenues, expenses and changes in net position (deficit) and aggregate reduction of debt service of $352 million.
The Authority defeased some of its bonds by placing proceeds of refunding bonds or current revenue in irrevocable escrow accounts to provide for all future debt service payments on the defeased bonds. The escrow account assets and the liability for the defeased bonds are not included in the System’s combining financial statements. As of June 30, 2021 and 2020, $770 million and $1.7 billion, of the Authority’s defeased bonds, respectively, were still outstanding.
INDEX RATE BONDS
As of June 30, 2021 and 2020, the Authority had outstanding $500 million of index rate bonds, which were purchased by a bank through direct placement. The index rate bonds are adjustable rate bonds that pay interest based on a specified market index. The terms of the index rate bonds provide for a 9% rate of interest, commencing on an identified step-up date, if such bonds are not converted or refunded prior to such date. Interest rates on the Authority’s index rate bonds cannot exceed 9%. In fiscal years 2021 and 2020, interest rates on the Authority’s index rate bonds averaged 0.75% and 1.83%, respectively.
VARIABLE RATE DEMAND BONDS
As of June 30, 2021 and 2020, the Authority had $4.2 billion and $4.5 billion of adjustable rate demand bonds (“VRDBs”) outstanding, respectively. VRDBs may be tendered at the option of their holders prior to their maturity. VRDBs are remarketed by remarketing agents on a daily or weekly basis. Interest rates determined by such remarketing agents for such periods represent the lowest rate of interest that would cause the VRDBs to have a market value equal to par. VRDBs interest rates cannot exceed 9%. In fiscal years 2021 and 2020, interest rates on the Authority’s variable rate demand bonds averaged 0.07% and 1.4%, respectively.
The VRDBs are backed by either a Standby Bond Purchase Agreement (“SBPA”) or a Letter of Credit (“LOC”), providing for the purchase of the VRDBs by a bank in the event they cannot be remarketed. In such case, the interest rate on the VRDBs would typically increase and would be determined by reference to specified index rates plus a spread (in some cases, with a minimum rate), up to a maximum rate of 25%. No VRDBs were held by such banks during the fiscal years ending June 30, 2021 and 2020. SBPAs and LOCs may be terminated by the respective banks upon the occurrence of specified events of default. None of the SBPAs or LOCs supporting adjustable rate demand bonds provides for acceleration. However, in connection with such LOCs, the Authority has agreed that, following a specified period of time in which the LOC bank holds unremarketed VRDBs, the Authority will exchange such VRDBs for refunding bonds maturing within five years and providing for amortization during such period.

Notes To Combining Financial Statements as of and for the years ended June 30, 2021 and 2020
New York City Water & Sewer System 2021 56
9. Long-Term Liabilities (Continued) The Authority had the following adjustable rate demand bonds at June 30, 2021:
SERIESOUTSTANDING
PRINCIPAL AMOUNT SBPA OR LOC PROVIDEREXPIRATION OR OPTIONAL
TERMINATION BY PROVIDER
2019 BB $ 100,000,000 Industrial and Commercial Bank of China Limited, New York Branch 09/10/21
2008 BB-1 100,000,000 Bank of Tokyo-Mitsubishi UFJ, Ltd. 09/13/21
2013 AA-2 150,000,000 Bank of Tokyo-Mitsubishi UFJ, Ltd. 09/13/21
2014 AA-1 125,000,000 JPMorgan Chase Bank, N.A. 09/17/21
2014 AA-2 125,000,000 JPMorgan Chase Bank, N.A. 09/17/21
2013 AA-1 50,000,000 PNC Bank, NA 10/02/21
2007 CC-1 160,500,000 Sumitomo Mitsui Banking Corporation 10/05/21
2017 BB-1A 100,000,000 State Street Bank and Trust Company 10/05/21
2017 BB-1B 100,000,000 State Street Bank and Trust Company 10/05/21
2017 BB-3 39,500,000 Sumitomo Mitsui Banking Corporation 10/05/21
2003 F-2 101,655,000 Citibank, N.A. 10/26/21
2016 AA-2 100,000,000 PNC Bank, NA 10/26/21
2011 DD-2 75,000,000 JPMorgan Chase Bank, N.A. 11/12/21
2001-F1 100,000,000 Mizuho Bank, Ltd. 06/10/22
2015 BB-2 100,000,000 Mizuho Bank, Ltd. 06/14/22
2003 F-1-A 50,000,000 Barclays Bank PLC 06/17/22
2015 BB-4 100,000,000 Barclays Bank PLC 06/17/22
2014 AA-5 100,435,000 Mizuho Bank, Ltd. 08/19/22
2014 AA-6 100,435,000 Mizuho Bank, Ltd. 08/19/22
2012 A-1 100,000,000 Mizuho Bank, Ltd. 09/27/22
2012 A-2 100,000,000 Mizuho Bank, Ltd. 09/27/22
2011 DD-3A 50,000,000 US Bank, N.A. 10/16/22
2011 DD-3B 50,000,000 State Street Bank and Trust Company 10/16/22
2010 CC 200,000,000 Barclays Bank PLC 12/13/22
2001-F2 84,130,000 JPMorgan Chase Bank, N.A. 04/11/23
2009 BB-1 100,435,000 UBS AG 05/26/23
2009 BB-2 100,435,000 UBS AG 05/26/23
2015 BB-3 100,000,000 Sumitomo Mitsui Banking Corporation 07/07/23
2014 AA-4 100,000,000 Bank of Montreal 08/11/23
2014 AA-3 100,000,000 TD Bank, N.A. 09/17/23
2007 CC-2 50,000,000 Bank of Montreal 10/05/23
2017 BB-2 50,000,000 Bank of Montreal 10/05/23
2008 BB-2 101,000,000 Bank of America, N.A. 10/20/23
2008 BB-5 50,000,000 Bank of America, N.A. 10/20/23
2016 AA-1 100,000,000 Bank of America, N.A. 10/27/23
2011 DD-1 100,000,000 TD Bank, N.A. 11/16/23
2003 F-1-B 50,000,000 US Bank, N.A. 02/27/24
2021 EE-1 100,000,000 US Bank, N.A. 03/06/24
2011 FF-1 100,000,000 Bank of America, N.A. 03/15/24
2000-C 107,500,000 Sumitomo Mitsui Banking Corporation 05/04/25
2015 BB-1 100,000,000 Bank of America, N.A. 07/09/25
2021 EE-2 225,500,000 State Street Bank and Trust Company 03/06/26
2011 FF-2 100,000,000 JPMorgan Chase Bank, N.A. 05/27/26
$ 4,196,525,000

Notes To Combining Financial Statements as of and for the years ended June 30, 2021 and 2020
New York City Water & Sewer System 2021 57
9. Long-Term Liabilities (Continued) The Authority had the following adjustable rate demand bonds at June 30, 2020:
SERIESOUTSTANDING
PRINCIPAL AMOUNT SBPA OR LOC PROVIDEREXPIRATION OR OPTIONAL
TERMINATION BY PROVIDER
2014 AA-4 $ 100,000,000 Bank of Montreal 08/11/20
2007 CC-2 50,000,000 Bank of Montreal 10/05/20
2017 BB-2 50,000,000 Bank of Montreal 10/05/20
2006 AA-1A 100,000,000 State Street Bank and Trust Company 10/07/20
2006 AA-1B 100,000,000 State Street Bank and Trust Company 10/07/20
2008 B-1A 100,000,000 Sumitomo Mitsui Banking Corporation 03/03/21
2012 B-1 100,000,000 US Bank, N.A. 03/06/21
2012 B-2 100,000,000 State Street Bank and Trust Company 03/06/21
2012 B-3 75,000,000 State Street Bank and Trust Company 03/06/21
2012 B-4 50,000,000 State Street Bank and Trust Company 03/06/21
2009 BB-1 100,435,000 Landesbank Hessen-Thuringen Girozentrale 06/15/21
2009 BB-2 100,435,000 Landesbank Hessen-Thuringen Girozentrale 06/15/21
2011 FF-2 100,000,000 Landesbank Hessen-Thuringen Girozentrale 06/15/21
2015 BB-1 100,000,000 Bank of America, N.A. 07/09/21
2019 BB 100,000,000 Industrial and Commercial Bank of China Limited 09/10/21
2008 BB-1 100,000,000 Bank of Tokyo-Mitsubishi UFJ, Ltd. 09/13/21
2013 AA-2 150,000,000 Bank of Tokyo-Mitsubishi UFJ, Ltd. 09/13/21
2014 AA-1 125,000,000 JPMorgan Chase Bank, N.A. 09/17/21
2014 AA-2 125,000,000 JPMorgan Chase Bank, N.A. 09/17/21
2013 AA-1 50,000,000 PNC Bank, N.A. 10/02/21
2007 CC-1 160,500,000 Sumitomo Mitsui Banking Corporation 10/05/21
2017 BB-1A 100,000,000 State Street Bank and Trust Company 10/05/21
2017 BB-1B 100,000,000 State Street Bank and Trust Company 10/05/21
2017 BB-3 39,500,000 Sumitomo Mitsui Banking Corporation 10/05/21
2003 F-2 101,655,000 Citibank, N.A. 10/26/21
2016 AA-2 100,000,000 PNC Bank, N.A. 10/26/21
2011 DD-2 75,000,000 JPMorgan Chase Bank, N.A. 11/12/21
2001 F-1 100,000,000 Mizuho Bank, Ltd. 06/10/22
2015 BB-2 100,000,000 Mizuho Bank, Ltd. 06/14/22
2003 F-1-A 50,000,000 Barclays Bank PLC 06/17/22
2015 BB-4 100,000,000 Barclays Bank PLC 06/17/22
2014 AA-5 100,435,000 Mizuho Bank, Ltd. 08/19/22
2014 AA-6 100,435,000 Mizuho Bank, Ltd. 08/19/22
2012 A-1 100,000,000 Mizuho Bank, Ltd. 09/27/22
2012 A-2 100,000,000 Mizuho Bank, Ltd. 09/27/22
2011 DD-3A 50,000,000 US Bank, N.A. 10/16/22
2011 DD-3B 50,000,000 State Street Bank and Trust Company 10/16/22
2010 CC 200,000,000 Barclays Bank PLC 12/13/22
2001 F-2 84,130,000 JPMorgan Chase Bank, N.A. 04/11/23
2015 BB-3 100,000,000 Sumitomo Mitsui Banking Corporation 07/07/23
2014 AA-3 100,000,000 TD Bank, N.A. 09/17/23
2008 BB-2 101,000,000 Bank of America, N.A. 10/20/23
2008 BB-5 50,000,000 Bank of America, N.A. 10/20/23
2016 AA-1 100,000,000 Bank of America, N.A. 10/27/23
2011 DD-1 100,000,000 TD Bank, N.A. 11/16/23
2003 F-1-B 50,000,000 US Bank, N.A. 02/27/24
2011 FF-1 100,000,000 Bank of America, N.A. 03/15/24
2000-C 107,500,000 Sumitomo Mitsui Banking Corporation 05/04/25
$ 4,496,025,000

Notes To Combining Financial Statements as of and for the years ended June 30, 2021 and 2020
New York City Water & Sewer System 2021 58
9. Long-Term Liabilities (Continued) Debt service requirements to maturity, including amounts relating to BANs with maturities greater than one year at June 30, 2021 are as follows (in thousands):
BondsBonds and Notes from
Direct Borrowings and Direct Placements
PRINCIPAL INTEREST1 PRINCIPAL INTEREST1 TOTAL
Year ending June 30,
2022 $ — $ 971,688 $ 297,665 $ 240,429 $ 1,509,782
2023 122,105 971,688 460,314 229,012 1,783,119
2024 357,945 965,921 280,620 216,060 1,820,546
2025 427,020 948,950 285,058 204,116 1,865,144
2026 436,145 928,236 282,232 192,064 1,838,677
2027–2031 2,418,910 4,302,506 1,431,455 779,667 8,932,538
2032–2036 3,298,105 3,741,607 1,255,925 498,475 8,794,112
2037–2041 4,937,925 2,998,452 807,280 295,069 9,038,726
2042–2046 6,738,070 1,779,284 802,703 138,884 9,458,941
2047–2051 5,881,200 428,430 526,121 21,576 6,857,327
Total $ 24,617,425 $ 18,036,762 $ 6,429,373 $ 2,815,352 $ 51,898,912
1 Projected interest expense for adjustable rate demand bonds for fiscal year 2022 and thereafter is calculated using weighted-average interest rate as of June 30, 2021 of 0.03%. Projected interest expense for direct placement index rate bonds for fiscal year 2022 and thereafter is calculated using weighted-average interest rate as of June 30, 2021 of 0.7%. Interest rates on adjustable rate demand bonds and index rate bonds are determined on a daily or weekly basis in accordance with the terms of such bonds.
ASSET RETIREMENT OBLIGATIONS (“ARO”)
Existing laws and regulations require the System to take specific action when retiring chemical and petroleum storage tanks. The System has 461 above and underground tanks with a capacity ranging from 10 to 100,000 gallons. The New York State Department of Conservation Under Title 6 of the New York Codes, Rules and Regulations requires that the System take specific steps to permanently take out the service including the removal, transportation and disposal of liquid, sludge, hazardous waste, piping and the tanks themselves; and to take remedial actions on the area surrounding the tanks. Based on contract estimates and invoice for similar projects, the System’s ARO for storage tanks was $15 million as of June 30, 2021 and 2020, respectively, with tanks having a remaining useful life ranging from 0 to 39 years.
DEP has entered into office space lease agreements requiring the removal of affixed furnishings including condensed filing systems, HVAC units, and distributions systems and the restoration of premises to original condition existing prior to installation of fixtures for which the System is responsible for paying. Based on engineer and architectural estimates, the ARO for leases was $2.8 million as of June 30, 2021 and 2020 respectively. The remaining lease terms range from two to three years.
COMMITMENTS AND CONTINGENCIES
Construction—The System had contractual commitments of approximately $5.1 billion and $5.5 billion at June 30, 2021 and 2020, respectively, for water and sewer projects.
Risk Financing Activities—The System is self-insured and carries no commercial or insurance policies other than directors and officer’s insurance for the Authority. Any claims made against the System are resolved through the City’s legal support, and the amounts of the maximum liability for such judgments are described in the claims and litigation section below. The System is subject to claims for construction delays, property damage, personal injury, and judgments related to delays in construction deadlines under consent agreements.

Notes To Combining Financial Statements as of and for the years ended June 30, 2021 and 2020
New York City Water & Sewer System 2021 59
9. Long-Term Liabilities (Continued) Claims and Litigation—In accordance with the Lease, the Water Board is required to reimburse the City for any judgment or settlement paid by the City arising out of a tort claim to the extent that the City’s liability is related to capital improvements and the operation or maintenance of the System. However, in no event shall the payment made to the City, in any fiscal year, exceed an amount equal to 5% of the aggregate revenues shown on the prior year’s audited combining financial statements of the System. In addition, the System is required to reimburse the City, to the extent requested by the City, for the payment of any judgment or settlement arising out of a contract claim with respect to the construction of capital improvements of the System. In addition, the City has agreed, subject to certain conditions, to indemnify the Authority, the Water Board, and their staffs against any and all liability in connection with any act done or omitted in the exercise of their powers, which is taken or omitted in good faith in pursuance of their purposes under the Act. Currently, the City is a defendant in a significant number of lawsuits pertaining to the System. The litigation includes, but is not limited to, actions commenced and claims asserted against the City arising out of alleged torts, alleged breaches of contract, condemnation proceedings, and other alleged violations of law. As of June 30, 2021, the potential future liability attributable to the System for claims outstanding against the City was estimated to be $363 million. This amount is included in the estimated liability for unsettled claims, which is reported in the City’s statement of net position (deficit). The potential future liability is the City’s best estimate based on available information. The estimate maybe revised as further information is obtained and as pending cases are litigated.
Arbitrage Rebate—To maintain the exemption from federal income tax of interest on bonds issued subsequent to January 1, 1986, the System will fund amounts required to be rebated to the Federal Government pursuant to Section 148 of the IRC of 1986, as amended (the “Code”). The Code requires the payment to the United States Treasury of the excess amount earned on all non-purpose obligations over the amount that would have been earned if the gross proceeds of the issue were invested at a rate equal to the yield on the issue, together with any earnings attributable to such excess. Construction funds, debt service funds, or any other funds or accounts funded with proceeds of such bonds, including earnings, or pledged to or expected to be used to pay interest on such bonds are subject to this requirement. Payment is to be made after the end of the fifth bond year and after every fifth bond year thereafter and within 60 days after retirement of the bonds. During fiscal years 2021 and 2020, the System paid $280 thousand and $460 thousand, respectively, in arbitrage rebates. At June 30, 2021 and 2020, the Authority had a liability of $4.3 million and $2.6 million, respectively. These amounts are included in accounts payable in the combining statements of net position (deficit).
10. Restricted AssetsAs of June 30, 2021 and 2020, certain cash, investments, and accrued interest of the System were restricted as follows (in thousands):
2021 2020
THE WATER BOARD
Operation and maintenance reserve fund $ 278,207 $ 264,178
Local water fund 8,344 13,070
Subtotal—The Water Board 286,551 277,248
THE AUTHORITY
Revenue fund 1,072,000 1,067,906
Debt service reserve fund 389,571 414,141
Construction fund 378,290 573,228
Arbitrage rebate fund 1,768 45
Escrow accounts 247,620 362,952
Subtotal—The Authority 2,089,249 2,418,272
Total restricted assets $ 2,375,800 $ 2,695,520

Notes To Combining Financial Statements as of and for the years ended June 30, 2021 and 2020
New York City Water & Sewer System 2021 60
10. Restricted Assets (Continued)The operation and maintenance reserve fund is established as a depository to hold a reserve as required by the First Resolution. At June 30 of each year, the reserve fund is required to hold one-sixth of the operating expenses as set forth in the following year’s annual budget. It is funded through the cash receipts of the Water Board.
The local water fund is established as the account to which all revenues are deposited. Its assets are subject to the payment priority set forth in the Resolutions.
The revenue fund is established as a depository to fund the debt service, the Authority’s expenses, debt service reserve, and escrow accounts. It is funded through cash transfers from the Water Board.
The debt service reserve fund is established as a depository to hold the First Resolution bond maximum annual debt service requirement for the next or any future fiscal year. It is funded through revenue bond proceeds and the revenue fund.
The debt service fund is established as a depository to pay all principal and interest payments on the Authority’s debt for the current fiscal year. It is funded through the revenue fund. On or prior to June 30, the balances in the debt service fund are transferred to the revenue fund.
The construction fund is established as a depository to pay all capital construction costs incurred by the City and reimbursed by the Authority. It is funded through the proceeds of commercial paper, bond, and note sales.
The escrow accounts are established as a depository to refund debt in future years. It is funded through bond proceeds or the revenue fund.
11. Pension Plans
GENERAL INFORMATION ABOUT THE PENSION PLAN
Plan Description—The Authority’s eligible employees are provided with pension benefits through the New York City Employee Retirement System Qualified Pension Plan (“NYCERS QPP” or “Pension Plan”). The Pension Plan is a cost-sharing, multiple-employer defined benefit pension plan administered by NYCERS.
The Pension Plan functions in accordance with existing State statutes and the City laws which are the basis by which benefit terms and the Authority’s and its members’ contribution requirements are established and amended. NYCERS issues a publicly-available financial report that can be obtained at www.nycers.org.
Benefits Provided—The Pension Plan provides pension benefits to retired employees generally based on the salary, length of service, member contributions, and membership tier (“Tier”). For certain members, voluntary member contributions also impact pension benefits provided. In addition, the Pension Plan provides automatic cost-of-living-adjustments (“COLA”) and other supplemental pension benefits to certain retirees and beneficiaries. Subject to certain conditions, members become fully vested as to benefits upon the completion of five years of service for Tier I to Tier IV and ten years of service for Tier VI. Upon termination of employment before retirement, certain members are entitled to refunds of their own contributions, including accumulated interest, less any outstanding loan balances. In the event of disability during employment, participants may receive retirement allowances based on satisfaction of certain service requirements and other provisions. The Pension Plan also provides death benefits.
The State Constitution provides that pension rights of public employees are contractual and shall not be diminished or impaired. In 1973, 1976, 1983, and 2012, significant amendments made to the State Retirement and Social Security Law (“RSSL”) modified certain benefits for employees joining the Pension Plan on or after the effective date of such amendments, creating membership tiers. Currently, there are several Tiers, referred to as Tier I, Tier II, Tier III, Tier IV, and Tier VI. Members are assigned a Tier based on membership date. Chapter 18 of the Laws of 2012 (Chapter 18/12) amended the retirement benefits of public employees who establish membership in the Pension Plan on or after April 1, 2012. Chapter 18/12 is commonly referred to as Tier VI. Tier VI is expected to reduce future employer pension contributions.
Notes To Combining Financial Statements as of and for the years ended June 30, 2021 and 2020
New York City Water & Sewer System 2021 61
11. Pension Plans (Continued)Certain members of Tier I and Tier II of the NYCERS QPP have the right to make voluntary excess contributions, which are supplemental voluntary contributions. Members can elect to direct these contributions to an investment program under which such accumulated contributions are credited with interest at rates set by statute (“Statutory Rates”). The Authority does not have any Tier I, Tier II, or Tier III members.
Contributions and Funding Policy—Contribution requirements of participating employers and active members are determined in accordance with State statutes and City laws and are generally funded within the appropriate fiscal year. Effective with fiscal year 2006, employer contributions are actuarially determined under the One-Year Lag Methodology (“OYLM”). Actuarial valuations of the NYCRS are performed using a June 30, XX-2 actuarial valuation due to determine Fiscal Year XX employer contribution (e.g. June 30, 2020 (Lag) actuarial valuations are used to determine Fiscal Year 2022 employer contributions). This is referred to as OYLM.
In general, Tier III and Tier IV members make basic contributions of 3.0% of salary regardless of age at membership. Effective October 1, 2000, in accordance with Chapter 126 of the Laws of 2000, Tier III and Tier IV members are not required to make any contributions after the 10th anniversary of their membership date or completion of ten years of credited service, whichever is earlier. Tier VI members who joined between April 1, 2012 and March 31, 2013 contribute 3% of salary. Beginning April 1, 2013, when Tier VI took effect, joining members contribute between 3.0% and 6.0% of salary, depending on their salary level.
Employer contributions are determined annually to be an amount that, together with member contributions and investment income, provides for the Pension Plan assets to be sufficient to pay benefits when due. The aggregate statutory contribution due to NYCERS QPP from all participating employers for fiscal years 2021 and 2020 was $3.8 billion and $3.7 billion, respectively, and the amount of the Authority’s contribution to the Pension Plan for such fiscal years 2021 and 2020 was $201 thousand and $75 thousand, respectively.
INFORMATION ON THE EMPLOYER’S PROPORTIONATE SHARE OF THE COLLECTIVE NET PENSION LIABILITY
The Authority’s net pension liabilities reported at June 30, 2021 and 2020 were measured as of those fiscal year-end dates. The total pension liability used to calculate those net pension liabilities were determined by actuarial valuations as of June 30, 2020 and June 30, 2019, respectively, based on the OYLM described above, and rolled forward to the respective fiscal year-end measurement dates.
Information about the Authority net position and additions to and deductions from NYCERS QPP fiduciary net position has been determined on the same basis as that reported by NYCERS QPP. For this purpose, benefits and refunds are recognized when due and payable in accordance with the terms of the respective qualified pension plan, and investments are reported at fair value.
ACTUARIAL ASSUMPTIONS
Measurement of the total net pension liability, on which the net pension liability is based, requires the use of assumptions about numerous future events that affect the benefit payments that will be made to employees in retirement.
The following table provides a brief description of the significant assumptions used in the June 30, 2020 actuarial valuation to determine the updated preliminary fiscal year 2022 Authority’s contributions:
Actuarial Assumptions used for determining updated preliminary fiscal year 2022 Authority’s Contributions
ITEM UPDATED PRELIMINARY FISCAL YEAR 2022 AUTHORITY’S CONTRIBUTIONS
Valuation Date June 30, 2020 (Lag).
Assumed Rate of Return on Investment 7.0% per annum, net of investment expense.
Post-Retirement Mortality Tables adopted by the Boards of Trustees during fiscal year 2019.
Active Service:
Withdrawal, Death, Disability, and Retirement Tables adopted by the Boards of Trustees during fiscal year 2019.
World Trade Center Benefit Estimates of certain obligations.
Salary Increases Tables adopted by the Boards of Trustees during fiscal year 2019.In general, Merit and Promotion Increases plus assumed General Wage Increase of 3.0% per year.
Inflation Consumer Price Index (CPI) of 2.5% per year.
Assumed Cost-of-Living Adjustments 1.5% per year for Tier I, Tier II, Tier IV and certain Tier III and Tier VI retirees. 2.5% per year for certain Tier III and Tier VI retirees.
Liability Loads Estimates of certain obligations.

Notes To Combining Financial Statements as of and for the years ended June 30, 2021 and 2020
New York City Water & Sewer System 2021 62
11. Pension Plans (Continued) In accordance with the Administrative Code of the City of New York and with appropriate practice, the NYCERS Board of Trustees of the actuarially-funded the Pension Plan is to periodically review and adopt certain actuarial assumptions as proposed by the Chief Actuary of the New York City Retirement Systems (the “Actuary”) for use in the determination of Employer Contributions, which are also generally used to determine the total pension liability, as applicable.
The fiscal year 2021 results reflect changes in the actuarial assumptions and methods since the prior year. The changes are primarily the result of an experience study performed by Bolton, Inc. which compared actual experience of the systems to that expected based on the prior set of actuarial assumptions and methods. These new actuarial assumptions and methods were adopted by each of the NYCRS retirement boards in early calendar year 2021.
The long-term expected rate of return was determined using a building-block method in which best-estimate ranges of expected future real rates of return (expected returns, net of the Pension Plan investment expense and inflation) are developed for each major asset class. These ranges are combined to produce the long-term expected rate of return by weighting the expected real rates of return by the target asset allocation percentage and by adding expected inflation.
The target allocation and best estimates of arithmetic real rates of return for each major asset class are summarized in the following table:
ASSET CLASS TARGET ASSET ALLOCATIONLONG-TERM EXPECTED
REAL RATES OF RETURN
U.S. Public Market Equities 27.00% 7.10%
Developed Public Market Equities 12.00% 7.20%
Emerging Public Market Equities 5.00% 9.00%
Fixed Income 30.50% 1.80%
Private Equities 8.00% 11.30%
Private Real Estate 7.50% 6.90%
Infrastructure 4.00% 6.00%
Opportunistic Fixed Income 6.00% 7.10%
Total 100.00%
DISCOUNT RATE
The discount rate used to measure the total pension liability of the Pension Plan as of June 30, 2021 and 2020, was 7% per annum. The projection of cash flows used to determine the discount rate assumed that employee contributions will be made at the rates applicable to the current Tier for each member and that employer contributions will be made based on rates determined by the actuary. Based on those assumptions, the Pension Plan fiduciary net position is projected to be available to make all projected future benefit payments of current active and non-active members. Therefore, the long-term expected rate of return on the pension fund investments was applied to all periods of projected benefit payments to determine the total pension liability.
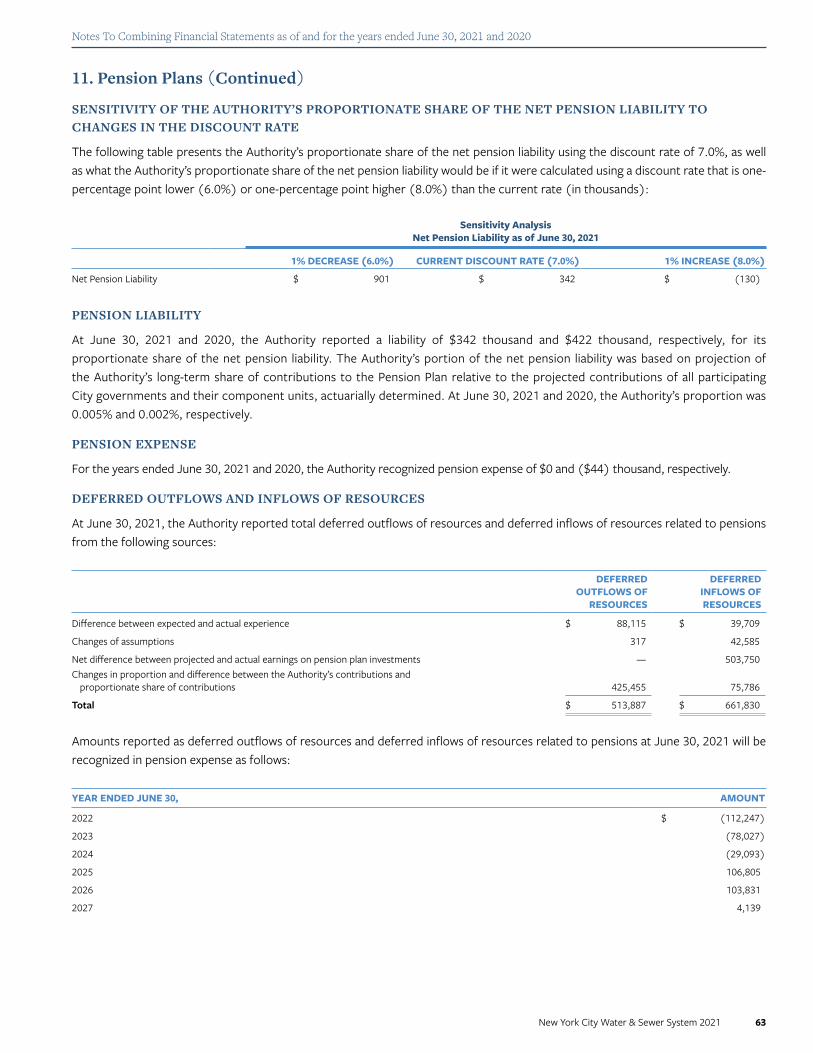
Notes To Combining Financial Statements as of and for the years ended June 30, 2021 and 2020
New York City Water & Sewer System 2021 63
11. Pension Plans (Continued)
SENSITIVITY OF THE AUTHORITY’S PROPORTIONATE SHARE OF THE NET PENSION LIABILITY TO CHANGES IN THE DISCOUNT RATE
The following table presents the Authority’s proportionate share of the net pension liability using the discount rate of 7.0%, as well as what the Authority’s proportionate share of the net pension liability would be if it were calculated using a discount rate that is one-percentage point lower (6.0%) or one-percentage point higher (8.0%) than the current rate (in thousands):
Sensitivity Analysis Net Pension Liability as of June 30, 2021
1% DECREASE (6.0%) CURRENT DISCOUNT RATE (7.0%) 1% INCREASE (8.0%)
Net Pension Liability $ 901 $ 342 $ (130)
PENSION LIABILITY
At June 30, 2021 and 2020, the Authority reported a liability of $342 thousand and $422 thousand, respectively, for its proportionate share of the net pension liability. The Authority’s portion of the net pension liability was based on projection of the Authority’s long-term share of contributions to the Pension Plan relative to the projected contributions of all participating City governments and their component units, actuarially determined. At June 30, 2021 and 2020, the Authority’s proportion was 0.005% and 0.002%, respectively.
PENSION EXPENSE
For the years ended June 30, 2021 and 2020, the Authority recognized pension expense of $0 and ($44) thousand, respectively.
DEFERRED OUTFLOWS AND INFLOWS OF RESOURCES
At June 30, 2021, the Authority reported total deferred outflows of resources and deferred inflows of resources related to pensions from the following sources:
DEFERRED OUTFLOWS OF
RESOURCES
DEFERRED INFLOWS OF RESOURCES
Difference between expected and actual experience $ 88,115 $ 39,709
Changes of assumptions 317 42,585
Net difference between projected and actual earnings on pension plan investments — 503,750 Changes in proportion and difference between the Authority’s contributions and
proportionate share of contributions 425,455 75,786
Total $ 513,887 $ 661,830
Amounts reported as deferred outflows of resources and deferred inflows of resources related to pensions at June 30, 2021 will be recognized in pension expense as follows:
YEAR ENDED JUNE 30, AMOUNT
2022 $ (112,247)
2023 (78,027)
2024 (29,093)
2025 106,805
2026 103,831
2027 4,139
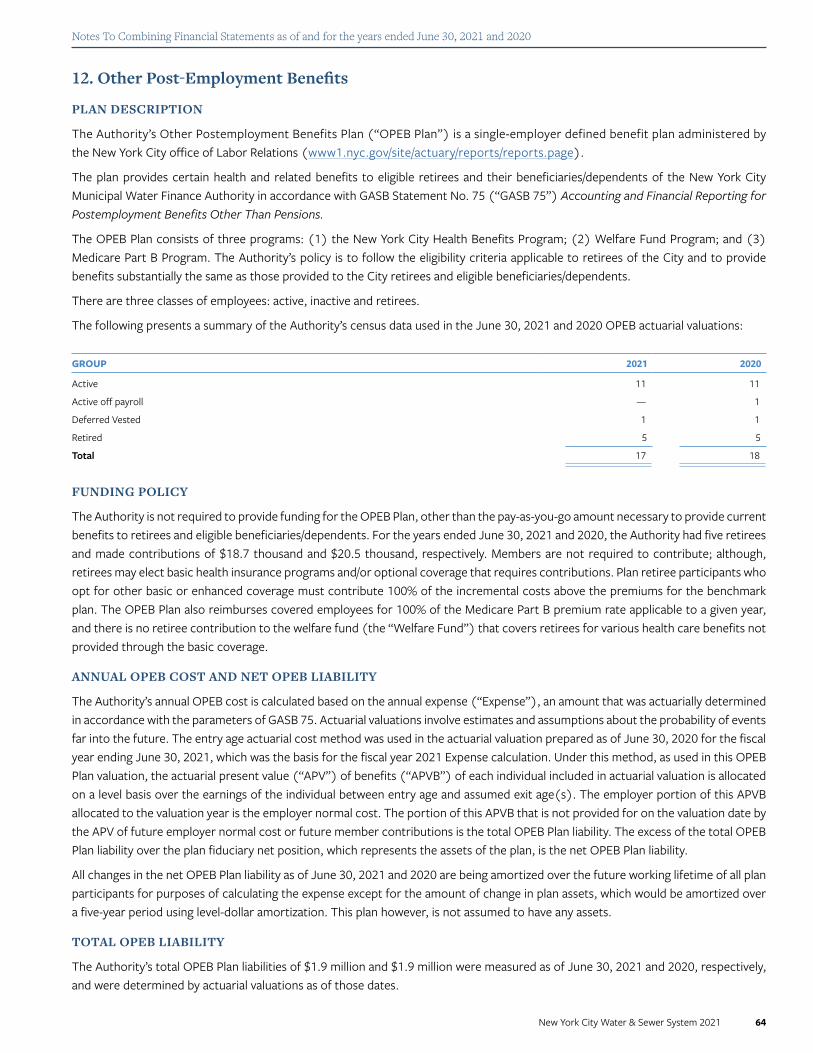
Notes To Combining Financial Statements as of and for the years ended June 30, 2021 and 2020
New York City Water & Sewer System 2021 64
12. Other Post-Employment Benefits
PLAN DESCRIPTION
The Authority’s Other Postemployment Benefits Plan (“OPEB Plan”) is a single-employer defined benefit plan administered by the New York City office of Labor Relations (www1.nyc.gov/site/actuary/reports/reports.page).
The plan provides certain health and related benefits to eligible retirees and their beneficiaries/dependents of the New York City Municipal Water Finance Authority in accordance with GASB Statement No. 75 (“GASB 75”) Accounting and Financial Reporting for Postemployment Benefits Other Than Pensions.
The OPEB Plan consists of three programs: (1) the New York City Health Benefits Program; (2) Welfare Fund Program; and (3) Medicare Part B Program. The Authority’s policy is to follow the eligibility criteria applicable to retirees of the City and to provide benefits substantially the same as those provided to the City retirees and eligible beneficiaries/dependents.
There are three classes of employees: active, inactive and retirees.
The following presents a summary of the Authority’s census data used in the June 30, 2021 and 2020 OPEB actuarial valuations:
GROUP 2021 2020
Active 11 11
Active off payroll — 1
Deferred Vested 1 1
Retired 5 5
Total 17 18
FUNDING POLICY
The Authority is not required to provide funding for the OPEB Plan, other than the pay-as-you-go amount necessary to provide current benefits to retirees and eligible beneficiaries/dependents. For the years ended June 30, 2021 and 2020, the Authority had five retirees and made contributions of $18.7 thousand and $20.5 thousand, respectively. Members are not required to contribute; although, retirees may elect basic health insurance programs and/or optional coverage that requires contributions. Plan retiree participants who opt for other basic or enhanced coverage must contribute 100% of the incremental costs above the premiums for the benchmark plan. The OPEB Plan also reimburses covered employees for 100% of the Medicare Part B premium rate applicable to a given year, and there is no retiree contribution to the welfare fund (the “Welfare Fund”) that covers retirees for various health care benefits not provided through the basic coverage.
ANNUAL OPEB COST AND NET OPEB LIABILITY
The Authority’s annual OPEB cost is calculated based on the annual expense (“Expense”), an amount that was actuarially determined in accordance with the parameters of GASB 75. Actuarial valuations involve estimates and assumptions about the probability of events far into the future. The entry age actuarial cost method was used in the actuarial valuation prepared as of June 30, 2020 for the fiscal year ending June 30, 2021, which was the basis for the fiscal year 2021 Expense calculation. Under this method, as used in this OPEB Plan valuation, the actuarial present value (“APV”) of benefits (“APVB”) of each individual included in actuarial valuation is allocated on a level basis over the earnings of the individual between entry age and assumed exit age(s). The employer portion of this APVB allocated to the valuation year is the employer normal cost. The portion of this APVB that is not provided for on the valuation date by the APV of future employer normal cost or future member contributions is the total OPEB Plan liability. The excess of the total OPEB Plan liability over the plan fiduciary net position, which represents the assets of the plan, is the net OPEB Plan liability.
All changes in the net OPEB Plan liability as of June 30, 2021 and 2020 are being amortized over the future working lifetime of all plan participants for purposes of calculating the expense except for the amount of change in plan assets, which would be amortized over a five-year period using level-dollar amortization. This plan however, is not assumed to have any assets.
TOTAL OPEB LIABILITY
The Authority’s total OPEB Plan liabilities of $1.9 million and $1.9 million were measured as of June 30, 2021 and 2020, respectively, and were determined by actuarial valuations as of those dates.

Notes To Combining Financial Statements as of and for the years ended June 30, 2021 and 2020
New York City Water & Sewer System 2021 65
12. Other Post-Employment Benefits (Continued)The following table shows changes in the Authority’s net OPEB Plan liability for fiscal years 2021 and 2020 (in thousands):
2021 2020
Balance at beginning of the year $ 1,929 $ 1,828
Changes for the year:
Service cost 112 97
Interest 54 53
Difference between expected and actual experience (114) (43)
Changes in assumptions or other inputs (34) 33
Actual benefit payments (19) (21)
Other changes¹ — (18)
Net changes (1) 101
Net OPEB Plan liability—end of the year $ 1,928 $ 1,929
2021 2020
COMPONENTS
Service costs $ 112 $ 97
Interest on the total OPEB Plan liability 54 53
Changes of assumptions 26 (56)
Difference between expected and actual experience (59) 39
Other changes in total OPEB liability¹ — (18)
Total OPEB Plan Expense $ 133 $ 115 ¹Repeal of Cadillac Tax
¹Repeal of Cadillac Tax
The Authority’s annual OPEB Plan expense for fiscal years 2021 and 2020 were as follows (in thousands):
FUNDED STATUS AND FUNDING PROGRESS
As of June 30, 2021, the most recent actuarial measurement date, the cost was 0% funded. The total OPEB Plan liability for benefits was $1.9 million, and the plan fiduciary net position was $0, resulting in a net OPEB Plan liability of $1.9 million. The covered payroll (annual payroll of active employees covered by the OPEB Plan) was $1.2 million, and the ratio of the net OPEB Plan liability to the covered payroll was 159.4%. The impact on the net OPEB Plan liability of a 1% increase or decrease in the discount rate and trend is included on page 72.
ACTUARIAL METHODS ASSUMPTIONS AND OTHER INPUTS
Actuarial valuations of an ongoing plan involve estimates of the value of reported amounts and assumptions about the probability of occurrence of events far into the future, such as assumptions about future employment, demographic, salary increase, mortality, and the healthcare cost trend. The actuarial assumptions used in the fiscal year 2021 and the fiscal year 2020 OPEB Plan valuations are a combination of those used in the New York City Employee Retirement Systems (“NYCERS”) pension actuarial valuations and those specific to the OPEB Plan valuations.
Amounts determined regarding the funded status of the OPEB Plan and the annual Expense of the Authority are subject to continual revision as actual results are compared with past expectations and new estimates are made about the future. Projections of benefits for financial reporting purposes are based on the types of benefits provided at the time of each valuation and the historical pattern of the sharing of benefit costs between the employer and employees to that point. The actuarial methods and assumptions used include techniques that are designed to reduce short-term volatility in total OPEB Plan liability, consistent with the long-term perspective of the calculations.

Notes To Combining Financial Statements as of and for the years ended June 30, 2021 and 2020
New York City Water & Sewer System 2021 66
Valuation Date June 30, 2020
Measurement Date June 30, 2021
Discount Rate 2.18% per annum for the June 30, 2021 measurement date. 2.66% for the June 30, 2020 valuation date.1
Actuarial Cost Method Entry Age Normal cost method, level percent of pay calculated on an individual basis.
Salary Increase 3.00% per annum which includes an inflation rate of 2.50% and a general wage increase rate of 0.50%.For more information see the 2019 Assumptions and Methods reports.
Inflation 2.50%
Per-Capita Claims Costs GHI/EBCBS plans are insured via a Minimum Premium arrangement while the HIP and many of the Other HMOs are community-rated. Costs reflect age-adjusted premiums for all plans.
Based on the 2020 State Report, the costs were projected with trend to the fiscal year starting at the valuation date. This valuation relies on the costs developed for the State valuation as communicated by the State’s actuary, which were assumed to be suitable for this purpose.
12. Other Post-Employment Benefits (Continued)Certain actuarial assumptions used in the pension actuarial valuations of the NYCRS that were adopted by the Boards of the NYCRS during fiscal year 2019. The actuarial assumptions used in the fiscal year 2020 OPEB valuation are a combination of those used in the NYCRS pension actuarial valuations and those specific to the OPEB valuations.
For fiscal year 2019, the OA conducted a full review of the actuarial assumptions and methods used to fund the NYCRS. These reviews led to formalized recommendations titled “Proposed Changes in Actuarial Assumptions and Methods Used in Determining Employer Contributions for Fiscal Years Beginning on and After July 1, 2018 for [NYCRS],” and were adopted by all five of the NYCRS Boards. These are available on the Reports page of the OA website (www.nyc.gov/actuary).
On July 27, 2021, the actuary issued a memorandum titled “Proposed Changes to Actuarial Assumptions and Methods.” The actuarial assumptions and methods described in that memorandum amend certain assumptions and methods from the 2019 A&M. This revised set of actuarial assumptions and methods are referred to as the “Revised 2021 A&M.”
The OPEB Plan-specific actuarial assumptions used in the fiscal year 2021 OPEB Plan valuation are as follows:
1Rates are based solely on the S&P Municipal Bond 20-Year High Grade Rate Index, since the plan has no assets, as per guidance under GASB 75.
Employer premium contribution schedules for the months of July 2020 and January 2021 were reported by the New York City office of Labor Relations (“OLR”). In most cases, the premium contributions remained the same throughout the year. HIP HMO Medicare rates varied by date and by specific Plan options. These variations are the result of differing Medicare reimbursements. The various monthly rates were blended by proportion of enrollment. For other rates, where the January 2021 premium rate was different than the July 2020 premium rate, the valuation assumed that the January 2021 premium rate was more representative of the long-term cost of the arrangement.
These assumptions are generally unchanged from the previous valuation except as noted below. The NYCERS pension assumptions are provided in the five “Silver Books” available on the Reports page of The office of the Actuary website (www.nyc.gov/actuary).
The probability of retirement set out in the 2019 Assumptions and Methods Report (2019 A&M) is assumed to be 100% at either age 63 or 70, depending upon the program of benefits for the individual employee. For the OPEB Plan valuation, 100% of the individuals remaining in service at these ages are assumed to either retire with a benefit or to terminate employment without a benefit, depending upon whether they have attained the requisite service.

Notes To Combining Financial Statements as of and for the years ended June 30, 2021 and 2020
New York City Water & Sewer System 2021 67
12. Other Post-Employment Benefits (Continued)Based on those assumptions, the City’s OPEB Plan’s fiduciary net position was projected to be available to make all projected OPEB Plan payments for current active and inactive employees until 2028. After that time, benefit payments will be funded on a pay-as-you go basis. The discount rate is the single equivalent rate which results in the same present value as discounting future benefit payments made from assets at the long-term expected rate of return and discounting future benefit payments funded on a pay-as-you-go basis at the Municipal Bond 20-year Index Rate.
Results for the OPEB Plans for Component Units are presented using a discount rate of the Municipal Bond 20-year Index Rate, since there is no pre-funding assumed for these plans.
The initial monthly premium rates used in the valuations are shown in the following table:
Monthly Rates
PLAN 2021 2020
HIP HMO
Non-Medicare Single $ 776.01 $ 753.40
Non-Medicare Family 1,901.23 1,845.83
Medicare 181.58 174.52
GHI/EBCBS
Non-Medicare Single 775.66 710.74
Non-Medicare Family 2,035.61 1,866.41
Medicare 194.14 188.20
OTHER HMOs1
Non-Medicare Single 1,160.34 1,102.40
Non-Medicare Family 2,701.42 2,521.20
Medicare Single 291.83 307.58
Medicare Family 576.92 607.20 1Other HMO premiums represent the total premium for medical (not prescription drug) coverage, including retiree contributions.
WELFARE FUND
For the fiscal year 2020 valuation, the Welfare Fund contribution reported for fiscal year 2020, including any reported retroactive amounts, was used as the per capita cost for valuation purposes.
The calculations reflect an additional one-time $100 contribution for fiscal year 2020 in July 2019.
Reported annual contribution amounts for the last two years are shown in Section VII-b to VII-f of the OPEB Plan valuation report dated September 10, 2021.
Welfare Fund rates are based on actual reported union Welfare Fund code for current retirees.
The weighted-average annual contribution rates used for future retirees is shown below.
Annual Rate
2021 2020
NYCERS $ 1,894 $ 1,897
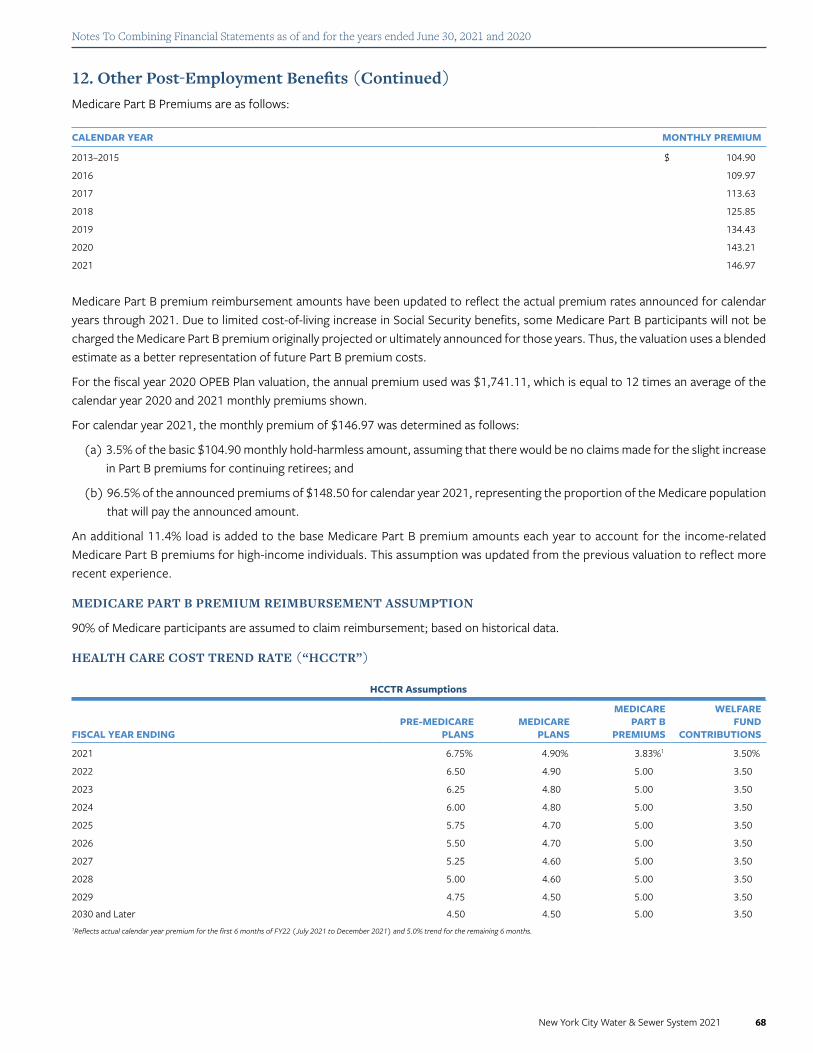
Notes To Combining Financial Statements as of and for the years ended June 30, 2021 and 2020
New York City Water & Sewer System 2021 68
12. Other Post-Employment Benefits (Continued)Medicare Part B Premiums are as follows:
Medicare Part B premium reimbursement amounts have been updated to reflect the actual premium rates announced for calendar years through 2021. Due to limited cost-of-living increase in Social Security benefits, some Medicare Part B participants will not be charged the Medicare Part B premium originally projected or ultimately announced for those years. Thus, the valuation uses a blended estimate as a better representation of future Part B premium costs.
For the fiscal year 2020 OPEB Plan valuation, the annual premium used was $1,741.11, which is equal to 12 times an average of the calendar year 2020 and 2021 monthly premiums shown.
For calendar year 2021, the monthly premium of $146.97 was determined as follows:
(a) 3.5% of the basic $104.90 monthly hold-harmless amount, assuming that there would be no claims made for the slight increase in Part B premiums for continuing retirees; and
(b) 96.5% of the announced premiums of $148.50 for calendar year 2021, representing the proportion of the Medicare population that will pay the announced amount.
An additional 11.4% load is added to the base Medicare Part B premium amounts each year to account for the income-related Medicare Part B premiums for high-income individuals. This assumption was updated from the previous valuation to reflect more recent experience.
MEDICARE PART B PREMIUM REIMBURSEMENT ASSUMPTION
90% of Medicare participants are assumed to claim reimbursement; based on historical data.
HEALTH CARE COST TREND RATE (“HCCTR”)
CALENDAR YEAR MONTHLY PREMIUM
2013–2015 $ 104.90
2016 109.97
2017 113.63
2018 125.85
2019 134.43
2020 143.21
2021 146.97
HCCTR Assumptions
FISCAL YEAR ENDINGPRE-MEDICARE
PLANSMEDICARE
PLANS
MEDICARE PART B
PREMIUMS
WELFARE FUND
CONTRIBUTIONS
2021 6.75% 4.90% 3.83%1 3.50%
2022 6.50 4.90 5.00 3.50
2023 6.25 4.80 5.00 3.50
2024 6.00 4.80 5.00 3.50
2025 5.75 4.70 5.00 3.50
2026 5.50 4.70 5.00 3.50
2027 5.25 4.60 5.00 3.50
2028 5.00 4.60 5.00 3.50
2029 4.75 4.50 5.00 3.50
2030 and Later 4.50 4.50 5.00 3.501Reflects actual calendar year premium for the first 6 months of FY22 (July 2021 to December 2021) and 5.0% trend for the remaining 6 months.

Notes To Combining Financial Statements as of and for the years ended June 30, 2021 and 2020
New York City Water & Sewer System 2021 69
12. Other Post-Employment Benefits (Continued)
AGE AND GENDER-RELATED MORBIDITY
The premiums are age and gender adjusted for GHI/EBCBS, HIP and Other HMOs. The assumed relative costs of coverage are consistent with information presented in the 2013 study Health Care Costs—From Birth to Death, sponsored by the Society of Actuaries.
For non-Medicare costs, a sample of factors used are:
AGE MALE FEMALE AGE MALE FEMALE
20 0.170 0.225 45 0.355 0.495
25 0.146 0.301 50 0.463 0.576
30 0.181 0.428 55 0.608 0.671
35 0.227 0.466 60 0.783 0.783
40 0.286 0.467 64 0.957 0.917
Children costs assumes a factor of 0.229.
The premiums are age and gender adjusted for GHI/EBCBS, HIP, and other HMOs. The assumed relative costs of coverage are consistent with information presented in the 2013 study “Health Care Costs—From Birth to Death,” sponsored by the Society of Actuaries.
Medicare costs prior to age 65 assume an additional disability-related morbidity factor. A sample of factors are:
AGE MALE FEMALE AGE MALE FEMALE
20 0.323 0.422 65 0.919 0.867
25 0.278 0.565 70 0.946 0.885
30 0.346 0.804 75 1.032 0.953
35 0.432 0.876 80 1.122 1.029
40 0.545 0.878 85 1.217 1.116
45 0.676 0.929 90 1.287 1.169
50 0.883 1.082 95 1.304 1.113
55 1.159 1.260 99 and Older 1.281 0.978
60 1.493 1.470
The age adjustment for the non-Medicare GHI/EBCBS premium reflects a 4% reduction in the GHI portion of the monthly premium (with the GHI portion representing $366.18 out of the $775.66 for single coverage and $970.95 out of the $2,035.61 for family coverage for fiscal year 2021 rates) and a 2% reduction in the EBCBS portion of the premium (with the EBCBS portion representing the remainder of the premiums) for the estimated margin that is expected to be returned.
MORTALITY RATES
The mortality improvement scale was updated to MP-2020 to reflect more recent information published by the Society of Actuaries in October 2020.
PARTICIPATION
Active participation assumptions are based on actual elections for current retirees. Portions of current retirees not eligible for Medicare are assumed to change elections upon attaining age 65 based on the patterns of elections of Medicare-eligible retirees. For current retirees who appear to be eligible for health coverage but have not made an election (i.e. non-filers), the valuation reflects single GHI/EBCBS coverage and Part B premium and benefits only, to approximate the obligation if these individuals were to file for coverage.
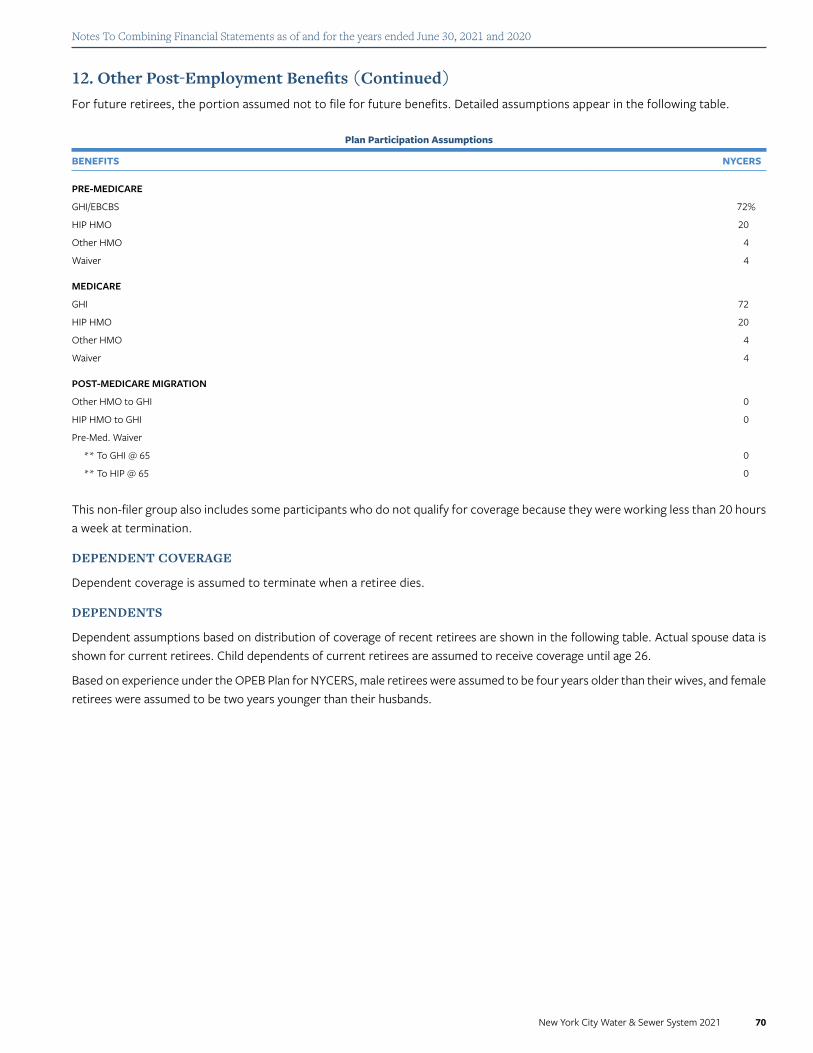
Notes To Combining Financial Statements as of and for the years ended June 30, 2021 and 2020
New York City Water & Sewer System 2021 70
12. Other Post-Employment Benefits (Continued)For future retirees, the portion assumed not to file for future benefits. Detailed assumptions appear in the following table.
Plan Participation Assumptions
BENEFITS NYCERS
PRE-MEDICARE
GHI/EBCBS 72%
HIP HMO 20
Other HMO 4
Waiver 4
MEDICARE
GHI 72
HIP HMO 20
Other HMO 4
Waiver 4
POST-MEDICARE MIGRATION
Other HMO to GHI 0
HIP HMO to GHI 0
Pre-Med. Waiver
** To GHI @ 65 0
** To HIP @ 65 0
This non-filer group also includes some participants who do not qualify for coverage because they were working less than 20 hours a week at termination.
DEPENDENT COVERAGE
Dependent coverage is assumed to terminate when a retiree dies.
DEPENDENTS
Dependent assumptions based on distribution of coverage of recent retirees are shown in the following table. Actual spouse data is shown for current retirees. Child dependents of current retirees are assumed to receive coverage until age 26.
Based on experience under the OPEB Plan for NYCERS, male retirees were assumed to be four years older than their wives, and female retirees were assumed to be two years younger than their husbands.

Notes To Combining Financial Statements as of and for the years ended June 30, 2021 and 2020
New York City Water & Sewer System 2021 71
Dependent Coverage Assumptions
GROUP NYCERS
MALE
Single Coverage 35
Spouse 35
Child/No Spouse 5
Spouse and Child 25
Total 100%
FEMALE
Single Coverage 70
Spouse 20
Child/No Spouse 5
Spouse and Child 5Total 100%
DEMOGRAPHIC ASSUMPTIONS
The actuarial assumptions used in the Fiscal Year 2021 OPEB valuation are a combination of those used in the NYCRS pension actuarial valuations and those specific to the OPEB valuations.
For Fiscal Year 2019, the office of the Actuary (“OA”) conducted a full review of the actuarial assumptions and methods used to fund the NYCRS. These revised assumptions are available on the Reports page of the OA website (www.nyc.gov/actuary) and are referred to as the 2019 A&M Reports.
On July 27, 2021, the Actuary issued a memorandum titled “Proposed Changes to Actuarial Assumptions and Methods.” The actuarial assumptions and methods described in the memorandum amend certain assumptions and methods from the 2019 A&M. This revised set of actuarial assumptions and methods are referred to as the “Revised 2021 A&M.”
COBRA BENEFITS
Although COBRA beneficiaries contribute 102% of “premiums,” the valuation includes an additional estimated cost above the value of their COBRA contribution because COBRA participants typically utilize services at a much higher rate than active participants.
There is no cost to the Authority for COBRA beneficiaries who enroll in community-rated HMOs, including HIP, since these individuals pay their full community rate. However, the City’s costs under the experience-rated GHI/EBCBS coverage are affected by the claims for COBRA-covered individuals.
In order to reflect the cost of COBRA coverage, the cost of excess claims for GHI-covered individuals and families is estimated assuming that 15% of employees not eligible for other benefits elect COBRA coverage for 15 months. A lump-sum COBRA cost of $1,350 was assumed for terminations during fiscal year 2021. This lump-sum amount is increased by the Pre-Medicare HCCTR for future years but is not adjusted for age-related morbidity.
12. Other Post-Employment Benefits (Continued)Children are assumed to be covered for eight years after retirement. For employees eligible to retire based only on service, children are assumed to be covered for an additional five years.

Notes To Combining Financial Statements as of and for the years ended June 30, 2021 and 2020
New York City Water & Sewer System 2021 72
12. Other Post-Employment Benefits (Continued)
ACTIVE/INACTIVE LIABILITIES
40% of the measured liability of the Active/Inactive population. This is roughly equivalent to assuming that 60% of the Active/Inactive members will terminate membership prior to vesting and not receive OPEB.
SENSITIVITY OF THE NET OPEB PLAN LIABILITY TO CHANGES IN THE DISCOUNT RATE
The following table presents the Authority’s proportionate share of the net OPEB Plan liability using the discount rate of 2.18%, as well as what the Authority’s proportionate share of the net OPEB Plan liability would be if it were calculated using a discount rate that is 1% lower (1.18%) or 1% higher (3.18%) than the current rate (in thousands):
Sensitivity Analysis Net OPEB Plan Liability as of June 30, 2021
1% DECREASE (1.18%) CURRENT DISCOUNT RATE (2.18%) 1% INCREASE (3.18%)
Total OPEB Plan Liability $ 2,169 $ 1,928 $ 1,719
Sensitivity Analysis Net OPEB Plan Liability as of June 30, 2021
1% DECREASE (5.75% DECREASING TO 3.50%)
HEALTHCARE COST TREND RATES (6.75% DECREASING TO 4.50%)
1% INCREASE (7.75% DECREASING TO 5.50%)
Total OPEB Plan Liability $ 1,598 $ 1,928 $ 2,363
SENSITIVITY OF THE NET OPEB PLAN LIABILITY TO CHANGES IN THE HEALTHCARE COST TREND RATE
The following presents the total OPEB Plan liability of the Authority, as well as what the Authority’s total OPEB Plan liability would be if it were calculated using healthcare cost trend rates that are 1% lower or 1% higher than the current healthcare cost trend rates:
DEFERRED OUTFLOWS OF RESOURCES AND DEFERRED INFLOWS OF RESOURCES RELATED TO THE OPEB PLAN
At June 30, 2021, the Authority reported deferred outflows of resources and deferred inflows of resources related to the OPEB Plan from the following sources:
DEFERRED OUTFLOWS OF RESOURCES
DEFERRED INFLOWS OF RESOURCES
Difference between expected and actual experience $ 370 $ 240
Changes of assumptions or other inputs 44 350
Total $ 414 $ 590

Notes To Combining Financial Statements as of and for the years ended June 30, 2021 and 2020
New York City Water & Sewer System 2021 73
12. Other Post-Employment Benefits (Continued)Amounts reported as deferred outflows of resources and deferred inflows of resources related to OPEB Plan will be recognized in OPEB expense as follows:
13. Pollution Remediation ObligationsThe System reports pollution remediation obligations (“PROs”) as required by the GASB. The System’s PROs may arise as a result of: (1) federal, state, and local laws and regulations; (2) violations of pollution-related permits or licenses; (3) a determination by the System that there is an imminent endangerment to public health and safety as a result of an existing pollution condition; (4) the System being named in a lawsuit to compel remediation or being identified by a regulator as a party responsible or potentially responsible for remediation; and/or (5) the System’s voluntarily commencement of remediation. As of June 30, 2021 and 2020, the System reported $45.4 million and $29.1 million of liabilities for known PROs, respectively.
The System has estimated these amounts based on the current value of outlays expected to be incurred for pollution remediation, which it is currently obligated to perform. Actual future outlays will differ from the estimated amounts if the prices or techniques for remediation measures change or differ from estimates, if and when additional information about existing pollution conditions becomes known to the System in the future and/or if applicable laws or regulations change.
Remediation outlays for certain pollution conditions currently known to the System are not included in the reported liabilities because they are not yet reasonably estimable. These include certain locations that the System has been informed have been designated under federal law as Superfund sites to address alleged hazardous substances, pollutants, or contaminants at these sites and for which the System may be named as a potentially responsible party for the remediation because there are the System’s facilities operated at these locations.
14. Subsequent EventsOn July 14, 2021, the Authority issued $450 million of fixed rate tax-exempt Second General bonds, Fiscal 2022 Series AA (the “Fiscal 2022 Series AA Bonds”). The proceeds of the Fiscal 2022 Series AA bonds were used to pay for the costs of capital improvements to the System and to pay for the cost of issuance.
On August 5, 2021, the Standby Bond Purchase Agreement between the Authority and MUFG Bank Ltd. under which liquidity support is provided for the Authority’s Water and Sewer System Second General Resolution Revenue Bonds, Adjustable Rate Fiscal 2008 Series BB Subseries BB-1, which was scheduled to expire on September 13, 2021 was extended to September 13, 2024.
On August 5, 2021, the Standby Bond Purchase Agreement between the Authority and JPMorgan Chase Bank, National Association under which liquidity support is provided for the Authority’s Water and Sewer System Second General Resolution Revenue Bonds, Adjustable Rate Fiscal 2014 Series AA, which was scheduled to expire on September 17, 2021 was extended to September 17, 2026.
FISCAL YEAR ENDING JUNE 30, AMOUNT
2021 $ (32.8)
2022 (32.8)
2023 (32.8)
2024 (32.8)
2025 (32.1)
2026 (4.1)
2027 (2.9)
2028 (16.3)
2029 (15.8)
2030 (6.2)
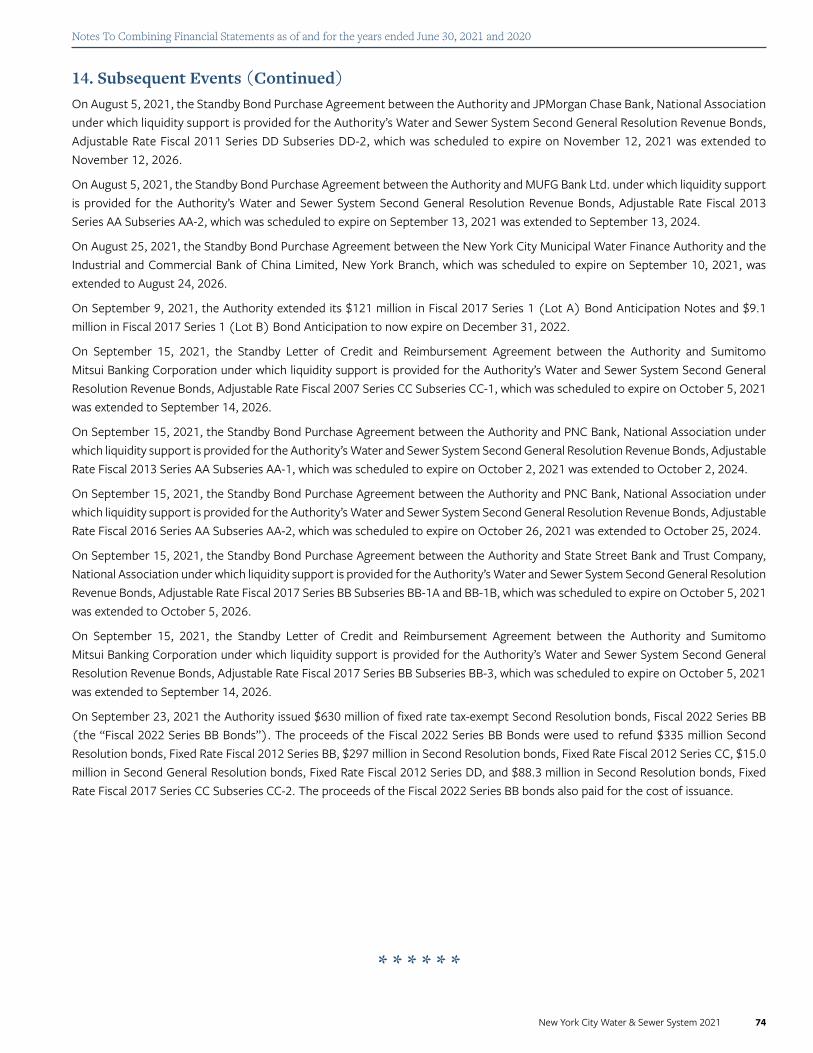
Notes To Combining Financial Statements as of and for the years ended June 30, 2021 and 2020
New York City Water & Sewer System 2021 74
14. Subsequent Events (Continued)On August 5, 2021, the Standby Bond Purchase Agreement between the Authority and JPMorgan Chase Bank, National Association under which liquidity support is provided for the Authority’s Water and Sewer System Second General Resolution Revenue Bonds, Adjustable Rate Fiscal 2011 Series DD Subseries DD-2, which was scheduled to expire on November 12, 2021 was extended to November 12, 2026.
On August 5, 2021, the Standby Bond Purchase Agreement between the Authority and MUFG Bank Ltd. under which liquidity support is provided for the Authority’s Water and Sewer System Second General Resolution Revenue Bonds, Adjustable Rate Fiscal 2013 Series AA Subseries AA-2, which was scheduled to expire on September 13, 2021 was extended to September 13, 2024.
On August 25, 2021, the Standby Bond Purchase Agreement between the New York City Municipal Water Finance Authority and the Industrial and Commercial Bank of China Limited, New York Branch, which was scheduled to expire on September 10, 2021, was extended to August 24, 2026.
On September 9, 2021, the Authority extended its $121 million in Fiscal 2017 Series 1 (Lot A) Bond Anticipation Notes and $9.1 million in Fiscal 2017 Series 1 (Lot B) Bond Anticipation to now expire on December 31, 2022.
On September 15, 2021, the Standby Letter of Credit and Reimbursement Agreement between the Authority and Sumitomo Mitsui Banking Corporation under which liquidity support is provided for the Authority’s Water and Sewer System Second General Resolution Revenue Bonds, Adjustable Rate Fiscal 2007 Series CC Subseries CC-1, which was scheduled to expire on October 5, 2021 was extended to September 14, 2026.
On September 15, 2021, the Standby Bond Purchase Agreement between the Authority and PNC Bank, National Association under which liquidity support is provided for the Authority’s Water and Sewer System Second General Resolution Revenue Bonds, Adjustable Rate Fiscal 2013 Series AA Subseries AA-1, which was scheduled to expire on October 2, 2021 was extended to October 2, 2024.
On September 15, 2021, the Standby Bond Purchase Agreement between the Authority and PNC Bank, National Association under which liquidity support is provided for the Authority’s Water and Sewer System Second General Resolution Revenue Bonds, Adjustable Rate Fiscal 2016 Series AA Subseries AA-2, which was scheduled to expire on October 26, 2021 was extended to October 25, 2024.
On September 15, 2021, the Standby Bond Purchase Agreement between the Authority and State Street Bank and Trust Company, National Association under which liquidity support is provided for the Authority’s Water and Sewer System Second General Resolution Revenue Bonds, Adjustable Rate Fiscal 2017 Series BB Subseries BB-1A and BB-1B, which was scheduled to expire on October 5, 2021 was extended to October 5, 2026.
On September 15, 2021, the Standby Letter of Credit and Reimbursement Agreement between the Authority and Sumitomo Mitsui Banking Corporation under which liquidity support is provided for the Authority’s Water and Sewer System Second General Resolution Revenue Bonds, Adjustable Rate Fiscal 2017 Series BB Subseries BB-3, which was scheduled to expire on October 5, 2021 was extended to September 14, 2026.
On September 23, 2021 the Authority issued $630 million of fixed rate tax-exempt Second Resolution bonds, Fiscal 2022 Series BB (the “Fiscal 2022 Series BB Bonds”). The proceeds of the Fiscal 2022 Series BB Bonds were used to refund $335 million Second Resolution bonds, Fixed Rate Fiscal 2012 Series BB, $297 million in Second Resolution bonds, Fixed Rate Fiscal 2012 Series CC, $15.0 million in Second General Resolution bonds, Fixed Rate Fiscal 2012 Series DD, and $88.3 million in Second Resolution bonds, Fixed Rate Fiscal 2017 Series CC Subseries CC-2. The proceeds of the Fiscal 2022 Series BB bonds also paid for the cost of issuance.
* * * * * *

New York City Water & Sewer System 2021 75
Schedule of Changes For Total OPEB Plan Liability and Related Ratios
AS OF JUNE 30*, (IN THOUSANDS):
The Authority funds OPEB benefits on a pay-as-you-go basis and contributions are not actuarially determined. Therefore, the required supplementary information related to actuarially determined contributions for the 10 most current fiscal years is not applicable.
*This data is presented for those years for which information is available.
TOTAL OPEB PLAN LIABILITY 2021 2020 2019 2018 2017
Service cost $ 112 $ 97 $ 111 $ 94 $ 101
Interest 54 53 47 42 43
Changes of benefit terms — — — — —Differences between expected and
actual experience (114) (43) 572 (106) (96)
Changes of assumptions (34) 33 (336) 35 (222)
Benefits payments (19) (21) (23) (20) (15)
Cadillac tax repeal — (18) — — —
Net change in total OPEB Plan Liability (1) 102 371 45 (189)
Total OPEB Plan liability—beginning 1,929 1,828 1,457 1,412 1,601
Total OPEB Plan Liability—ending $ 1,928 $ 1,929 $ 1,828 $ 1,457 $ 1,412
Covered payroll $ 1,209 $ 1,187 $ 942 $ 859 $ 1,038
Total OPEB Plan Liability as a percentage of covered payroll 159.4% 162.4% 193.9% 169.6% 135.9%
NOTES TO THE SCHEDULE:
Changes of assumption—Changes of assumption and other inputs reflect the effects of changes in the discount rate each period.
The following are the discount rates used in each period:
2021 2.18%
2020 2.66%
2019 2.79%
2018 2.98%
2017 3.13%
Required Supplementary Information (Unaudited)

Required Supplementary Information (Unaudited)
New York City Water & Sewer System 2021 76
2021 2020 2019 2018 2017 2016 2015 2014 2013
Authority's proportion of the net pension liability % 0.005 0.002 0.002 0.003 0.004 0.005 0.005 0.005 0.005
Authority's proportionate share of the net pension liability $ 343 422 393 516 828 1,215 1,012 901 1,154
Authority's covered payroll $ 1,209 1,187 942 859 1,038 1,148 1,289 1,181 1,124Authority’s proportionate
share of the net pension liability as percentage of its covered employee payroll % 28.37 35.55 41.72 60.07 79.77 105.84 78.51 76.29 102.67
Plan fiduciary net position as a percentage of the total pension liability % 93.1 76.9 78.8 78.8 74.8 69.6 73.1 75.3 67.2
2021 2020 2019 2018 2017 2016 2015 2014 2013 2012
Actuarially determined contribution $ 201 75 78 111 136 170 161 141 136 157
Contribution in relation to the actuarially determined contribution $ (201) (75) (78) (111) (136) (170) (161) (141) (136) (157)
Contribution deficiency (excess) $ — — — — — — — — — —
Authority’s covered payroll1 $ 1,209 1,187 942 859 1,038 1,148 1,289 1,181 1,124 919 Contribution as a percentage
of covered payroll % 16.63 6.32 8.28 12.92 13.10 14.81 12.49 11.94 12.10 17.08
Schedule of The Authority’s Proportionate Share of The Net Pension Liability
LAST TEN FISCAL YEARS* (IN THOUSANDS):
Schedule of The Authority’s Pension Contributions
LAST TEN FISCAL YEARS (IN THOUSANDS):
*This data is presented for those years for which information is available.
1Covered payroll data from the actuarial valuation date with one-year lag.
* * * * * *

New York City Water & Sewer System 2021 77
STATISTICAL
Cannonsville

New York City Water & Sewer System 2021 78
FINANCIAL TRENDS
These schedules contain trend information to help the reader understand how the System’s financial performance and well-being have changed over time.
REVENUE CAPACITY
These schedules contain information to help the reader assess the System’s primary revenue source and customer’s utility payments.
DEBT CAPACITY
These schedules present information to help the reader assess the affordability of the System’s current level of outstanding debt and the System’s ability to issue additional debt in the future.
DEMOGRAPHIC AND ECONOMIC INFORMATION
These schedules offer demographic and economic indicators to help the reader understand the environment within which the System’s financial activities take place.
OPERATING INFORMATION
These schedules contain service and infrastructure data to help the reader understand how the information in the System’s financial report relates to the services the System provides.
This part of the New York City Water and Sewer System’s Comprehensive Annual Financial Report presents detailed information to provide context to the information in the combining financial statements, note disclosures and required supplementary information.
Contents

Statistical Section
New York City Water & Sewer System 2021 79
2021 2020 2019 2018 2017 2016 2015 2014 2013 2012
Restated Restated Restated RestatedNet investment in
capital assets $ 598,975 $ 481,129 $ 437,786 $ 116,124 $ (204,403) $ (430,201) $ (598,349) $ (771,165) $ (945,890) $ (840,201)
Restricted for:
Debt service 1,533,139 1,638,121 1,624,802 1,501,529 1,781,994 1,457,332 1,224,925 1,145,505 918,229 687,656
Operations and maintenance 278,207 264,178 260,102 247,304 237,746 250,447 226,383 221,440 212,233 212,885
Unrestrected (deficit) (967,766) (851,252) (983,233) (781,214) (760,384) (543,830) (723,166) (754,581) (668,471) (869,372)
Total net position (deficit) $ 1,442,555 $ 1,532,176 $ 1,339,457 $ 1,083,743 $ 1,054,953 $ 733,748 $ 129,793 $ (158,801) $ (483,899) $ (809,032)
Schedules of Financial Trends Information
NET POSITION (DEFICIT) BY CATEGORY—TEN YEAR TREND
2021 2020 2019 2018 2017 2016 2015 2014 2013 2012
Restated Restated Restated Restated
OPERATING REVENUES
Water supply and distribution $ 1,375,769 $ 1,421,636 $ 1,416,713 $ 1,346,045 $ 1,407,328 $ 1,431,148 $ 1,382,189 $ 1,351,550 $ 1,278,646 $ 1,238,352Sewer collection
and treatment 2,187,473 2,260,401 2,252,574 2,140,214 2,237,652 2,275,524 2,197,679 2,148,964 2,033,047 1,857,527
Bad debt expense (81,390) (31,481) 852 (18,259) (2,620) (4,467) (23,301) (26,979) (16,983) (28,541)
Other operating revenues 174,139 180,336 149,660 187,308 186,355 185,793 211,267 266,996 172,283 140,595
Total operating revenues 3,655,991 3,830,892 3,819,799 3,655,308 3,828,715 3,887,998 3,767,834 3,740,531 3,466,993 3,207,933
OPERATING EXPENSES
Operation and maintenance 1,815,337 1,685,822 1,545,652 1,474,937 1,441,562 1,313,840 1,517,132 1,518,424 1,375,740 1,446,852
Administration and general 46,600 48,550 52,504 55,493 50,749 61,335 55,865 68,936 56,738 47,402
Depreciation and amortization 973,433 1,023,186 908,355 1,042,968 930,482 918,950 1,023,906 740,879 677,560 692,296
Total operating expenses 2,835,370 2,757,558 2,506,511 2,573,398 2,422,793 2,294,125 2,596,903 2,328,239 2,110,038 2,186,550
OPERATING INCOME 820,621 1,073,334 1,313,288 1,081,910 1,405,922 1,593,873 1,170,931 1,412,292 1,356,955 1,021,383
NONOPERATING REVENUES (EXPENSES)
Interest expense (1,064,129) (1,143,998) (1,224,907) (1,205,793) (1,171,594) (1,195,773) (1,264,538) (1,263,305) (1,225,771) (1,246,863)Loss on retirement/
impairment of fixed assets (3,540) (3,676) (2,423) (48,609) (44,452) (4,488) (2,334) (18,815) (20,976) (1,646)
Subsidy income 154,105 165,570 176,346 175,620 166,715 164,502 163,655 174,606 174,862 196,241
Capital distribution (23,090) (26,566) (110,750) (22,789) (45,789) (11,082) (25,337) (39,627) (25,429) (42,005)
Investment income 1,949 79,993 91,712 28,809 4,178 53,322 22,426 50,148 58,793 48,936Net income (loss) before
capital contributions (114,084) 144,657 243,266 9,148 314,980 600,354 64,803 315,299 318,434 (23,954)
Capital contributions 24,463 48,062 12,448 19,642 6,225 4,060 223,791 9,799 7,699 26,903
Change in net position (deficit) (89,621) 192,719 255,714 28,790 321,205 604,414 288,594 325,098 326,133 2,949 Net position (deficit)—
beginning of year 1,532,176 1,339,457 1,083,743 1,054,953 733,748 129,793 (158,801) (483,899) (809,032) (352,888)Restatement of beginning
net position (deficit) — — — — — (459) — — (1,000) (459,093)Net position (deficit)—
end of year $ 1,442,555 $ 1,532,176 $ 1,339,457 $ 1,083,743 $ 1,054,953 $ 733,748 $ 129,793 $ (158,801) $ (483,899) $ (809,032)
CHANGES IN NET POSITION (DEFICIT)—TEN YEAR TREND

Statistical Section
New York City Water & Sewer System 2021 80
INCREASE IN FLAT-RATE WATER/METERED WATER
METERED WATERRATE (PER CCF)¹ SEWER RATE
EFFECTIVE DATE
July 1, 2012 Increased 7.0% 3.39 159% of water charge
July 1, 2013 Increased 5.6% 3.58 159% of water charge
July 1, 2014 Increased 3.4% 3.70 159% of water charge
July 1, 2015 Increased 3.0% 3.81 159% of water charge
July 1, 2016 No rate increase 3.81 159% of water charge
July 1, 2017 No rate increase 3.81 159% of water charge
July 1, 2018 Increased 2.36% 3.90 159% of water charge
July 1, 2019 Increased 2.31% 3.99 159% of water charge
July 1, 2020 No rate increase 3.99 159% of water charge
July 1, 2021 Increased 2.76% 4.10 159% of water charge
FISCAL YEAR TOTAL (MGD)¹WHOLESALE
CUSTOMERS (MGD)¹ CITY (MGD)¹PER CAPITA
(GALS/DAY)²
2012 1,117 109 1,009 123
2013 1,123 110 1,013 124
2014 1,116 111 1,005 123
2015 1,115 112 1,003 123
2016 1,109 112 997 122
2017 1,112 113 999 122
2018 1,114 110 1,004 123
2019 1,090 100 991 120
2020 1,081 103 978 117
2021 1,091 105 986 112
Revenue Capacity Information
¹CCF equals 100 cubic feet or approximately 748 gallons
¹MGD = millions of gallons used per day ²Population source: U.S. Department of Commerce, Bureau of the Census.
WATER AND SEWER RATE INCREASE—TEN YEAR TREND
AVERAGE DAILY WATER CONSUMPTION—TEN YEAR TREND

Stat
istic
al S
ectio
n
New York City Water & Sewer System 2021 81
Fisc
al 2
012
Fisc
al 2
013
Fisc
al 2
014
Fisc
al 2
015
Fisc
al 2
016
Fisc
al 2
017
Fisc
al 2
018
Fisc
al 2
019
Fisc
al 2
020
BILL
EDRA
NK
BILL
EDRA
NK
BILL
EDRA
NK
BILL
EDRA
NK
BILL
EDRA
NK
BILL
EDRA
NK
BILL
EDRA
NK
BILL
EDRA
NK
BILL
EDRA
NK
New
Yor
k Ci
ty H
ousin
g Au
thor
ity$
155,
076
1$
168,
757
1$
178,
711
1$
182,
254
1$
188,
667
1$
189,
229
1$
202,
308
1$
190,
967
1$
182,
026
1
The
City
of N
ew Y
ork
90,6
662
97,1
512
102,
592
210
9,85
52
111,
300
211
1,30
02
111,
300
211
5,69
92
116,
559
2
Cons
olid
ated
Edi
son
Inc.
13,1
034
15,1
564
11,9
766
15,5
844
21,8
873
18,8
553
20,5
124
19,8
243
18,9
524
The
City
Uni
vers
ity o
f New
Yor
k—
——
——
—6,
354
10—
—
Pete
r Coo
per V
illage
/Stu
yves
ant T
own
7,18
97
7,26
08
7,83
87
7,77
710
8,53
18
——
——
New
Yor
k Ci
ty H
ealth
and
H
ospi
tals
Corp
.12
,140
512
,269
612
,679
513
,331
613
,918
413
,497
612
,871
613
,135
613
,829
6
New
Yor
k Pr
esby
teria
n H
ospi
tal
5,05
48
6,36
29
7,22
68
8,01
89
7,43
79
—10
,215
79,
625
711
,090
7
Visy
Pap
er3,
197
10—
——
——
——
—
Colu
mbi
a Un
iver
sity
13,5
853
13,9
585
——
6,61
810
6,79
79
8,08
38
9,55
88
10,8
928
Port
Aut
horit
y of
NY
and
NJ
10,5
886
11,0
227
14,1
934
15,4
115
10,5
696
13,5
165
14,0
855
14,7
305
14,8
115
NYS
Offi
ce o
f Men
tal H
ealth
4,45
39
——
——
——
——
Met
ropo
litan
Tra
nspo
rtat
ion
Auth
ority
——
——
—6,
538
10—
——
Rive
r Bay
Cor
pora
tion
(Co-
op C
ity)
—17
,426
318
,200
315
,584
312
,375
517
,730
421
,455
319
,782
419
,823
3
New
Yor
k Ci
ty T
rans
it—Su
bway
—5,
930
106,
262
1012
,647
7—
—6,
646
96,
803
910
,599
9
Star
rett
City
, Inc
——
7,14
19
——
8,48
18
——
—
The
Park
ches
ter C
ondo
(N
orth
& S
outh
)—
——
8,65
68
8,75
27
9,48
77
——
—
BPP
Stre
et O
wne
r, LL
C—
——
——
——
5,81
610
5,86
210
TE
N L
AR
GE
ST C
UST
OM
ER
S (I
N T
HO
USA
ND
S)
Rev
enue
Cap
acit
y In
form
atio
n (C
onti
nued
)
Not
e: D
ata
for F
iscal
202
1 w
as n
ot a
vaila
ble
at th
e tim
e th
e Co
mpr
ehen
sive
Annu
al F
inan
cial
Rep
ort w
as p
ublis
hed.

Statistical Section
New York City Water & Sewer System 2021 82
Debt Service Requirements¹
YEAR CASH RECEIPTS $ PRINCIPAL $ INTEREST $ TOTAL $
FIRST RESOLUTIONDEBT SERVICE
COVERAGE
SECOND RESOLUTIONDEBT SERVICE
COVERAGE²
2012 3,270,827 378,042 700,658 1,078,700 7.41 2.98
2013 3,512,710 343,287 617,189 960,476 10.32 3.61
2014 3,728,823 359,259 415,611 774,870 12.62 4.76
2015 3,911,463 291,955 163,574 455,529 19.72 8.49
2016 3,960,660 398,877 125,945 524,822 32.81 7.46
2017 3,981,404 365,383 131,018 496,401 36.97 7.92
2018 3,722,423 359,501 — 359,501 62.81 10.21
2019 3,959,550 424,794 230,497 655,291 51.41 5.97
2020 3,890,496 482,386 104,651 587,037 37.09 6.55
2021 3,681,981 214,664 60,934 275,598 429.20 13.19
Schedules of Debt Capacity Information
¹ Debt service requirements include First Resolution debt service and Second Resolution debt service, net of subsidy from the NYS Environmental Facilities Corporation and surplus revenues carried forward from the prior fiscal year.
²Revenue for coverage purposes for Second Resolution is net of Authority expenses.
N/A = data not available
YEAR TOTAL DEBT OUTSTANDING $ DEBT PER CAPITA
2012 27,992,861 3.35
2013 28,864,590 3.44
2014 30,144,755 3.57
2015 29,941,881 3.54
2016 30,629,355 3.61
2017 31,266,750 3.71
2018 31,474,932 3.75
2019 31,672,249 3.80
2020 33,090,405 4.01
2021 33,597,888 N/A
REVENUE BOND COVERAGE—LAST TEN FISCAL YEARS
Years Ended June 30, 2012–2021 (in thousands):
RATIO OF DEBT OUTSTANDING—TEN YEAR TREND
Years Ended June 30, 2012–2021 (in thousands):
AVERAGE NUMBER OF CUSTOMERS BILLED BY THE SYSTEM
Years Ended June 30, 2012–2021:
2012 2013 2014 2015 2016 2017 2018 2019 2020 2021
Residential 761,700 761,400 762,300 758,300 758,500 759,200 759,550 759,850 759,875 760,050
Commercial & Industrial 74,300 74,100 74,000 76,300 75,800 75,500 75,700 75,150 75,625 75,650
Total accounts 836,000 835,500 836,300 834,600 834,300 834,700 835,250 835,000 835,500 835,700
Metered accounts 789,000 792,000 792,000 793,000 797,500 799,500 801,600 802,000 803,300 804,000
Percent meter billed 94% 95% 95% 95% 96% 96% 96% 96% 96% 96%Sources: ¹Historical NYCMWFA official statements and ²DEP Bureau of Customer Service.

Statistical Section
New York City Water & Sewer System 2021 83
YEAR UNITED STATES PERCENTAGE CHANGE
FROM PRIOR PERIODCITY OF
NEW YORKPERCENTAGE CHANGE
FROM PRIOR PERIOD
2011 311,556,874 0.72 8,272,963 1.01
2012 313,830,990 0.73 8,348,032 0.91
2013 315,993,715 0.69 8,398,739 0.61
2014 318,301,008 0.73 8,437,387 0.46
2015 320,635,163 0.73 8,468,181 0.36
2016 322,941,311 0.72 8,475,976 0.09
2017 324,985,539 0.63 8,438,271 -0.44
2018 326,687,501 0.52 8,398,748 -0.47
2019 328,239,523 0.48 8,336,817 -0.63
2020 329,484,123 0.35 8,253,213 -1.08Source: U.S. Department of Commerce, Bureau of Economic Analysis. US Census Bureau
Demographic and Economic Information
Personal Income Per Capita
YEARUNITED STATES
($ BILLIONS)
CITY OFNEW YORK
($ BILLIONS)
NEW YORK CITY AS A PERCENTAGEOF THE UNITED STATES
UNITED STATES ($)
CITY OFNEW YORK ($)
NEW YORK CITY AS A PERCENTAGEOF THE UNITED STATES
2011 13,315 457.21 3.43 42,735 55,266 129.32
2012 13,998 479.43 3.42 44,599 57,430 128.77
2013 14,176 492.44 3.47 44,851 58,633 130.73
2014 14,983 518.20 3.46 47,058 61,417 130.51
2015 15,717 541.65 3.45 48,978 63,963 130.60
2016 16,152 567.59 3.52 49,870 66,964 134.28
2017 16,938 616.94 3.66 51,885 73,113 140.91
2018 17,681 624.52 3.53 54,098 74,378 137.49
2019 18,402 642.64 3.49 56,047 77,028 137.43
2020 19,607 677.56 3.46 59,510 82,097 137.95
POPULATION—TEN YEAR TREND
POPULATION—TEN YEAR TREND
N/A = data not availableSource: U.S. Department of Commerce, Bureau of Economic Analysis.Amounts as of November 17, 2021
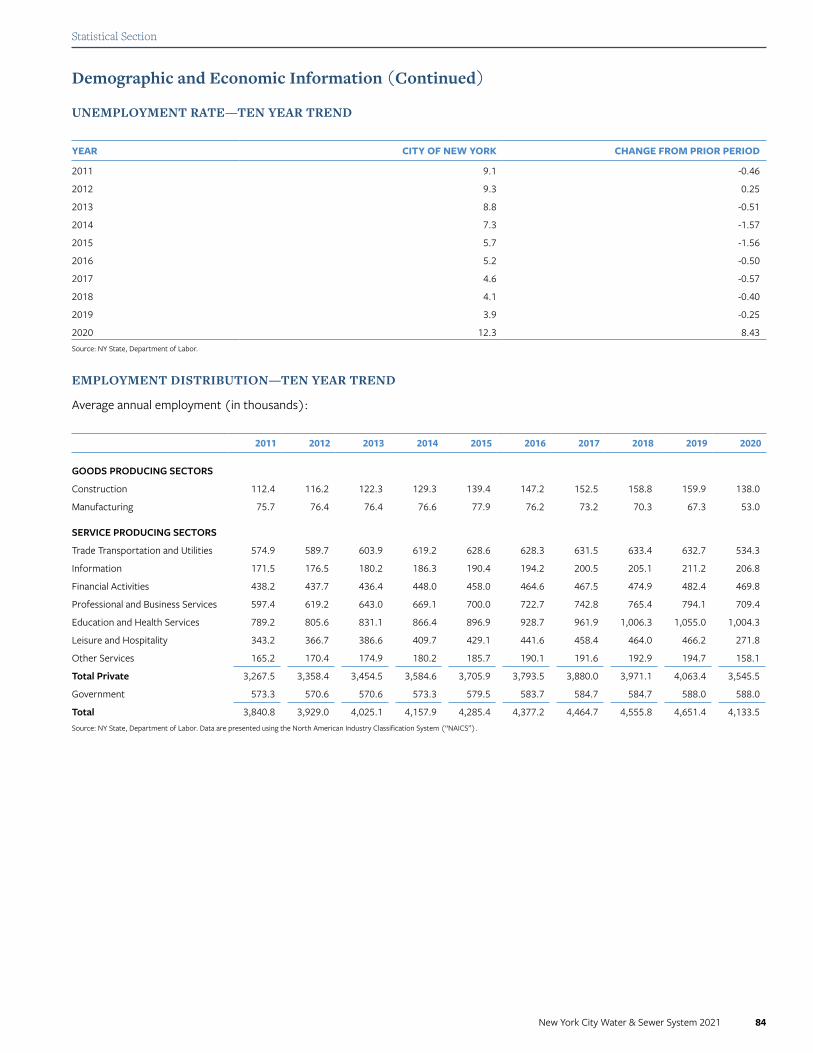
Statistical Section
New York City Water & Sewer System 2021 84
Source: NY State, Department of Labor.
YEAR CITY OF NEW YORK CHANGE FROM PRIOR PERIOD
2011 9.1 -0.46
2012 9.3 0.25
2013 8.8 -0.51
2014 7.3 -1.57
2015 5.7 -1.56
2016 5.2 -0.50
2017 4.6 -0.57
2018 4.1 -0.40
2019 3.9 -0.25
2020 12.3 8.43
2011 2012 2013 2014 2015 2016 2017 2018 2019 2020
GOODS PRODUCING SECTORS
Construction 112.4 116.2 122.3 129.3 139.4 147.2 152.5 158.8 159.9 138.0
Manufacturing 75.7 76.4 76.4 76.6 77.9 76.2 73.2 70.3 67.3 53.0
SERVICE PRODUCING SECTORS
Trade Transportation and Utilities 574.9 589.7 603.9 619.2 628.6 628.3 631.5 633.4 632.7 534.3
Information 171.5 176.5 180.2 186.3 190.4 194.2 200.5 205.1 211.2 206.8
Financial Activities 438.2 437.7 436.4 448.0 458.0 464.6 467.5 474.9 482.4 469.8
Professional and Business Services 597.4 619.2 643.0 669.1 700.0 722.7 742.8 765.4 794.1 709.4
Education and Health Services 789.2 805.6 831.1 866.4 896.9 928.7 961.9 1,006.3 1,055.0 1,004.3
Leisure and Hospitality 343.2 366.7 386.6 409.7 429.1 441.6 458.4 464.0 466.2 271.8
Other Services 165.2 170.4 174.9 180.2 185.7 190.1 191.6 192.9 194.7 158.1
Total Private 3,267.5 3,358.4 3,454.5 3,584.6 3,705.9 3,793.5 3,880.0 3,971.1 4,063.4 3,545.5
Government 573.3 570.6 570.6 573.3 579.5 583.7 584.7 584.7 588.0 588.0
Total 3,840.8 3,929.0 4,025.1 4,157.9 4,285.4 4,377.2 4,464.7 4,555.8 4,651.4 4,133.5
EMPLOYMENT DISTRIBUTION—TEN YEAR TREND
Average annual employment (in thousands):
Source: NY State, Department of Labor. Data are presented using the North American Industry Classification System (“NAICS”).
Demographic and Economic Information (Continued)
UNEMPLOYMENT RATE—TEN YEAR TREND
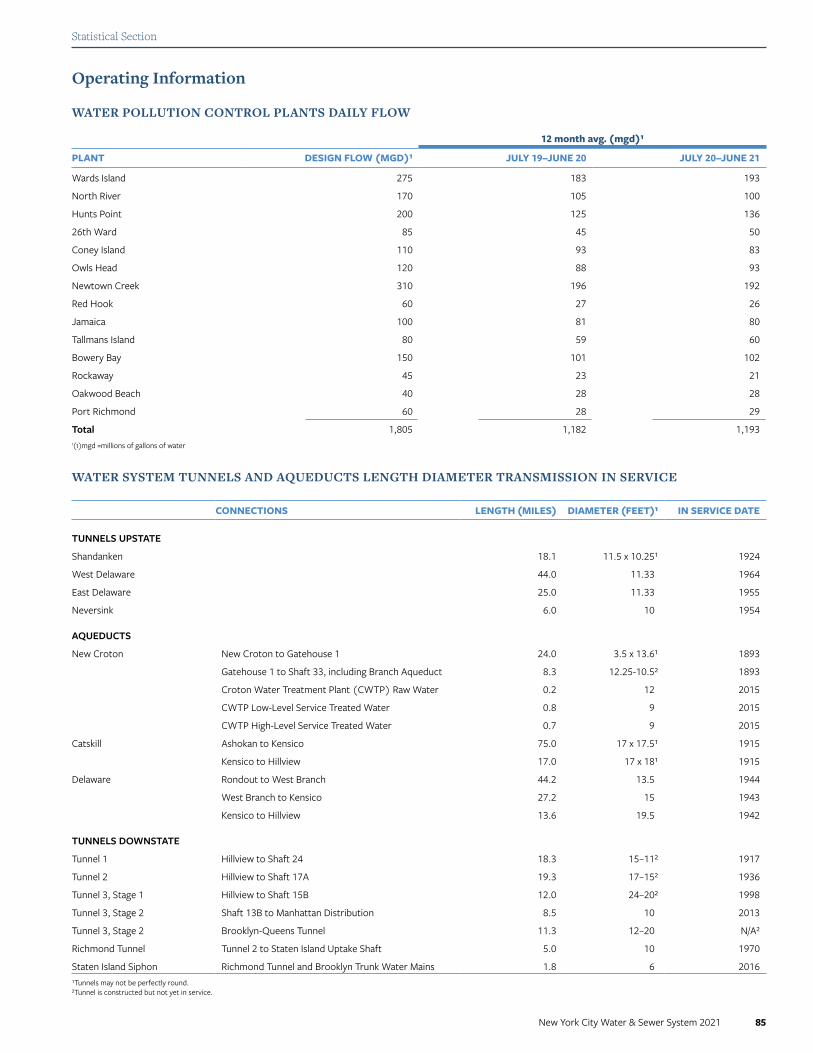
Statistical Section
New York City Water & Sewer System 2021 85
Operating Information
WATER POLLUTION CONTROL PLANTS DAILY FLOW
CONNECTIONS LENGTH (MILES) DIAMETER (FEET)¹ IN SERVICE DATE
TUNNELS UPSTATE
Shandanken 18.1 11.5 x 10.25¹ 1924
West Delaware 44.0 11.33 1964
East Delaware 25.0 11.33 1955
Neversink 6.0 10 1954
AQUEDUCTS
New Croton New Croton to Gatehouse 1 24.0 3.5 x 13.6¹ 1893
Gatehouse 1 to Shaft 33, including Branch Aqueduct 8.3 12.25-10.5² 1893
Croton Water Treatment Plant (CWTP) Raw Water 0.2 12 2015
CWTP Low-Level Service Treated Water 0.8 9 2015
CWTP High-Level Service Treated Water 0.7 9 2015
Catskill Ashokan to Kensico 75.0 17 x 17.5¹ 1915
Kensico to Hillview 17.0 17 x 18¹ 1915
Delaware Rondout to West Branch 44.2 13.5 1944
West Branch to Kensico 27.2 15 1943
Kensico to Hillview 13.6 19.5 1942
TUNNELS DOWNSTATE
Tunnel 1 Hillview to Shaft 24 18.3 15–11² 1917
Tunnel 2 Hillview to Shaft 17A 19.3 17–15² 1936
Tunnel 3, Stage 1 Hillview to Shaft 15B 12.0 24–20² 1998
Tunnel 3, Stage 2 Shaft 13B to Manhattan Distribution 8.5 10 2013
Tunnel 3, Stage 2 Brooklyn-Queens Tunnel 11.3 12–20 N/A²
Richmond Tunnel Tunnel 2 to Staten Island Uptake Shaft 5.0 10 1970
Staten Island Siphon Richmond Tunnel and Brooklyn Trunk Water Mains 1.8 6 2016¹Tunnels may not be perfectly round. ²Tunnel is constructed but not yet in service.
1(1)mgd =millions of gallons of water
WATER SYSTEM TUNNELS AND AQUEDUCTS LENGTH DIAMETER TRANSMISSION IN SERVICE
12 month avg. (mgd)¹
PLANT DESIGN FLOW (MGD)¹ JULY 19–JUNE 20 JULY 20–JUNE 21
Wards Island 275 183 193
North River 170 105 100
Hunts Point 200 125 136
26th Ward 85 45 50
Coney Island 110 93 83
Owls Head 120 88 93
Newtown Creek 310 196 192
Red Hook 60 27 26
Jamaica 100 81 80
Tallmans Island 80 59 60
Bowery Bay 150 101 102
Rockaway 45 23 21
Oakwood Beach 40 28 28
Port Richmond 60 28 29
Total 1,805 1,182 1,193
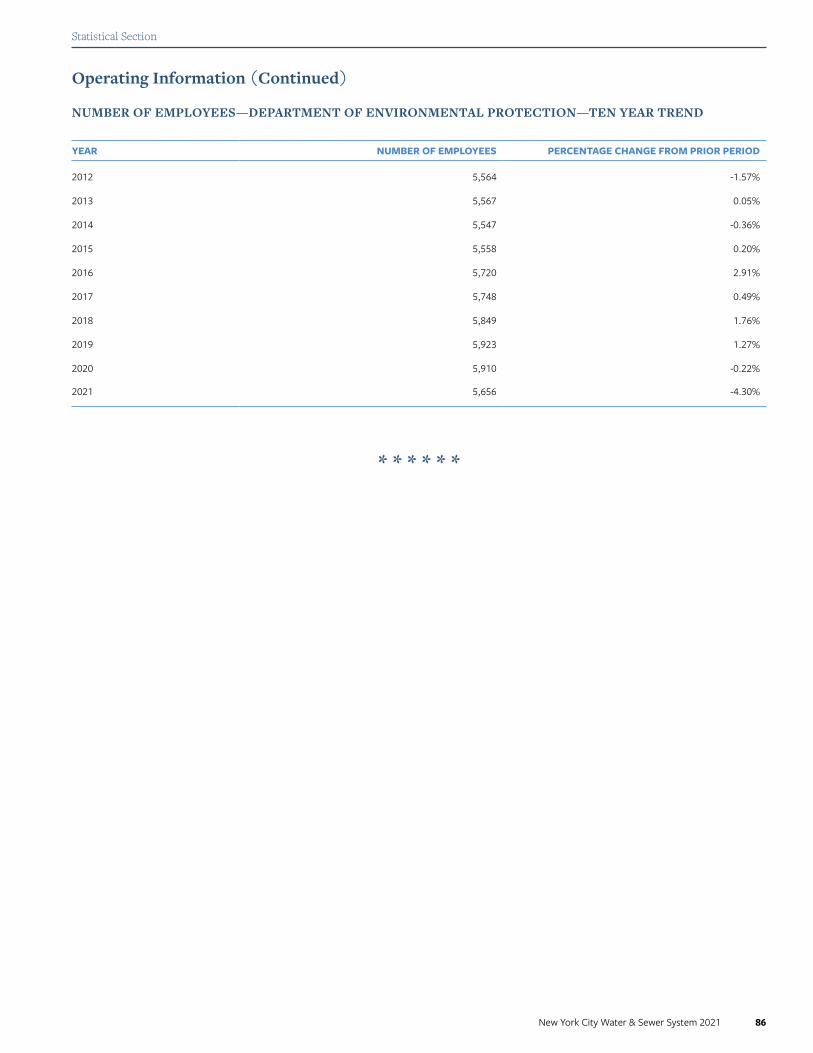
Statistical Section
New York City Water & Sewer System 2021 86
YEAR NUMBER OF EMPLOYEES PERCENTAGE CHANGE FROM PRIOR PERIOD
2012 5,564 -1.57%
2013 5,567 0.05%
2014 5,547 -0.36%
2015 5,558 0.20%
2016 5,720 2.91%
2017 5,748 0.49%
2018 5,849 1.76%
2019 5,923 1.27%
2020 5,910 -0.22%
2021 5,656 -4.30%
NUMBER OF EMPLOYEES—DEPARTMENT OF ENVIRONMENTAL PROTECTION—TEN YEAR TREND
Operating Information (Continued)
* * * * * *

New York City Water and Sewer System255 Greenwich Street, 6th Floor New York, NY 10007