Embed Size (px)
Citation preview
Combining Business Intelligence,
Indicators, and the User Requirements
Notation for Performance Monitoring
Iman Johari Shirazi
Thesis submitted to the
Faculty of Graduate and Postdoctoral Studies
in partial fulfillment of the requirements for the degree of
M.Sc. in System Science
University of Ottawa
Ottawa, Ontario, Canada
November 2012
© Iman Johari Shirazi, Ottawa, Canada, 2012
i
Abstract
Organizations use Business Intelligence (BI) systems to monitor how well they are meet-
ing their goals and objectives. Yet, very often BI systems do not include clear models of
the organization’s goals or of how to measure whether they are satisfied or not. Several
researchers now attempt to integrate goal models into BI systems, but there are still major
challenges related to how to get access to the BI data to populate the part of the goal
model (often indicators) used to assess goal satisfaction.
This thesis explores a new approach to integrate BI systems with goal models. In
particular, it explores the integration of IBM Cognos Business Intelligence, a leading BI
tool, with an Eclipse-based goal modeling tool named jUCMNav. jUCMNav is an open
source graphical editor for the User Requirements Notation (URN), which includes the
Use Case Map notation for scenarios and processes and the Goal-oriented Requirement
Language for business objectives. URN was recently extended with the concept of Key
Performance Indicator (KPI) to enable performance assessment and monitoring of busi-
ness processes. In jUCMNav, KPIs are currently calculated or modified manually. The
new integration proposed in this thesis maps these KPIs to report elements that are gener-
ated automatically by Cognos based on the model defined in jUCMNav at runtime, with
minimum effort. We are using IBM Cognos Mashup Service, which includes web ser-
vices that enable the retrieval of report elements at the most granular level. This trans-
formation provides managers and analysts with useful goal-oriented and process-oriented
monitoring views fed by just-in-time BI information. This new solution also automates
retrieving data from Cognos servers, which helps reducing the high costs usually caused
by the amount of manual work required otherwise.
The novel approach presented in this thesis avoids manual report generation and
minimizes any contract with respect to the location of manually created reports, hence
leading to better usability and performance. The approach and its tool support are illus-
trated with an ongoing example, validated with a case study, and verified through testing.

ii
Acknowledgment
I wish to thank my supervisors, Dr. Daniel Amyot and Dr. Gregory Richards, for provid-
ing me with necessary resources and for sharing their vision with me.
I wish to thank my colleague Alireza Pourshahid who helped me throughout the
research.
I also want to thank my manager at IBM, Mrs. Emilia Clein, for her support dur-
ing my graduate studies.
Last but not least, I want to thank my parents for their unconditional love and
support. I dedicate this thesis to them.
iii
Table of Contents
Abstract .......................................................................................................................... i
Acknowledgment ...........................................................................................................ii
Table of Contents ........................................................................................................ iii
List of Figures ............................................................................................................... vi
List of Tables ..............................................................................................................viii
List of Acronyms .......................................................................................................... ix
Chapter 1 Introduction ................................................................................................ 1
1.1 Context and Motivation .................................................................................... 1
1.2 Problem Statement ........................................................................................... 2
1.3 Thesis Methodology ......................................................................................... 3
1.4 Thesis Contributions ........................................................................................ 5
1.5 Thesis Outline .................................................................................................. 6
Chapter 2 Background ................................................................................................. 8
2.1 Business Intelligence ........................................................................................ 8
2.1.1 IBM Cognos Business Intelligence Tool ................................................................. 9
2.1.2 IBM Cognos Software Development Kit (SDK) ................................................... 10
2.1.3 IBM Cognos Mashup Service (CMS) ................................................................... 11
2.1.4 Data Modeling ..................................................................................................... 13
2.2 User Requirements Notation .......................................................................... 15
2.2.1 Use Case Maps ..................................................................................................... 16
2.2.2 Goal-oriented Requirement Language................................................................... 16
2.2.3 Links Between GRL and UCM ............................................................................. 19
2.2.4 jUCMNav: a Graphical URN Modeling Tool ........................................................ 19
2.3 Business Process Management ....................................................................... 21
2.3.1 Roles and Actors .................................................................................................. 22
2.3.2 Business Process Management System ................................................................. 22
2.3.3 BPM Lifecycle ..................................................................................................... 24
2.3.4 Key Performance Indicators (KPIs) ...................................................................... 25
2.3.5 KPIs and jUCMNAV ........................................................................................... 27
2.4 Chapter Summary .......................................................................................... 30
iv
Chapter 3 Related Work ............................................................................................ 31
3.1 Current Approach from Chen (2008) ............................................................. 31
3.1.1 Concepts and User Interface ................................................................................. 31
3.1.2 KPIs and Reports: Concepts and Issues................................................................. 36
3.2 Other Related Research ................................................................................. 38
3.3 Chapter Summary .......................................................................................... 42
Chapter 4 New Tool-Supported Approach ............................................................... 43
4.1 Limitations of the Current Implementation ..................................................... 43
4.2 Design Decisions ........................................................................................... 44
4.3 Proposed Solution .......................................................................................... 46
4.3.1 Authentication and Configuration ......................................................................... 46
4.3.2 Dynamic Report Generation ................................................................................. 47
4.3.3 Model Design ....................................................................................................... 53
4.3.4 Model Validation ................................................................................................. 57
4.4 Architecture ................................................................................................... 59
4.5 Mechanism ..................................................................................................... 60
4.6 Chapter Summary .......................................................................................... 63
Chapter 5 Assessment ................................................................................................ 65
5.1 Two Alternative Approaches .......................................................................... 65
5.1.1 The Manual Approach .......................................................................................... 66
5.1.2 The Single Automatic Approach ........................................................................... 67
5.2 Comparison ................................................................................................... 67
5.2.1 Manual Report Authoring ..................................................................................... 68
5.2.2 Web Service Deployment ..................................................................................... 68
5.2.3 Performance ......................................................................................................... 69
5.2.4 Maintenance ......................................................................................................... 69
5.2.5 On-The-Fly KPI Modifications ............................................................................. 69
5.2.6 Multiple Server Support ....................................................................................... 70
5.3 Chapter Summary .......................................................................................... 70
Chapter 6 Case Study ................................................................................................ 71
6.1 Context and Source Goal Model..................................................................... 71
6.2 Using the New Tool-Supported Approach ...................................................... 74
6.3 Chapter Summary .......................................................................................... 83
Chapter 7 Testing ....................................................................................................... 84
7.1 Functional Testing ......................................................................................... 85
7.1.1 Functional Testing of Cognos SDK Usage ............................................................ 85
7.1.2 Functional Testing of Cognos Mashup Service Usage ........................................... 86
v
7.1.3 Functional Testing for jUCMNav API .................................................................. 87
7.2 Unit Testing ................................................................................................... 87
7.2.1 Unit Testing for seg.jUCMNav.views.kpi.KPIListView ........................................ 88
7.2.2 Unit Testing for grl.kpi.sdkReport.GenericReport.GenericReport: ........................ 88
7.3 Constraint Testing.......................................................................................... 90
7.4 Chapter Summary .......................................................................................... 91
Chapter 8 Conclusions ............................................................................................... 92
8.1 Summary of Contributions ............................................................................. 92
8.2 Limitations and Future Work ......................................................................... 93
References .................................................................................................................... 96
Appendix A: OCL Constraints ................................................................................. 101
vi
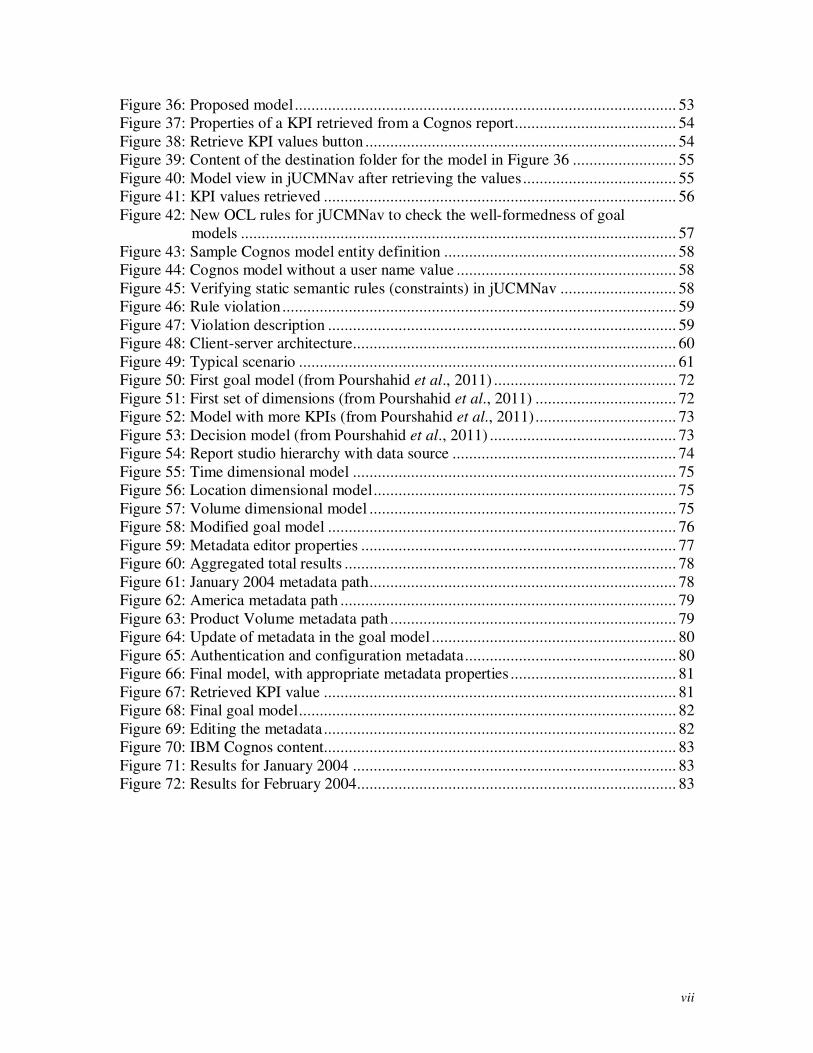
List of Figures
Figure 1: Design science research methodology (from Peffers et al., 2007) ..................... 4
Figure 2: Design science research methodology as used in this thesis .............................. 5
Figure 3: Sample Cognos report results in HTML format (from Sleigh and Johari,
2010) ........................................................................................................... 12
Figure 4: Cognos report results overlaid on Google Earth using IBM CMS (from
Sleigh and Johari, 2010) ............................................................................... 12
Figure 5: Relationship between data sources, model and BI portal (from IBM, 2012a) .. 15
Figure 6: Summary of the GRL notation elements (from ITU-T, 2008).......................... 17
Figure 7: GRL model example (from Pourshahid et al., 2011) ....................................... 18
Figure 8: jUCMNav user interface ................................................................................. 20
Figure 9: Sequence of activities in a process (from van der Aalst et al., 2003) ............... 21
Figure 10: Actors and activities (from van der Aalst et al., 2003) .................................. 22
Figure 11: BPM lifecycle (from Chen, 2008) ................................................................. 24
Figure 12: Essential measures in corporations (from Rao Vallabhaneni, 2008) .............. 26
Figure 13: KPI/indicator notation .................................................................................. 27
Figure 14: KPI components in jUCMNav (from Chen, 2008) ........................................ 28
Figure 15: KPI composition ........................................................................................... 29
Figure 16: KPIs and soft goals ....................................................................................... 29
Figure 17: KPI in jUCMNav (from Chen, 2008) ............................................................ 31
Figure 18: List of KPIs in jUCMNav (from Chen, 2008) ............................................... 32
Figure 19: KPI groups in jUCMNav (from Chen, 2008) ................................................ 33
Figure 20: KPI properties in jUCMNav (from Chen, 2008) ........................................... 34
Figure 21: GRL strategies in jUCMNav (from Chen, 2008) ........................................... 34
Figure 22: Evaluation transformation for KPIs (from Chen, 2008) ................................. 35
Figure 23: Multiple views of KPIs, strategies and model in jUCMNav (from Chen,
2008) ........................................................................................................... 36
Figure 24: Folder structure of strategies and KPI ........................................................... 37
Figure 25: Current architecture (from Chen, 2008) ........................................................ 38
Figure 26: The Balanced Goalcards methodological framework (from Siena et al.,
2008) ........................................................................................................... 40
Figure 27: Monitoring method (from Martinez et al., 2010) ........................................... 41
Figure 28: Metadata editor: addition of a model name and other server characteristics... 46
Figure 29: Report result, with desired value ................................................................... 47
Figure 30: Metadata editor: addition of row information to a GRL dimension ............... 48
Figure 31: Metadata editor: addition of column information to a GRL dimension .......... 49
Figure 32: Metadata editor: addition of measure information to a GRL dimension ......... 49
Figure 33: Report studio, data hierarchy ........................................................................ 50
Figure 34: Organization dimension ................................................................................ 51
Figure 35: Data hierarchy .............................................................................................. 52
vii
Figure 36: Proposed model ............................................................................................ 53
Figure 37: Properties of a KPI retrieved from a Cognos report ....................................... 54
Figure 38: Retrieve KPI values button ........................................................................... 54
Figure 39: Content of the destination folder for the model in Figure 36 ......................... 55
Figure 40: Model view in jUCMNav after retrieving the values ..................................... 55
Figure 41: KPI values retrieved ..................................................................................... 56
Figure 42: New OCL rules for jUCMNav to check the well-formedness of goal
models ......................................................................................................... 57
Figure 43: Sample Cognos model entity definition ........................................................ 58
Figure 44: Cognos model without a user name value ..................................................... 58
Figure 45: Verifying static semantic rules (constraints) in jUCMNav ............................ 58
Figure 46: Rule violation ............................................................................................... 59
Figure 47: Violation description .................................................................................... 59
Figure 48: Client-server architecture .............................................................................. 60
Figure 49: Typical scenario ........................................................................................... 61
Figure 50: First goal model (from Pourshahid et al., 2011) ............................................ 72
Figure 51: First set of dimensions (from Pourshahid et al., 2011) .................................. 72
Figure 52: Model with more KPIs (from Pourshahid et al., 2011) .................................. 73
Figure 53: Decision model (from Pourshahid et al., 2011) ............................................. 73
Figure 54: Report studio hierarchy with data source ...................................................... 74
Figure 55: Time dimensional model .............................................................................. 75
Figure 56: Location dimensional model ......................................................................... 75
Figure 57: Volume dimensional model .......................................................................... 75
Figure 58: Modified goal model .................................................................................... 76
Figure 59: Metadata editor properties ............................................................................ 77
Figure 60: Aggregated total results ................................................................................ 78
Figure 61: January 2004 metadata path .......................................................................... 78
Figure 62: America metadata path ................................................................................. 79
Figure 63: Product Volume metadata path ..................................................................... 79
Figure 64: Update of metadata in the goal model ........................................................... 80
Figure 65: Authentication and configuration metadata ................................................... 80
Figure 66: Final model, with appropriate metadata properties ........................................ 81
Figure 67: Retrieved KPI value ..................................................................................... 81
Figure 68: Final goal model ........................................................................................... 82
Figure 69: Editing the metadata ..................................................................................... 82
Figure 70: IBM Cognos content..................................................................................... 83
Figure 71: Results for January 2004 .............................................................................. 83
Figure 72: Results for February 2004............................................................................. 83
viii
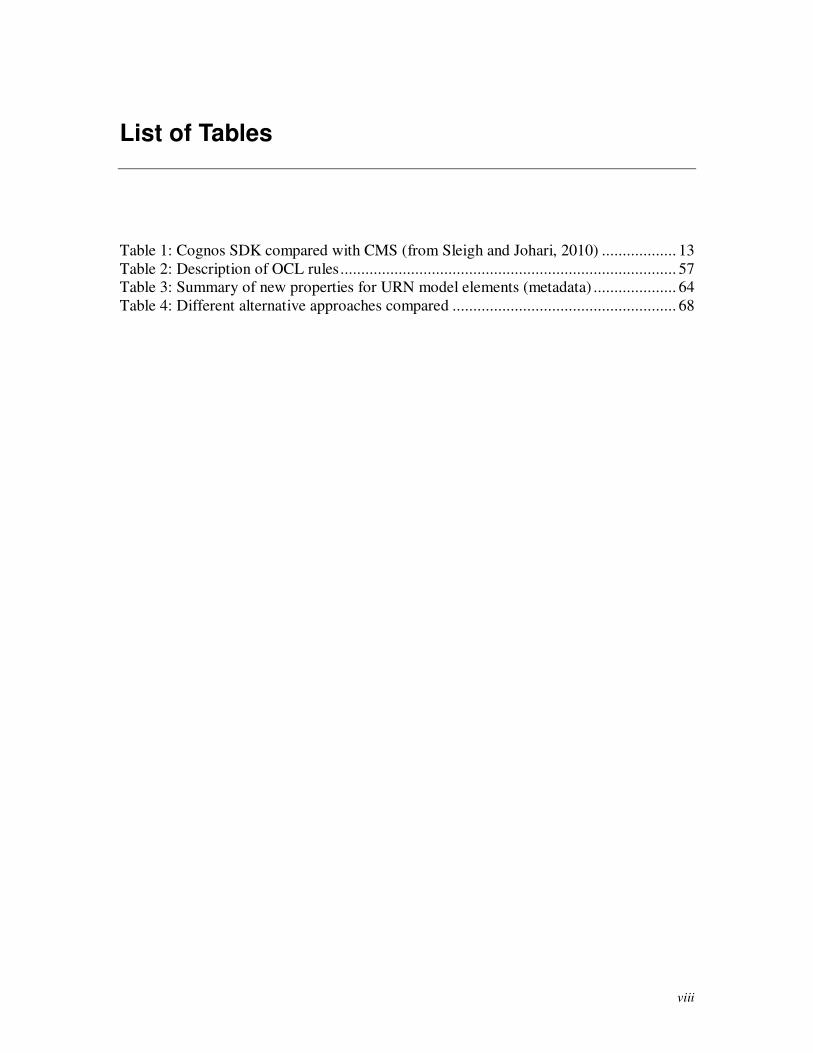
List of Tables
Table 1: Cognos SDK compared with CMS (from Sleigh and Johari, 2010) .................. 13
Table 2: Description of OCL rules ................................................................................. 57
Table 3: Summary of new properties for URN model elements (metadata) .................... 64
Table 4: Different alternative approaches compared ...................................................... 68

ix
List of Acronyms
Acronym Definition
API Application Programming Interface
BI Business Intelligence
BAM Business Activity Monitoring
BPM Business Process Management
BPMS Business Process Management System
CMS Cognos Mashup Service
GRL Goal-oriented Requirement Language
IT Information Technology
ITU International Telecommunication Union
jUCMNav Java Use Case Map Navigator
KPI Key Performance Indicator
MUN Member Unique Name
NFR Non-Functional Requirement
OCL Object Constraint Language
OLAP Online Analytic Processing
REST Representational State Transfer
SDK Software Development Kit
SOAP Simple Object Access Protocol
UCM Use Case Map
URN User Requirements Notation
WSDL Web Service Definition Language
XML Extensible Markup Language
Chapter 1 Introduction 1
Chapter 1 Introduction
This thesis explores a new approach to integrate Business Intelligence (BI) systems with
goal models in order to improve current ways of monitoring organizations. The new ap-
proach proposed in this thesis connects information sources to indicators in goal models
in a dynamic way, which avoids manual report generation and storage and which leads to
better usability and performance.
1.1 Context and Motivation
The main objective of this thesis is to improve organization performance monitoring and
business process monitoring, with a focus on business performance models that take ad-
vantage of the User Requirements Notation (URN). As enterprises grow every day, they
use different tools and software solutions for different purposes within their enterprise.
They use various data repositories internally and externally. They store data related to
their employees as well as data about their clients, sales, products and services they pro-
vide to their clients. Each of these data elements can be used to create information for
different purposes: data about sales can be used to calculate revenues, data about expens-
es can be used to create information about profit when used in conjunction with revenues,
etc. Such information can also be used to support decision making. For example how
large or small the profit is can help decide whether current products or services shall be
continued. This change will be reflected on the organization’s staff and stakeholders. For
instance, does the organization need to keep the employees who were working on the dis-
continued product and services?
In general, modeling the objectives and processes of an organization helps deter-
mine what to monitor and helps analyze whether objectives are really met, hence influ-
encing decision making. Business processes and performance models can be described
and analyzed through various notations and tools. For example, the User Requirements
Chapter 1 Introduction 2
Notation (ITU, 2008) offers both a goal-oriented view and a process-oriented view, to-
gether with support for indicators, which are suitable for such modeling. Tools such as
jUCMNav (Roy, 2006; Kealey, 2007) support different kinds of analyses for URN mod-
els that exploit external, factual sources of information, which in turn helps root decision
making in evidence.
Business Intelligence (BI) technologies and systems, which focus on the timely
distribution of (interactive) reports, also aim to provide information to managers to sup-
port their decision-making processes. BI systems however seldom offer a view that re-
flects the one found in goal models. The integration of a goal-oriented view with more
conventional BI portals and dashboards is seen as something beneficial but difficult to
achieve with current technologies (Pourshahid et al., 2011). Chen (2008) already pro-
posed an approach to integrate goal models in jUCMNav with BI information sources
such as reports generated from IBM Cognos BI, a leading BI tool (Browne et al., 2010).
1.2 Problem Statement
The current integration between BI systems and goal modeling tools, which is best illus-
trated by Chen’s implementation based on Cognos BI and jUCMNav, currently suffers
from several limitations.
First, in Chen’s approach, a business user needs to be familiar with the BI tool in
terms of report authoring and BI content management to be able to create reports for dif-
ferent strategies defined in jUCMNav. This is expensive in terms of training and required
expertise. In this thesis, we are interested in seeing if we can reduce manual labour as
well as dependency to user expertise needed to generate BI reports and integrate goal
models with the generated reports. We will provide a solution where the user’s expertise
in BI reporting will not be a factor for the integration of goal models with BI reports.
Second, in the existing approach, the user needs to apply bookkeeping within the
BI tool to be able to keep track of changes happening in jUCMNav. For example, for a
new strategy used to evaluate the goal model, a new folder structure is required to be cre-
ated within the BI tool and in addition a new report needs to be built. If these items move
within the BI environment, then the integration breaks. In this research, we are interested
to see if we can find a way to automate the maintenance, linkage and bookkeeping of
Chapter 1 Introduction 3
generated reports in a BI tool upon the creation of new strategies within a URN tool,
without user dependency. We remove this dependency and the user will not have to do
any bookkeeping as report authoring and content management will be dynamic.
Third, in Chen’s approach, the data retrieval is based on a new web service which
is external to both the BI tool and jUCMNav. An expert user is required to install the web
service on an application server. In this thesis, we are interested to see if we can perform
the data retrieval on the fly without any dependency on an external web service.
In summary, we will be answering the following questions within this thesis:
• Can we reduce the time and manual labour, as well as the dependency to user
expertise, needed to generate BI reports and integrate goal models with the
generated reports?
• Can we find a way to automate the maintenance, linkage and bookkeeping of
generated reports in a BI tool upon the creation of new strategies within a
URN tool, without user dependency?
• Can we perform the data retrieval on the fly without any dependency on an
external web service?
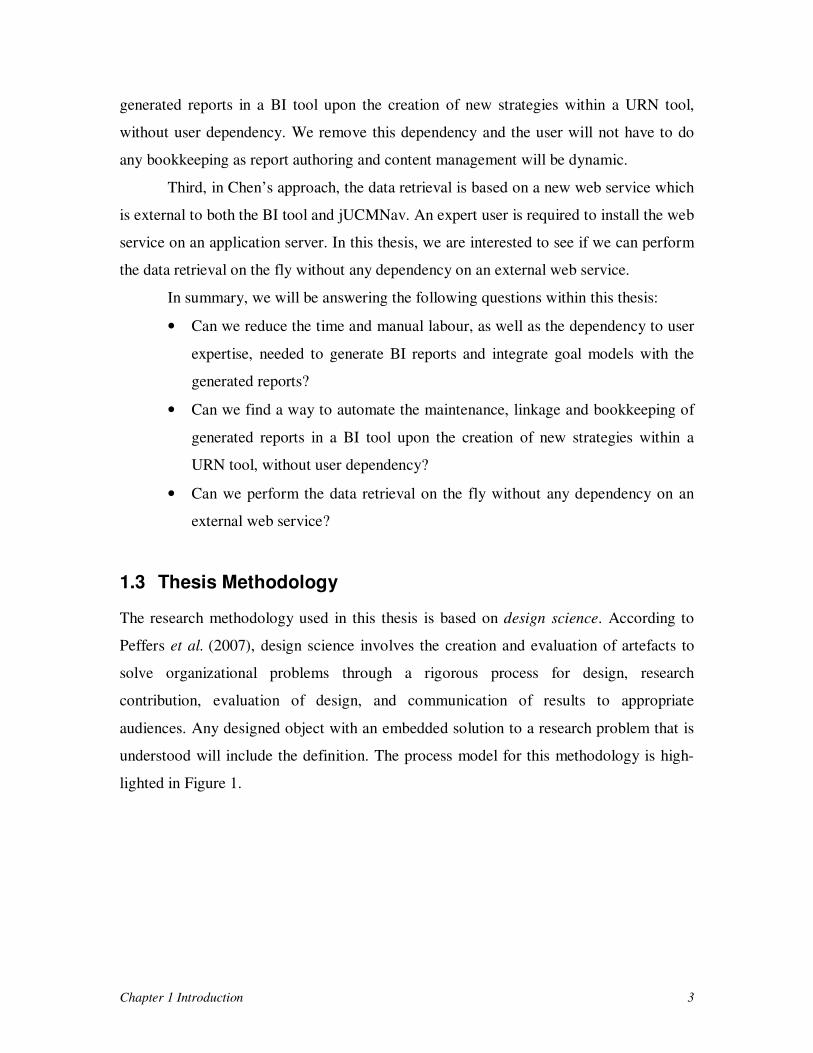
1.3 Thesis Methodology
The research methodology used in this thesis is based on design science. According to
Peffers et al. (2007), design science involves the creation and evaluation of artefacts to
solve organizational problems through a rigorous process for design, research
contribution, evaluation of design, and communication of results to appropriate
audiences. Any designed object with an embedded solution to a research problem that is
understood will include the definition. The process model for this methodology is high-
lighted in Figure 1.
Chapter 1 Introduction 4
Figure 1: Design science research methodology (from Peffers et al., 2007)
We can break down the thesis content in the context of the design science methodology:
1-Identify problems and motivation: We can summarize the following problems in the
context of our research as well as from sections 1.1 and 1.2 and from Chapter 3:
• Excess of manual work to generate reports to monitor the behaviour of the goal
model;
• Lack of a framework to eliminate unnecessary tasks to maintain existing and new
reports for the goal model;
• Dependence to an external web service for data retrieval.
2-Define objectives of a solution: A proposed solution will provide answers to the prob-
lems previously identified. In the context of this research, the objectives of this thesis can
be summarized to the creation of the following artefacts:
• An artefact that would decrease the manual work to generate reports;
• An artefact that would possess a framework to maintain existing and new reports
for the goal model;
• An artefact that would replace the external web service for data retrieval.
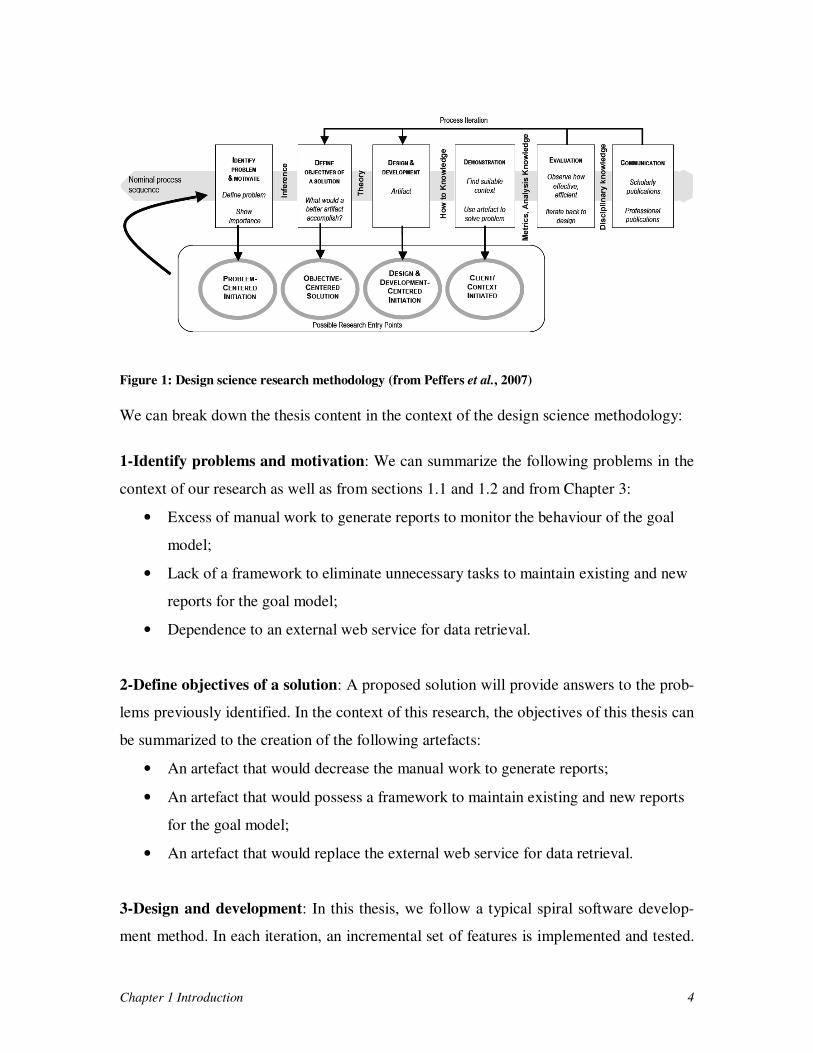
3-Design and development: In this thesis, we follow a typical spiral software develop-
ment method. In each iteration, an incremental set of features is implemented and tested.
Chapter 1 Introduction 5
There are three separate iterations in this thesis that led the first and second prototypes
explained in Chapter 5 and to the final product presented in Chapter 4. The testing and
evaluation are covered in Chapter 7.
4-Demonstration: The final product was demonstrated with existing goal models and
sample data. This is explained in Chapter 6 as the case study.
5-Evaluation: Currently, this product has been used only by one person (the thesis au-
thor) and it is hence a proof of concept. In the future, we will distribute this artefact to
more users.
6-Communication: This thesis well be the communication for the thesis subject.
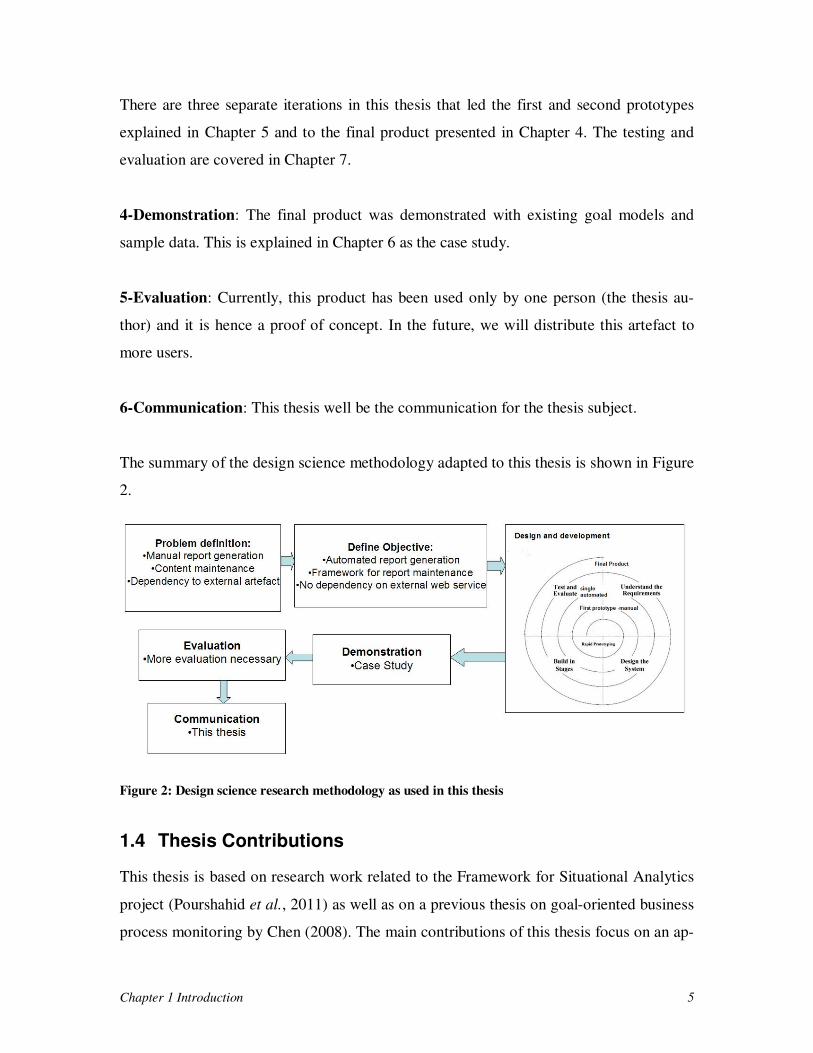
The summary of the design science methodology adapted to this thesis is shown in Figure
2.
Figure 2: Design science research methodology as used in this thesis
1.4 Thesis Contributions
This thesis is based on research work related to the Framework for Situational Analytics
project (Pourshahid et al., 2011) as well as on a previous thesis on goal-oriented business
process monitoring by Chen (2008). The main contributions of this thesis focus on an ap-
Chapter 1 Introduction 6
proach to create dynamic reports for linking jUCMNav to business intelligence content
that will result in reduced time and effort for creating and maintain such links. The de-
tailed contributions are as follows:
•••• A framework for report generation and BI content management: this approach
aims to facilitate the data modeling process without requiring users to have a
high level of BI expertise.
•••• A framework for integrating business process and organization monitoring
with goal-based evaluation and data retrieval: indicators retrieve their values
on the fly through a BI tool and can support real-time monitoring of business
processes and organization performance.
•••• Reduced time and effort for creating and maintaining linkage between a goal-
oriented modeling tool (jUCMNav) and a leading Business Intelligence appli-
cation (Cognos).
From a Requirements Engineering perspective, we are also expanding the current URN
based modeling tool, jUCMNav, to integrate with business information providers in real
time. The approach described in this thesis minimizes user interaction and builds a sys-
tem that eliminates much manual work that is currently required from users.
The new approach makes current approaches to business process monitoring in
the context of URN more reliable, easier to manage, more efficient, and less expensive. It
also opens the door to future research on how best to combine goals and BI by making
this process technically more efficient and easier to use.
1.5 Thesis Outline
The detailed thesis structure is as follows:
•••• Chapter 2: Provides background information about general concepts, Business
Intelligence and its capabilities, the Cognos Software Development Kit (SDK),
the Cognos Mashup Service, jUCMNav, URN, GRL and Key Performance In-
dicators (KPIs).
Chapter 1 Introduction 7
•••• Chapter 3: Explores the current approach in detail (Chen, 2008) and introduces
some of the research results in the field of goal modeling, business process
monitoring and KPIs.
•••• Chapter 4: Explores the criteria for improvement and discusses some of the de-
sign decisions made to create the current approach. It also defines and illus-
trates the solution in detail and how the latter has improved the current state of
the art.
•••• Chapter 5: Discusses other alternatives that were considered during this re-
search and how they compare to the current approach and the proposed solu-
tion.
•••• Chapter 6: Demonstrates, through a case study, the proposed method and how
it improves the overall user experience.
•••• Chapter 7: Describes the testing methodology for the implementation of the
approach as well as the test results.
•••• Chapter 8: Recalls the contributions and describes some of the limitations of
the proposed solution together with ideas on how the approach can be further
improved to make the user experience more interactive and the tool more effi-
cient.
Chapter 2 Background 8
Chapter 2 Background
This chapter provides background information about Business Intelligence and relevant
technologies such as the Cognos Software Development Kit (SDK) and the Cognos
Mashup Service (CMS). It also reviews the User Requirements Notation, with its two
sub-languages for goals and scenarios, and tool support. How these existing technologies
fit in the larger business process management picture is also presented.
2.1 Business Intelligence
In any kind of organization, employees make hundreds of decisions each day. They can
range from whether to give customer X a discount, whether to start producing part Y,
whether to launch another direct mail campaign, whether to order additional materials,
etc. These decisions are sometimes based on facts, but mostly based on experience, ac-
cumulated knowledge, and rules of thumb.
Each organization produces a massive amount of data on a daily basis; conse-
quently, data becomes increasingly abundant. This data is later on analyzed and turned
into information. Critical decisions are made based on such information. Nowadays or-
ganizations take advantage of computational capabilities to do data analysis. Some typi-
cal computations include: slicing and dicing data, posing ad-hoc queries, detecting pat-
terns, and measuring performance. These computational capabilities are sets of tools and
methods associated with Business Intelligence (BI). Enterprises use BI tools to make
sense of raw data for various purposes. In a nutshell, good Business Intelligence is all
about users taking better business decisions at the right time, with the right information
(Barone et al., 2010).
A BI tool is usually the combination of several technologies put together for the
purpose of data analysis. Each BI tool can be connected to one or many different types of
Chapter 2 Background 9
data sources. These data sources can be different types of databases, external files, data
cubes or a combination thereof (Browne et al., 2010).
A BI tool typically allows users to model, customize, and slice and dice data.
Such capabilities come in a form of data modeling components or report generation com-
ponents in the tool. Data modeling is one of the most important parts of a BI tool. This is
where the relationships between data entities are defined. To be more specific, the
metadata is created in this phase. Metadata is based on the business requirements coming
from those interested in a certain analysis of known data (e.g., business analysts). Report
generation is used to handle how the end user wants to view the results of the analysis. BI
tools usually come with colourful features to support report generation (Browne et al.,
2010).
To allow such features, certain technologies are used that help enterprises achieve
these tasks in the most usable and efficient way. Due to the large number of BI users,
multiple servers are often required to support high efficiency and low response time of
the BI tool. Technologies such as web services are used to enable enterprises to reach
maximum productivity (Browne et al., 2010).
2.1.1 IBM Cognos Business Intelligence Tool
In the context of this research, the IBM Cognos Business Intelligence tool (Browne et al.,
2010) is utilized since it is one of the most mature and popular tools currently available,
which also includes the vast majority of capabilities from data modeling to report genera-
tion and user management. Local expertise with this tool was also available. A few com-
ponents of this tool, such as IBM Cognos Software Development Kit and IBM Cognos
Mashup Service, are especially used in this research to increase performance, precision
and efficiency of BI reporting. The BI tool is not used interactively but certain functional-
ities of the BI tool are integrated within the final product resulting from this thesis.
IBM Cognos Business Intelligence has a three-tier architecture:
•••• Presentation tier;
•••• Middleware tier;
•••• Data tier.
Chapter 2 Background 10
The presentation tier is the for user interactions. It accepts user commands through a web
user interface. It is also the layer in which reports are rendered and layouts are generated.
The middleware tier is for routing each request to the proper service as well as
communicating with the data layer to query the data requested by the user. This middle-
ware tier includes a query engine as well as services such as a report service responsible
for report-related requests (e.g., running reports).
The data tier is responsible for data storage and maintaining different data stores
within Cognos’ content store. The content store is the internal data store used by the
Cognos server and stores information on all the artefacts related to business intelligence
such as folders, reports and report specifications.
Each tier is comprised of several components that communicate with each other
through web services. We are using two of the services within the middleware tier:
•••• The Software Development Kit (SDK), which eliminates the need to use the us-
er interface to send requests to the Cognos server. This service can be used to
do all the operations possible within the Cognos server. Some of the operations
available include creating report specifications, storing reports in the content
store, creating folders to include reports, generating report specifications, and
validating reports. This service uses the Simple Object Access Protocol
(SOAP) as communication protocol (W3C, 2007).
•••• The IBM Cognos Mashup Service, which takes care of report runs and retriev-
ing the desired value after a report run. This service provides an easy to use
Representational State Transfer (REST) application programming interface
(API) to facilitate any type of call related to report content retrieval. In the next
sections, these two services will be discussed in more details.
2.1.2 IBM Cognos Software Development Kit (SDK)
Major software products usually provide an interface enabling users to customize their
products within their context. The Cognos BI tool provides a set of APIs that can auto-
mate all the tasks user can do manually in the software. Using these APIs, we can achieve
platform-independent automation using different programming languages. Such APIs are
usually part of some software development kit (SDK).
Chapter 2 Background 11
Cognos’ web-based architecture is built around the following industry standards:
•••• Web Services Definition Language (WSDL);
•••• Simple Object Access Protocol (SOAP), with XML and HTTP.
In our research, we are using the Java programming language in conjunction with the
IBM Cognos Software Development Kit (Popescu, 2011) in addition to XML for data
transfer and data retrieval. We are taking advantage of web service technologies for the
following capabilities:
•••• Authentication: a method used to authenticate users to the Cognos server.
•••• Report generation: a specification is generated that describes the data to be re-
turned as well as the layout information.
•••• Report storage: a method to store the specification created as above in the
Cognos server’s internal database.
•••• Report deletion: The unused report object is deleted from the Cognos server.
•••• Folder creation: A container that will include reports and other folders.
2.1.3 IBM Cognos Mashup Service (CMS)
The IBM Cognos Mashup Service (Sleigh and Johari, 2010; IBM, 2012b) is a new capa-
bility provided by the IBM Cognos Business Intelligence tool that facilitates data retriev-
al from reports. Every generated report includes various pieces of information such as a
metamodel, a model, layout information and the data. As enterprises get more complex,
the need for flexibility on which data to consider and how the data is retrieved and pre-
sented becomes more complex.
Enterprises use various products concurrently since each product satisfies part of
their requirements. For example, a Chief Executive Officer may want to see quarterly
profits within the same portal used for checking emails. Users may want to access all the
information and tools they need for their daily activities in one place and avoid login to
different systems for each task.
This new mashup capability provides a way to integrate Cognos reports with other
applications. There are two different interfaces to use this technology:
• Representational State Transfer (REST): This interface uses basic HTTP
requests.
Chapter 2 Background 12
• Simple Object Access Protocol (SOAP): This interface can be used to pro-
grammatically access the CMS API.
In this research, we are using Cognos Mashup Service to run the reports generated by the
Cognos SDK as well as to retrieve the value generated after a report is run. The value is
then passed to a third party tool (e.g., jUCMNav) for further use.
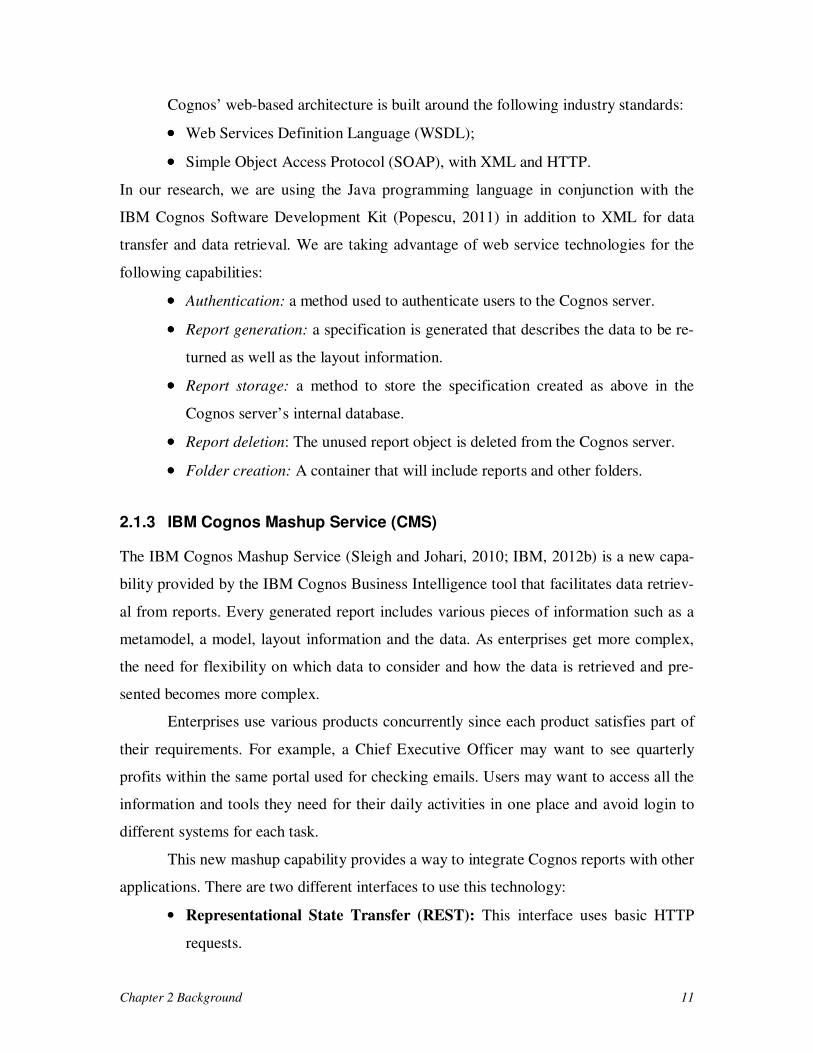
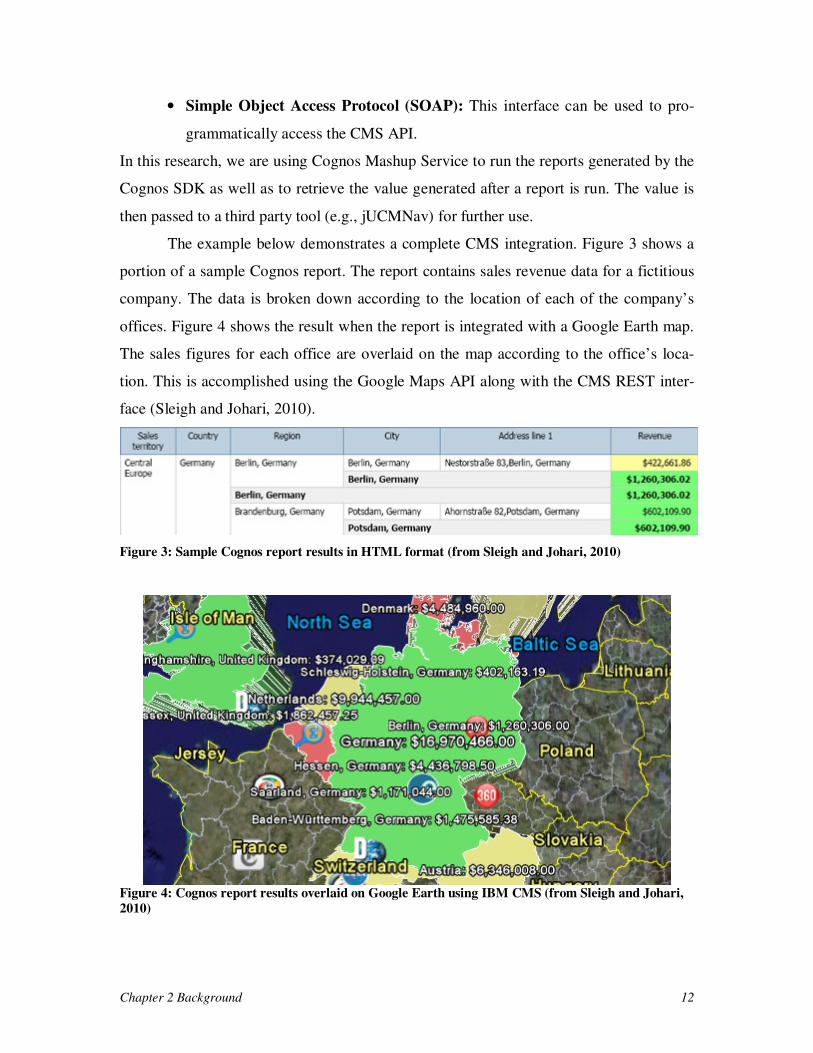
The example below demonstrates a complete CMS integration. Figure 3 shows a
portion of a sample Cognos report. The report contains sales revenue data for a fictitious
company. The data is broken down according to the location of each of the company’s
offices. Figure 4 shows the result when the report is integrated with a Google Earth map.
The sales figures for each office are overlaid on the map according to the office’s loca-
tion. This is accomplished using the Google Maps API along with the CMS REST inter-
face (Sleigh and Johari, 2010).
Figure 3: Sample Cognos report results in HTML format (from Sleigh and Johari, 2010)
Figure 4: Cognos report results overlaid on Google Earth using IBM CMS (from Sleigh and Johari,
2010)
Chapter 2 Background 13
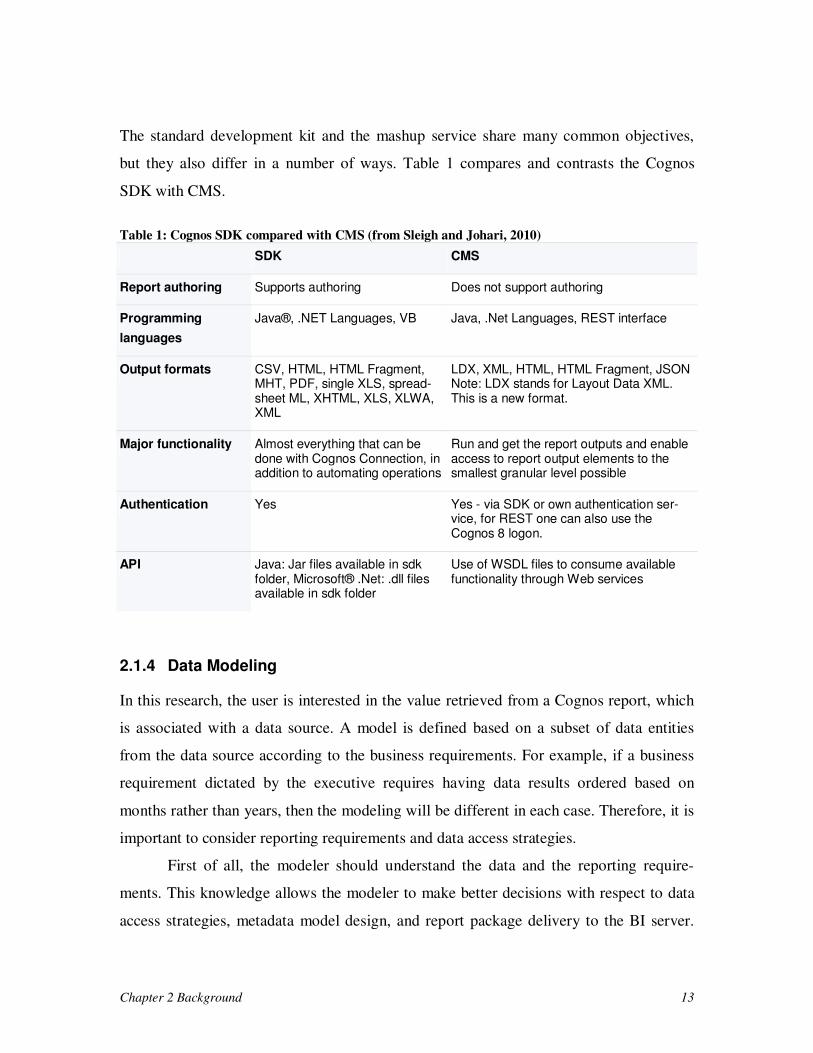
The standard development kit and the mashup service share many common objectives,
but they also differ in a number of ways. Table 1 compares and contrasts the Cognos
SDK with CMS.
Table 1: Cognos SDK compared with CMS (from Sleigh and Johari, 2010)
SDK CMS
Report authoring Supports authoring Does not support authoring
Programming
languages
Java®, .NET Languages, VB Java, .Net Languages, REST interface
Output formats CSV, HTML, HTML Fragment, MHT, PDF, single XLS, spread-sheet ML, XHTML, XLS, XLWA, XML
LDX, XML, HTML, HTML Fragment, JSON Note: LDX stands for Layout Data XML. This is a new format.
Major functionality Almost everything that can be done with Cognos Connection, in addition to automating operations
Run and get the report outputs and enable access to report output elements to the smallest granular level possible
Authentication Yes Yes - via SDK or own authentication ser-vice, for REST one can also use the Cognos 8 logon.
API Java: Jar files available in sdk folder, Microsoft® .Net: .dll files available in sdk folder
Use of WSDL files to consume available functionality through Web services
2.1.4 Data Modeling
In this research, the user is interested in the value retrieved from a Cognos report, which
is associated with a data source. A model is defined based on a subset of data entities
from the data source according to the business requirements. For example, if a business
requirement dictated by the executive requires having data results ordered based on
months rather than years, then the modeling will be different in each case. Therefore, it is
important to consider reporting requirements and data access strategies.
First of all, the modeler should understand the data and the reporting require-
ments. This knowledge allows the modeler to make better decisions with respect to data
access strategies, metadata model design, and report package delivery to the BI server.
Chapter 2 Background 14
There is a need to identify which data sources contain the information required for the
reporting. In addition, the following questions need to be answered:
1. Is this an appropriate data source?
2. What is the best choice: a transactional system, star schema data warehouse,
or a data mart?
3. How fresh does the data need to be?
4. How often does the reporting need to take place? Daily, weekly, or monthly?
Answers to these types of questions can affect dramatically the data access strategy
choice (IBM, 2012a).
In this research, data is modeled using IBM Cognos Framework Manager and is
published and deployed on a Cognos BI server as a package. A metamodel is defined in
the context of Cognos BI, which is a description of database elements such as tables, col-
umns, and entity-relationships information.
This eventually will hide the complexity of the data and provide an organized
view of the data to the business user, who will have to use this data in the business con-
text. This means that the business user is aware of the relationships between data since
that will allow the user to configure third-party tools (e.g., jUCMNav) to retrieve the de-
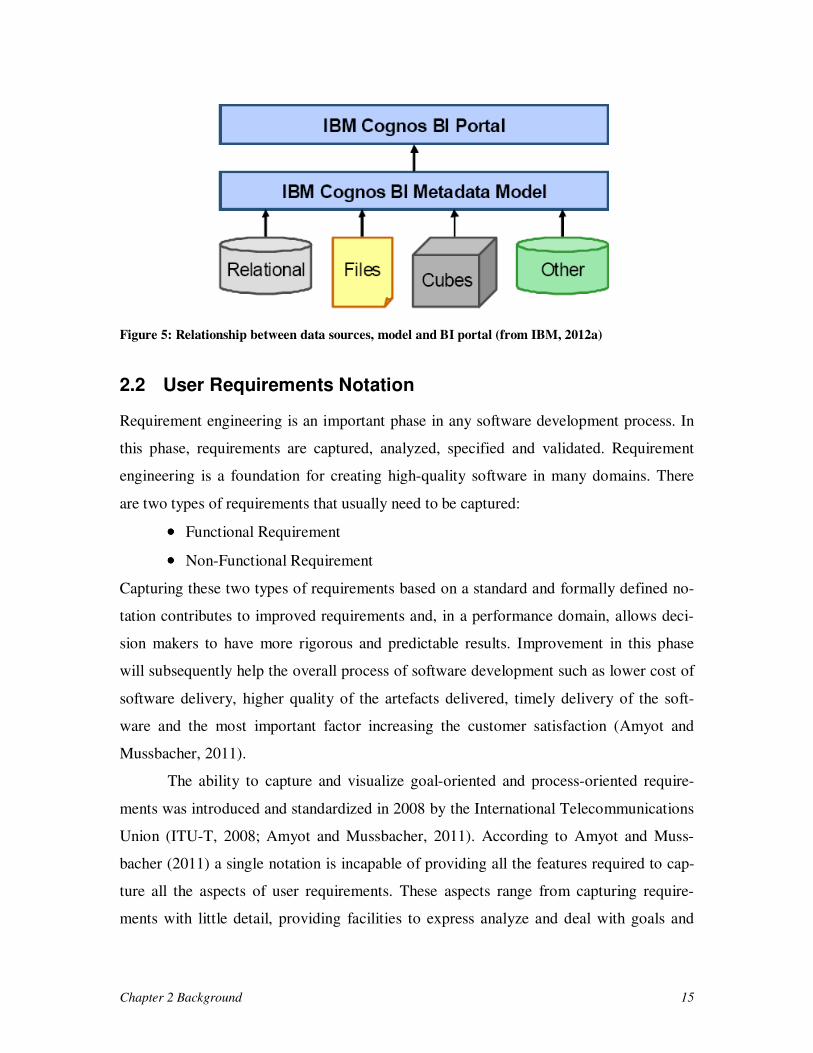
sired data pieces. In this research, the data consumed is usually multidimensional and can
come from different data sources (Figure 5) that may be distributed over different serv-
ers; therefore, there are no constraint related to having a centralized data center. This
helps to model different entities from different enterprises/organizations should the need
arise.
Chapter 2 Background 15
Figure 5: Relationship between data sources, model and BI portal (from IBM, 2012a)
2.2 User Requirements Notation
Requirement engineering is an important phase in any software development process. In
this phase, requirements are captured, analyzed, specified and validated. Requirement
engineering is a foundation for creating high-quality software in many domains. There
are two types of requirements that usually need to be captured:
•••• Functional Requirement
•••• Non-Functional Requirement
Capturing these two types of requirements based on a standard and formally defined no-
tation contributes to improved requirements and, in a performance domain, allows deci-
sion makers to have more rigorous and predictable results. Improvement in this phase
will subsequently help the overall process of software development such as lower cost of
software delivery, higher quality of the artefacts delivered, timely delivery of the soft-
ware and the most important factor increasing the customer satisfaction (Amyot and
Mussbacher, 2011).
The ability to capture and visualize goal-oriented and process-oriented require-
ments was introduced and standardized in 2008 by the International Telecommunications
Union (ITU-T, 2008; Amyot and Mussbacher, 2011). According to Amyot and Muss-
bacher (2011) a single notation is incapable of providing all the features required to cap-
ture all the aspects of user requirements. These aspects range from capturing require-
ments with little detail, providing facilities to express analyze and deal with goals and
Chapter 2 Background 16
non-functional requirements, providing facilities to manage evolving requirement etc.
URN combines two notations to achieve this:
•••• Use Case Maps (UCMs) for operational requirements and business processes.
•••• Goal-oriented Requirement Language (GRL) for goals;
2.2.1 Use Case Maps
Introduced in 1998 by Buhr and his colleagues (Buhr and Casselman, 1996; Buhr 1998)
UCMs describe scenarios as causal flows of responsibilities (e.g., operations, actions,
tasks and functions) that can have various underlying structures of components. These
components can be categorized into two main entities:
•••• Software entities (e.g., process);
•••• Non-software entities (e.g., hardware or user).
Originally meant to describe requirements for telecommunication services, UCMs were
later evolved to describe operational requirements, services, and business processes
(Weiss and Amyot 2005). UCMs are used to describe multiple scenarios in an abstract
and integrated view and also contribute to the understanding and explanation of the
whole system. By extracting and defining individual scenarios from the whole view, peo-
ple can better understand particular functionalities in complex processes. UCMs com-
plement goal models by providing a view that operationalizes goals and their tasks. How-
ever, this thesis focuses on the goal view, and hence the UCM view will not be intro-
duced in any further detail.
2.2.2 Goal-oriented Requirement Language
Another important part of URN standard is the Goal-oriented Requirement Language
(GRL). This language accommodates large and complex models that capture stakeholders
(called actors), their intent (e.g., goals), and the relationships between actors (e.g. de-
pendencies), between actors and intentional elements, and between intentional elements
(e.g., decompositions and contributions). This language combines features from the Non-
Functional Requirements (NFR) framework of Chung et al. (2000) and from the i*
framework (Yu, 1997; Yu et al., 2010). Some of the unique features of GRL are its abil-
Chapter 2 Background 17
ity to support evaluation strategies (and different qualitative and quantitative representa-
tion and algorithms), its extension mechanisms (e.g., to support stereotyped elements, as
well as new types of relationships through URN links), its integration to a process view
with traceability links to UCMs, and more recently its support for indicators/KPIs (just
standardized in October 2012).
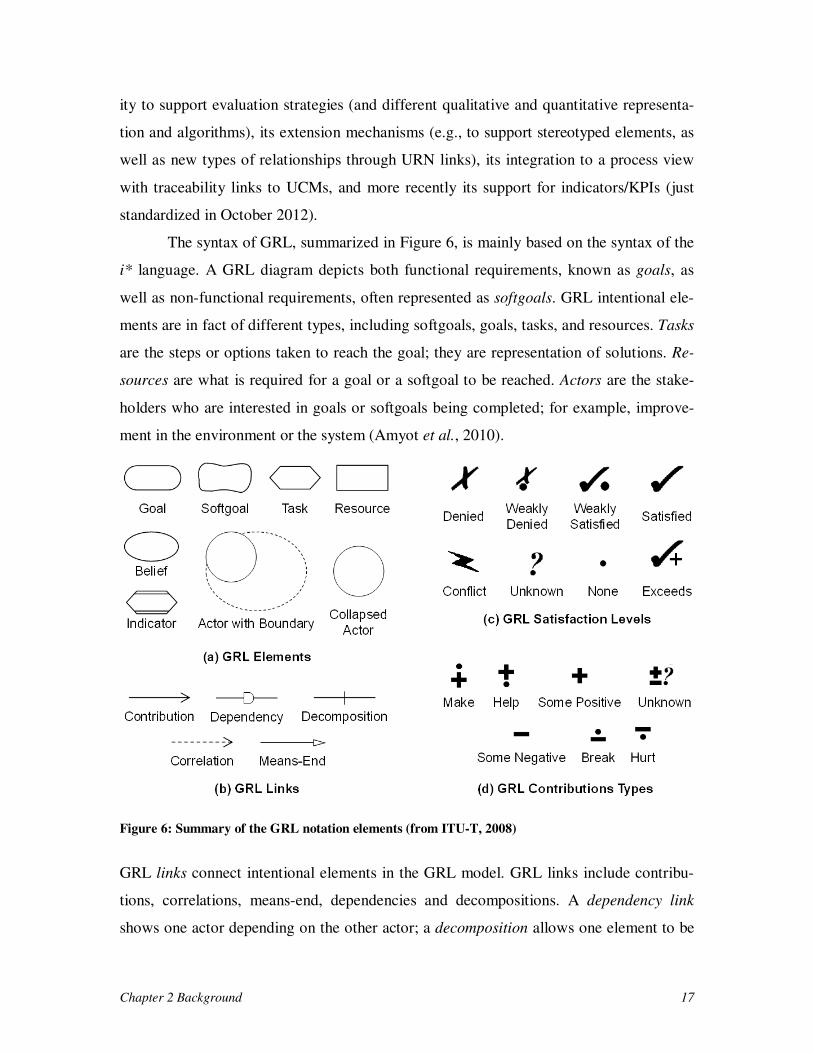
The syntax of GRL, summarized in Figure 6, is mainly based on the syntax of the
i* language. A GRL diagram depicts both functional requirements, known as goals, as
well as non-functional requirements, often represented as softgoals. GRL intentional ele-
ments are in fact of different types, including softgoals, goals, tasks, and resources. Tasks
are the steps or options taken to reach the goal; they are representation of solutions. Re-
sources are what is required for a goal or a softgoal to be reached. Actors are the stake-
holders who are interested in goals or softgoals being completed; for example, improve-
ment in the environment or the system (Amyot et al., 2010).
Figure 6: Summary of the GRL notation elements (from ITU-T, 2008)
GRL links connect intentional elements in the GRL model. GRL links include contribu-
tions, correlations, means-end, dependencies and decompositions. A dependency link
shows one actor depending on the other actor; a decomposition allows one element to be
Chapter 2 Background 18
divided (AND/OR/XOR) into sub-elements; contribution and correlation links both indi-
cate desired impacts (positive/negative) of one element on another element. The only dif-
ference between the two is that a correlation describes side-effects rather than desired
impact (Amyot et al., 2010). Contributions and correlations also have weights of different
types, which can be qualitative (as in Figure 6d) or quantitative (on a [-100..100] scale).
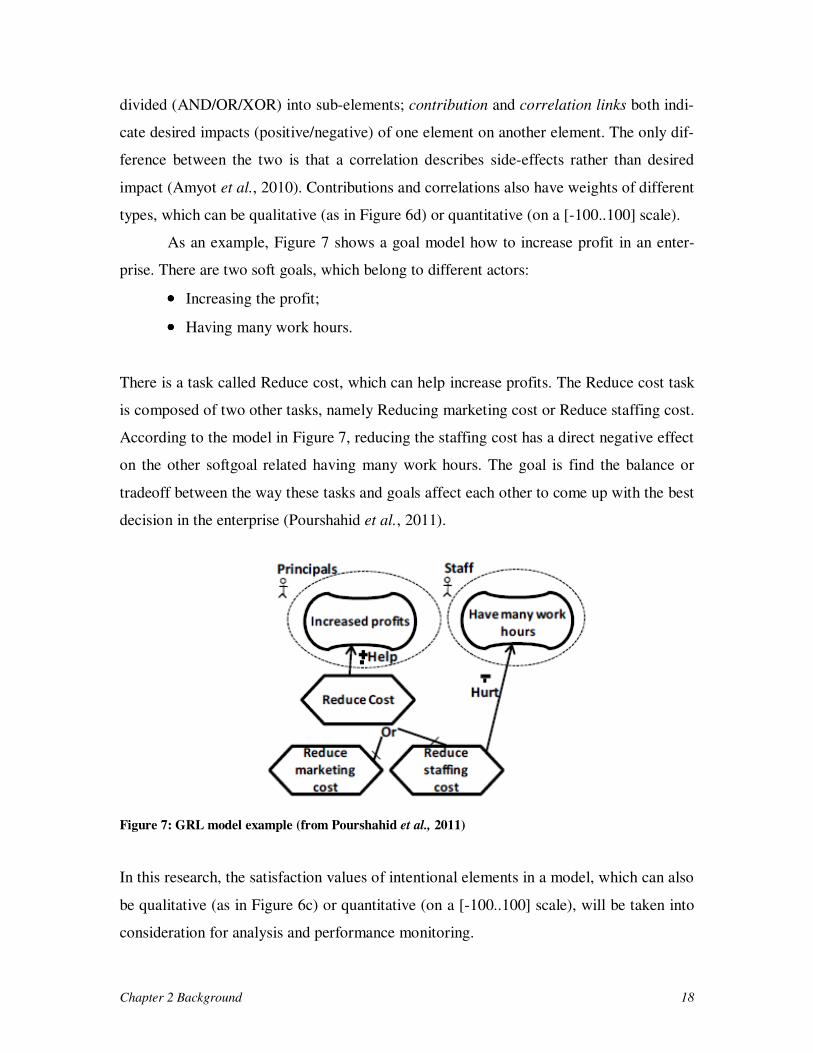
As an example, Figure 7 shows a goal model how to increase profit in an enter-
prise. There are two soft goals, which belong to different actors:
•••• Increasing the profit;
•••• Having many work hours.
There is a task called Reduce cost, which can help increase profits. The Reduce cost task
is composed of two other tasks, namely Reducing marketing cost or Reduce staffing cost.
According to the model in Figure 7, reducing the staffing cost has a direct negative effect
on the other softgoal related having many work hours. The goal is find the balance or
tradeoff between the way these tasks and goals affect each other to come up with the best
decision in the enterprise (Pourshahid et al., 2011).
Figure 7: GRL model example (from Pourshahid et al., 2011)
In this research, the satisfaction values of intentional elements in a model, which can also
be qualitative (as in Figure 6c) or quantitative (on a [-100..100] scale), will be taken into
consideration for analysis and performance monitoring.
Chapter 2 Background 19
2.2.3 Links Between GRL and UCM
GRL elements capture business goals whereas UCMs capture different processes that a
business goes through to achieve its goals. By combining the two perspectives, one can
see how the two concepts affect each other. GRL focuses on the why, who, and what as-
pects of business processes whereas UCM focuses (also) on the what, who, when, and
where aspects. URN includes mechanisms (URN links) to create traceability relationships
between UCM and GRL elements. Furthermore, one can see how these complementary
views can be used in the context of business process monitoring (Chen, 2008).
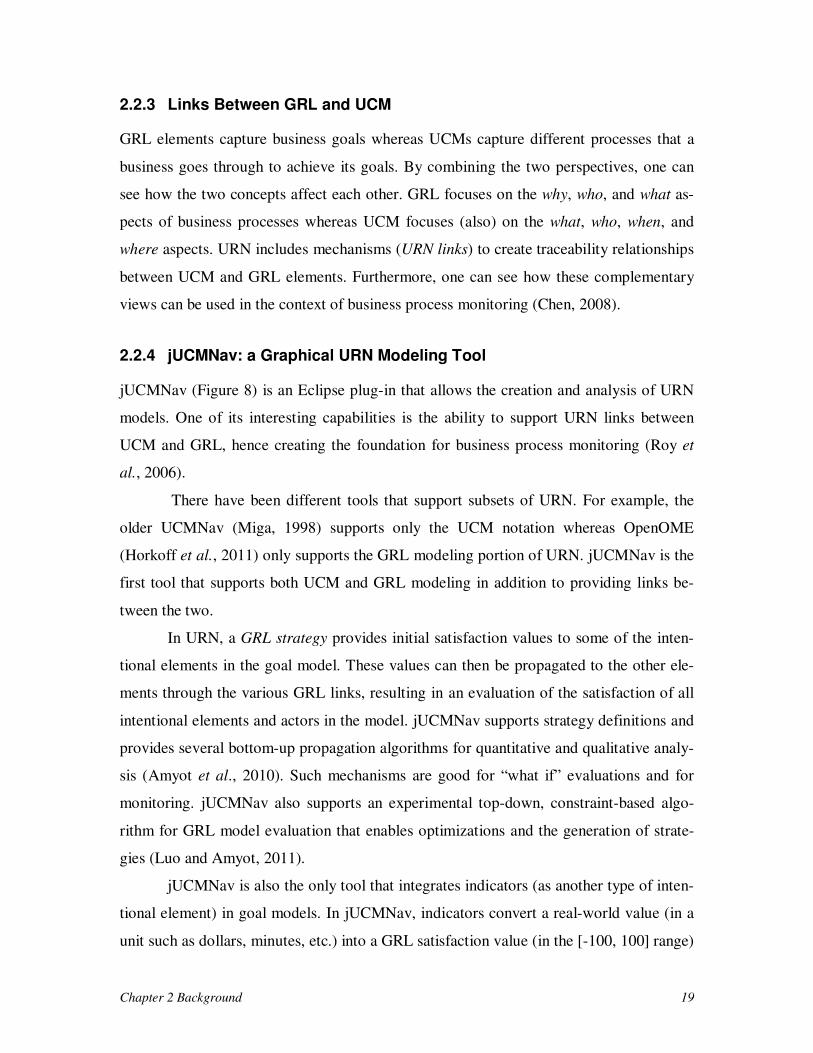
2.2.4 jUCMNav: a Graphical URN Modeling Tool
jUCMNav (Figure 8) is an Eclipse plug-in that allows the creation and analysis of URN
models. One of its interesting capabilities is the ability to support URN links between
UCM and GRL, hence creating the foundation for business process monitoring (Roy et
al., 2006).
There have been different tools that support subsets of URN. For example, the
older UCMNav (Miga, 1998) supports only the UCM notation whereas OpenOME
(Horkoff et al., 2011) only supports the GRL modeling portion of URN. jUCMNav is the
first tool that supports both UCM and GRL modeling in addition to providing links be-
tween the two.
In URN, a GRL strategy provides initial satisfaction values to some of the inten-
tional elements in the goal model. These values can then be propagated to the other ele-
ments through the various GRL links, resulting in an evaluation of the satisfaction of all
intentional elements and actors in the model. jUCMNav supports strategy definitions and
provides several bottom-up propagation algorithms for quantitative and qualitative analy-
sis (Amyot et al., 2010). Such mechanisms are good for “what if” evaluations and for
monitoring. jUCMNav also supports an experimental top-down, constraint-based algo-
rithm for GRL model evaluation that enables optimizations and the generation of strate-
gies (Luo and Amyot, 2011).
jUCMNav is also the only tool that integrates indicators (as another type of inten-
tional element) in goal models. In jUCMNav, indicators convert a real-world value (in a
unit such as dollars, minutes, etc.) into a GRL satisfaction value (in the [-100, 100] range)
Chapter 2 Background 20
by comparing the real-world value against the indicator’s target, threshold, and worst-
case values (Pourshahid et al., 2009). Indicators are currently undergoing the final stage
of standardization as part of the next version of URN. jUCMNav offers a propagation
algorithm that provides formula-based KPI aggregation (see Figure 8) for the type of
cause-effect analysis performed in a decision-making context (Pourshahid et al., 2011).
jUCMNav is a tool that enables business process monitoring and that allows inte-
gration of various software platforms. Chen (2008) integrated monitoring capabilities to
jUCMNav that are based on Eclipse’s Web Tools Platform (WTP).
Figure 8: jUCMNav user interface
Chapter 2 Background 21
2.3 Business Process Management
Business process management refers to the collective processes that go into the effective
communication of humans and automated systems. A business process management sys-
tem (BPMS), on the other hand, can be defined as “a generic software system that is driv-
en by explicit process designs to enact and manage operational business processes” (van
der Aalst et al., 2003).
A business process can be defined as sequence of activities meant to achieve a
business goal. The ability to monitor business processes is a critical task. Each business
process is associated with a measure of business that is essential to managers and to the
business in general. Monitoring these measures in real time is very important in many
domains, in order to enable timely decision-making.
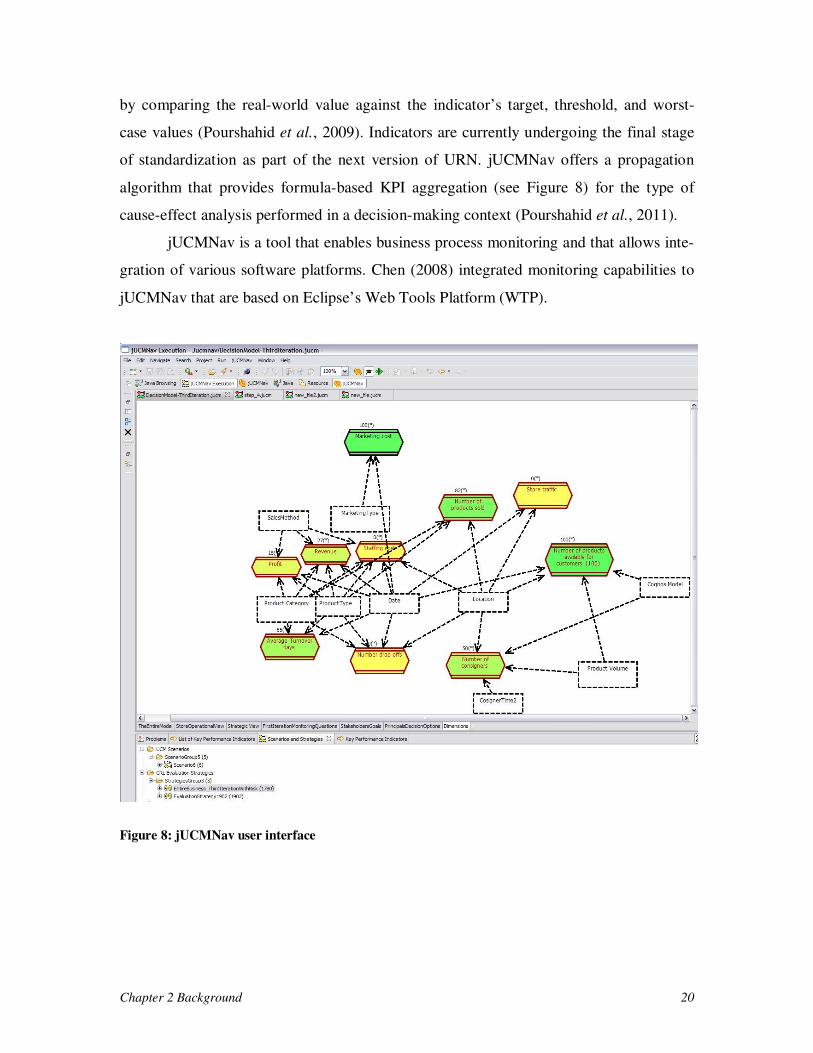
A business process will respond to events or requests in the form of execution of
activities. These activities answer the following questions: who, when and why the work
needs to be done. In other words, these activities are units of work to be done. That de-
fines the process objective. In Figure 9, the arrows designate the sequence in which the
activities will occur. The process has three activities:
• Edit Order;
• Fulfill Order;
• Bill Order.
We have neither determined in this diagram where the order comes from nor whether the
activities are fully automated or performed by humans. We might later decide that the
activities use other services to fulfill their responsibilities.
Figure 9: Sequence of activities in a process (from van der Aalst et al., 2003)
Chapter 2 Background 22
2.3.1 Roles and Actors
Each process does not go through the sequence of execution by itself. The responsibility
is delegated to a person or a team or a software system (record keeping software) or a
machine (for example, a manufacturing cell controller). In the context of this research, we
call those the actors. An actor will perform the desired tasks or activities and either take
the process to completion or pass the current status of work to another actor for comple-
tion.
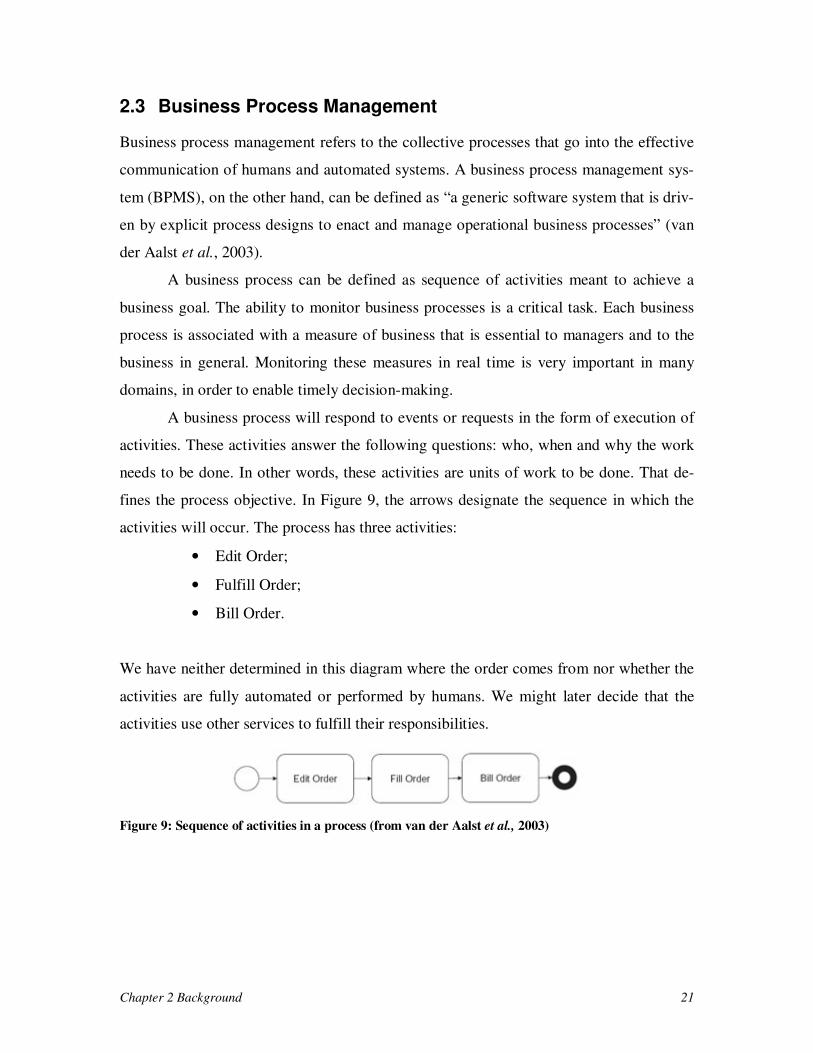
Figure 10 depicts people assigned to roles (this is a non-standard notation for il-
lustration purposes; UCMs could also be used to formalize such concepts). This might be
a process in a small enterprise where two people do the work of processing and filling
orders. In this process the roles define the need for persons to do the work of editing and
filling orders. There may be several people available to do this work, but the roles specify
the qualifications of persons required to do the specific work.
Figure 10: Actors and activities (from van der Aalst et al., 2003)
2.3.2 Business Process Management System
A business result stems from coordination amongst chain of activities towards a business
goal if it has repeating cycles. A process is broken down into smaller processes and even-
tually smaller steps that are carried out by various actors within the organization. These
actors may carry one or more roles to complete these tasks. There are various types of
processes; processes differ in complexity depending on the number of functional units of
an organization they may target.
A simple process may usually target a single functional unit of an organization.
Complex processes such as end to end business processes can vary in terms of the num-
ber of targets they may affect. They can target a departments or business partners. Inte-
Chapter 2 Background 23
gration between different types of software that play a role in business is not an easy task
for two reasons (Rao Vallabhaneni, 2008):
• Software applications are structured into different functional units;
• Organizations are arranged around functions and departments.
Enterprises are focusing on customer and closer relationship with business partners that
they can benefit from. This relationship follows different types of cross-organization pro-
cesses as well as linking different software system and humans together.
Process improvement within the organization is very essential to managers since
it can have a direct effect on the profitability of the company. For example, the process of
communicating requirements to clients for a solution has been improved by using collab-
orative tools such as online sharing tools instead of having to travel to client’s location.
This will save time and cost of travel; therefore, it will have a direct effect on the reve-
nue.
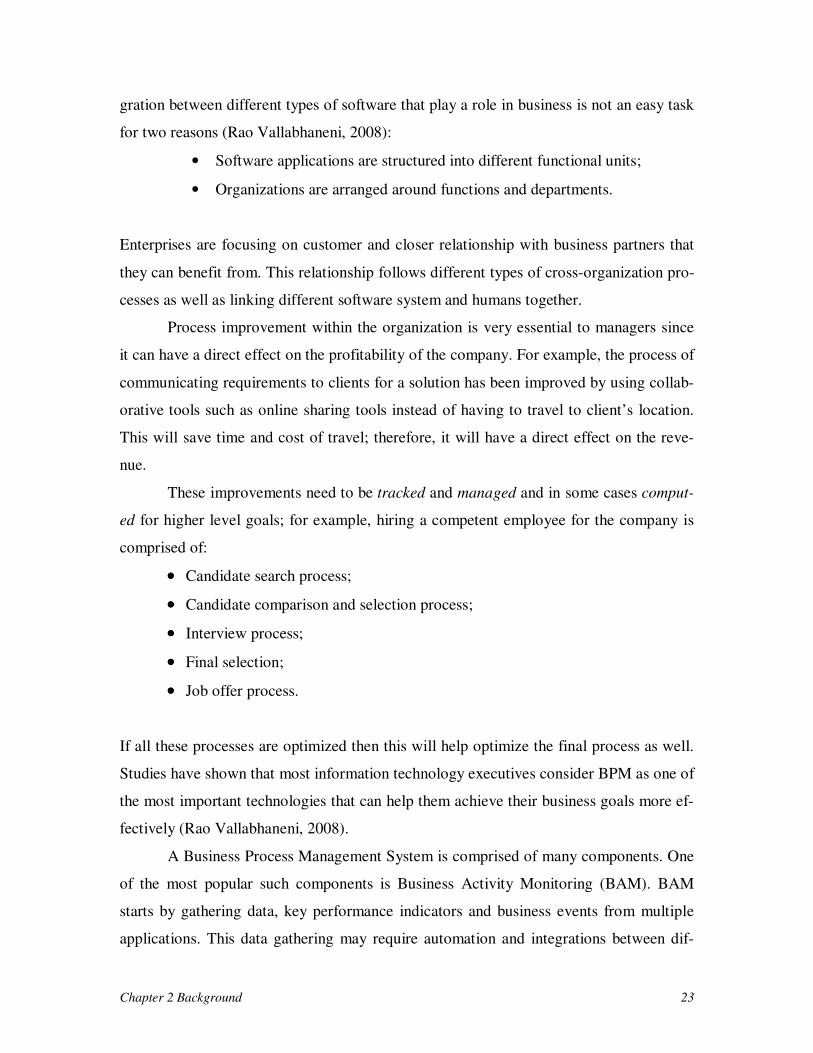
These improvements need to be tracked and managed and in some cases comput-
ed for higher level goals; for example, hiring a competent employee for the company is
comprised of:
•••• Candidate search process;
•••• Candidate comparison and selection process;
•••• Interview process;
•••• Final selection;
•••• Job offer process.
If all these processes are optimized then this will help optimize the final process as well.
Studies have shown that most information technology executives consider BPM as one of
the most important technologies that can help them achieve their business goals more ef-
fectively (Rao Vallabhaneni, 2008).
A Business Process Management System is comprised of many components. One
of the most popular such components is Business Activity Monitoring (BAM). BAM
starts by gathering data, key performance indicators and business events from multiple
applications. This data gathering may require automation and integrations between dif-
Chapter 2 Background 24
ferent applications with different level of complexities. After data gathering, the data is
analyzed and real time reports, alerts or significant business events are produced (Chen,
2008).
Reports about analyzed data and KPIs are used by process analyst who will delve
into the information result and identify opportunities for improvements or reengineering
in the desired process. Not only these results can be used individually but also in some
cases they can be fed into simulation software to simulate an environment with optimized
processes based on the real life data.
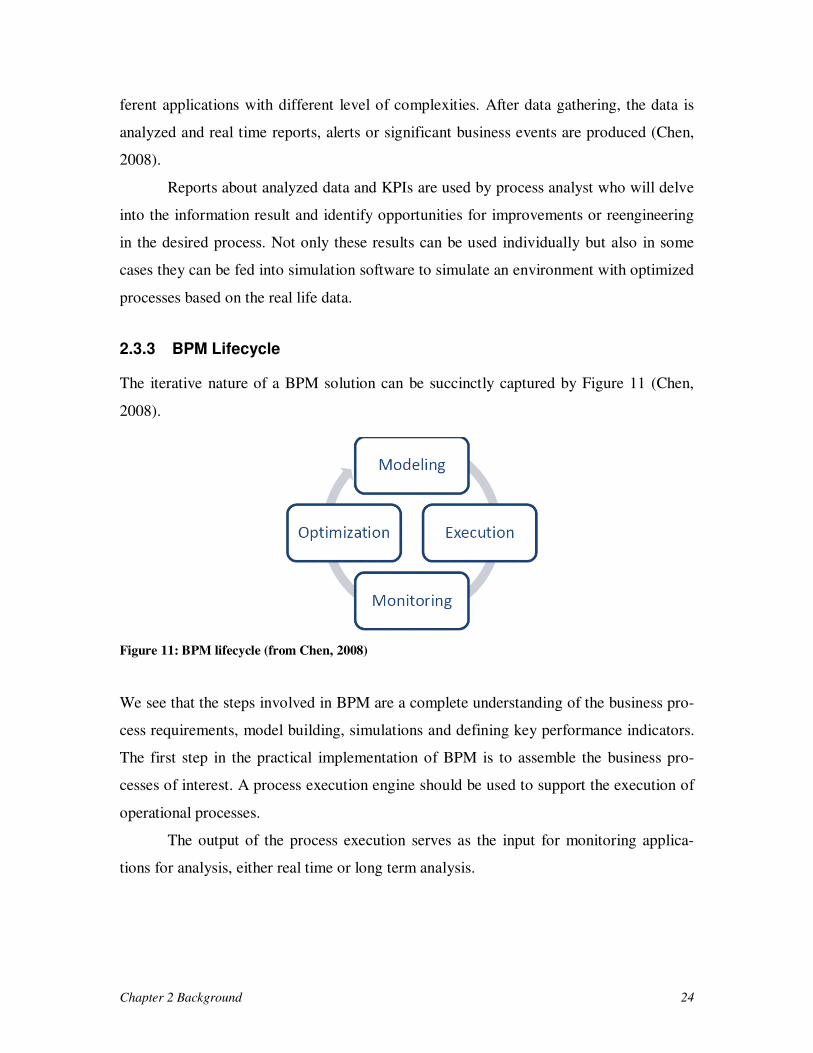
2.3.3 BPM Lifecycle
The iterative nature of a BPM solution can be succinctly captured by Figure 11 (Chen,
2008).
Figure 11: BPM lifecycle (from Chen, 2008)
We see that the steps involved in BPM are a complete understanding of the business pro-
cess requirements, model building, simulations and defining key performance indicators.
The first step in the practical implementation of BPM is to assemble the business pro-
cesses of interest. A process execution engine should be used to support the execution of
operational processes.
The output of the process execution serves as the input for monitoring applica-
tions for analysis, either real time or long term analysis.
Chapter 2 Background 25
Ultimately the choice of the solution depends on the specific business require-
ments. Monitoring is the key to making improvements and for fixing real-time errors
without altering process design.
Integration of BPMS
The success of a business process depends on the coherent functioning of modeling, exe-
cution, and monitoring work. “SOA provides a standard interface to remove the commu-
nication difficulties inherent with different BPM applications and resources” (Chen,
2008).
2.3.4 Key Performance Indicators (KPIs)
Measurement of an organization’s performance stems from strategic financial, organiza-
tional and several other reasons. Each employee accomplishes tasks which directly or in-
directly have an effect on the global accomplishment of the enterprise, and aggregation of
this information is required.
These accomplishments are recorded by the employee’s supervisors and stored in
a data store in the enterprise for future access and analysis. These performance indicators
are measured, tracked and reported to produce the organization performance level. Man-
agement may introduce new indicators when there are new initiatives for change.
Monitoring KPIs helps increase activities that add more value and eliminate activ-
ities with less or no value to the enterprise, which in the end will provide a permanent
value for the organization as a whole (Rao Vallabhaneni, 2008).
KPIs are usually extracted from different entities within an enterprise; these enti-
ties can be software or non-software entities. An example of these entities is operational
goals. These KPIs drive the benchmark reports that define the employee’s performance
targets.
All the KPIs existing in an organization are equally important since they can af-
fect each other; therefore none of these KPIs should be ignored for the sake of another
one. One simply cannot rely on one KPI to evaluate the whole business. According to
Kaplan and Norton (1996; 2004) key performance measures should be aligned with the
strategies and action plans of the organization. They suggest translating the strategy into
Chapter 2 Background 26
measures that uniquely communicate the vision of the organization. Setting targets for
each measure provides the basis for strategy deployment, feedback, and review (Rao Val-
labhaneni, 2008).
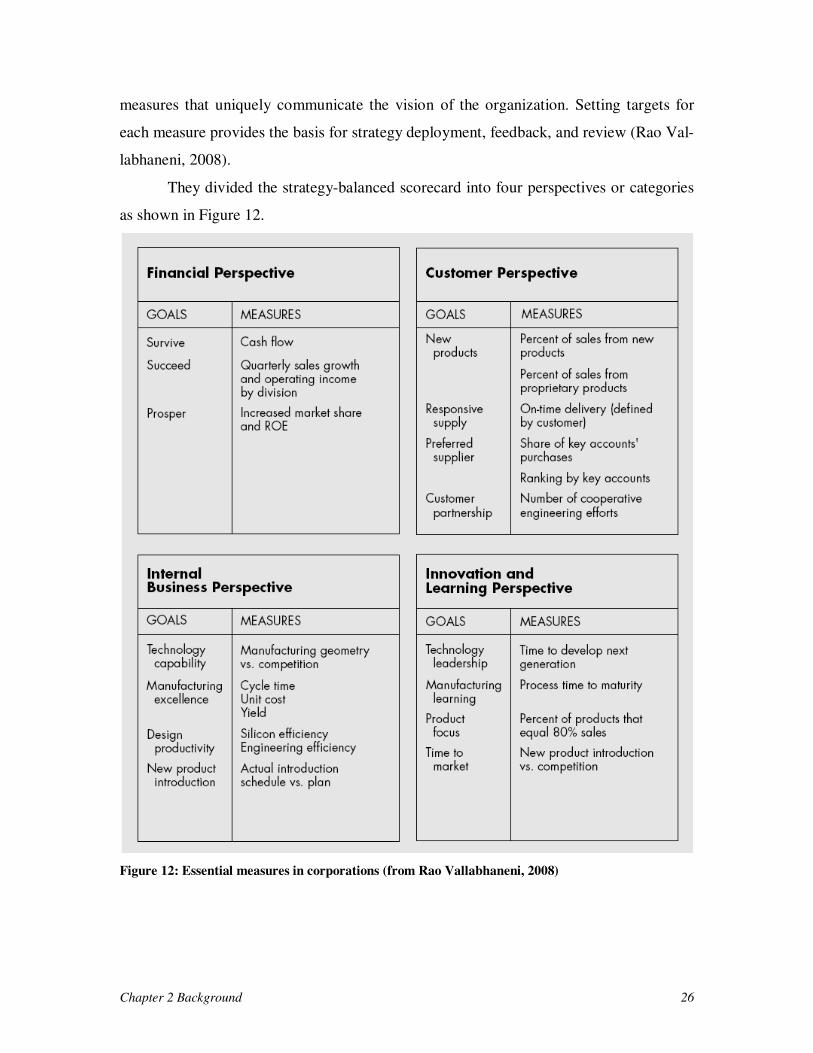
They divided the strategy-balanced scorecard into four perspectives or categories
as shown in Figure 12.
Figure 12: Essential measures in corporations (from Rao Vallabhaneni, 2008)
Chapter 2 Background 27
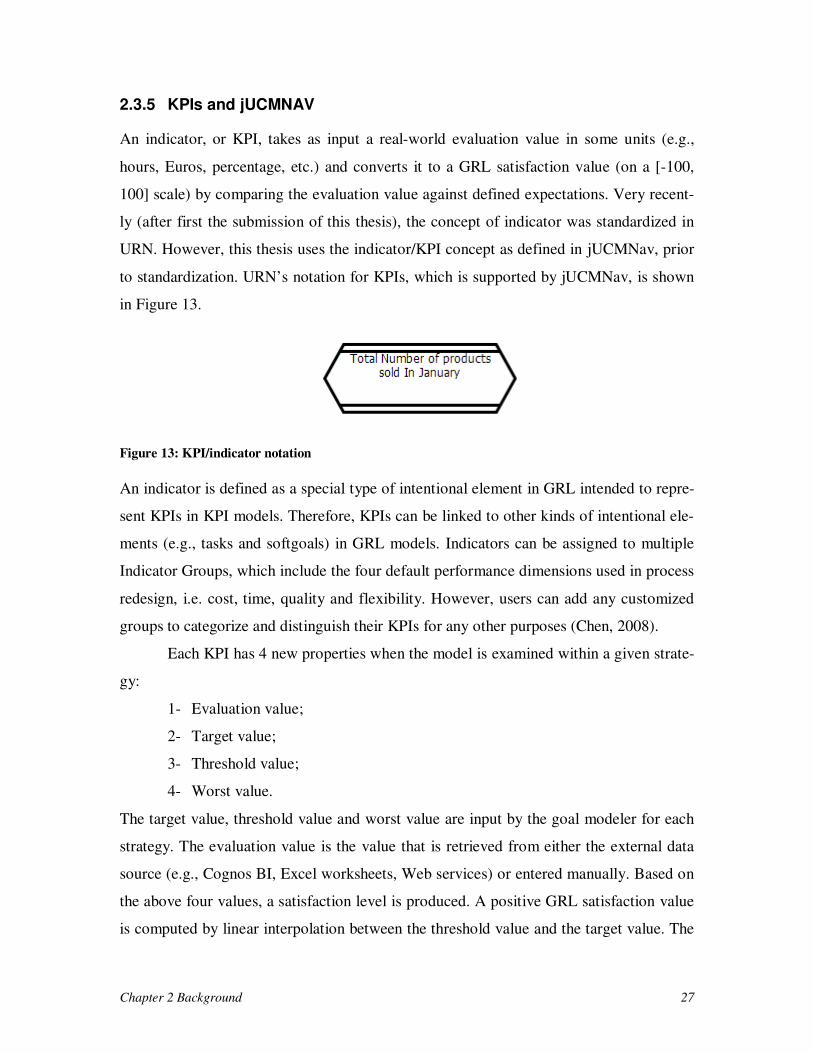
2.3.5 KPIs and jUCMNAV
An indicator, or KPI, takes as input a real-world evaluation value in some units (e.g.,
hours, Euros, percentage, etc.) and converts it to a GRL satisfaction value (on a [-100,
100] scale) by comparing the evaluation value against defined expectations. Very recent-
ly (after first the submission of this thesis), the concept of indicator was standardized in
URN. However, this thesis uses the indicator/KPI concept as defined in jUCMNav, prior
to standardization. URN’s notation for KPIs, which is supported by jUCMNav, is shown
in Figure 13.
Figure 13: KPI/indicator notation
An indicator is defined as a special type of intentional element in GRL intended to repre-
sent KPIs in KPI models. Therefore, KPIs can be linked to other kinds of intentional ele-
ments (e.g., tasks and softgoals) in GRL models. Indicators can be assigned to multiple
Indicator Groups, which include the four default performance dimensions used in process
redesign, i.e. cost, time, quality and flexibility. However, users can add any customized
groups to categorize and distinguish their KPIs for any other purposes (Chen, 2008).
Each KPI has 4 new properties when the model is examined within a given strate-
gy:
1- Evaluation value;
2- Target value;
3- Threshold value;
4- Worst value.
The target value, threshold value and worst value are input by the goal modeler for each
strategy. The evaluation value is the value that is retrieved from either the external data
source (e.g., Cognos BI, Excel worksheets, Web services) or entered manually. Based on
the above four values, a satisfaction level is produced. A positive GRL satisfaction value
is computed by linear interpolation between the threshold value and the target value. The
Chapter 2 Background 28
closer the evaluation value is to target value, the higher the satisfaction level is. A nega-
tive GRL satisfaction value computed by linear interpolation between the threshold value
and the worst value. The worst value maps to a -100 GRL satisfaction value, the thresh-
old to 0, and the target to 100. The computed satisfaction value is then propagated the
linked intentional elements within the entire goal model.
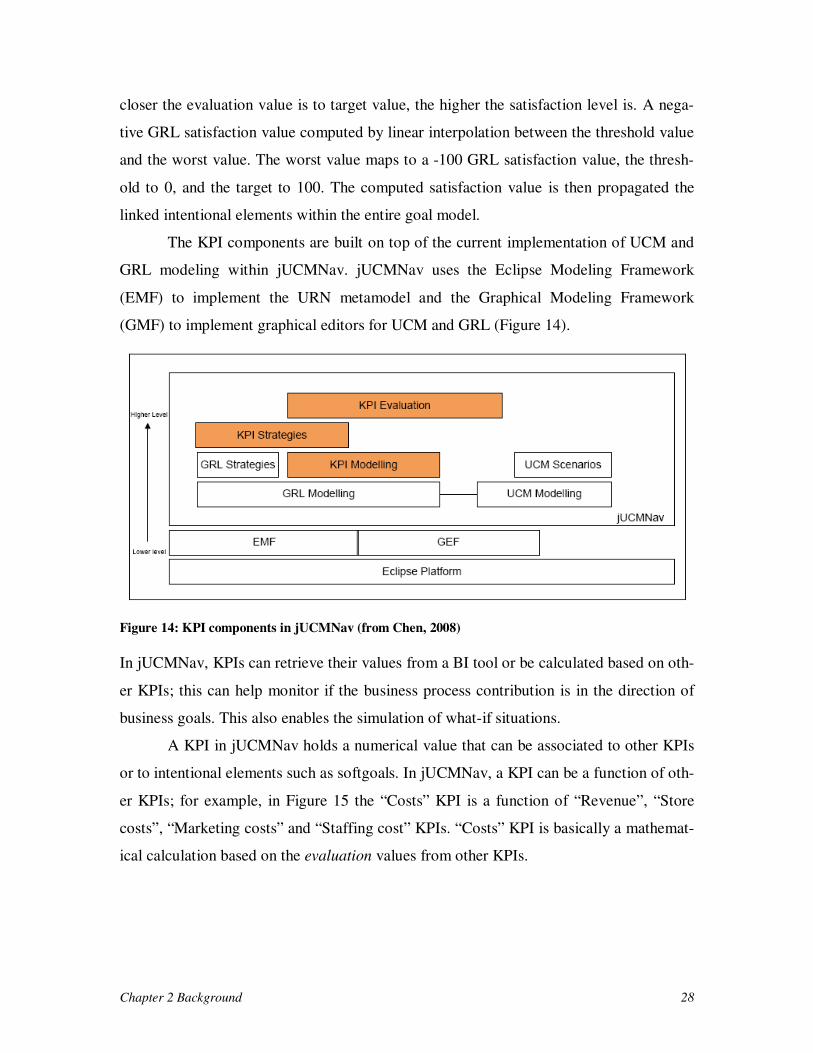
The KPI components are built on top of the current implementation of UCM and
GRL modeling within jUCMNav. jUCMNav uses the Eclipse Modeling Framework
(EMF) to implement the URN metamodel and the Graphical Modeling Framework
(GMF) to implement graphical editors for UCM and GRL (Figure 14).
Figure 14: KPI components in jUCMNav (from Chen, 2008)
In jUCMNav, KPIs can retrieve their values from a BI tool or be calculated based on oth-
er KPIs; this can help monitor if the business process contribution is in the direction of
business goals. This also enables the simulation of what-if situations.
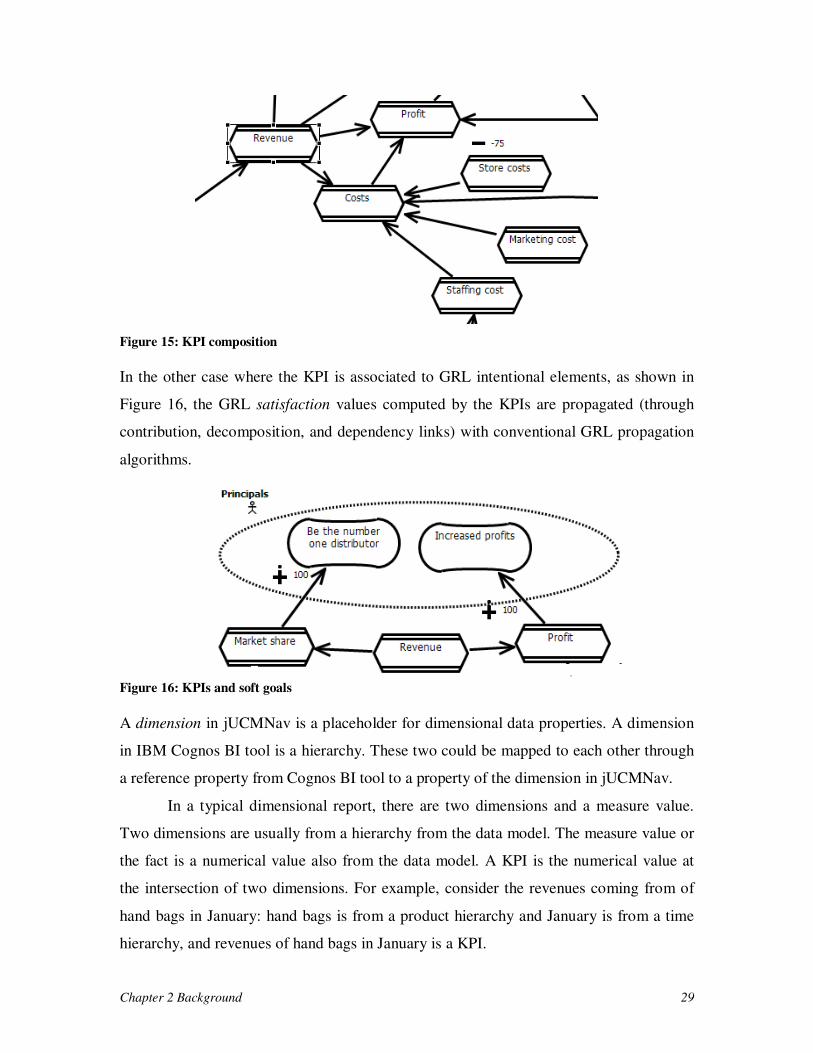
A KPI in jUCMNav holds a numerical value that can be associated to other KPIs
or to intentional elements such as softgoals. In jUCMNav, a KPI can be a function of oth-
er KPIs; for example, in Figure 15 the “Costs” KPI is a function of “Revenue”, “Store
costs”, “Marketing costs” and “Staffing cost” KPIs. “Costs” KPI is basically a mathemat-
ical calculation based on the evaluation values from other KPIs.
Chapter 2 Background 29
Figure 15: KPI composition
In the other case where the KPI is associated to GRL intentional elements, as shown in
Figure 16, the GRL satisfaction values computed by the KPIs are propagated (through
contribution, decomposition, and dependency links) with conventional GRL propagation
algorithms.
Figure 16: KPIs and soft goals
A dimension in jUCMNav is a placeholder for dimensional data properties. A dimension
in IBM Cognos BI tool is a hierarchy. These two could be mapped to each other through
a reference property from Cognos BI tool to a property of the dimension in jUCMNav.
In a typical dimensional report, there are two dimensions and a measure value.
Two dimensions are usually from a hierarchy from the data model. The measure value or
the fact is a numerical value also from the data model. A KPI is the numerical value at
the intersection of two dimensions. For example, consider the revenues coming from of
hand bags in January: hand bags is from a product hierarchy and January is from a time
hierarchy, and revenues of hand bags in January is a KPI.
Chapter 2 Background 30
The current implementation details will be further described in the next chapter.
2.4 Chapter Summary
In this chapter, concepts and technologies used in this research were introduced. These
include Business Intelligence, Cognos BI and two of its components: Cognos SDK and
Cognos Mashup Service. Data modeling in the context of business intelligence as well as
data modeling in the context of our research was examined as well.
The URN modeling language and its two components (UCM and GRL) were pre-
sented. We also explained why jUCMNav was chosen as the tool to model goals and sce-
narios in this research.
Then, we introduced business process management and how it relates to this re-
search. Key Performance Indicators and their utilisation in jUCMNav were briefly ex-
plained. The next chapter will discuss the efficiency of the current approach to handling
KPIs in jUCMNav as well as other related work.
Chapter 3 Related Work 31
Chapter 3 Related Work
This chapter focuses on an assessment of the current support for KPIs in jUCMNav and
also discusses related work in the area of indicators in goal models.
3.1 Current Approach from Chen (2008)
In Chen’s work, the notion of Key performance Indicator (KPI) was added to the
jUCMNav tool. This allowed the business user to define KPIs within multiple strategies.
This also allowed the user to propagate the KPI values to the higher level KPIs and ena-
bled aggregation of KPIs in composite goals.
3.1.1 Concepts and User Interface
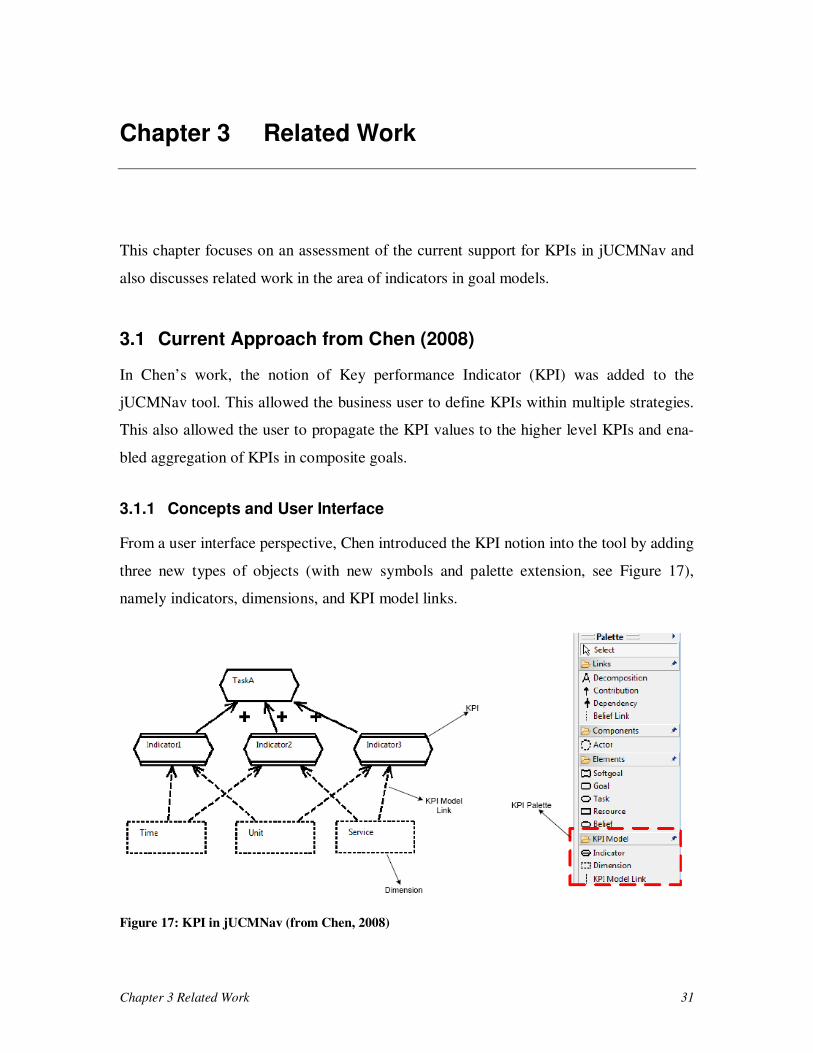
From a user interface perspective, Chen introduced the KPI notion into the tool by adding
three new types of objects (with new symbols and palette extension, see Figure 17),
namely indicators, dimensions, and KPI model links.
Figure 17: KPI in jUCMNav (from Chen, 2008)
Chapter 3 Related Work 32
In the above diagram, TaskA is measured by three performance indicators. Each indicator
is associated with two dimensions. The notion of dimension returns to the way the busi-
ness requirements are defined. For example, if a business user wants to monitor fluctua-
tion of a fact (e.g. revenue) within a time range, then a Time dimension should be intro-
duced into the goal model and this dimension should be linked to the key performance
indicator or the fact.
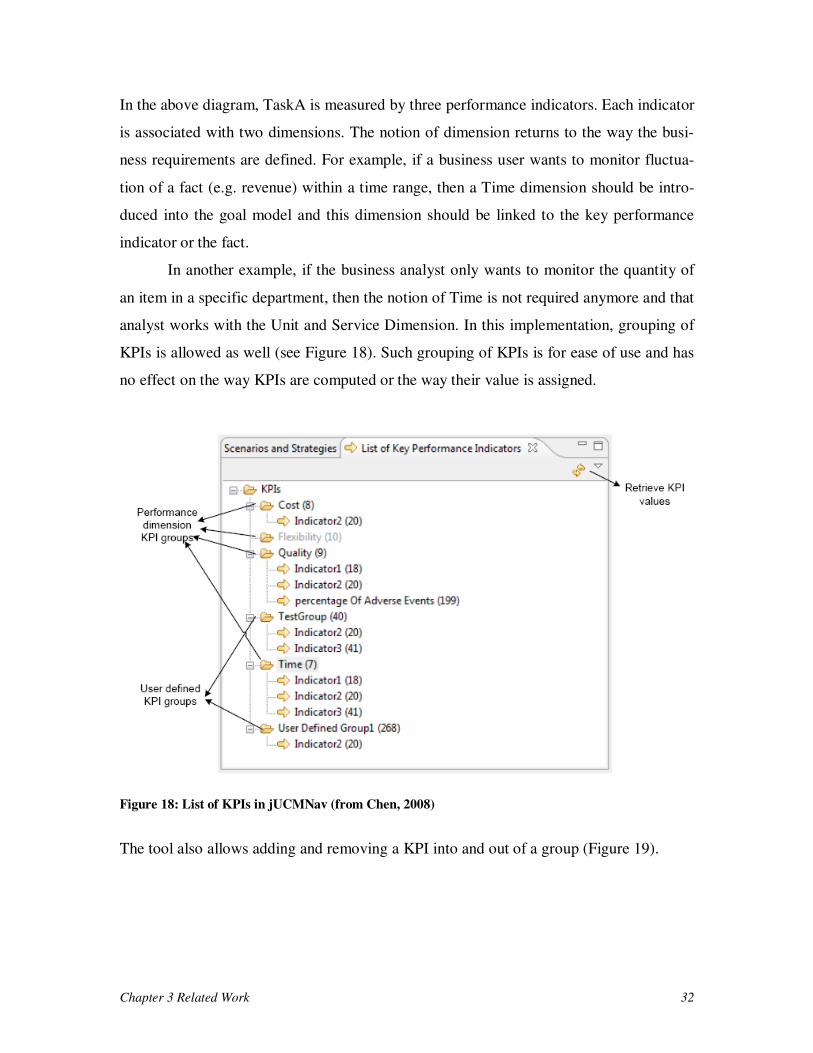
In another example, if the business analyst only wants to monitor the quantity of
an item in a specific department, then the notion of Time is not required anymore and that
analyst works with the Unit and Service Dimension. In this implementation, grouping of
KPIs is allowed as well (see Figure 18). Such grouping of KPIs is for ease of use and has
no effect on the way KPIs are computed or the way their value is assigned.
Figure 18: List of KPIs in jUCMNav (from Chen, 2008)
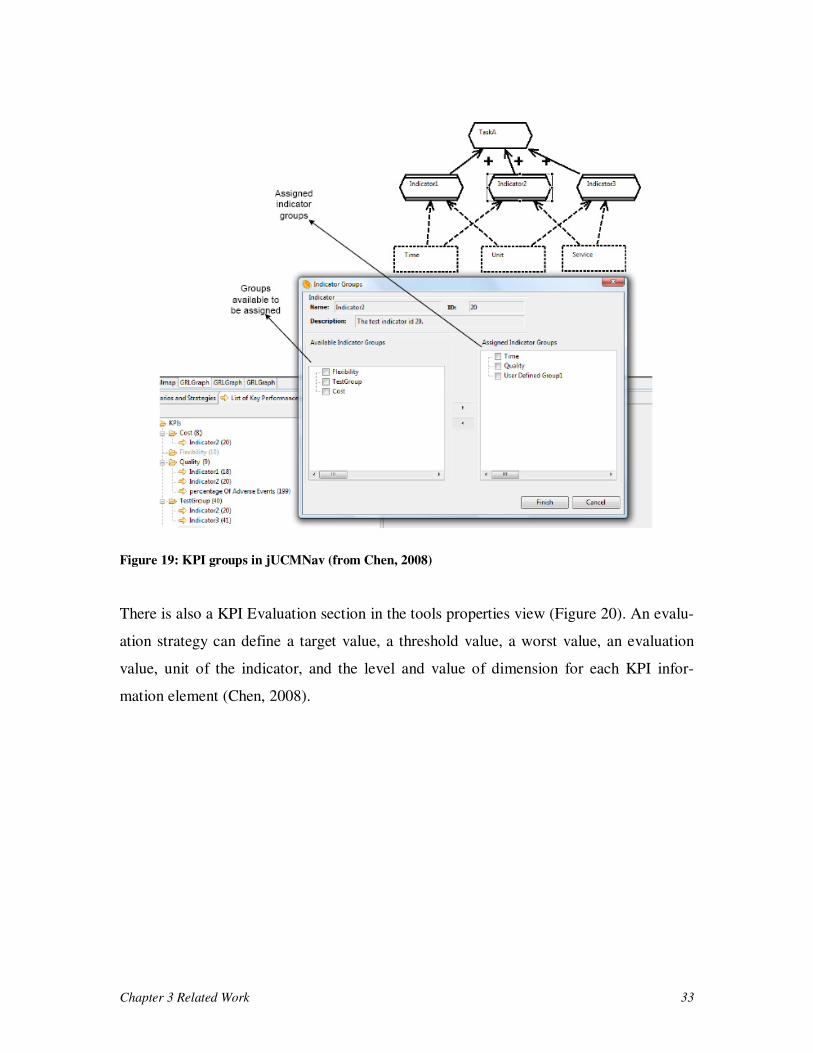
The tool also allows adding and removing a KPI into and out of a group (Figure 19).
Chapter 3 Related Work 33
Figure 19: KPI groups in jUCMNav (from Chen, 2008)
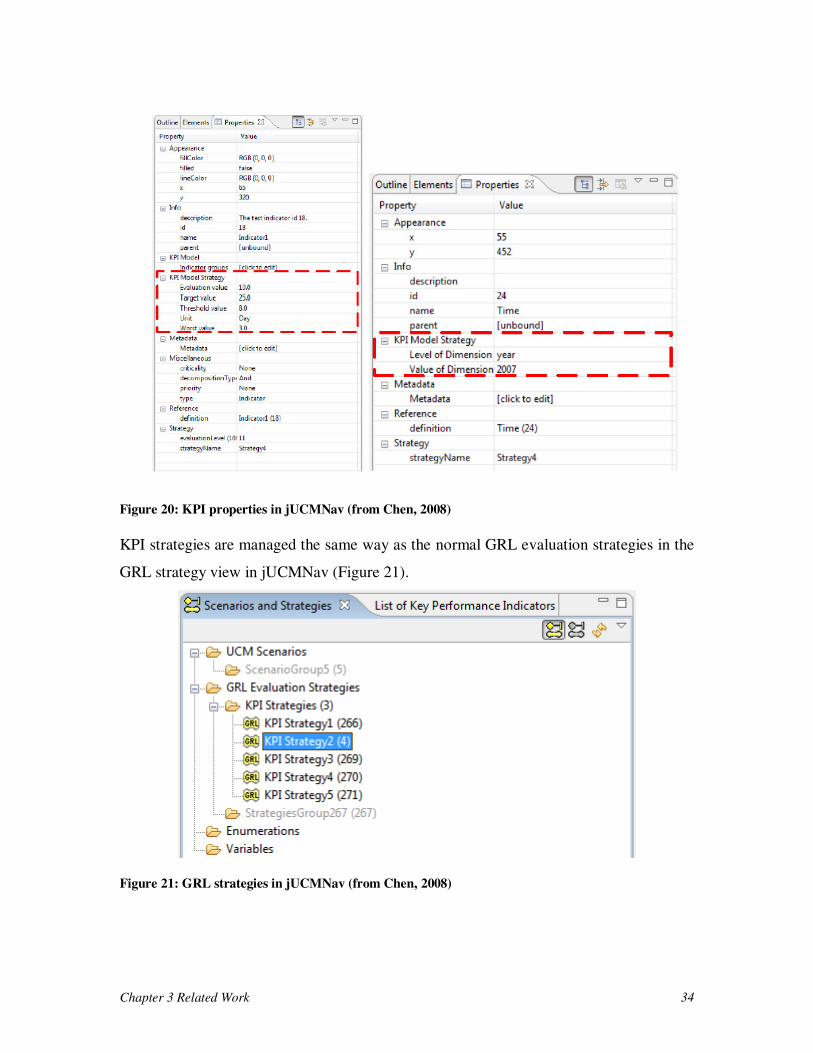
There is also a KPI Evaluation section in the tools properties view (Figure 20). An evalu-
ation strategy can define a target value, a threshold value, a worst value, an evaluation
value, unit of the indicator, and the level and value of dimension for each KPI infor-
mation element (Chen, 2008).
Chapter 3 Related Work 34
Figure 20: KPI properties in jUCMNav (from Chen, 2008)
KPI strategies are managed the same way as the normal GRL evaluation strategies in the
GRL strategy view in jUCMNav (Figure 21).
Figure 21: GRL strategies in jUCMNav (from Chen, 2008)
Chapter 3 Related Work 35
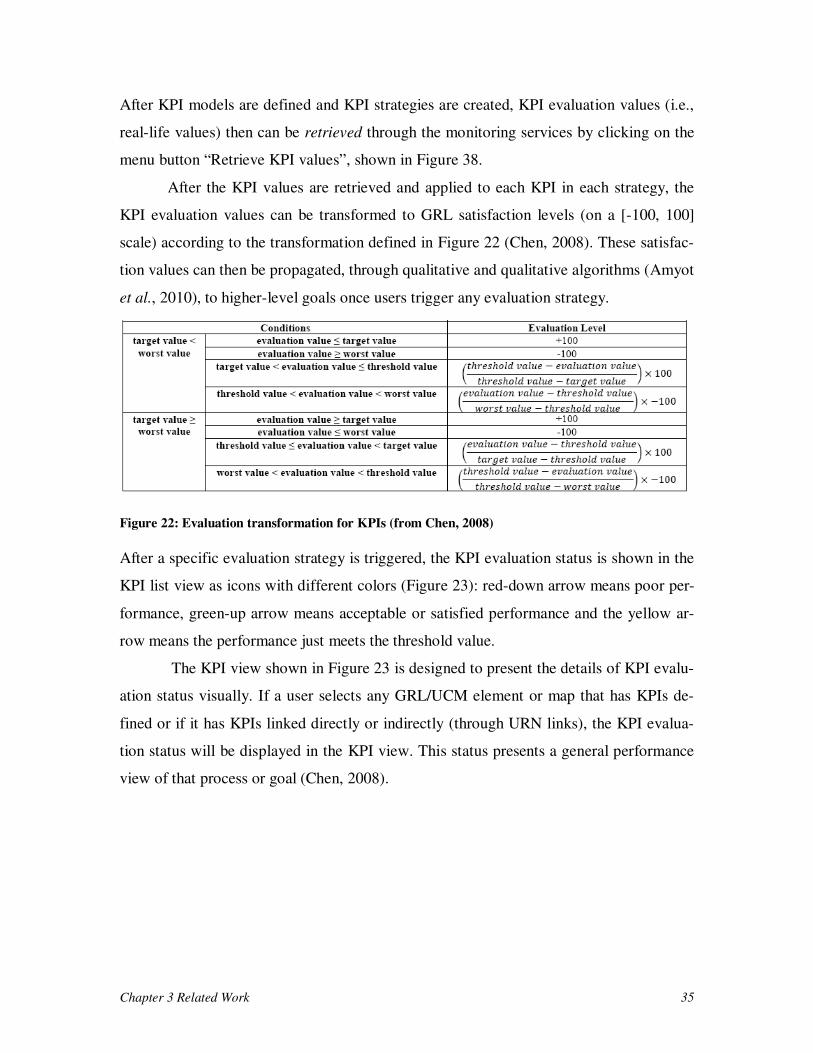
After KPI models are defined and KPI strategies are created, KPI evaluation values (i.e.,
real-life values) then can be retrieved through the monitoring services by clicking on the
menu button “Retrieve KPI values”, shown in Figure 38.
After the KPI values are retrieved and applied to each KPI in each strategy, the
KPI evaluation values can be transformed to GRL satisfaction levels (on a [-100, 100]
scale) according to the transformation defined in Figure 22 (Chen, 2008). These satisfac-
tion values can then be propagated, through qualitative and qualitative algorithms (Amyot
et al., 2010), to higher-level goals once users trigger any evaluation strategy.
Figure 22: Evaluation transformation for KPIs (from Chen, 2008)
After a specific evaluation strategy is triggered, the KPI evaluation status is shown in the
KPI list view as icons with different colors (Figure 23): red-down arrow means poor per-
formance, green-up arrow means acceptable or satisfied performance and the yellow ar-
row means the performance just meets the threshold value.
The KPI view shown in Figure 23 is designed to present the details of KPI evalu-
ation status visually. If a user selects any GRL/UCM element or map that has KPIs de-
fined or if it has KPIs linked directly or indirectly (through URN links), the KPI evalua-
tion status will be displayed in the KPI view. This status presents a general performance
view of that process or goal (Chen, 2008).
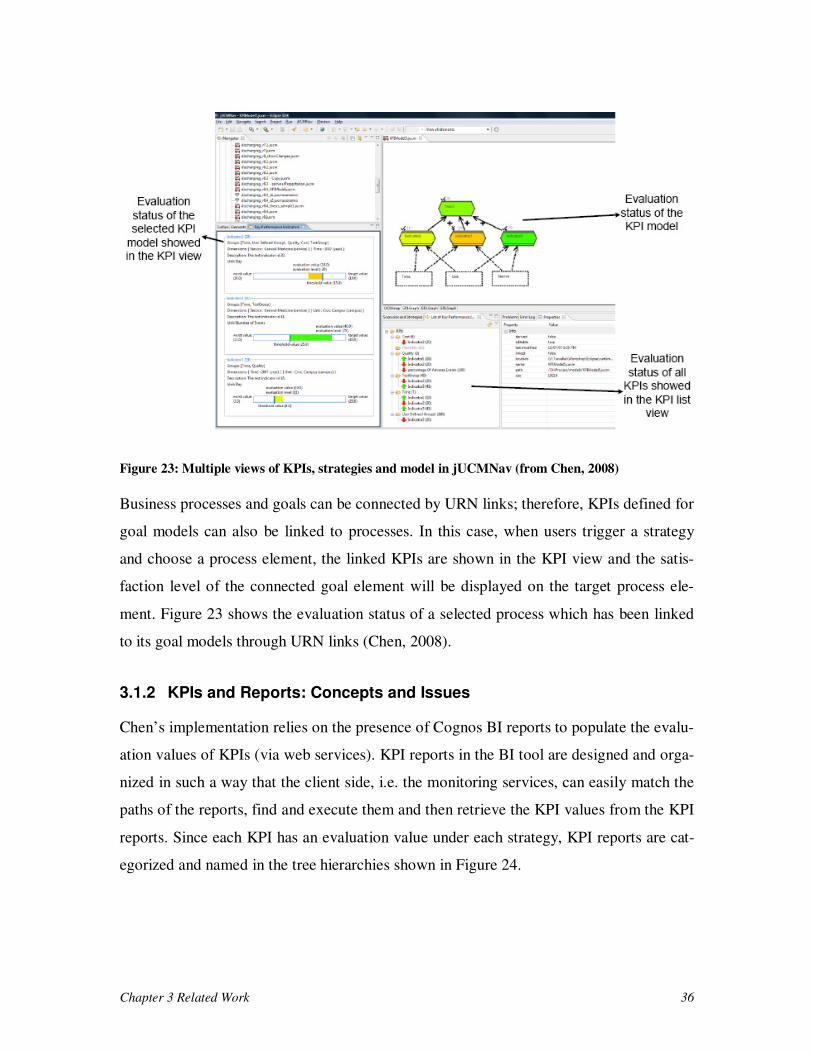
Chapter 3 Related Work 36
Figure 23: Multiple views of KPIs, strategies and model in jUCMNav (from Chen, 2008)
Business processes and goals can be connected by URN links; therefore, KPIs defined for
goal models can also be linked to processes. In this case, when users trigger a strategy
and choose a process element, the linked KPIs are shown in the KPI view and the satis-
faction level of the connected goal element will be displayed on the target process ele-
ment. Figure 23 shows the evaluation status of a selected process which has been linked
to its goal models through URN links (Chen, 2008).
3.1.2 KPIs and Reports: Concepts and Issues
Chen’s implementation relies on the presence of Cognos BI reports to populate the evalu-
ation values of KPIs (via web services). KPI reports in the BI tool are designed and orga-
nized in such a way that the client side, i.e. the monitoring services, can easily match the
paths of the reports, find and execute them and then retrieve the KPI values from the KPI
reports. Since each KPI has an evaluation value under each strategy, KPI reports are cat-
egorized and named in the tree hierarchies shown in Figure 24.
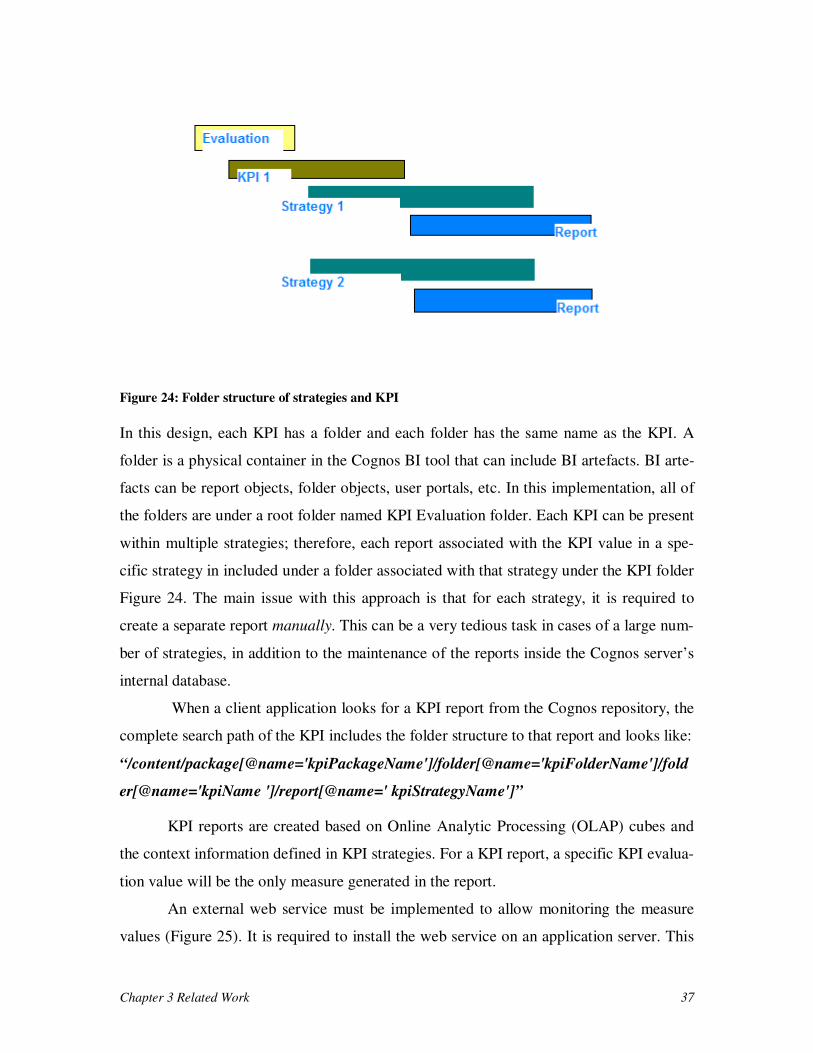
Chapter 3 Related Work 37
Figure 24: Folder structure of strategies and KPI
In this design, each KPI has a folder and each folder has the same name as the KPI. A
folder is a physical container in the Cognos BI tool that can include BI artefacts. BI arte-
facts can be report objects, folder objects, user portals, etc. In this implementation, all of
the folders are under a root folder named KPI Evaluation folder. Each KPI can be present
within multiple strategies; therefore, each report associated with the KPI value in a spe-
cific strategy in included under a folder associated with that strategy under the KPI folder
Figure 24. The main issue with this approach is that for each strategy, it is required to
create a separate report manually. This can be a very tedious task in cases of a large num-
ber of strategies, in addition to the maintenance of the reports inside the Cognos server’s
internal database.
When a client application looks for a KPI report from the Cognos repository, the
complete search path of the KPI includes the folder structure to that report and looks like:
“/content/package[@name='kpiPackageName']/folder[@name='kpiFolderName']/fold
er[@name='kpiName ']/report[@name=' kpiStrategyName']”
KPI reports are created based on Online Analytic Processing (OLAP) cubes and
the context information defined in KPI strategies. For a KPI report, a specific KPI evalua-
tion value will be the only measure generated in the report.
An external web service must be implemented to allow monitoring the measure
values (Figure 25). It is required to install the web service on an application server. This
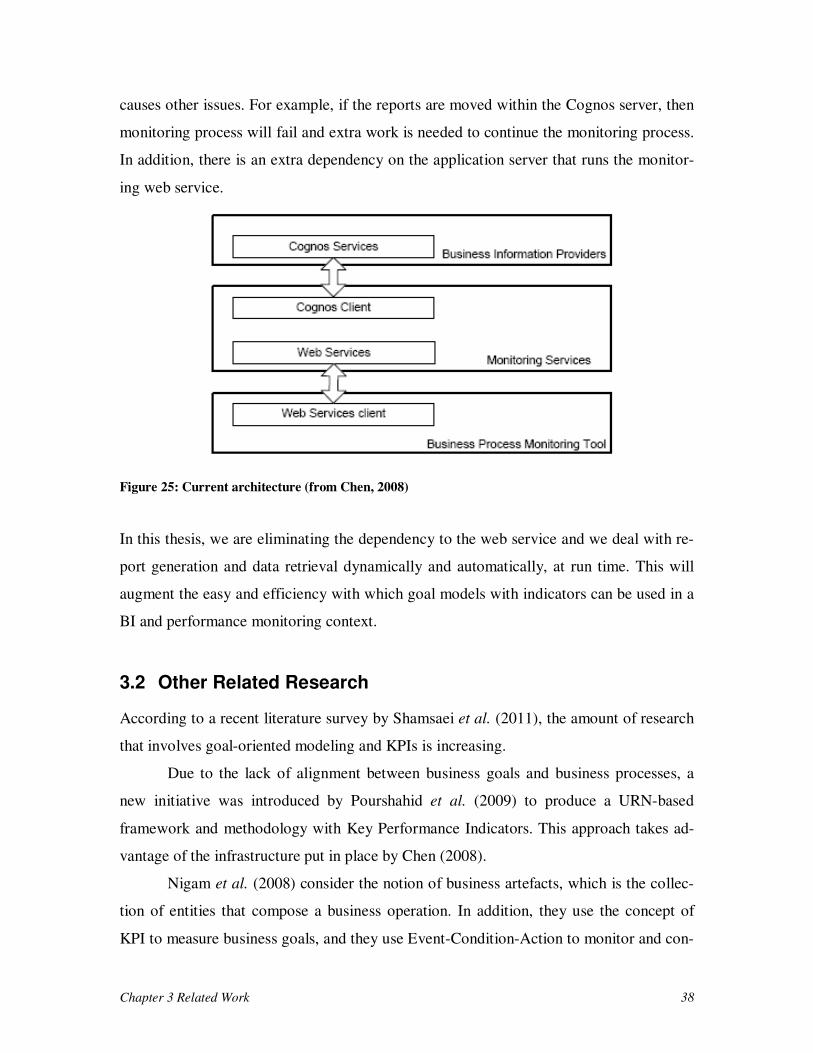
Chapter 3 Related Work 38
causes other issues. For example, if the reports are moved within the Cognos server, then
monitoring process will fail and extra work is needed to continue the monitoring process.
In addition, there is an extra dependency on the application server that runs the monitor-
ing web service.
Figure 25: Current architecture (from Chen, 2008)
In this thesis, we are eliminating the dependency to the web service and we deal with re-
port generation and data retrieval dynamically and automatically, at run time. This will
augment the easy and efficiency with which goal models with indicators can be used in a
BI and performance monitoring context.
3.2 Other Related Research
According to a recent literature survey by Shamsaei et al. (2011), the amount of research
that involves goal-oriented modeling and KPIs is increasing.
Due to the lack of alignment between business goals and business processes, a
new initiative was introduced by Pourshahid et al. (2009) to produce a URN-based
framework and methodology with Key Performance Indicators. This approach takes ad-
vantage of the infrastructure put in place by Chen (2008).
Nigam et al. (2008) consider the notion of business artefacts, which is the collec-
tion of entities that compose a business operation. In addition, they use the concept of
KPI to measure business goals, and they use Event-Condition-Action to monitor and con-
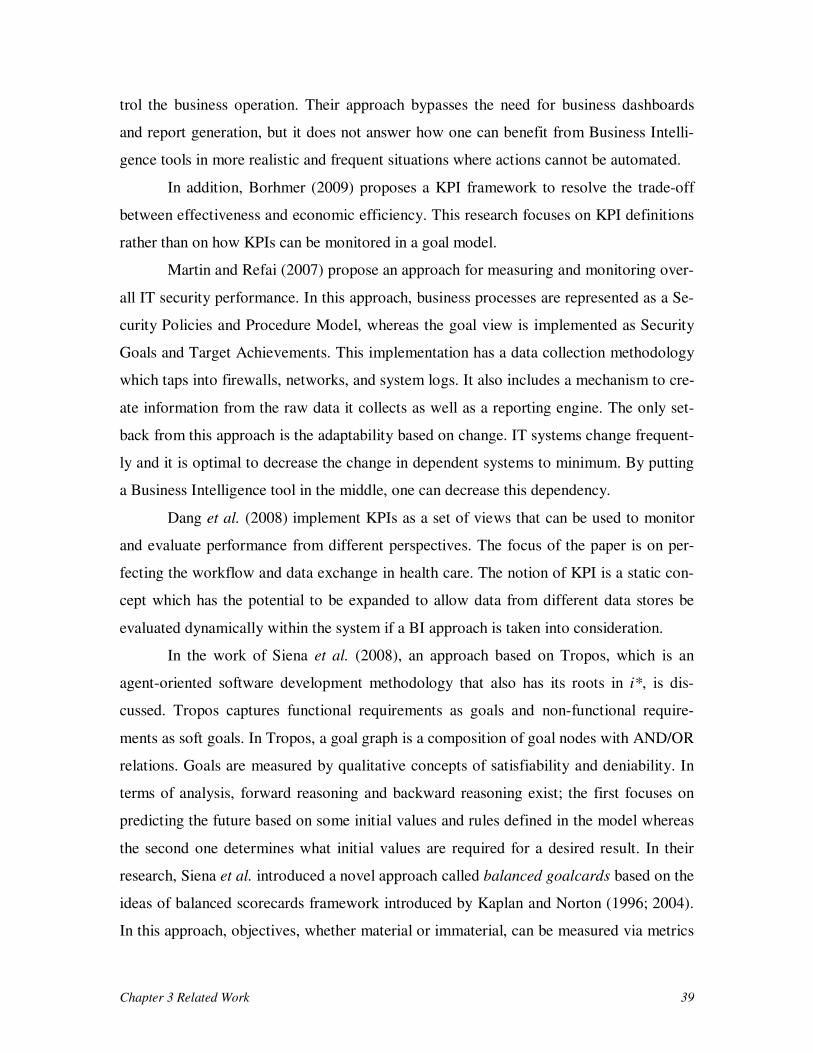
Chapter 3 Related Work 39
trol the business operation. Their approach bypasses the need for business dashboards
and report generation, but it does not answer how one can benefit from Business Intelli-
gence tools in more realistic and frequent situations where actions cannot be automated.
In addition, Borhmer (2009) proposes a KPI framework to resolve the trade-off
between effectiveness and economic efficiency. This research focuses on KPI definitions
rather than on how KPIs can be monitored in a goal model.
Martin and Refai (2007) propose an approach for measuring and monitoring over-
all IT security performance. In this approach, business processes are represented as a Se-
curity Policies and Procedure Model, whereas the goal view is implemented as Security
Goals and Target Achievements. This implementation has a data collection methodology
which taps into firewalls, networks, and system logs. It also includes a mechanism to cre-
ate information from the raw data it collects as well as a reporting engine. The only set-
back from this approach is the adaptability based on change. IT systems change frequent-
ly and it is optimal to decrease the change in dependent systems to minimum. By putting
a Business Intelligence tool in the middle, one can decrease this dependency.
Dang et al. (2008) implement KPIs as a set of views that can be used to monitor
and evaluate performance from different perspectives. The focus of the paper is on per-
fecting the workflow and data exchange in health care. The notion of KPI is a static con-
cept which has the potential to be expanded to allow data from different data stores be
evaluated dynamically within the system if a BI approach is taken into consideration.
In the work of Siena et al. (2008), an approach based on Tropos, which is an
agent-oriented software development methodology that also has its roots in i*, is dis-
cussed. Tropos captures functional requirements as goals and non-functional require-
ments as soft goals. In Tropos, a goal graph is a composition of goal nodes with AND/OR
relations. Goals are measured by qualitative concepts of satisfiability and deniability. In
terms of analysis, forward reasoning and backward reasoning exist; the first focuses on
predicting the future based on some initial values and rules defined in the model whereas
the second one determines what initial values are required for a desired result. In their
research, Siena et al. introduced a novel approach called balanced goalcards based on the
ideas of balanced scorecards framework introduced by Kaplan and Norton (1996; 2004).
In this approach, objectives, whether material or immaterial, can be measured via metrics
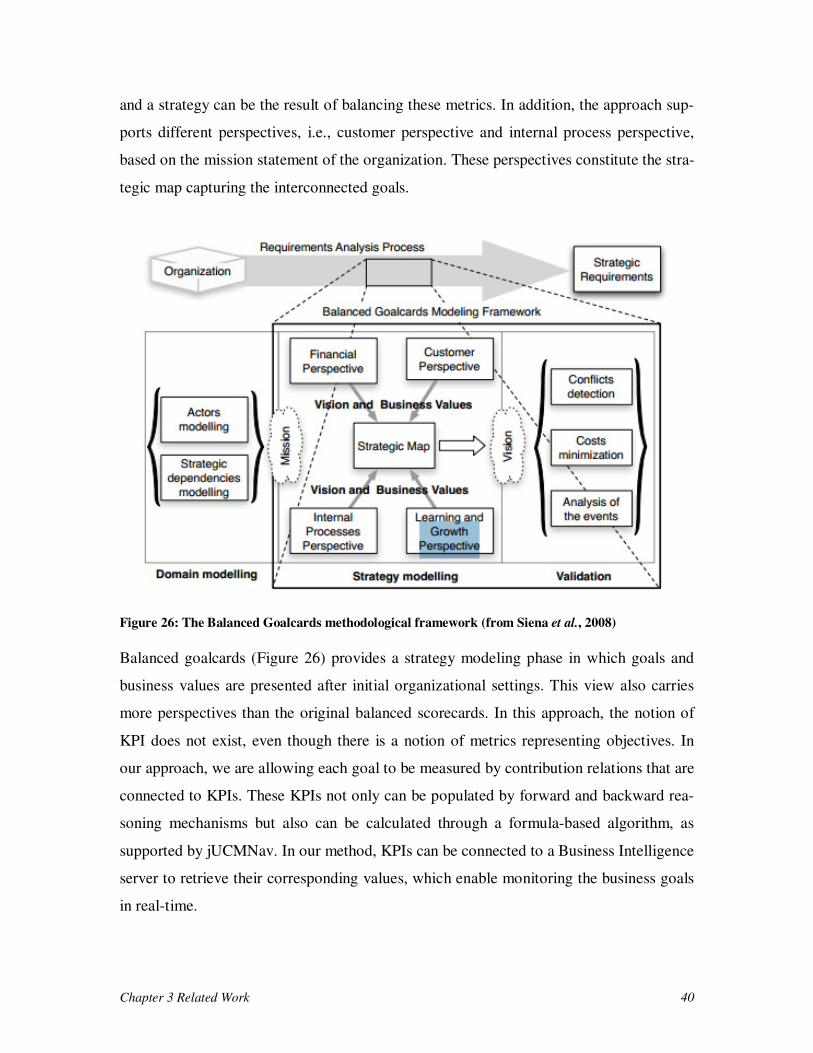
Chapter 3 Related Work 40
and a strategy can be the result of balancing these metrics. In addition, the approach sup-
ports different perspectives, i.e., customer perspective and internal process perspective,
based on the mission statement of the organization. These perspectives constitute the stra-
tegic map capturing the interconnected goals.
Figure 26: The Balanced Goalcards methodological framework (from Siena et al., 2008)
Balanced goalcards (Figure 26) provides a strategy modeling phase in which goals and
business values are presented after initial organizational settings. This view also carries
more perspectives than the original balanced scorecards. In this approach, the notion of
KPI does not exist, even though there is a notion of metrics representing objectives. In
our approach, we are allowing each goal to be measured by contribution relations that are
connected to KPIs. These KPIs not only can be populated by forward and backward rea-
soning mechanisms but also can be calculated through a formula-based algorithm, as
supported by jUCMNav. In our method, KPIs can be connected to a Business Intelligence
server to retrieve their corresponding values, which enable monitoring the business goals
in real-time.
Chapter 3 Related Work 41
In Martinez et al. (2010), another Tropos-based approach is explored. This ap-
proach consists of two main processes:
•••• Defining the method to model business processes from a goal perspective,
which includes defining a set of metrics to measure process performance;
•••• Defining the method to control and monitor business process.
Figure 27: Monitoring method (from Martinez et al., 2010)
Their research focuses more on goal modeling and on how the entities in this framework
are interconnected to reflect changes across the goal model. The powerful characteristics
of this approach (see Figure 27) are to determine how, why and when the actors develop
tasks and process in the business. Metrics defined in their method do not have the concept
of dimensions as in our approach. In addition, the capability to integrate with a BI tool to
monitor the business process does not exist in their approach.
Popava and Sharpanskykh (2011) introduce a new syntax for goal modeling.
Their method includes the notion of top-down and bottom-up analysis. There is a method
for evaluation of KPIs called “goal-based performance evaluation”, which follows propa-
gation of defined rules when defining the goal model. This research focuses on how goals
are interconnected. It also builds on another related paper by Popova and Treur (2005) on
formalising a specification language for performance indicators. Even though this re-
search is rich in defining goal models and KPIs, there is still a need for a performance
monitoring system in place as well as for the ability to connect to a BI tool, as the latter
offer powerful and reusable means to connect to heterogeneous information sources and
to reason about data aggregation along different dimensions.
Behnam et al. (2009) uses a goal-driven method, considering both organization
and system goals, to design and develop patient surveillance software for monitoring ad-
Chapter 3 Related Work 42
verse events. This method creates a database to store information related to patients and
connects the monitoring tool to that database. This approach focuses on creating a moni-
toring system using jUCMNav with an external database; there is no integration between
a BI tool and a monitoring system.
Vrbaski et al. (2012) recently combined a rule engine with jUCMNav’s goal en-
gine to support the dynamic adaptation of business processes. The rule engine is used for
simple conditions whereas a goal model is used to reason about trade-offs involving con-
flicting goals from different actors. A web service is used to collect information from an
external database in order to populate KPI evaluation values. The UCM language was
also extended to support interactions with users (input of values, and display of infor-
mation). Again however, there is no connection to a layer that is as powerful as a leading
BI tool.
3.3 Chapter Summary
In this chapter, we discussed the current approach from Chen (2008) in detail, including
its implementation in jUCMNav. The main issues with this approach are the manual labor
required to produce BI reports (which prevent dynamic updates), and the dependency to a
Web service infrastructure.
We also discussed the closest related work that has been conducted in the field of
business process monitoring and indicator-based goal modeling. Interesting features and
current limitations of these approaches (especially in terms of interoperability with BI
infrastructure to populate KPIs in the goal model) were also discussed.
The next chapter will present the details of our new solution to the issue of BI-
based KPI updates in goal models targeted at performance monitoring of organizations
and of their business processes.
Chapter 4 New Tool-Supported Approach 43
Chapter 4 New Tool-Supported Approach
This chapter enumerates the limitations of the current approach for populating KPI values
in goal models based on BI reports. Then, a new and more efficient solution is proposed
and illustrated, together with an explanation of important design decisions.
4.1 Limitations of the Current Implementation
In the previous research done by Chen (2008), there are several challenges and shortcom-
ings:
•••• The user needs to have detailed knowledge of the Cognos Business Intelligence
product as an author and content administrator. The user has to create a tree
structure based on different strategies within the Cognos environment as well
as a separate report for each KPI in each strategy in the goal model (and this
grows quickly to a large set of reports). This level of knowledge requires ex-
tensive training. Such training is expensive, and there is always a chance that
trained employees leave the company. The company then has to reinvest in
training newly hired people and bringing them up to speed to where the last
person left off. This can usually postpone software releases, which in the end
will result in delays in delivering the results to the stakeholders.
•••• The user needs to have detailed knowledge of web services. To be able to use
this approach, the user has to install a web service and hence needs a web ap-
plication server running (such as Websphere application server). The use of
such products requires licensing of the product per user in any organization. In
addition, this approach is platform dependent.
•••• Performance is relatively slow for large number of KPIs, as many reports need
to be generated.
Chapter 4 New Tool-Supported Approach 44
•••• Report maintenance becomes a bottleneck as the number of strategies increase
as well as the number of KPIs increases within the strategies.
•••• Modifications of the KPI values on the fly require the user to access the
Cognos environment, create a new structure for the new value, create a report
and run the report. This is not convenient in a fast-pace environment, especial-
ly if there is no subject matter specialist available.
•••• KPI value retrieval is limited to only one Cognos server. Nowadays, within an
enterprise, there are distributed systems with different levels of user access and
capabilities within different servers. One should be able to address KPIs com-
ing from different servers without having to do extra setup or web services de-
ployment.
In the new approach defined in this thesis, all the above shortcomings are addressed and a
more efficient solution to the problem is proposed.
4.2 Design Decisions
There are always several ways of designing a solution but in our context we decided to go
with the ones that made the design more elegant and paved the way for future extensions.
We decided to automate many activities that were done manually in the previous
approach. This is an important step towards a more dynamic approach to Business Pro-
cess Monitoring. We minimize user interactions on the server side. IBM Cognos SDK is
used for all the maintenance and bookkeeping actions. Another option was also consid-
ered which consisted in building SOAP messages on the jUCMNav side, sending these
messages to the BI server, receiving the response, and building further requests after un-
marshalling the message received. This could decrease the load and computation cycle on
the server, but would add more complexity to our design. If in the future the message
specification changes, we would also need to adapt to these changes and this could lead
to a lot of overhead on the jUCMNav developer if one is not familiar with the specifica-
tions of Cognos’ messaging capabilities. Using the SDK API removes any overhead for
Chapter 4 New Tool-Supported Approach 45
message creation and simplifies adaptability in spite of increasing server load and compu-
tation time.
The next decision was to choose between the Cognos SDK and the Cognos
Mashup Service (CMS) to retrieve the data (for KPI evaluations).There are two types of
HTTP-based calls in Cognos product: REST and SOAP calls. Cognos SDK utilises
SOAP calls only whereas Cognos mashup service utilizes both REST and SOAP calls. It
depends on the user’s preference to choose REST or SOAP when using Cognos mashup
service. SOAP API for Cognos mashup service provides the user with more control over
the retrieved data whereas REST provides fast access to the data retrieved. We decided to
use the Cognos SDK for any call except data retrieval, e.g., for report creation and for
folder creation and authentication. In this thesis, CMS was chosen for report run and data
retrieval because CMS supports the use of a more efficient REST API. In addition, the
jUCMNav designer would require understanding the Cognos SDK object model to be
able to use it in a data retrieval context. CMS uses a REST API and with little program-
ming knowledge designers can retrieve any part of the BI data in a short amount of time.
The Cognos SDK would retrieve resulted report in XML format which also require fur-
ther XML parsing to get the desired value. CMS has the option to return the data in a
JSON format, which is currently the fastest data format for web communication, and very
minimal parsing is required to get the desired value. XML parsing would likely require
including additional libraries. Therefore CMS is the better alternative as it benefits from
low utilization overhead, fast transfer rate, and fast value retrieval when compared to
Cognos SDK.
In terms of validating the well-formedness of our goal models and data entry in
the models, we decided to use the Object Constraint Language. OCL constraints on the
URN models allow users to detect errors by applying validation checks before communi-
cating with the BI server. These errors could be caused by user themselves; for example,
they might have left a mandatory field behind. One alternative was to write Java valida-
tion code, but this could be a cumbersome task as the number of fields grows with differ-
ent data types of those fields. OCL is an elegant solution to this problem, especially in the
context of jUCMNav, which already offers the infrastructure to define and check user-
selectable rules and to report violations (Amyot and Yan, 2008). OCL rules used for this
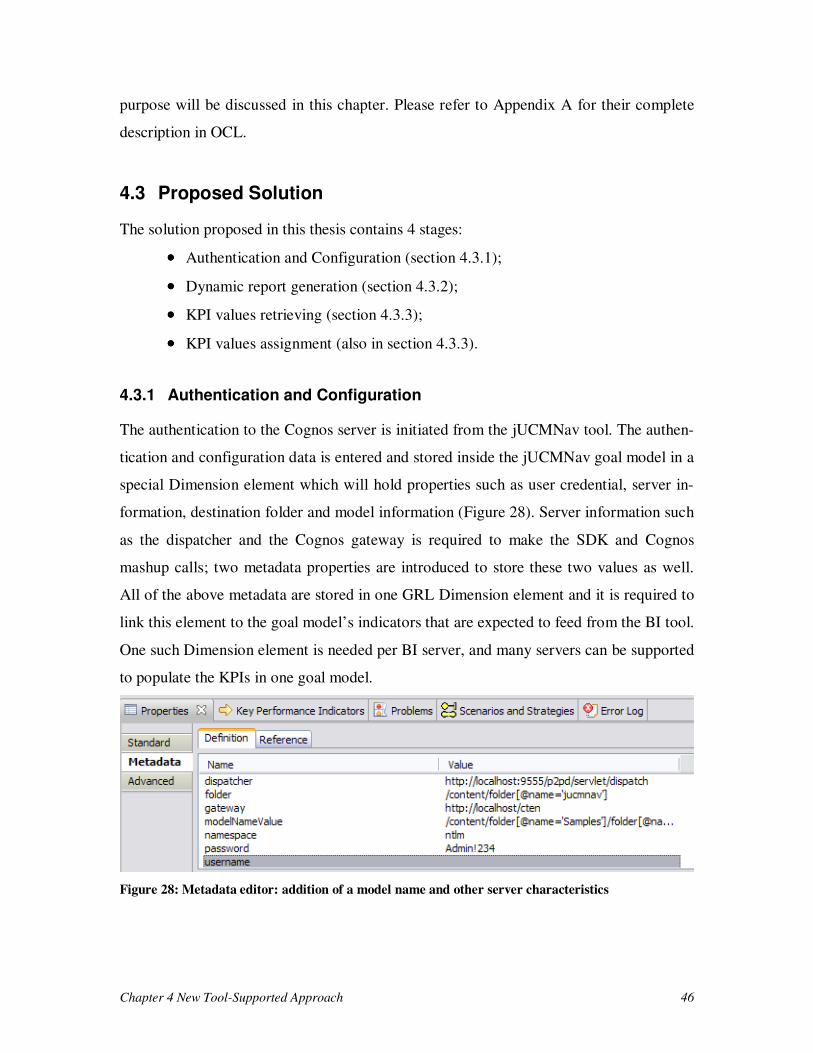
Chapter 4 New Tool-Supported Approach 46
purpose will be discussed in this chapter. Please refer to Appendix A for their complete
description in OCL.
4.3 Proposed Solution
The solution proposed in this thesis contains 4 stages:
•••• Authentication and Configuration (section 4.3.1);
•••• Dynamic report generation (section 4.3.2);
•••• KPI values retrieving (section 4.3.3);
•••• KPI values assignment (also in section 4.3.3).
4.3.1 Authentication and Configuration
The authentication to the Cognos server is initiated from the jUCMNav tool. The authen-
tication and configuration data is entered and stored inside the jUCMNav goal model in a
special Dimension element which will hold properties such as user credential, server in-
formation, destination folder and model information (Figure 28). Server information such
as the dispatcher and the Cognos gateway is required to make the SDK and Cognos
mashup calls; two metadata properties are introduced to store these two values as well.
All of the above metadata are stored in one GRL Dimension element and it is required to
link this element to the goal model’s indicators that are expected to feed from the BI tool.
One such Dimension element is needed per BI server, and many servers can be supported
to populate the KPIs in one goal model.
Figure 28: Metadata editor: addition of a model name and other server characteristics
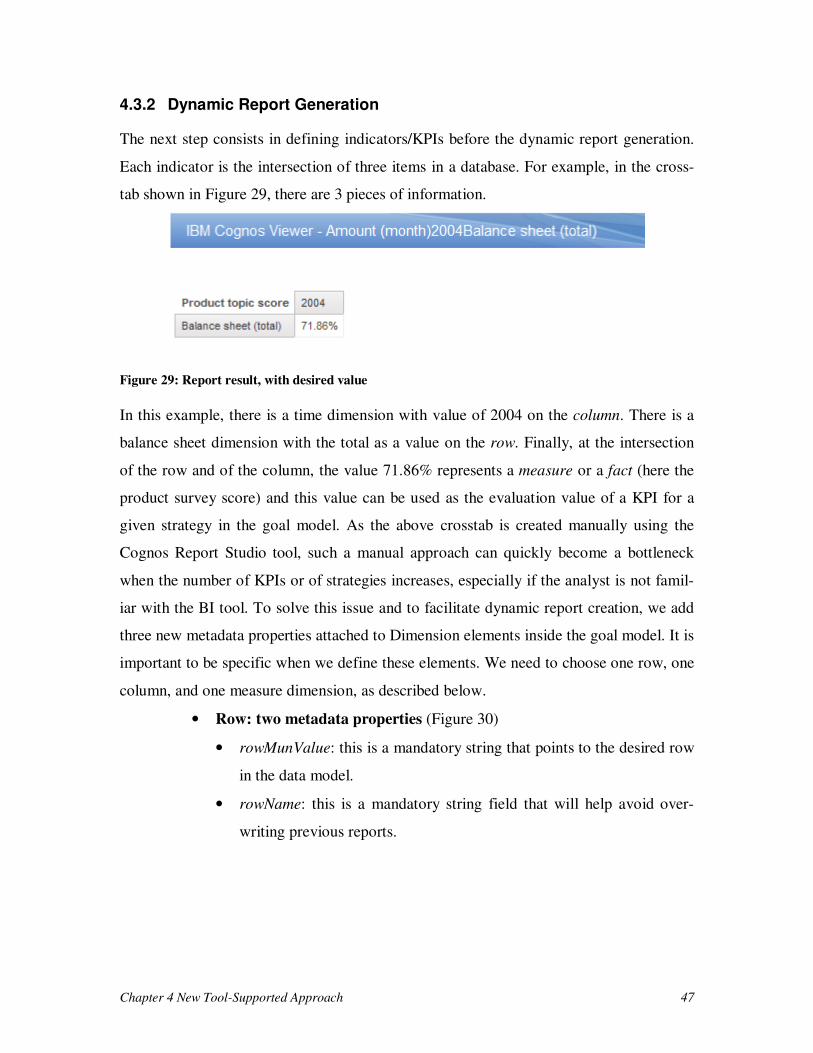
Chapter 4 New Tool-Supported Approach 47
4.3.2 Dynamic Report Generation
The next step consists in defining indicators/KPIs before the dynamic report generation.
Each indicator is the intersection of three items in a database. For example, in the cross-
tab shown in Figure 29, there are 3 pieces of information.
Figure 29: Report result, with desired value
In this example, there is a time dimension with value of 2004 on the column. There is a
balance sheet dimension with the total as a value on the row. Finally, at the intersection
of the row and of the column, the value 71.86% represents a measure or a fact (here the
product survey score) and this value can be used as the evaluation value of a KPI for a
given strategy in the goal model. As the above crosstab is created manually using the
Cognos Report Studio tool, such a manual approach can quickly become a bottleneck
when the number of KPIs or of strategies increases, especially if the analyst is not famil-
iar with the BI tool. To solve this issue and to facilitate dynamic report creation, we add
three new metadata properties attached to Dimension elements inside the goal model. It is
important to be specific when we define these elements. We need to choose one row, one
column, and one measure dimension, as described below.
• Row: two metadata properties (Figure 30)
• rowMunValue: this is a mandatory string that points to the desired row
in the data model.
• rowName: this is a mandatory string field that will help avoid over-
writing previous reports.
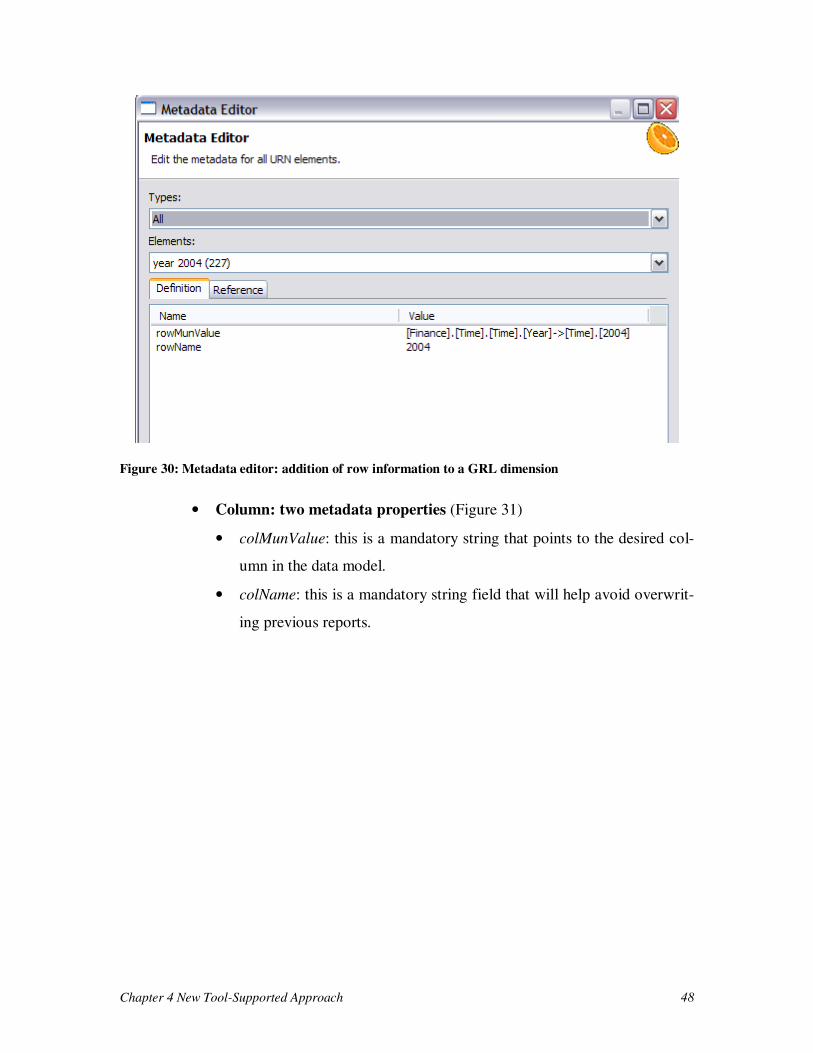
Chapter 4 New Tool-Supported Approach 48
Figure 30: Metadata editor: addition of row information to a GRL dimension
• Column: two metadata properties (Figure 31)
• colMunValue: this is a mandatory string that points to the desired col-
umn in the data model.
• colName: this is a mandatory string field that will help avoid overwrit-
ing previous reports.
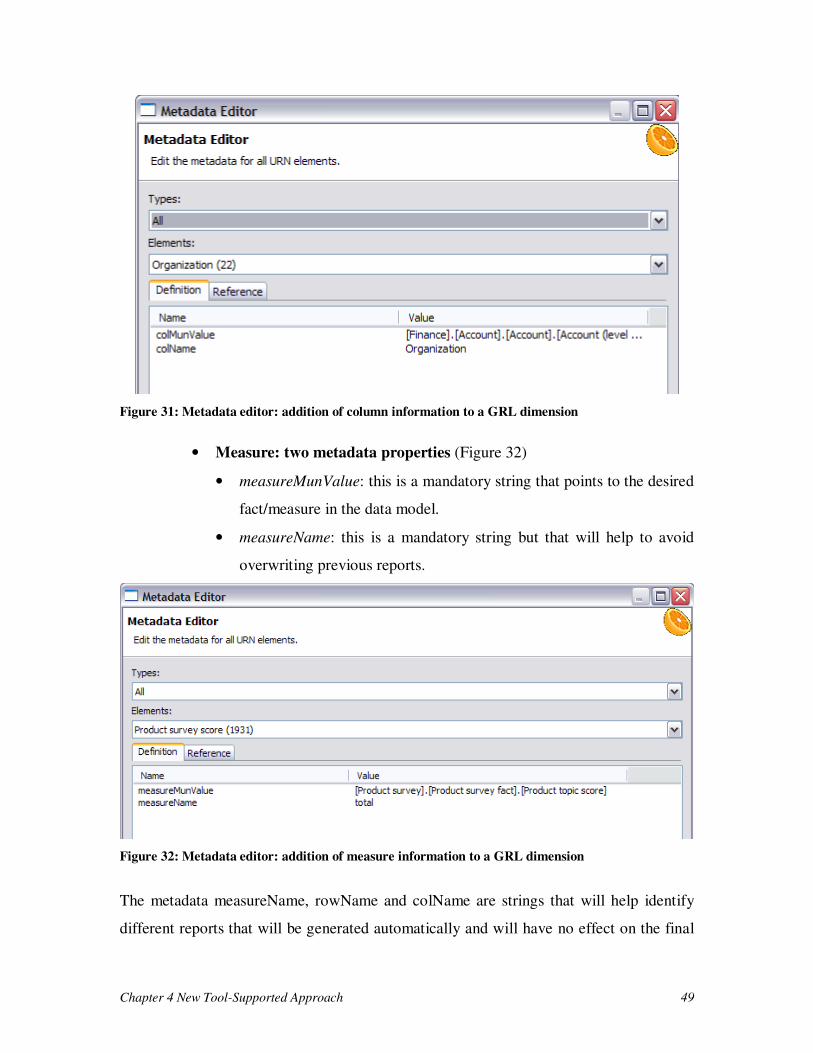
Chapter 4 New Tool-Supported Approach 49
Figure 31: Metadata editor: addition of column information to a GRL dimension
• Measure: two metadata properties (Figure 32)
• measureMunValue: this is a mandatory string that points to the desired
fact/measure in the data model.
• measureName: this is a mandatory string but that will help to avoid
overwriting previous reports.
Figure 32: Metadata editor: addition of measure information to a GRL dimension
The metadata measureName, rowName and colName are strings that will help identify
different reports that will be generated automatically and will have no effect on the final
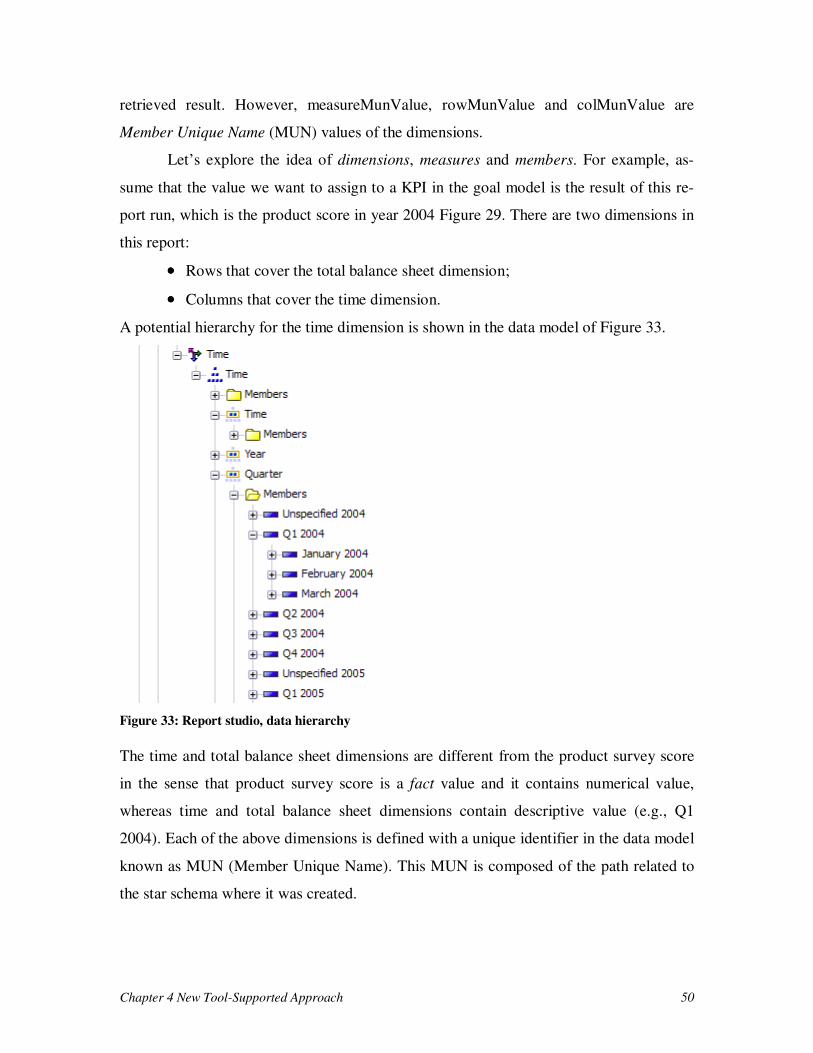
Chapter 4 New Tool-Supported Approach 50
retrieved result. However, measureMunValue, rowMunValue and colMunValue are
Member Unique Name (MUN) values of the dimensions.
Let’s explore the idea of dimensions, measures and members. For example, as-
sume that the value we want to assign to a KPI in the goal model is the result of this re-
port run, which is the product score in year 2004 Figure 29. There are two dimensions in
this report:
•••• Rows that cover the total balance sheet dimension;
•••• Columns that cover the time dimension.
A potential hierarchy for the time dimension is shown in the data model of Figure 33.
Figure 33: Report studio, data hierarchy
The time and total balance sheet dimensions are different from the product survey score
in the sense that product survey score is a fact value and it contains numerical value,
whereas time and total balance sheet dimensions contain descriptive value (e.g., Q1
2004). Each of the above dimensions is defined with a unique identifier in the data model
known as MUN (Member Unique Name). This MUN is composed of the path related to
the star schema where it was created.
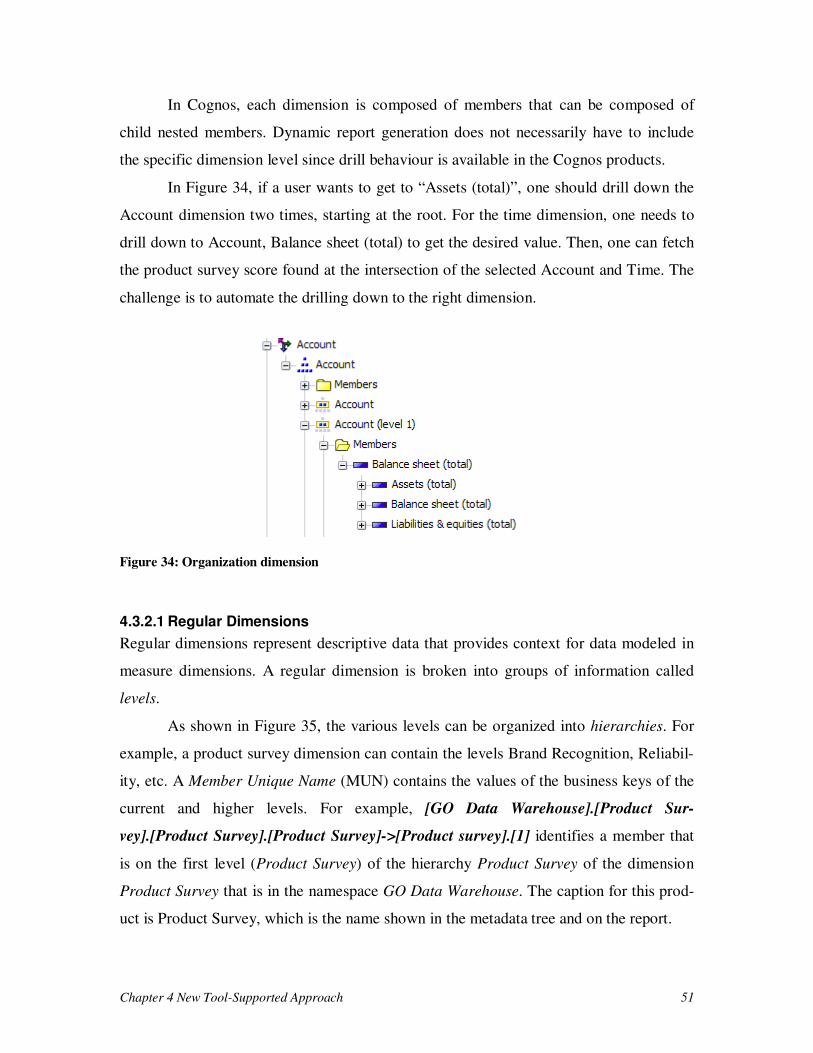
Chapter 4 New Tool-Supported Approach 51
In Cognos, each dimension is composed of members that can be composed of
child nested members. Dynamic report generation does not necessarily have to include
the specific dimension level since drill behaviour is available in the Cognos products.
In Figure 34, if a user wants to get to “Assets (total)”, one should drill down the
Account dimension two times, starting at the root. For the time dimension, one needs to
drill down to Account, Balance sheet (total) to get the desired value. Then, one can fetch
the product survey score found at the intersection of the selected Account and Time. The
challenge is to automate the drilling down to the right dimension.
Figure 34: Organization dimension
4.3.2.1 Regular Dimensions
Regular dimensions represent descriptive data that provides context for data modeled in
measure dimensions. A regular dimension is broken into groups of information called
levels.
As shown in Figure 35, the various levels can be organized into hierarchies. For
example, a product survey dimension can contain the levels Brand Recognition, Reliabil-
ity, etc. A Member Unique Name (MUN) contains the values of the business keys of the
current and higher levels. For example, [GO Data Warehouse].[Product Sur-
vey].[Product Survey].[Product Survey]->[Product survey].[1] identifies a member that
is on the first level (Product Survey) of the hierarchy Product Survey of the dimension
Product Survey that is in the namespace GO Data Warehouse. The caption for this prod-
uct is Product Survey, which is the name shown in the metadata tree and on the report.
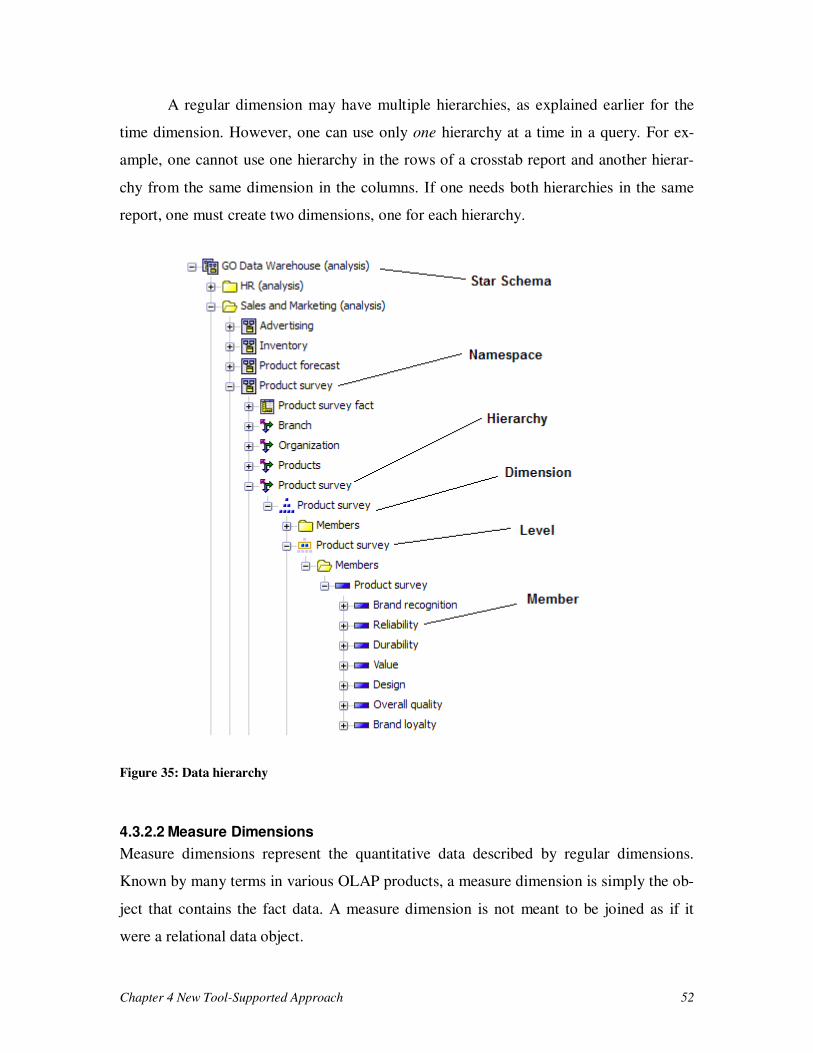
Chapter 4 New Tool-Supported Approach 52
A regular dimension may have multiple hierarchies, as explained earlier for the
time dimension. However, one can use only one hierarchy at a time in a query. For ex-
ample, one cannot use one hierarchy in the rows of a crosstab report and another hierar-
chy from the same dimension in the columns. If one needs both hierarchies in the same
report, one must create two dimensions, one for each hierarchy.
Figure 35: Data hierarchy
4.3.2.2 Measure Dimensions
Measure dimensions represent the quantitative data described by regular dimensions.
Known by many terms in various OLAP products, a measure dimension is simply the ob-
ject that contains the fact data. A measure dimension is not meant to be joined as if it
were a relational data object.
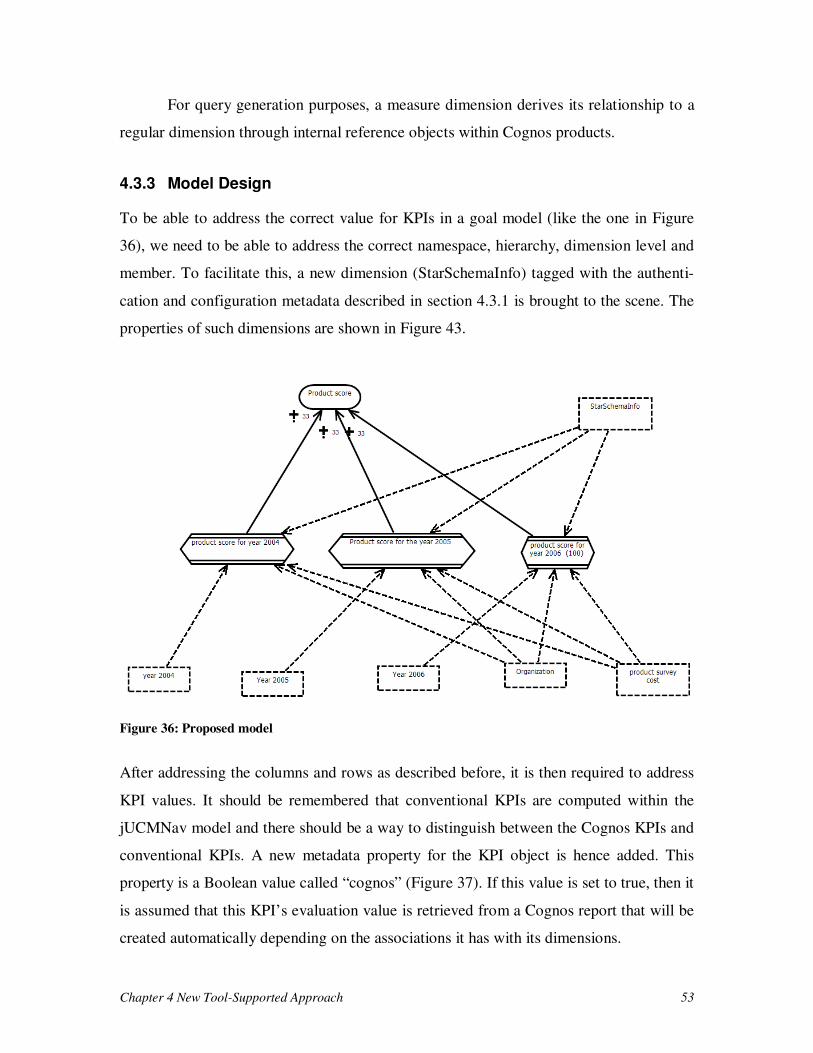
Chapter 4 New Tool-Supported Approach 53
For query generation purposes, a measure dimension derives its relationship to a
regular dimension through internal reference objects within Cognos products.
4.3.3 Model Design
To be able to address the correct value for KPIs in a goal model (like the one in Figure
36), we need to be able to address the correct namespace, hierarchy, dimension level and
member. To facilitate this, a new dimension (StarSchemaInfo) tagged with the authenti-
cation and configuration metadata described in section 4.3.1 is brought to the scene. The
properties of such dimensions are shown in Figure 43.
Figure 36: Proposed model
After addressing the columns and rows as described before, it is then required to address
KPI values. It should be remembered that conventional KPIs are computed within the
jUCMNav model and there should be a way to distinguish between the Cognos KPIs and
conventional KPIs. A new metadata property for the KPI object is hence added. This
property is a Boolean value called “cognos” (Figure 37). If this value is set to true, then it
is assumed that this KPI’s evaluation value is retrieved from a Cognos report that will be
created automatically depending on the associations it has with its dimensions.
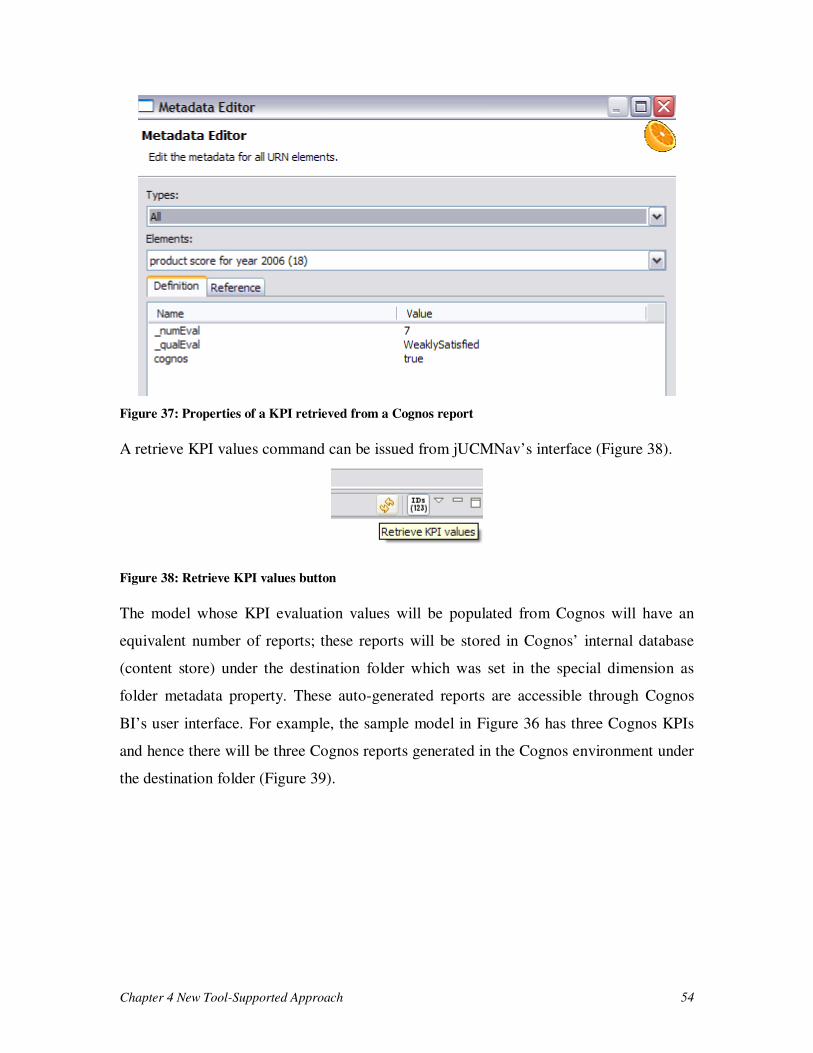
Chapter 4 New Tool-Supported Approach 54
Figure 37: Properties of a KPI retrieved from a Cognos report
A retrieve KPI values command can be issued from jUCMNav’s interface (Figure 38).
Figure 38: Retrieve KPI values button
The model whose KPI evaluation values will be populated from Cognos will have an
equivalent number of reports; these reports will be stored in Cognos’ internal database
(content store) under the destination folder which was set in the special dimension as
folder metadata property. These auto-generated reports are accessible through Cognos
BI’s user interface. For example, the sample model in Figure 36 has three Cognos KPIs
and hence there will be three Cognos reports generated in the Cognos environment under
the destination folder (Figure 39).
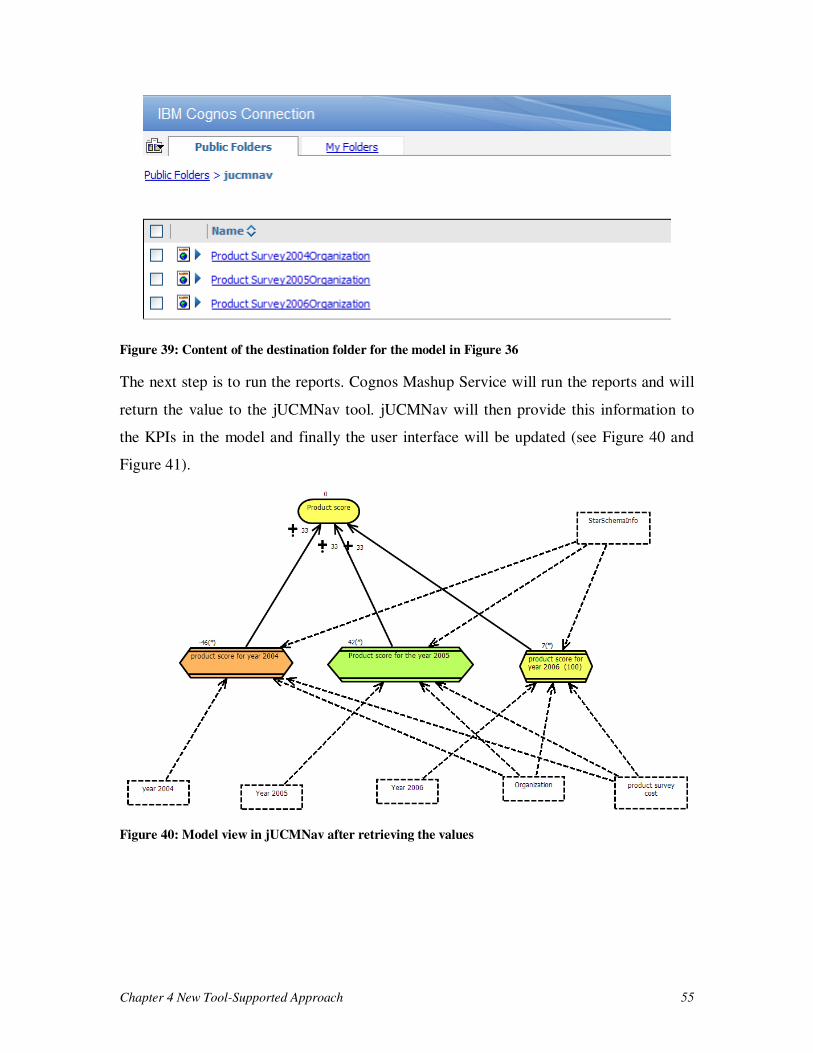
Chapter 4 New Tool-Supported Approach 55
Figure 39: Content of the destination folder for the model in Figure 36
The next step is to run the reports. Cognos Mashup Service will run the reports and will
return the value to the jUCMNav tool. jUCMNav will then provide this information to
the KPIs in the model and finally the user interface will be updated (see Figure 40 and
Figure 41).
Figure 40: Model view in jUCMNav after retrieving the values
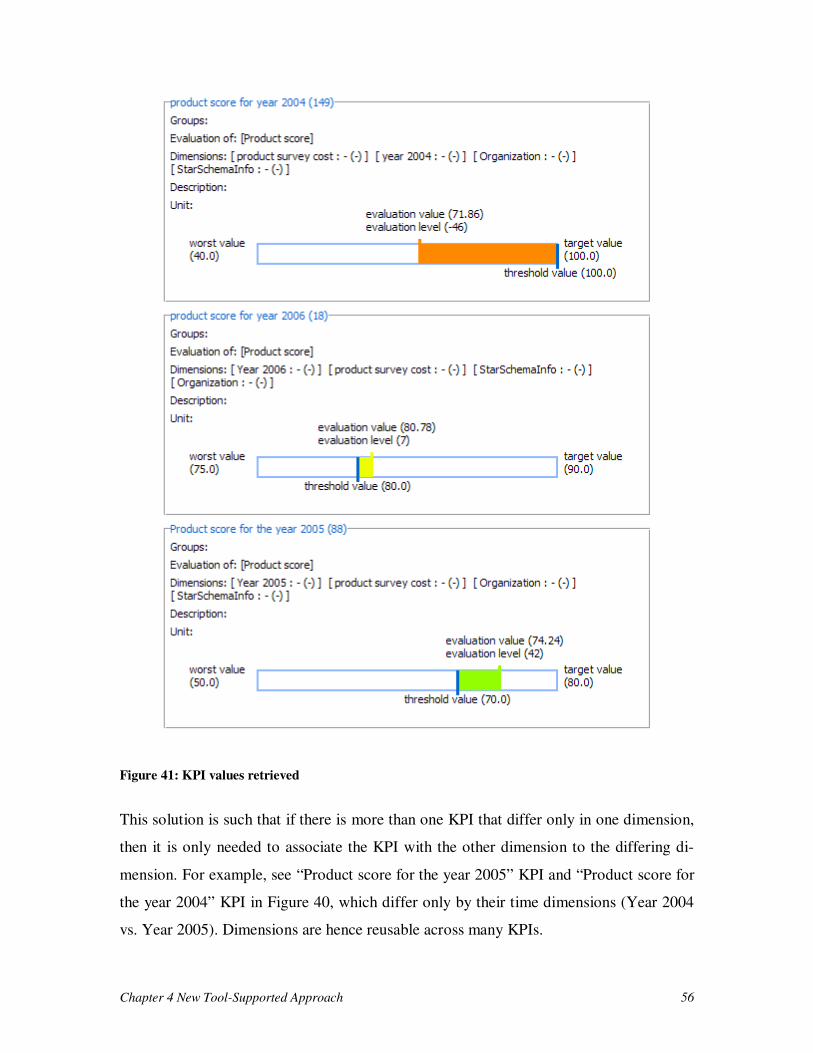
Chapter 4 New Tool-Supported Approach 56
Figure 41: KPI values retrieved
This solution is such that if there is more than one KPI that differ only in one dimension,
then it is only needed to associate the KPI with the other dimension to the differing di-
mension. For example, see “Product score for the year 2005” KPI and “Product score for
the year 2004” KPI in Figure 40, which differ only by their time dimensions (Year 2004
vs. Year 2005). Dimensions are hence reusable across many KPIs.
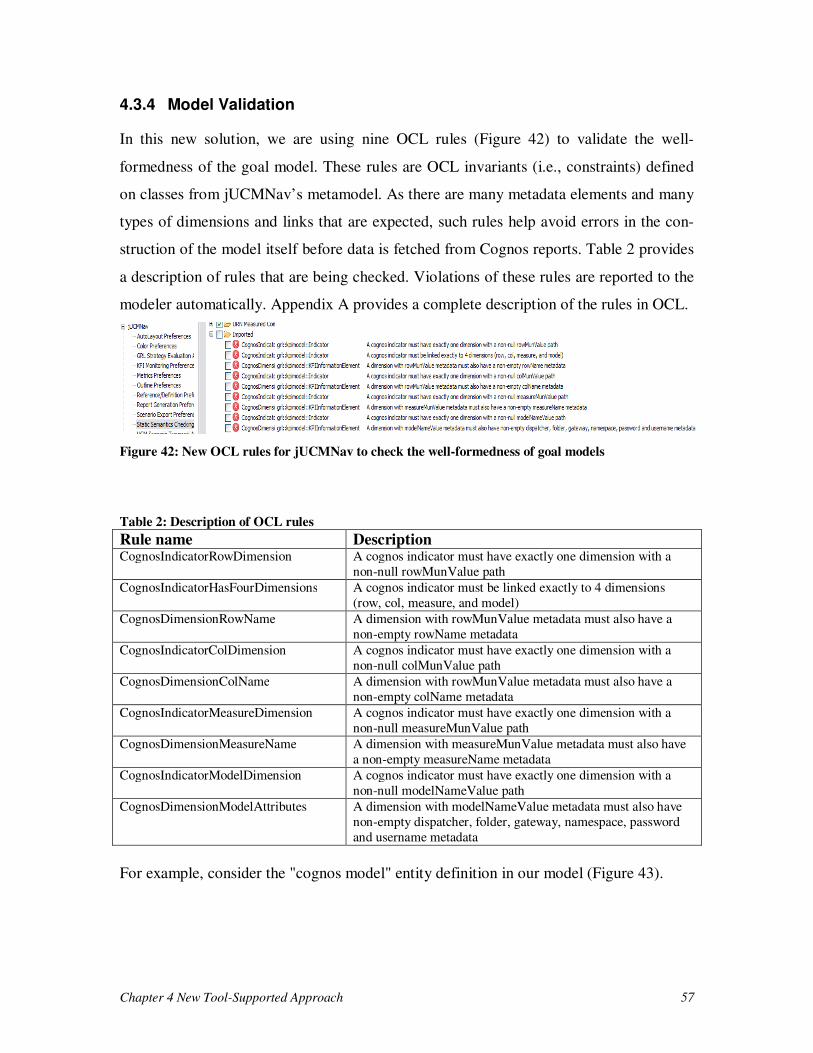
Chapter 4 New Tool-Supported Approach 57
4.3.4 Model Validation
In this new solution, we are using nine OCL rules (Figure 42) to validate the well-
formedness of the goal model. These rules are OCL invariants (i.e., constraints) defined
on classes from jUCMNav’s metamodel. As there are many metadata elements and many
types of dimensions and links that are expected, such rules help avoid errors in the con-
struction of the model itself before data is fetched from Cognos reports. Table 2 provides
a description of rules that are being checked. Violations of these rules are reported to the
modeler automatically. Appendix A provides a complete description of the rules in OCL.
Figure 42: New OCL rules for jUCMNav to check the well-formedness of goal models
Table 2: Description of OCL rules
Rule name Description CognosIndicatorRowDimension A cognos indicator must have exactly one dimension with a
non-null rowMunValue path
CognosIndicatorHasFourDimensions A cognos indicator must be linked exactly to 4 dimensions
(row, col, measure, and model)
CognosDimensionRowName A dimension with rowMunValue metadata must also have a
non-empty rowName metadata
CognosIndicatorColDimension A cognos indicator must have exactly one dimension with a
non-null colMunValue path
CognosDimensionColName A dimension with rowMunValue metadata must also have a
non-empty colName metadata
CognosIndicatorMeasureDimension A cognos indicator must have exactly one dimension with a
non-null measureMunValue path
CognosDimensionMeasureName A dimension with measureMunValue metadata must also have
a non-empty measureName metadata
CognosIndicatorModelDimension A cognos indicator must have exactly one dimension with a
non-null modelNameValue path
CognosDimensionModelAttributes A dimension with modelNameValue metadata must also have
non-empty dispatcher, folder, gateway, namespace, password
and username metadata
For example, consider the "cognos model" entity definition in our model (Figure 43).
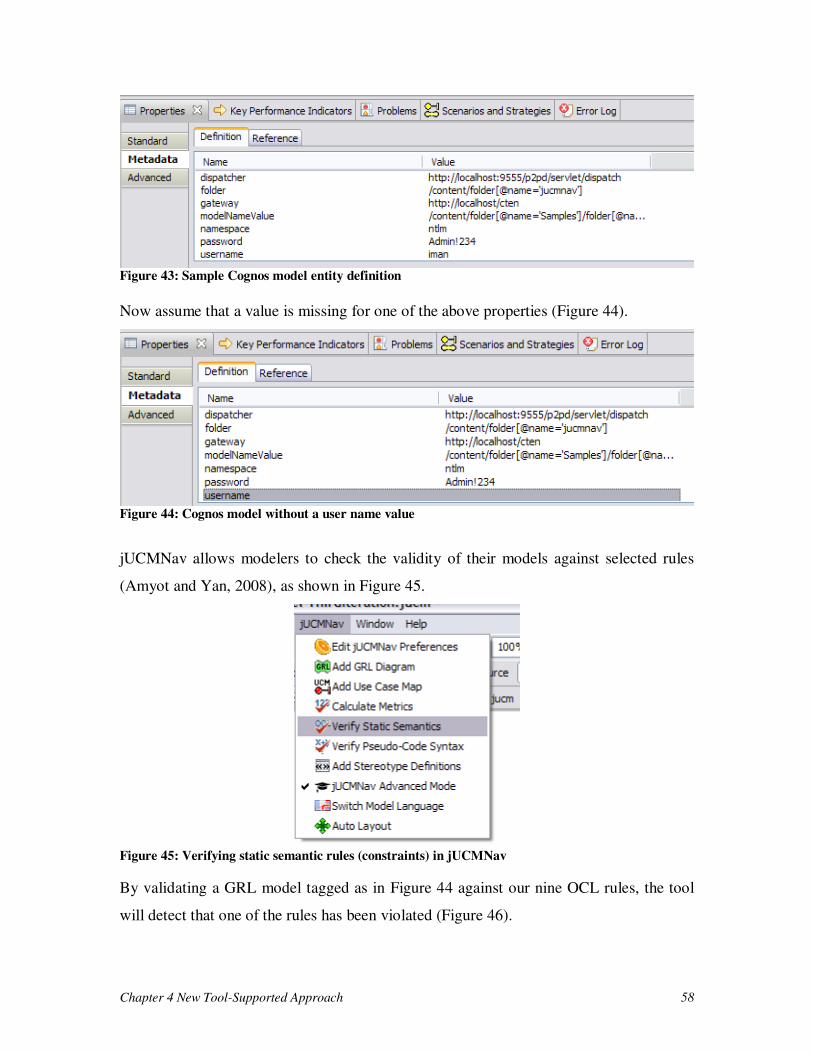
Chapter 4 New Tool-Supported Approach 58
Figure 43: Sample Cognos model entity definition
Now assume that a value is missing for one of the above properties (Figure 44).
Figure 44: Cognos model without a user name value
jUCMNav allows modelers to check the validity of their models against selected rules
(Amyot and Yan, 2008), as shown in Figure 45.
Figure 45: Verifying static semantic rules (constraints) in jUCMNav
By validating a GRL model tagged as in Figure 44 against our nine OCL rules, the tool
will detect that one of the rules has been violated (Figure 46).
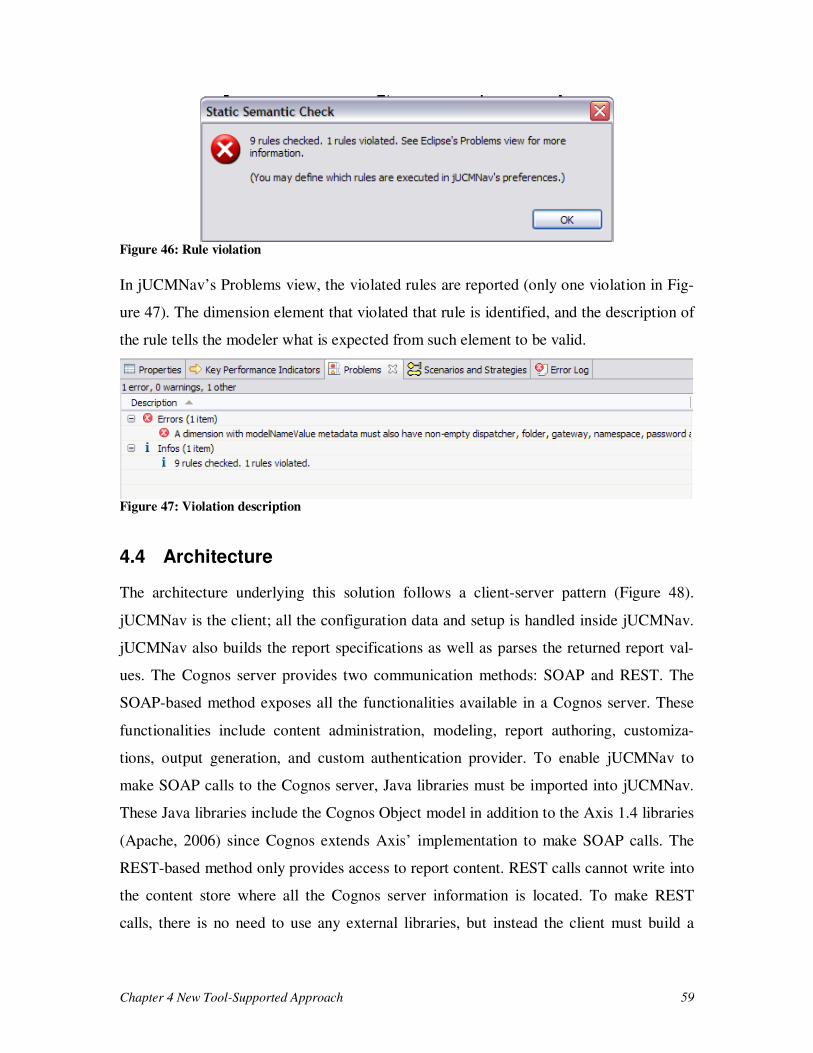
Chapter 4 New Tool-Supported Approach 59
Figure 46: Rule violation
In jUCMNav’s Problems view, the violated rules are reported (only one violation in Fig-
ure 47). The dimension element that violated that rule is identified, and the description of
the rule tells the modeler what is expected from such element to be valid.
Figure 47: Violation description
4.4 Architecture
The architecture underlying this solution follows a client-server pattern (Figure 48).
jUCMNav is the client; all the configuration data and setup is handled inside jUCMNav.
jUCMNav also builds the report specifications as well as parses the returned report val-
ues. The Cognos server provides two communication methods: SOAP and REST. The
SOAP-based method exposes all the functionalities available in a Cognos server. These
functionalities include content administration, modeling, report authoring, customiza-
tions, output generation, and custom authentication provider. To enable jUCMNav to
make SOAP calls to the Cognos server, Java libraries must be imported into jUCMNav.
These Java libraries include the Cognos Object model in addition to the Axis 1.4 libraries
(Apache, 2006) since Cognos extends Axis’ implementation to make SOAP calls. The
REST-based method only provides access to report content. REST calls cannot write into
the content store where all the Cognos server information is located. To make REST
calls, there is no need to use any external libraries, but instead the client must build a
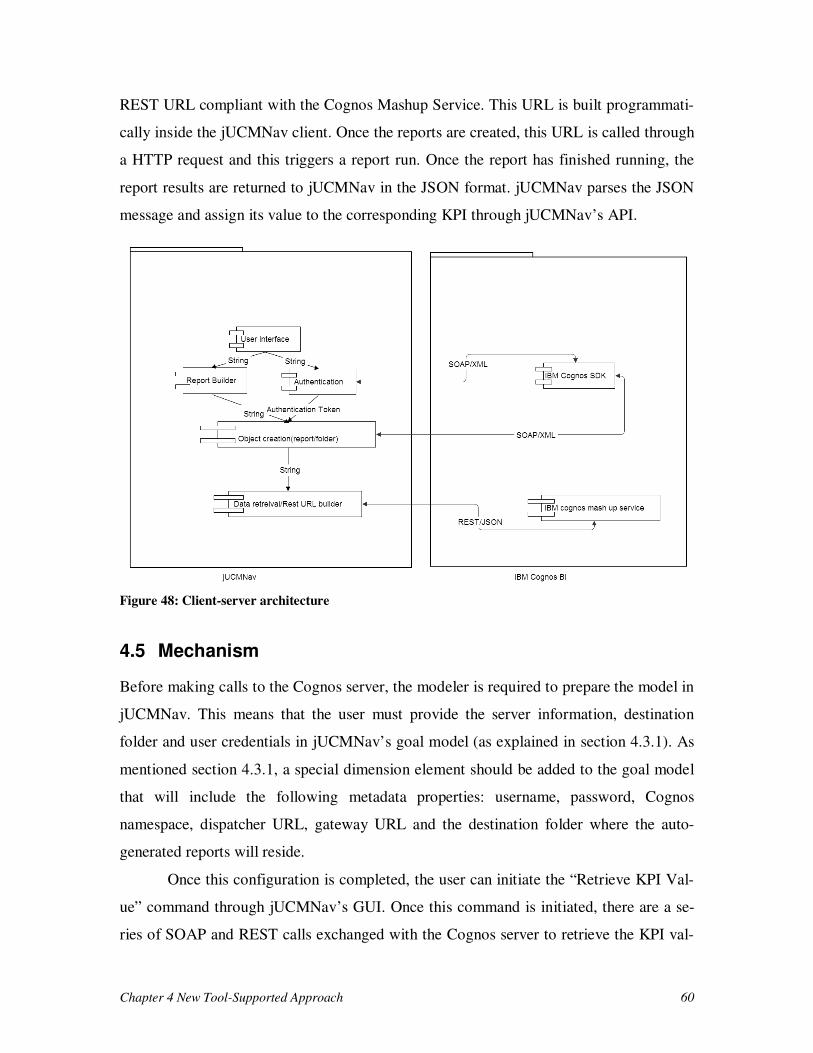
Chapter 4 New Tool-Supported Approach 60
REST URL compliant with the Cognos Mashup Service. This URL is built programmati-
cally inside the jUCMNav client. Once the reports are created, this URL is called through
a HTTP request and this triggers a report run. Once the report has finished running, the
report results are returned to jUCMNav in the JSON format. jUCMNav parses the JSON
message and assign its value to the corresponding KPI through jUCMNav’s API.
Figure 48: Client-server architecture
4.5 Mechanism
Before making calls to the Cognos server, the modeler is required to prepare the model in
jUCMNav. This means that the user must provide the server information, destination
folder and user credentials in jUCMNav’s goal model (as explained in section 4.3.1). As
mentioned section 4.3.1, a special dimension element should be added to the goal model
that will include the following metadata properties: username, password, Cognos
namespace, dispatcher URL, gateway URL and the destination folder where the auto-
generated reports will reside.
Once this configuration is completed, the user can initiate the “Retrieve KPI Val-
ue” command through jUCMNav’s GUI. Once this command is initiated, there are a se-
ries of SOAP and REST calls exchanged with the Cognos server to retrieve the KPI val-
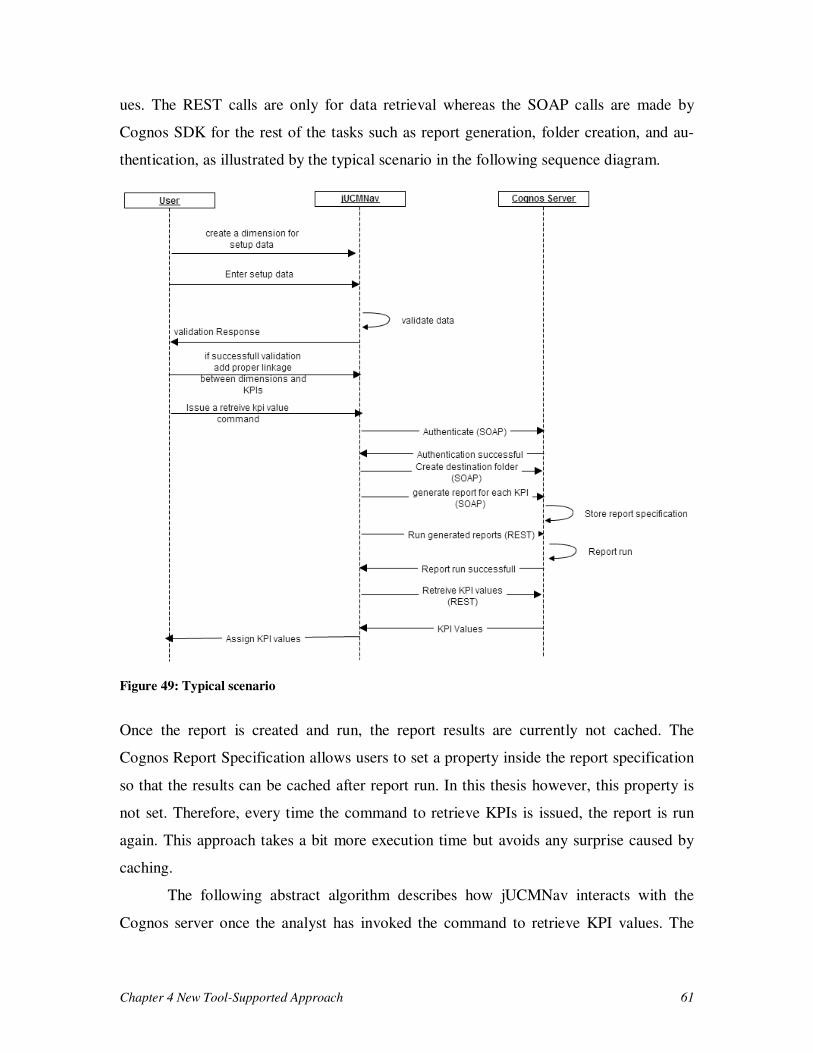
Chapter 4 New Tool-Supported Approach 61
ues. The REST calls are only for data retrieval whereas the SOAP calls are made by
Cognos SDK for the rest of the tasks such as report generation, folder creation, and au-
thentication, as illustrated by the typical scenario in the following sequence diagram.
Figure 49: Typical scenario
Once the report is created and run, the report results are currently not cached. The
Cognos Report Specification allows users to set a property inside the report specification
so that the results can be cached after report run. In this thesis however, this property is
not set. Therefore, every time the command to retrieve KPIs is issued, the report is run
again. This approach takes a bit more execution time but avoids any surprise caused by
caching.
The following abstract algorithm describes how jUCMNav interacts with the
Cognos server once the analyst has invoked the command to retrieve KPI values. The
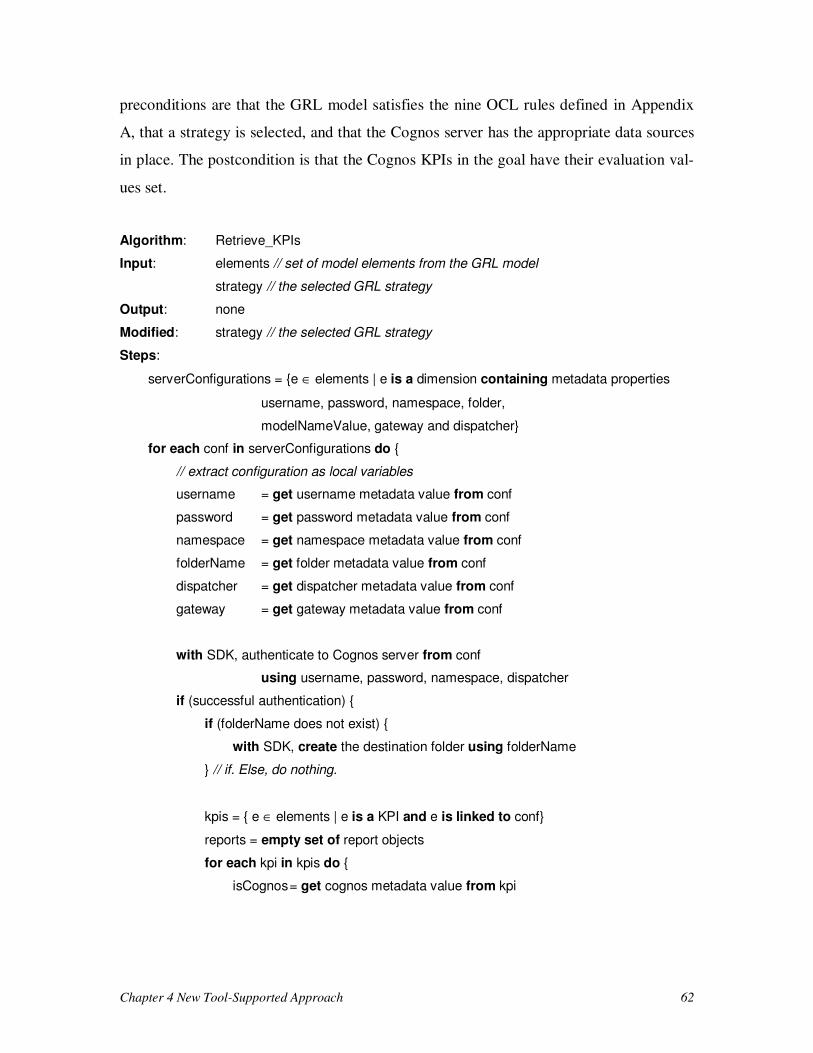
Chapter 4 New Tool-Supported Approach 62
preconditions are that the GRL model satisfies the nine OCL rules defined in Appendix
A, that a strategy is selected, and that the Cognos server has the appropriate data sources
in place. The postcondition is that the Cognos KPIs in the goal have their evaluation val-
ues set.
Algorithm: Retrieve_KPIs
Input: elements // set of model elements from the GRL model
strategy // the selected GRL strategy
Output: none
Modified: strategy // the selected GRL strategy
Steps:
serverConfigurations = {e ∈ elements | e is a dimension containing metadata properties
username, password, namespace, folder,
modelNameValue, gateway and dispatcher}
for each conf in serverConfigurations do {
// extract configuration as local variables
username = get username metadata value from conf
password = get password metadata value from conf
namespace = get namespace metadata value from conf
folderName = get folder metadata value from conf
dispatcher = get dispatcher metadata value from conf
gateway = get gateway metadata value from conf
with SDK, authenticate to Cognos server from conf
using username, password, namespace, dispatcher
if (successful authentication) {
if (folderName does not exist) {
with SDK, create the destination folder using folderName
} // if. Else, do nothing.
kpis = { e ∈ elements | e is a KPI and e is linked to conf}
reports = empty set of report objects
for each kpi in kpis do {
isCognos = get cognos metadata value from kpi
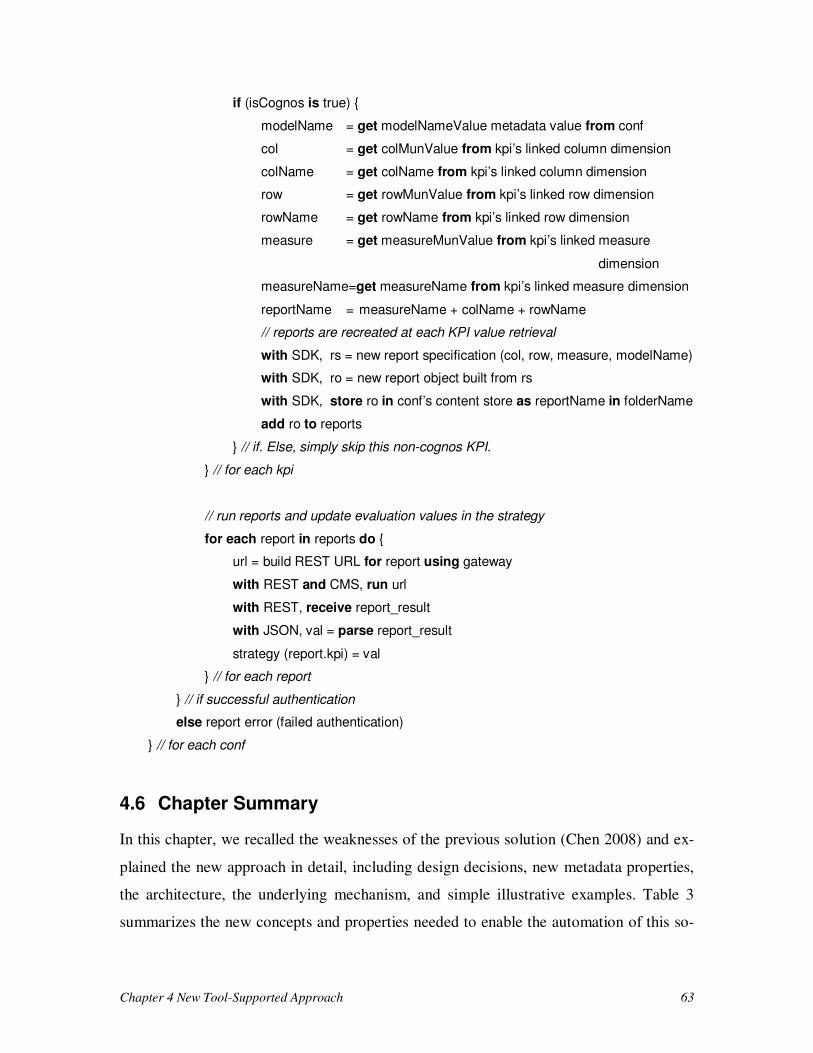
Chapter 4 New Tool-Supported Approach 63
if (isCognos is true) {
modelName = get modelNameValue metadata value from conf
col = get colMunValue from kpi’s linked column dimension
colName = get colName from kpi’s linked column dimension
row = get rowMunValue from kpi’s linked row dimension
rowName = get rowName from kpi’s linked row dimension
measure = get measureMunValue from kpi’s linked measure
dimension
measureName=get measureName from kpi’s linked measure dimension
reportName = measureName + colName + rowName
// reports are recreated at each KPI value retrieval
with SDK, rs = new report specification (col, row, measure, modelName)
with SDK, ro = new report object built from rs
with SDK, store ro in conf’s content store as reportName in folderName
add ro to reports
} // if. Else, simply skip this non-cognos KPI.
} // for each kpi
// run reports and update evaluation values in the strategy
for each report in reports do {
url = build REST URL for report using gateway
with REST and CMS, run url
with REST, receive report_result
with JSON, val = parse report_result
strategy (report.kpi) = val
} // for each report
} // if successful authentication
else report error (failed authentication)
} // for each conf
4.6 Chapter Summary
In this chapter, we recalled the weaknesses of the previous solution (Chen 2008) and ex-
plained the new approach in detail, including design decisions, new metadata properties,
the architecture, the underlying mechanism, and simple illustrative examples. Table 3
summarizes the new concepts and properties needed to enable the automation of this so-
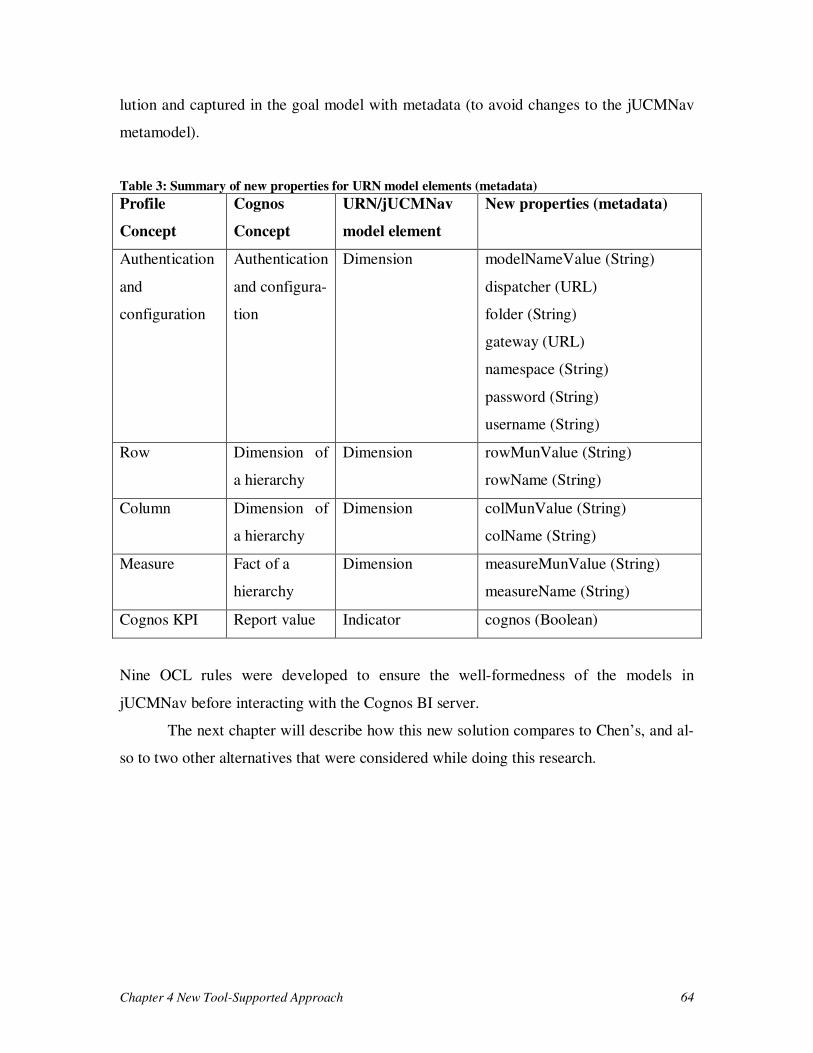
Chapter 4 New Tool-Supported Approach 64
lution and captured in the goal model with metadata (to avoid changes to the jUCMNav
metamodel).
Table 3: Summary of new properties for URN model elements (metadata)
Profile
Concept
Cognos
Concept
URN/jUCMNav
model element
New properties (metadata)
Authentication
and
configuration
Authentication
and configura-
tion
Dimension modelNameValue (String)
dispatcher (URL)
folder (String)
gateway (URL)
namespace (String)
password (String)
username (String)
Row Dimension of
a hierarchy
Dimension rowMunValue (String)
rowName (String)
Column Dimension of
a hierarchy
Dimension colMunValue (String)
colName (String)
Measure Fact of a
hierarchy
Dimension measureMunValue (String)
measureName (String)
Cognos KPI Report value Indicator cognos (Boolean)
Nine OCL rules were developed to ensure the well-formedness of the models in
jUCMNav before interacting with the Cognos BI server.
The next chapter will describe how this new solution compares to Chen’s, and al-
so to two other alternatives that were considered while doing this research.
Chapter 5 Assessment 65
Chapter 5 Assessment
This chapter provides an assessment of the new solution presented in Chapter 4 against
two alternative approaches considered while doing this research and against the baseline
solution proposed by Chen (2008).
5.1 Two Alternative Approaches
Following a spiral software engineering process in the design and development phase of
our design science methodology, we had three major iterations. In each iteration, a lim-
ited prototype was completed and enhanced before the final product was developed. The
artefact produced at the end of each iteration was considered an alternative since the re-
quirements changed at the end of each iteration. Hence, along these three iterations, we
considered two alternative approaches before the final solution presented in the previous
chapter:
•••• The manual approach
•••• Single automatic approach
Each approach is constructed of the following major steps to achieve the main goal com-
mon to all solutions:
1. Authentication: Before getting any data from the Business Intelligence server,
the user should be authenticated with the proper credentials. Credentials are
either provided on the fly or require hardcoded values in a property file stored
where the software is deployed.
2. Report creation: This can be a major bottleneck. Creation requires the user to
have deep knowledge of the product to be able to create reports based on
business requirements. The complexity of this task increases as data become
multidimensional.
Chapter 5 Assessment 66
3. Retrieving the KPI value: There are different ways to get KPI values. The user
either can rely on the result of another third-party tool, accessible as a comma-
separated value (.csv) file or as an Excel (.xls) file, or can directly tap into the
BI tool and grab the desired values. The second method can be complex since
it requires knowledge of different technologies in order to get these values
programmatically.
4. Assignment of the KPI value: This is the least time-consuming step since it
only requires familiarity with the jUCMNav API and is common to all the
proposed techniques. This is also transparent to the end-user (modeler or ana-
lyst).
5.1.1 The Manual Approach
In the manual approach, a user interface is created so that the user can map the corre-
sponding dimensions with the KPI defined in jUCMNav. The input to the system is a
Cognos server URL and the path to the report that has been created for this KPI. In terms
of nested dimensions, the user can drill up and down the dimension and choose items in
any level. Upon choosing the dimensions, the measure value will be retrieved through
IBM Cognos Mashup Services and will be set to the evaluation value of the KPI. The
breakdown of the tasks is as follows:
1. Authentication: The user is provided with a dialogue to enter the credentials.
If the user logged in successfully into the Cognos server, the user can go the
next step.
2. Report creation: A generic report is created manually by the user and contains
all the dimensions of data related to the business requirements. The user can
modify the path to these pre-made generic reports and can connect to and run
these reports.
3. Retrieving the KPI values: after the report is run, a crosstab view of the data is
created and the user can drill up and down the results to look for the desired
intersection of the data. For example, the product survey score of an organiza-
tion in year 2004.
Chapter 5 Assessment 67
4. Assignment of the KPI values: through the interface provided to the user, the
user can select the KPI and simply choose to assign the selected value in step
3 to the desired KPI.
5.1.2 The Single Automatic Approach
In the automatic approach, the need for a GUI to select and set the KPI value is removed,
The corresponding report is created automatically on the fly based on the KPI value
through the Cognos SDK, stored on the Cognos server through via the SDK, run through
the Cognos Mashup Service, and the evaluation value is set through the Cognos SDK.
The breakdown of the tasks is as follows:
1. Authentication: The user neither has to hardcode the credentials in a property
file nor has to enter them in a separate login. The user credentials are entered
inside the jUCMNav tool as metadata attached to the goal model and is stored
with the model.
2. Report creation: A report is created on the fly but this is not very efficient
since a lot of information bookkeeping data needs to be entered into
jUCMNav to create the report.
3. Retrieving the KPI values: An automatic approach is introduced to retrieve the
KPI value; the created report in step 2 is run and the results are returned effi-
ciently.
4. Assignment of the KPI Values: Since there is metadata defined for each KPI,
as soon as the KPI retrieval command is sent all the KPIs are updated auto-
matically.
5.2 Comparison
In this section, Chen’s approach (discussed in chapter 3) and the above two alternative
approaches are compared to our new approach. The comparison criteria used here are
some of the main factors (identified in chapters 2 to 4) influencing the satisfaction of the
overall objective of this thesis. Essentially, the objective is to have reports creat-
ed/authored automatically, no web service to deploy, high performance, low mainte-
nance, support for on-the-fly modification of KPIs, and support for multiple source BI
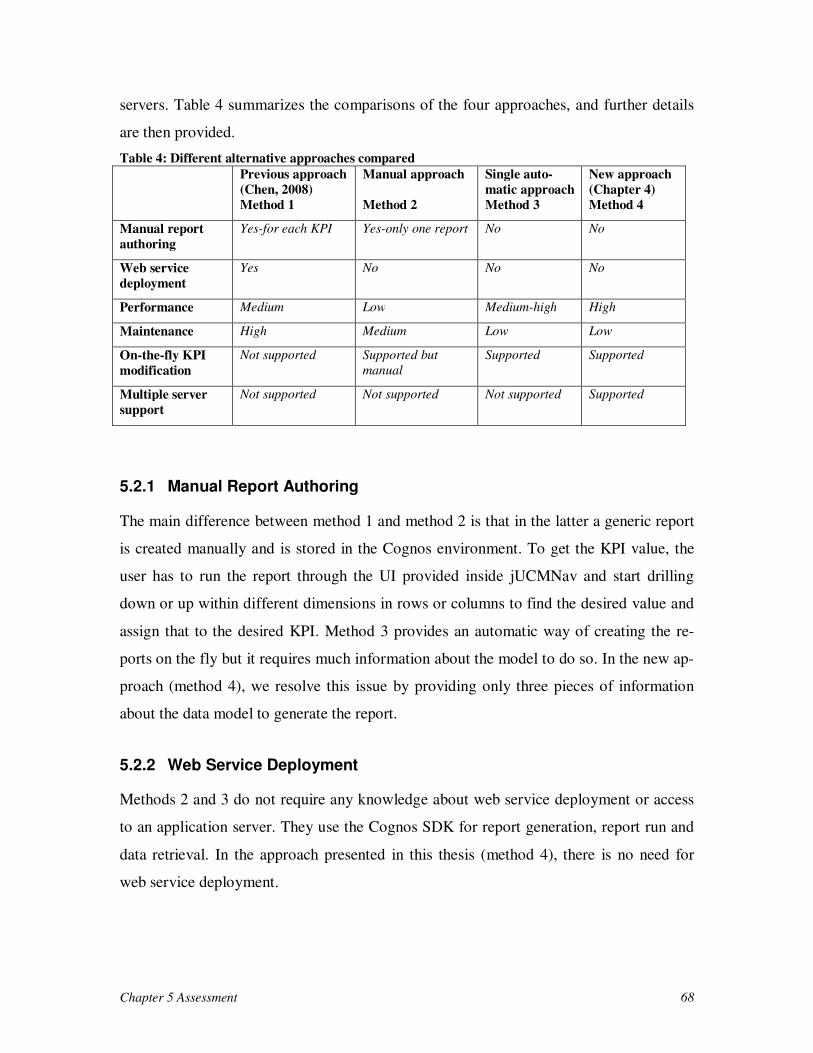
Chapter 5 Assessment 68
servers. Table 4 summarizes the comparisons of the four approaches, and further details
are then provided.
Table 4: Different alternative approaches compared
Previous approach
(Chen, 2008)
Method 1
Manual approach
Method 2
Single auto-
matic approach
Method 3
New approach
(Chapter 4)
Method 4
Manual report
authoring
Yes-for each KPI Yes-only one report No No
Web service
deployment
Yes No No No
Performance Medium Low Medium-high High
Maintenance High Medium Low Low
On-the-fly KPI
modification
Not supported Supported but
manual
Supported Supported
Multiple server
support
Not supported Not supported Not supported Supported
5.2.1 Manual Report Authoring
The main difference between method 1 and method 2 is that in the latter a generic report
is created manually and is stored in the Cognos environment. To get the KPI value, the
user has to run the report through the UI provided inside jUCMNav and start drilling
down or up within different dimensions in rows or columns to find the desired value and
assign that to the desired KPI. Method 3 provides an automatic way of creating the re-
ports on the fly but it requires much information about the model to do so. In the new ap-
proach (method 4), we resolve this issue by providing only three pieces of information
about the data model to generate the report.
5.2.2 Web Service Deployment
Methods 2 and 3 do not require any knowledge about web service deployment or access
to an application server. They use the Cognos SDK for report generation, report run and
data retrieval. In the approach presented in this thesis (method 4), there is no need for
web service deployment.
Chapter 5 Assessment 69
5.2.3 Performance
Method 1 and method 3 have higher performance than method 2 since the data retrieval is
automated. They only differ in report authoring. Method 2 has low performance because
for each KPI, the user has to manually go and select the KPI and assign the value. This
becomes a bottleneck for a high number of KPIs. In method 4, report generation is auto-
mated (unlike method 1, which requires manual report generation) and has a higher per-
formance compared to method 3 due to less computations and logic needed to generate
the report.
5.2.4 Maintenance
If there are multiple strategies and if within each strategy there is only a slight change
within the KPIs, then for method 1 some of the reports need to be created again manually,
even though they are going to be similar to the one in the previous strategy. Method 3
generates a new report automatically. Method 2 is manual, therefore it sticks with only
one report even though there are different strategies. In method 4, reports are automati-
cally generated but a better approach is taken to manage storage of these reports within
the Cognos environment.
5.2.5 On-The-Fly KPI Modifications
Assume the business user wants to examine the result by changing a dimension value, for
example revenue growth this month and next month. If method 1 is used, then for each
new strategy needs to be defined, a new folder needs to be created in the Cognos envi-
ronment, and two different reports need to be created to be able to generate the results.
However, with method 3, within the same strategy, just by modifying the month to the
previous month in the model, the value can be retrieved and no extra action is required.
Method 2 is manual therefore it can be useful for a small number of KPIs but as the num-
ber of KPIs grow, this can become a bottleneck. In method 4, the same implementation as
method 3 is done and they are similar in terms of KPI modifiability.
Chapter 5 Assessment 70
5.2.6 Multiple Server Support
If there is a need to combine a few KPIs from different data sources from different
Cognos servers in one goal model, one cannot benefit from method 1 or method 2 or
method 3. The existence of such capability increases the usability, scalability, and func-
tionality of the thesis solution (method 4) and makes it possible to combine and create
different reports from different parts of the enterprise whose data is not shared based on
different user access and capabilities.
5.3 Chapter Summary
In this chapter, we explored two other alternatives to our final solution and compared
how each of them behaved with respect to important assessment criteria. This comparison
highlights that the solution demonstrated in chapter 4 represents a major improvement
over the previous solution (Chen, 2008) and alternative approaches. The evaluation fac-
tors that were considered are report authoring, web services deployment, performance,
maintenance, on-the-fly KPI modification, and support for multiple servers. We can ob-
serve that our new solution supports dynamic report authoring, eliminates the dependency
on web service deployment, increases performance and maintenance by automating sev-
eral manual tasks, allows KPI modification on the fly, and finally supports multiple serv-
ers.
The next chapter will present a case study aimed at illustrating and validating the
overall approach and its tool support.
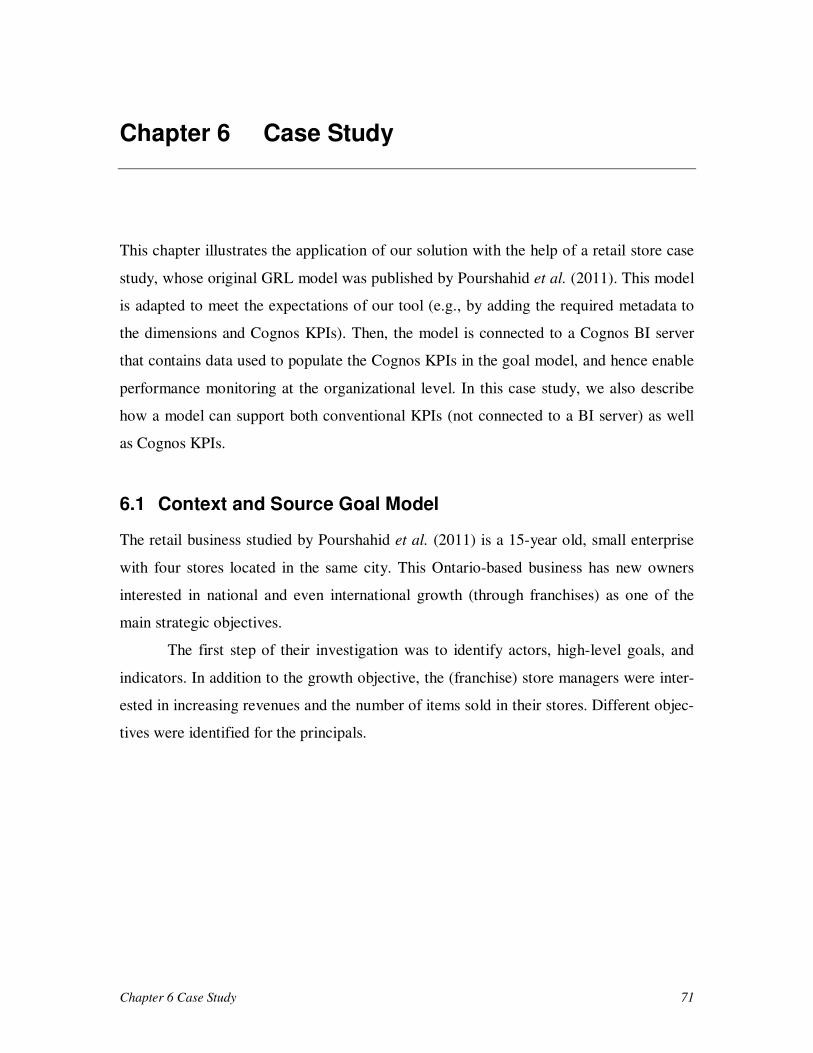
Chapter 6 Case Study 71
Chapter 6 Case Study
This chapter illustrates the application of our solution with the help of a retail store case
study, whose original GRL model was published by Pourshahid et al. (2011). This model
is adapted to meet the expectations of our tool (e.g., by adding the required metadata to
the dimensions and Cognos KPIs). Then, the model is connected to a Cognos BI server
that contains data used to populate the Cognos KPIs in the goal model, and hence enable
performance monitoring at the organizational level. In this case study, we also describe
how a model can support both conventional KPIs (not connected to a BI server) as well
as Cognos KPIs.
6.1 Context and Source Goal Model
The retail business studied by Pourshahid et al. (2011) is a 15-year old, small enterprise
with four stores located in the same city. This Ontario-based business has new owners
interested in national and even international growth (through franchises) as one of the
main strategic objectives.
The first step of their investigation was to identify actors, high-level goals, and
indicators. In addition to the growth objective, the (franchise) store managers were inter-
ested in increasing revenues and the number of items sold in their stores. Different objec-
tives were identified for the principals.
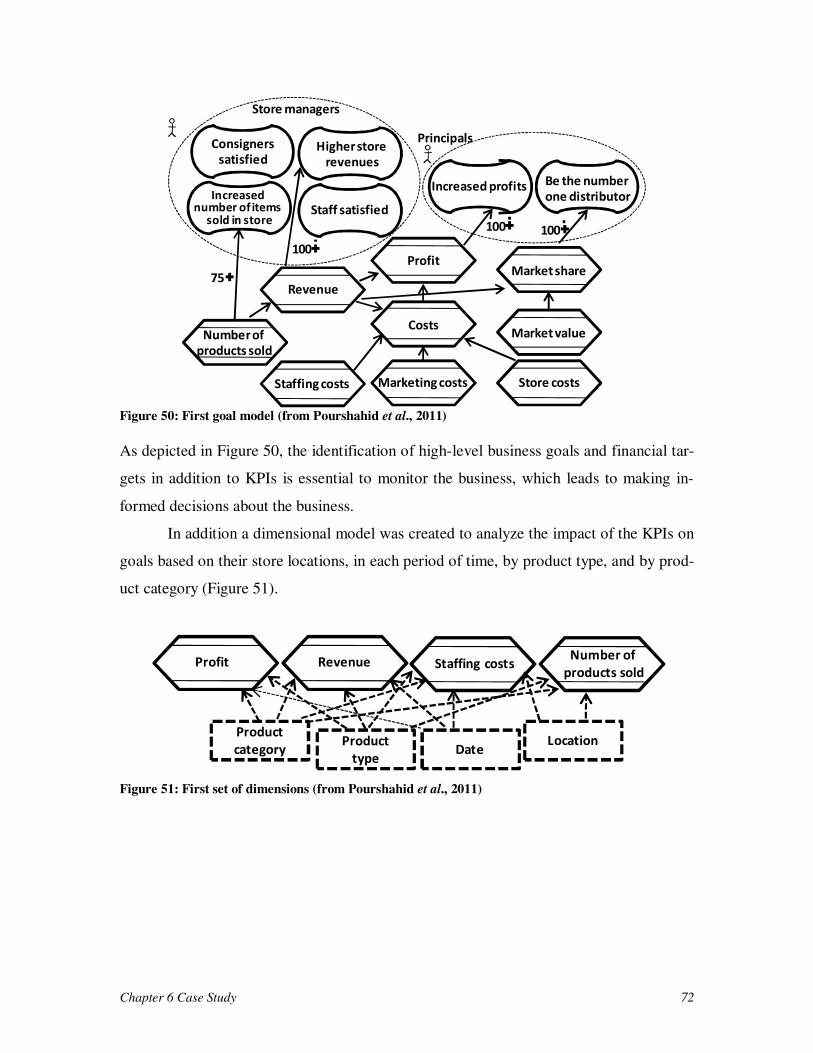
Chapter 6 Case Study 72
Increased profits
PrincipalsConsigners
satisfied
Store managers
Revenue
100
ProfitMarket share
Market valueNumber of
products sold
Costs
Staffing costs Marketing costs Store costs
Be the number
one distributor
Higher store
revenues
Staff satisfied
Increased number of items
sold in store100
75
100
Figure 50: First goal model (from Pourshahid et al., 2011)
As depicted in Figure 50, the identification of high-level business goals and financial tar-
gets in addition to KPIs is essential to monitor the business, which leads to making in-
formed decisions about the business.
In addition a dimensional model was created to analyze the impact of the KPIs on
goals based on their store locations, in each period of time, by product type, and by prod-
uct category (Figure 51).
Product
categoryProduct
type
Profit Revenue Staffing costsNumber of
products sold
DateLocation
Figure 51: First set of dimensions (from Pourshahid et al., 2011)
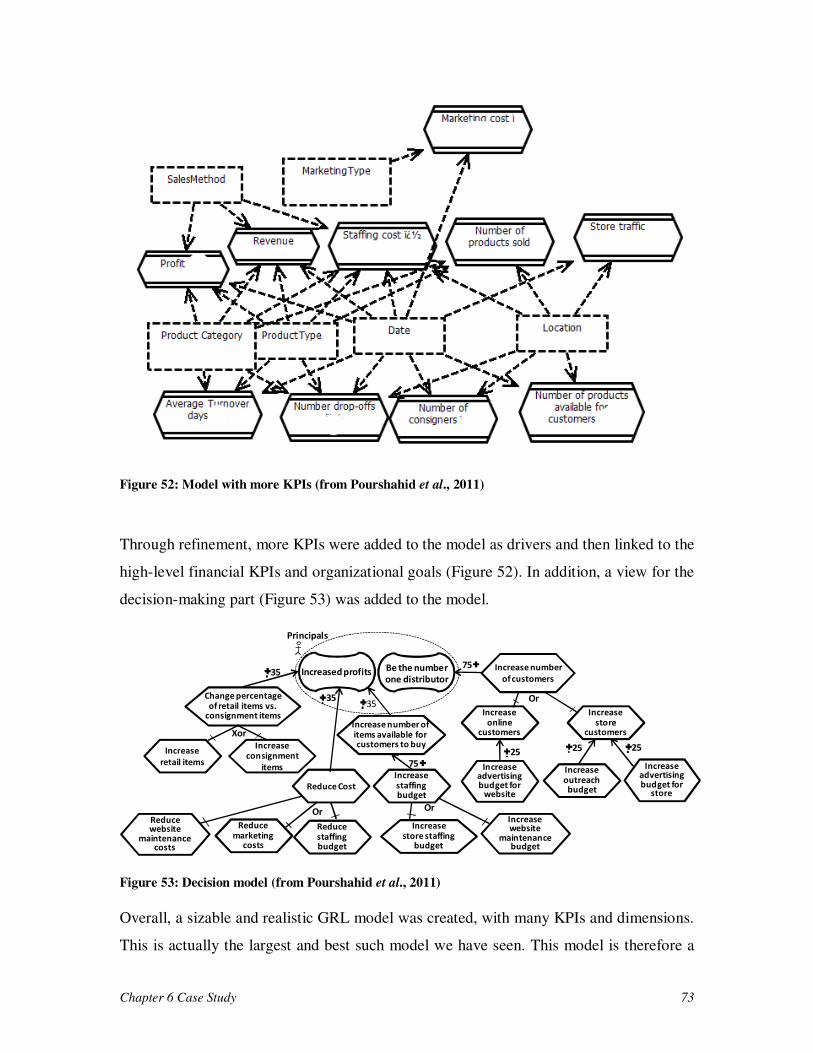
Chapter 6 Case Study 73
Figure 52: Model with more KPIs (from Pourshahid et al., 2011)
Through refinement, more KPIs were added to the model as drivers and then linked to the
high-level financial KPIs and organizational goals (Figure 52). In addition, a view for the
decision-making part (Figure 53) was added to the model.
Change percentageof retail items vs.
consignment items
Increase
retail items
Increase consignment
items
Xor
Increased profits Be the number
one distributor
Reduce Cost
Reduce marketing
costs
Reduce staffing budget
OrReduce website
maintenance costs
Increase website
maintenance budget
Increase store staffing
budget
Or
Increase staffing budget
Increase number of items available for customers to buy
Increase number
of customers
Increase online
customers
Increase store
customers
Or
Increase advertising budget for
store
Increase advertising budget for
website
Increase outreachbudget
35
3535
252525
75
75
Principals
Figure 53: Decision model (from Pourshahid et al., 2011)
Overall, a sizable and realistic GRL model was created, with many KPIs and dimensions.
This is actually the largest and best such model we have seen. This model is therefore a
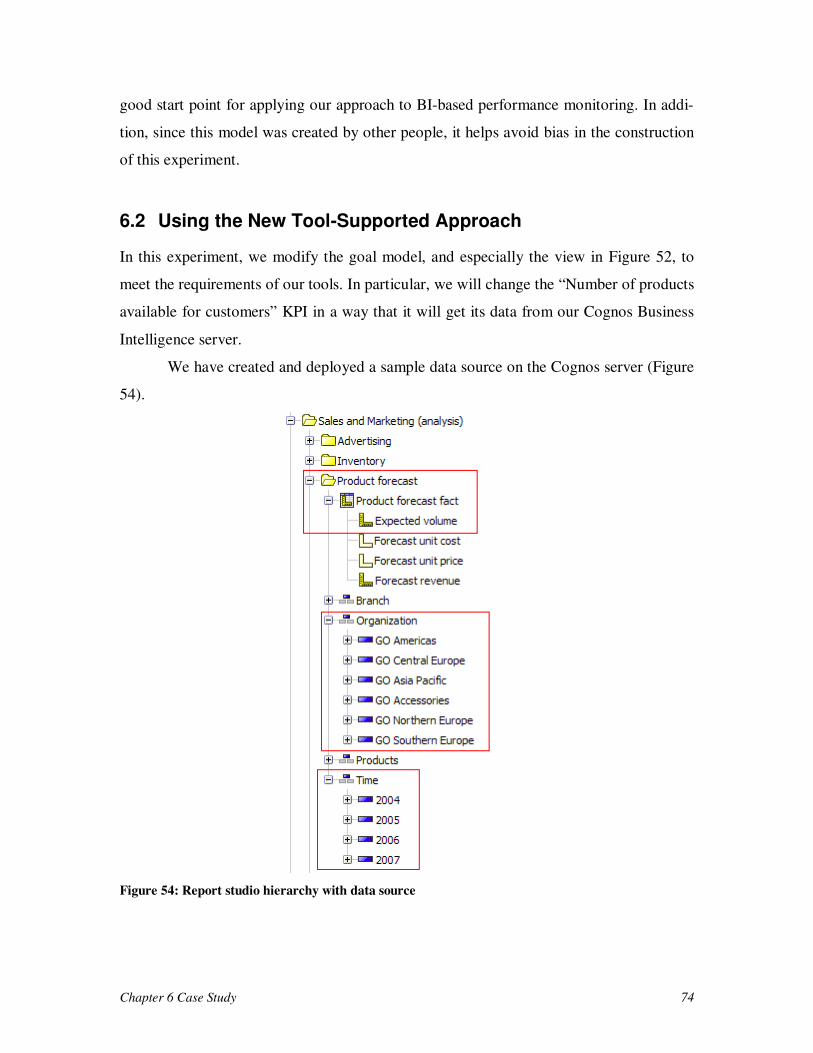
Chapter 6 Case Study 74
good start point for applying our approach to BI-based performance monitoring. In addi-
tion, since this model was created by other people, it helps avoid bias in the construction
of this experiment.
6.2 Using the New Tool-Supported Approach
In this experiment, we modify the goal model, and especially the view in Figure 52, to
meet the requirements of our tools. In particular, we will change the “Number of products
available for customers” KPI in a way that it will get its data from our Cognos Business
Intelligence server.
We have created and deployed a sample data source on the Cognos server (Figure
54).
Figure 54: Report studio hierarchy with data source
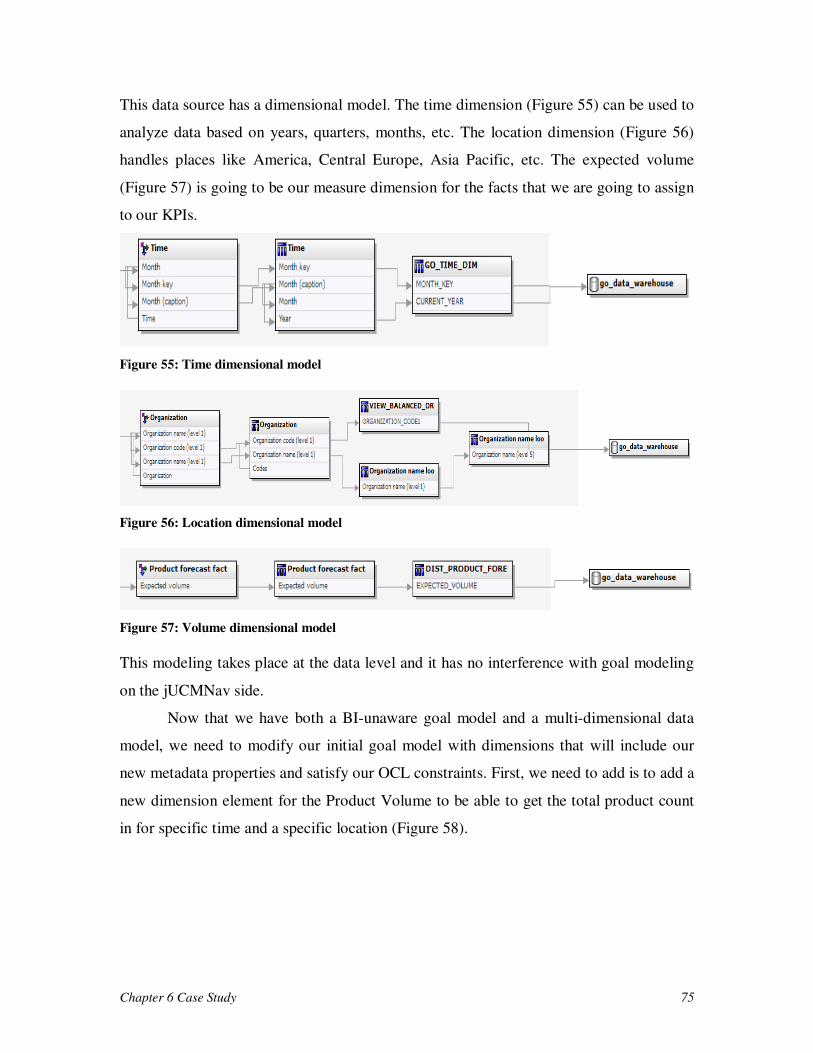
Chapter 6 Case Study 75
This data source has a dimensional model. The time dimension (Figure 55) can be used to
analyze data based on years, quarters, months, etc. The location dimension (Figure 56)
handles places like America, Central Europe, Asia Pacific, etc. The expected volume
(Figure 57) is going to be our measure dimension for the facts that we are going to assign
to our KPIs.
Figure 55: Time dimensional model
Figure 56: Location dimensional model
Figure 57: Volume dimensional model
This modeling takes place at the data level and it has no interference with goal modeling
on the jUCMNav side.
Now that we have both a BI-unaware goal model and a multi-dimensional data
model, we need to modify our initial goal model with dimensions that will include our
new metadata properties and satisfy our OCL constraints. First, we need to add is to add a
new dimension element for the Product Volume to be able to get the total product count
in for specific time and a specific location (Figure 58).
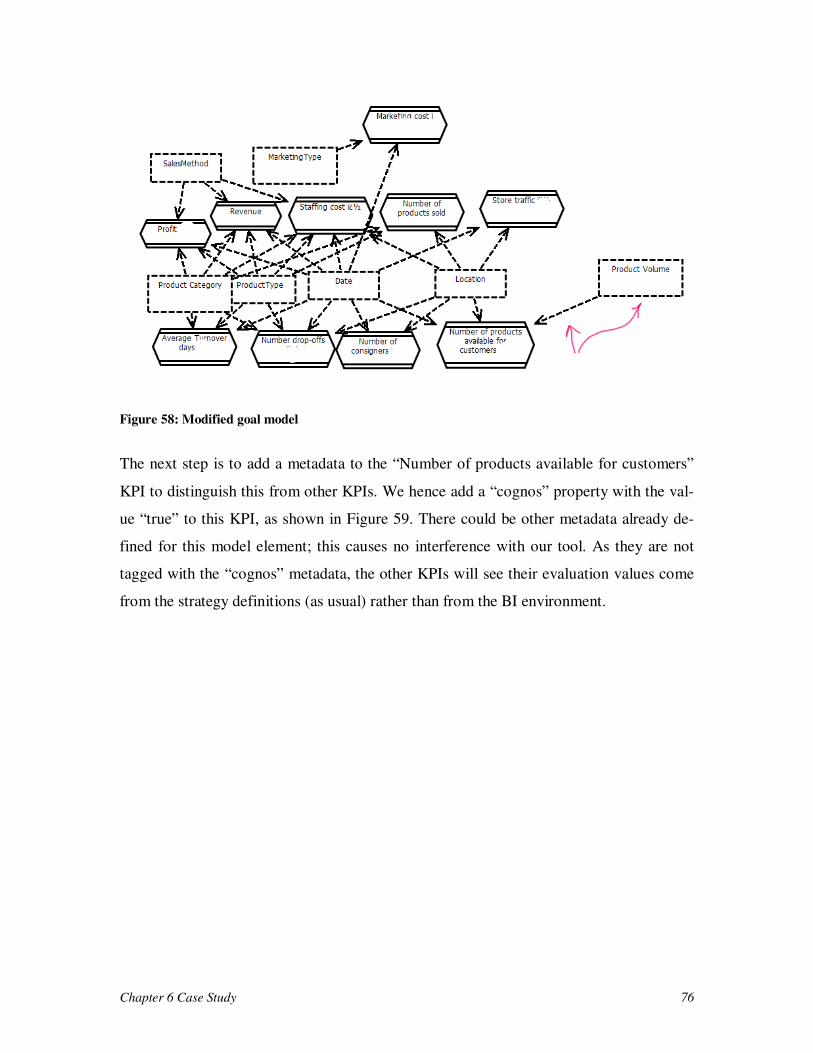
Chapter 6 Case Study 76
Figure 58: Modified goal model
The next step is to add a metadata to the “Number of products available for customers”
KPI to distinguish this from other KPIs. We hence add a “cognos” property with the val-
ue “true” to this KPI, as shown in Figure 59. There could be other metadata already de-
fined for this model element; this causes no interference with our tool. As they are not
tagged with the “cognos” metadata, the other KPIs will see their evaluation values come
from the strategy definitions (as usual) rather than from the BI environment.
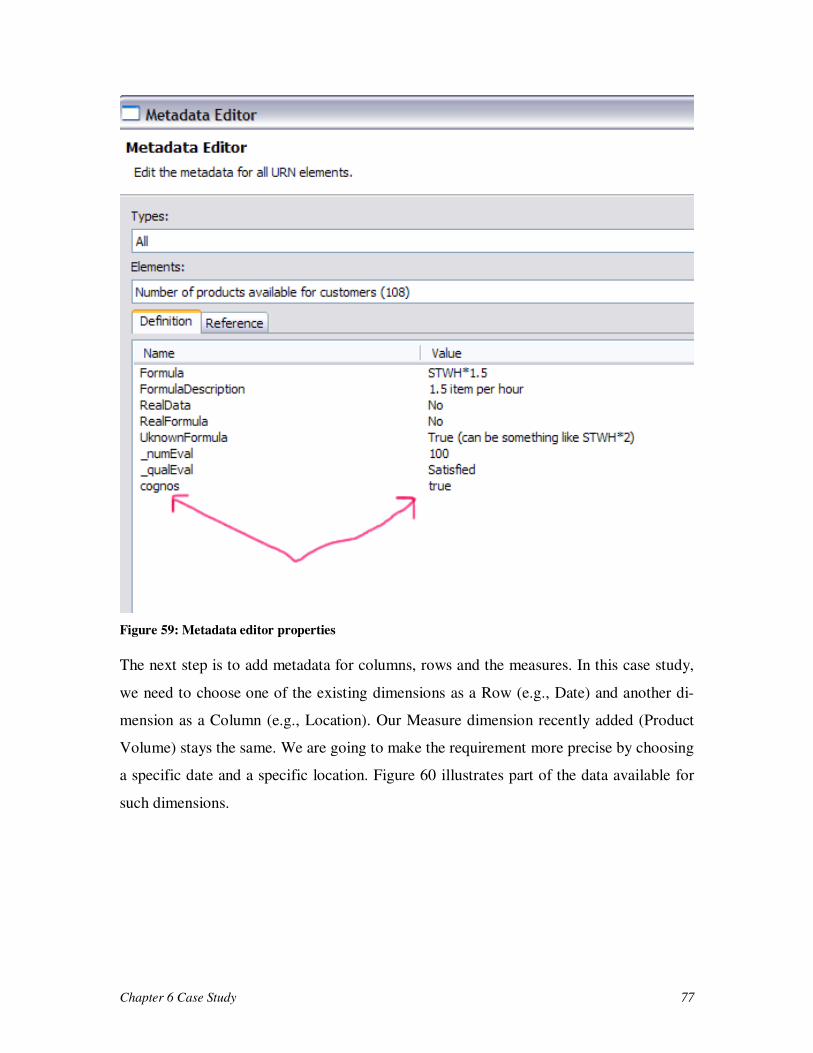
Chapter 6 Case Study 77
Figure 59: Metadata editor properties
The next step is to add metadata for columns, rows and the measures. In this case study,
we need to choose one of the existing dimensions as a Row (e.g., Date) and another di-
mension as a Column (e.g., Location). Our Measure dimension recently added (Product
Volume) stays the same. We are going to make the requirement more precise by choosing
a specific date and a specific location. Figure 60 illustrates part of the data available for
such dimensions.
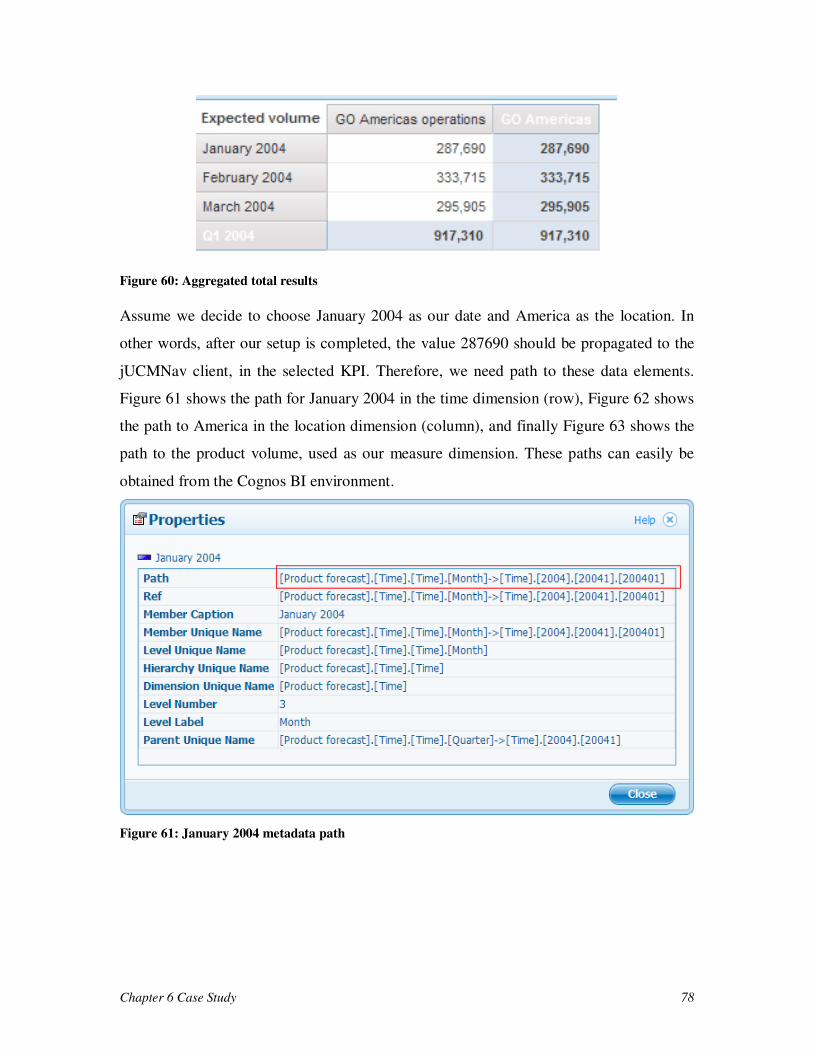
Chapter 6 Case Study 78
Figure 60: Aggregated total results
Assume we decide to choose January 2004 as our date and America as the location. In
other words, after our setup is completed, the value 287690 should be propagated to the
jUCMNav client, in the selected KPI. Therefore, we need path to these data elements.
Figure 61 shows the path for January 2004 in the time dimension (row), Figure 62 shows
the path to America in the location dimension (column), and finally Figure 63 shows the
path to the product volume, used as our measure dimension. These paths can easily be
obtained from the Cognos BI environment.
Figure 61: January 2004 metadata path
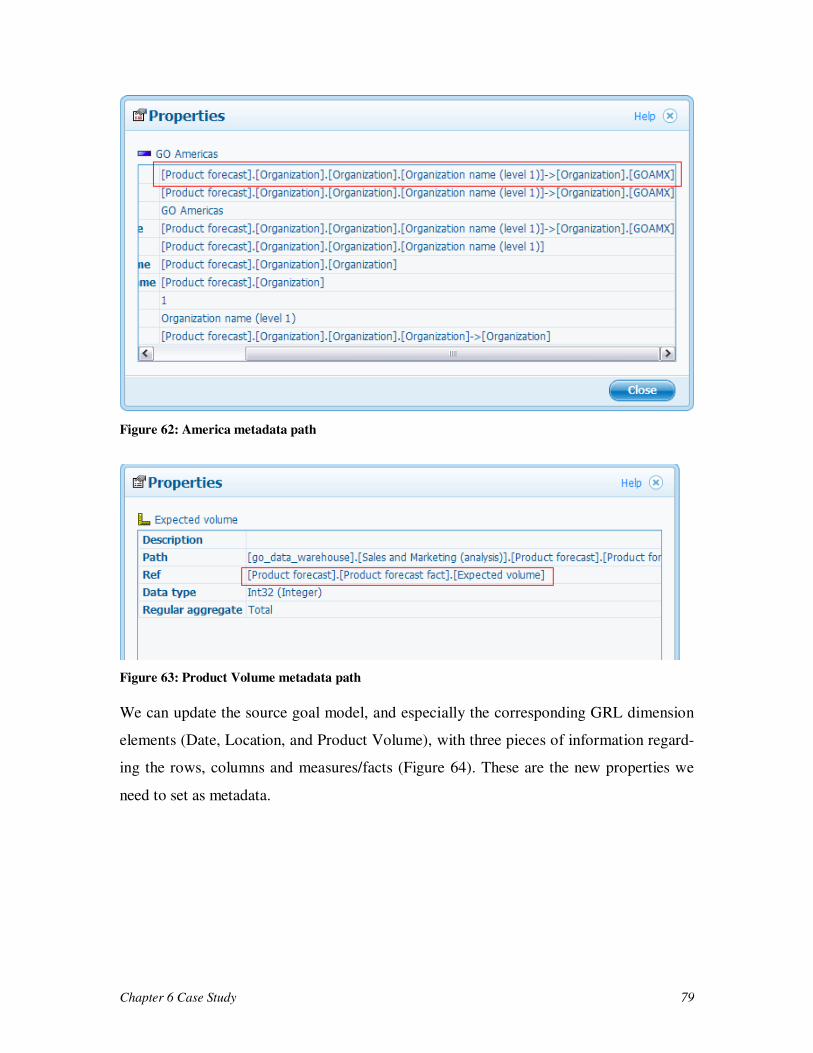
Chapter 6 Case Study 79
Figure 62: America metadata path
Figure 63: Product Volume metadata path
We can update the source goal model, and especially the corresponding GRL dimension
elements (Date, Location, and Product Volume), with three pieces of information regard-
ing the rows, columns and measures/facts (Figure 64). These are the new properties we
need to set as metadata.
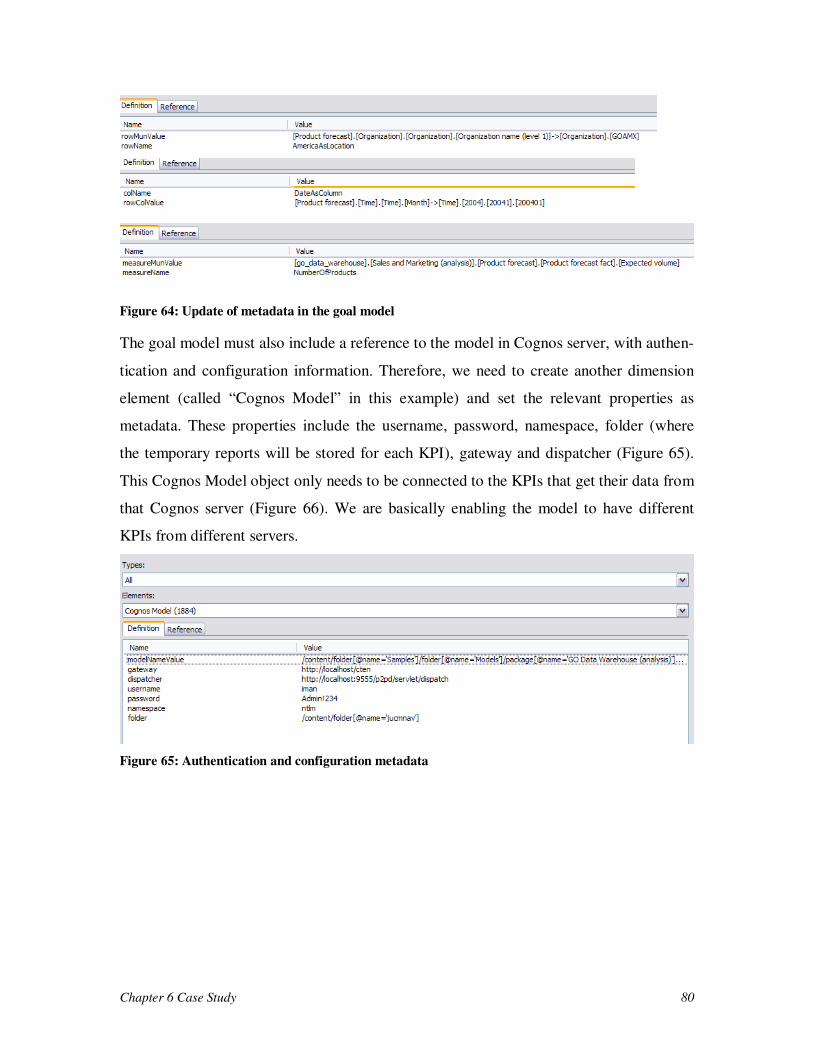
Chapter 6 Case Study 80
Figure 64: Update of metadata in the goal model
The goal model must also include a reference to the model in Cognos server, with authen-
tication and configuration information. Therefore, we need to create another dimension
element (called “Cognos Model” in this example) and set the relevant properties as
metadata. These properties include the username, password, namespace, folder (where
the temporary reports will be stored for each KPI), gateway and dispatcher (Figure 65).
This Cognos Model object only needs to be connected to the KPIs that get their data from
that Cognos server (Figure 66). We are basically enabling the model to have different
KPIs from different servers.
Figure 65: Authentication and configuration metadata
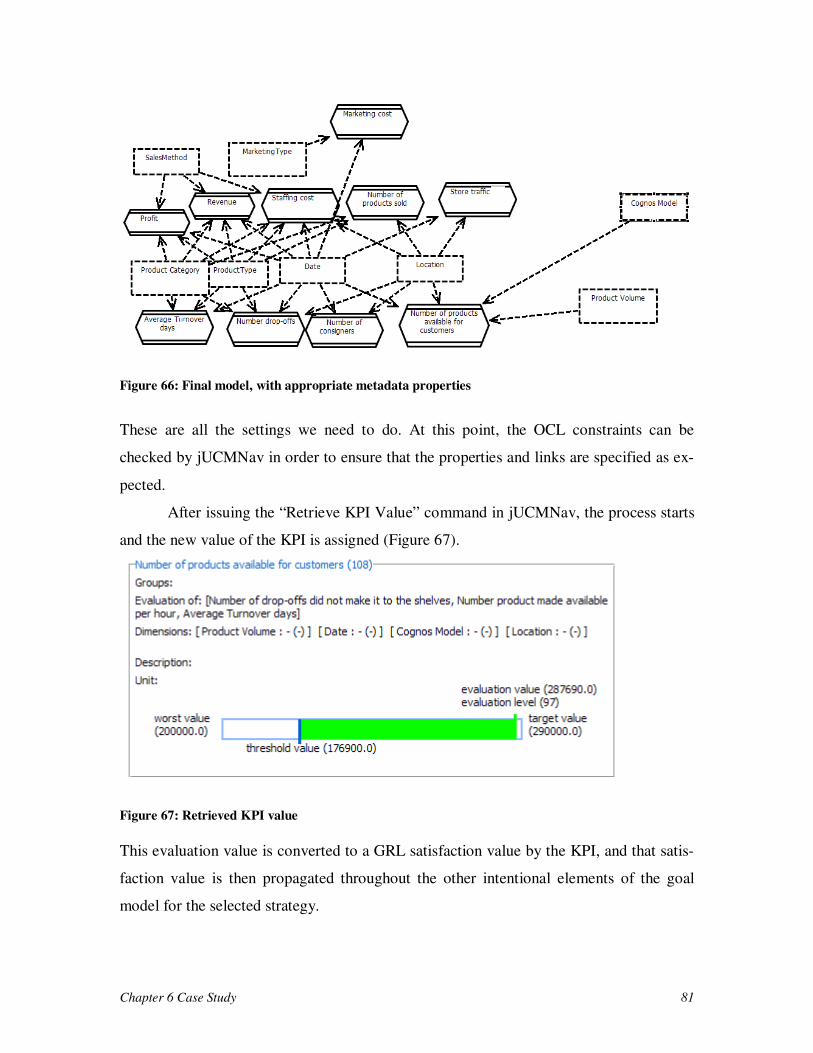
Chapter 6 Case Study 81
Figure 66: Final model, with appropriate metadata properties
These are all the settings we need to do. At this point, the OCL constraints can be
checked by jUCMNav in order to ensure that the properties and links are specified as ex-
pected.
After issuing the “Retrieve KPI Value” command in jUCMNav, the process starts
and the new value of the KPI is assigned (Figure 67).
Figure 67: Retrieved KPI value
This evaluation value is converted to a GRL satisfaction value by the KPI, and that satis-
faction value is then propagated throughout the other intentional elements of the goal
model for the selected strategy.
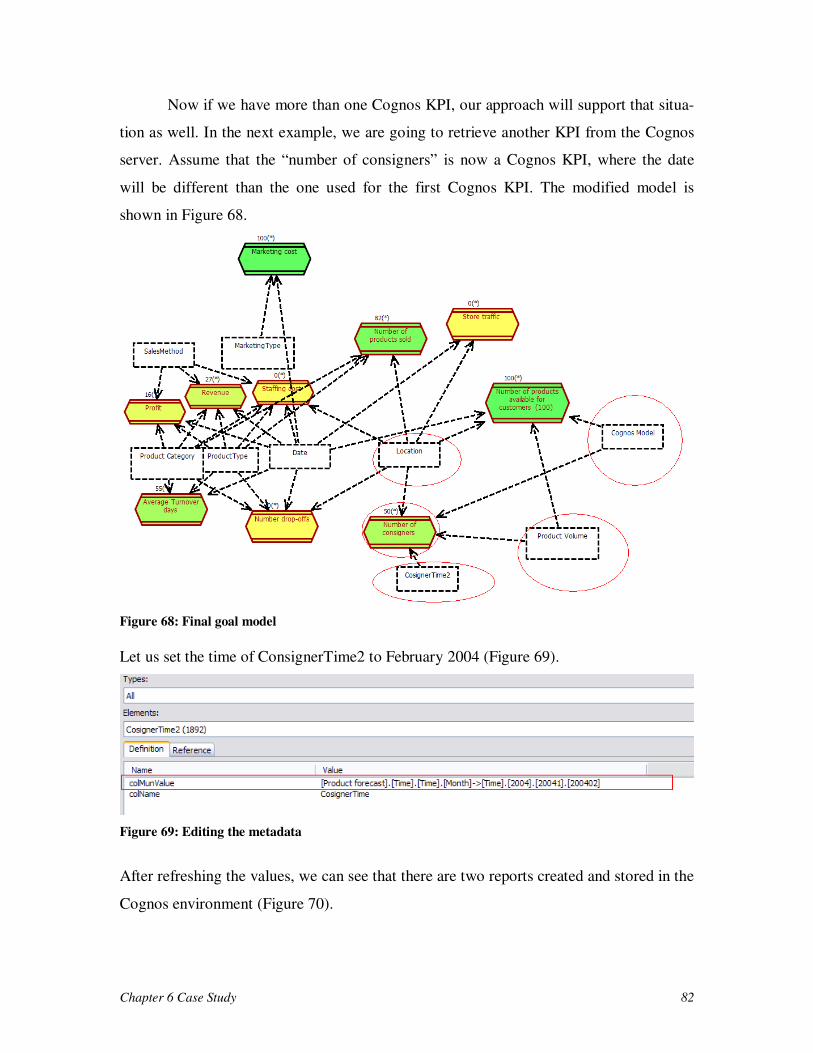
Chapter 6 Case Study 82
Now if we have more than one Cognos KPI, our approach will support that situa-
tion as well. In the next example, we are going to retrieve another KPI from the Cognos
server. Assume that the “number of consigners” is now a Cognos KPI, where the date
will be different than the one used for the first Cognos KPI. The modified model is
shown in Figure 68.
Figure 68: Final goal model
Let us set the time of ConsignerTime2 to February 2004 (Figure 69).
Figure 69: Editing the metadata
After refreshing the values, we can see that there are two reports created and stored in the
Cognos environment (Figure 70).
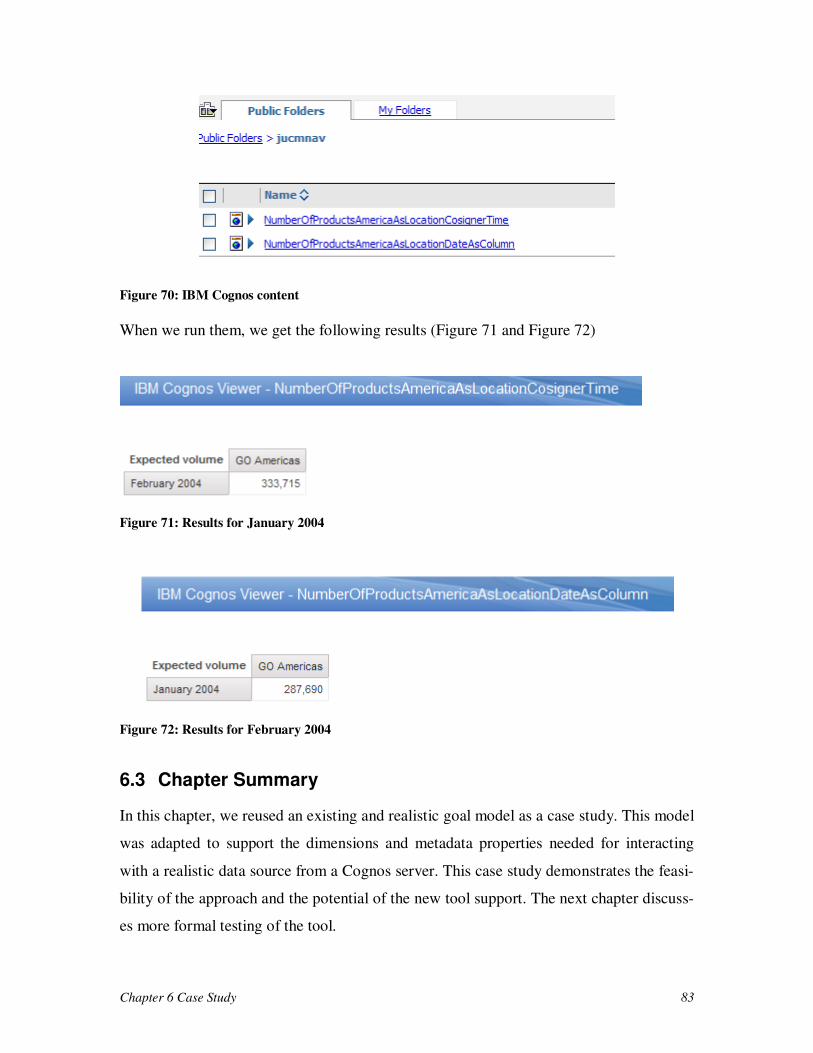
Chapter 6 Case Study 83
Figure 70: IBM Cognos content
When we run them, we get the following results (Figure 71 and Figure 72)
Figure 71: Results for January 2004
Figure 72: Results for February 2004
6.3 Chapter Summary
In this chapter, we reused an existing and realistic goal model as a case study. This model
was adapted to support the dimensions and metadata properties needed for interacting
with a realistic data source from a Cognos server. This case study demonstrates the feasi-
bility of the approach and the potential of the new tool support. The next chapter discuss-
es more formal testing of the tool.
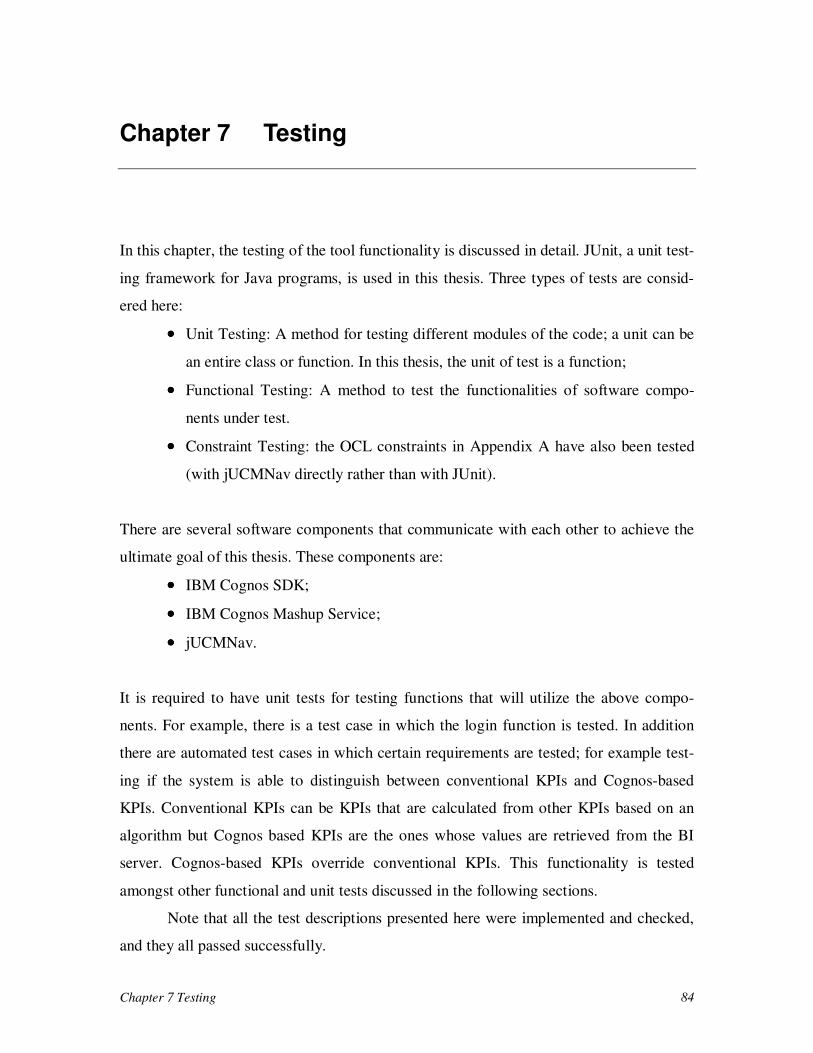
Chapter 7 Testing 84
Chapter 7 Testing
In this chapter, the testing of the tool functionality is discussed in detail. JUnit, a unit test-
ing framework for Java programs, is used in this thesis. Three types of tests are consid-
ered here:
•••• Unit Testing: A method for testing different modules of the code; a unit can be
an entire class or function. In this thesis, the unit of test is a function;
•••• Functional Testing: A method to test the functionalities of software compo-
nents under test.
•••• Constraint Testing: the OCL constraints in Appendix A have also been tested
(with jUCMNav directly rather than with JUnit).
There are several software components that communicate with each other to achieve the
ultimate goal of this thesis. These components are:
•••• IBM Cognos SDK;
•••• IBM Cognos Mashup Service;
•••• jUCMNav.
It is required to have unit tests for testing functions that will utilize the above compo-
nents. For example, there is a test case in which the login function is tested. In addition
there are automated test cases in which certain requirements are tested; for example test-
ing if the system is able to distinguish between conventional KPIs and Cognos-based
KPIs. Conventional KPIs can be KPIs that are calculated from other KPIs based on an
algorithm but Cognos based KPIs are the ones whose values are retrieved from the BI
server. Cognos-based KPIs override conventional KPIs. This functionality is tested
amongst other functional and unit tests discussed in the following sections.
Note that all the test descriptions presented here were implemented and checked,
and they all passed successfully.
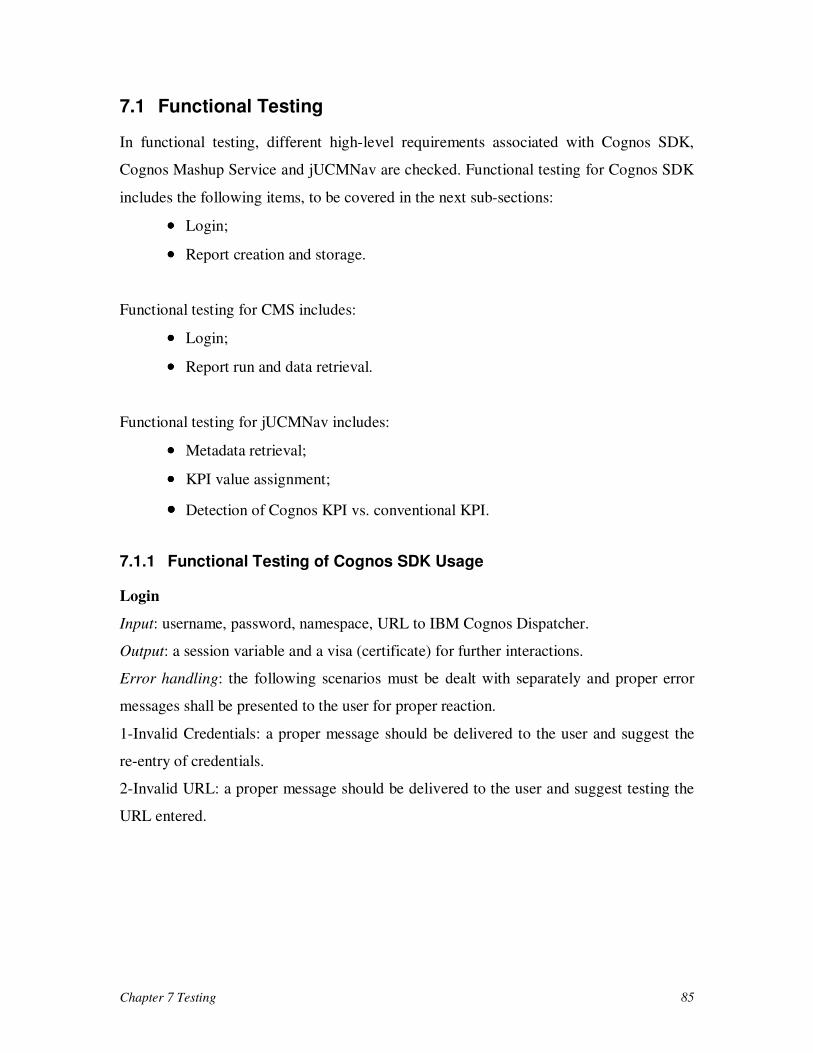
Chapter 7 Testing 85
7.1 Functional Testing
In functional testing, different high-level requirements associated with Cognos SDK,
Cognos Mashup Service and jUCMNav are checked. Functional testing for Cognos SDK
includes the following items, to be covered in the next sub-sections:
•••• Login;
•••• Report creation and storage.
Functional testing for CMS includes:
•••• Login;
•••• Report run and data retrieval.
Functional testing for jUCMNav includes:
•••• Metadata retrieval;
•••• KPI value assignment;
•••• Detection of Cognos KPI vs. conventional KPI.
7.1.1 Functional Testing of Cognos SDK Usage
Login
Input: username, password, namespace, URL to IBM Cognos Dispatcher.
Output: a session variable and a visa (certificate) for further interactions.
Error handling: the following scenarios must be dealt with separately and proper error
messages shall be presented to the user for proper reaction.
1-Invalid Credentials: a proper message should be delivered to the user and suggest the
re-entry of credentials.
2-Invalid URL: a proper message should be delivered to the user and suggest testing the
URL entered.
Chapter 7 Testing 86
Report creation and storage
Input: dimension values in the form of rows, columns, and facts for each KPI as well as a
location to store them on the Cognos server.
Output: Several number of reports stored in the proper location.
Error handling: the following scenarios must be dealt with separately.
1-Check for null: the tool should check null values before passing them to the Cognos
server.
2-Validate created reports: the specification of the reports should be validated before stor-
ing the latter on the Cognos server. Users should not have to troubleshoot if a wrong re-
port specification was created before retrieving the values.
3-Check for duplicates: there should be proper actions taken place when dealing with du-
plicate entries within the storage folder. Users should be able to choose either to replace
the existing report objects within the content store or preserve them and instead provide
the user with other options such as renaming the report object in the storage folder.
7.1.2 Functional Testing of Cognos Mashup Service Usage
Login
Input: the visa created by Cognos SDK.
Output: a confirmation that user is still logged in.
Error handling: If the visa is not valid anymore, then prompt the user for re-login.
Report run and data retrieval
Input: the search path created by Cognos SDK and associated with the current KPI.
Output: the value of the KPI.
Error handling: the following scenarios should be considered.
1-Report run error: if for any reason the report run failed, the user should be provided
with the proper message to be able to take the proper action.
2-Data retrieval error: if the data returned from the report is null, then it could be due to
an error in the report run or there might be no associated data for that row and column.
Chapter 7 Testing 87
7.1.3 Functional Testing for jUCMNav API
Metadata retrieval
Input: metadata information for dimension objects.
Output: the values assigned to each metadata.
Error handling: validate metadata properties entered for dimensions or KPI for null val-
ues.
KPI assignment
Input: specific KPI.
Output: a value assigned to that KPI.
Error handling: confirm that the value passed to the jUCMNav API is assigned to the
proper KPI where there exist multiple KPIs.
Detection of Cognos KPI vs. conventional KPI
Input: A KPI with metadata information pertaining to a conventional KPI, e.g., a calcu-
lated KPI based on algorithm, and metadata information related to Cognos (“cognos”
property), together with connections to two dimensions and to a fact dimension.
Output: Confirm that if the “cognos” property is set to “true” then the KPI is evaluated
based on the connected dimensions and fact, and if the “cognos” property is set to “false”
or is absent, then the KPI is evaluated based on the conventional algorithm.
7.2 Unit Testing
There are two classes in which modifications take place:
•••• seg.jUCMNav.views.kpi.KPIListView;
•••• grl.kpi.sdkReport.GenericReport.
Class seg.jUCMNav.views.kpi.KPIListView contains two methods:
•••• addReport;
•••• login.
Chapter 7 Testing 88
Class grl.kpi.sdkReport.GenericReport.GenericReport contains 1 constructor and 9 meth-
ods:
•••• GenericReport (constructor);
•••• buildColumnRelatedData;
•••• buildMeasureRelatedData;
•••• buildRowRelatedData;
•••• buildSpecification;
•••• modifyTemplateFile;
•••• readTemplateFile;
•••• removeBrackets;
•••• splitByArrow;
•••• splitByDot.
In the following subsections, unit testing of each of the methods is discussed in details.
7.2.1 Unit Testing for seg.jUCMNav.views.kpi.KPIListView
1-seg.jUCMNav.views.kpi.KPIListView.addReport: adds a report to the content store.
Unit test: create a report object and ensure that the object is created in the Cognos content
store.
Error handling: In case of unsuccessful addition of the report to the content store, log er-
ror in a related log file so that further failures can be tracked to this error.
2- seg.jUCMNav.views.kpi.KPIListView.logon: login to Cognos server.
Unit test: Provide two scenarios for successful and unsuccessful login.
Error handling: Provide proper logging in case of successful or unsuccessful login.
7.2.2 Unit Testing for grl.kpi.sdkReport.GenericReport.GenericReport:
1-grl.kpi.sdkReport.GenericReport.GenericReport: This is a constructor – no unit testing
required.

Chapter 7 Testing 89
2-grl.kpi.sdkReport.GenericReport.buildColumnRelatedData: this method builds part of
the report related the columns in the final report.
Unit test: provide a unit test to ensure proper column creation.
Error handling: check the passed values for null and provide proper error messages if any
of the values is null.
3-grl.kpi.sdkReport.GenericReport.buildMeasureRelatedData: this method builds part of
the report related to the measures/facts in the final report.
Unit test: provide a unit test to ensure proper measure creation.
Error handling: check the passed values for null and provide proper error messages if any
of the values is null.
4-grl.kpi.sdkReport.GenericReport.buildRowRelatedData: this method builds part of the
report related to the rows in the final report.
Unit test: provide a unit test to ensure proper row creation.
Error handling: check the passed values for null and provide proper error messages if any
of the values is null.
5-grl.kpi.sdkReport.GenericReport.buildSpecification: this method builds the report spec-
ification
Unit test: test the creation of a report specification.
Error handling: check whether the created report validates with Cognos server, and if not
then provide the user with proper messages about what went wrong.
6-grl.kpi.sdkReport.GenericReport.ModifyTemplateFile: this method creates the report
specification based on the template provided.
Unit test: this method is used within the “buildSpecification” method and is tested indi-
rectly when testing the “buildSpecificaiton” method
Chapter 7 Testing 90
7-grl.kpi.sdkReport.GenericReport.ReadTemplateFile: this method reads the template
report specification.
Unit test: check whether the template report file exists and can be read.
Error handling: in case the template report file does not exist, provide the user with a
proper error message.
8-grl.kpi.sdkReport.GenericReport.removeBrackets: this method is a utility function for
speciation creation.
Unit test: provide a test case for proper string manipulation.
9-grl.kpi.sdkReport.GenericReport.splitByArrow: this method is a utility function for
specification creation.
Unit test: provide a test case for proper string manipulation.
10-grl.kpi.sdkReport.GenericReport.splitByDot: this method is a utility function for spec-
ification creation.
Unit test: provide a test case for proper string manipulation.
7.3 Constraint Testing
Each of the nine OCL constraints described in Appendix A was tested on two URN mod-
els:
•••• The model for the case study presented in section 6.2, to check that the con-
straints do not detect false violations.
•••• A variant of the model for the case study where errors were deliberately inject-
ed (to cover all categories of errors detectable by the rules), to check that the
constraints detect true violations.
No unexpected result was observed while testing (and using) the OCL constraints.
Chapter 7 Testing 91
7.4 Chapter Summary
Testing is an important phase in the software development lifecycle. This chapter pre-
sented the types of testing performed to check the system’s functions and different re-
quirements of components that communicate with each other. Unit tests were added to
test the product at a very granular level and functional tests were used to test higher-level
functionalities. These tests were performed on components such as Cognos SDK, Cognos
Mashup Service and jUCMNav, as well as on the two classes that were modified (Gener-
icReport and KPIListView). Finally, the OCL constraints were tested to ensure they can
detect true violations and that they do not report false violations.
Chapter 8 Conclusions 92
Chapter 8 Conclusions
8.1 Summary of Contributions
This thesis introduces a new approach for implementing a goal-oriented performance
monitoring system for business processes and organization. This approach combines a
goal view where indicator values are populated through a business intelligence engine.
This goal view is based on the User Requirements Notation’s Goal-oriented Requirement
Language. This notation is interesting as it includes the concept of indicator. Indicators in
GRL were undergoing standardization while this thesis was written, and were approved
just before producing the revised and final version of this thesis. Tool support for this ap-
proach is composed of a modeling and monitoring tool for goals and processes
(jUCMNav tool) and of a leading business intelligence information provider (IBM
Cognos BI tool).
Through the implementation of this approach, the following contributions are
made in this thesis:
•••• A framework for report generation and BI content management: this approach
aims to facilitate the data modeling process without requiring users to be ex-
perts in BI report generation. A general knowledge of goal modeling and of the
dimensions available in the BI environment is sufficient. The user does not
need to know anything about IBM Cognos SDK or about IBM Cognos mashup
service. New user training is very minimal and is only required for the goal
modeling tool and the data model used for the goal model.
•••• Reduced time and effort for creating and maintaining linkage between a goal-
oriented modeling tool (jUCMNav) and a leading Business Intelligence appli-
cation (Cognos) through automation. The analyst now can work in the goal
modeling environment only (by annotating URN model elements with metada-
ta properties), without having to manipulate BI objects (such as reports) direct-
Chapter 8 Conclusions 93
ly. With this additional change, the new user does not need any training to ac-
complish this task since this task is completely independent of the user.
•••• A framework for integrating business process and organization monitoring
with goal-based evaluation and data retrieval: indicators retrieve their values
on the fly through a BI tool (without the need for manual intervention). In our
approach, this is achieved through the use of the Cognos SDK for report gener-
ation and the Cognos Mashup Service for running reports and getting results.
This feature can help with the real-time monitoring of business processes and
organization performance.
The thesis also provides justifications for many design choices, illustrative examples and
a case study, OCL rules to automate the checking of the well-formedness of input goal
models with metadata, a description of the main parts of the architecture and of the core
algorithm, and a description of the tests performed on the implementation. A comparison
with related work and with other design alternatives highlighted the benefits of the ap-
proach.
8.2 Limitations and Future Work
There are several limitations to our approach that represent potential topics for future
work.
First, at the moment, data retrieval is considered only for two dimensions and one
fact, and this can be a limitation in some contexts. For example, if a business analyst is
interested in “revenues in 2005 in North America for a specific product” (3 dimensions
and one fact), our approach can only answer sub-questions with regards to “revenues in
2005” or “revenues of a specific product in 2005”, to name a few. This thesis does not
implement a filtering capability to slice and dice data. A filtering capability would allow
analysts to bring more dimensions into the computation of a result. In addition, in this
thesis, multidimensional data is the only type of data that can be processed, and relational
data is not considered. This can also be a subject of future research.
Second, in terms of maintaining the auto-generated reports, a report deletion
mechanism is missing. Currently, the reports that are created can be cached within the
Chapter 8 Conclusions 94
Cognos internal database but there is a need to enforce deleting current reports to main-
tain the Cognos internal database to a reasonable size. IBM Cognos report specification
has the ability to modify a property that will enable or disable caching report results; in
this thesis this value is disabled. Cognos does not provide a mechanism to auto-delete
reports after a timestamp. A scheduled or manual report deletion mechanism can be the
subject of future research.
Third, in terms of scalability, the performance of the system for large a number of
users and a large number of KPIs/strategies can likely be improved. There are two time-
intensive activities that take place in this process:
1- Report generation;
2- Report run.
From experience using our tool on goal models, report generation usually takes 2-3 se-
conds per report and a report run takes about 1-2 seconds. Report generation is a sequen-
tial activity. For example, if there are 100 Cognos KPIs in the goal model for a given
strategy, about 4-5 minutes will be required for report generation. Report run time would
take an additional 2 minutes, approximately. A solution to improve this situation is to use
multi-threading for report creation. A new property can be introduced as “threshold val-
ue”. This value can be used to divide the report generation tasks amongst several threads.
For example, if the threshold value is 10, then the task of report generation is delegated to
one thread for every 10 KPIs. This could decrease the report generation time by a factor
of 10, assuming that computation resources are available. There are also server configura-
tions that can be manipulated for better performance. This allows routing requests to dif-
ferent dispatchers within the Cognos server; the latter allows for a multi-server infrastruc-
ture and it provides several routing mechanisms for incoming requests.
Fourth, there could be additional usability improvements. Currently, the entry of
KPI properties such as “rowMunValue” or “rowColValue” is textual. A user has to type
the value of these properties into the jUCMNav GUI. If the user types these values incor-
rectly, the user cannot be notified until the OCL rules are checked. There are two alterna-
tives for future improvements:
1- A user interface in which the user is presented with a data selection control;
2- A validation mechanism while the user types property values.
Chapter 8 Conclusions 95
Fifth, every time the “retrieve KPI values” command is issued, all the reports au-
to-generated for Cognos KPIs present in the model will be recreated again. This can de-
crease the performance of value retrieval drastically when the number of KPIs is large
and the user is not interested in recreation of the reports again unless there have been
changes in the dimension values. One alternative approach to investigate is the splitting
of report generation from report run, and to enable users to invoke them at will, one at a
time or together. One research issue is to detect situations when re-generating the reports
is absolutely necessary in order to avoid returning invalid report results after a run.
Sixth, usability studies can be conducted to detect the weaknesses of the current
approach in terms of user interface design and interaction with the user. User interface
prototypes can be developed and evaluated to improve the current interface, especially
the part where information needs to be input manually (new attributes).
Seventh, we have only considered one case study involving only one user. In the
future, more case studies can be conducted in different areas, and different types of users
can be given the product to use and evaluate. This can help produce less biased results as
well as a more robust product.
Eigth, one can explore the generalization of the concepts so that other goal model-
ing languages and BI tools could be used in the future.
Chapter 8 Conclusions 96
References
van der Aalst, W.M.P., ter Hofstede, A.H.M, and Weske, M. (2003) Business Process
Management: A Survey. Business Process Modeling (BPM'2003), LNCS 2678, Springer,
1-12.
Amyot, D. and Yan, J.B. (2008) Flexible Verification of User-Defined Semantic Con-
straints in Modelling Tools. 18th Int. Conf.of Computer Science and Software Engineer-
ing (CASCON 2008), Toronto, Canada, October. ACM, 81-95.
Amyot, D., Ghanavati, S., Horkoff, J., Mussbacher, G., Peyton, L., and Yu,E. (2010)
Evaluating Goal Models within the Goal-oriented Requirement Language, International
Journal of Intelligent Systems (IJIS), Vol. 25, Issue 8, August, 841-877.
Amyot, D. and Mussbacher, G. (2011) User Requirements Notation: The First Ten Years,
The Next Ten Years. Invited paper, Journal of Software (JSW), Vol. 6, No. 5, Academy
Publisher, May 2011, 747-768.
Amyot, D., Mussbacher, G., Ghanavati, S., and Kealey, J. (2011) GRL Modeling and
Analysis with jUCMNav. 5th International i* Workshop (iStar 2011), Trento, Italy, Au-
gust. CEUR-WS, Vol-766, 160-162.
Apache (2006) Axis 1.4. Online, http://axis.apache.org/axis/
Barone, D., Yu, E., Won, J., Jiang, L., and Mylopoulos, J. (2010) Enterprise Modelling
for Business Intelligence. 3rd Working Conf. on the Practice of Enterprise Modeling
(PoEM 2010), Delft, The Netherlands, November. LNPIB 68, Springer, 31-45.
Behnam, S.A., Amyot, D., Forster, A.J., Peyton, L., and Shamsaei, A. (2009) Goal-driven
development of a patient surveillance application for improving patient safety. E-
Technologies: Innovation in an Open World, LNCS, vol. 26, Springer, 65-76.
Chapter 8 Conclusions 97
Boehmer, W. (2009) Cost-Benefits Trade-Off Analysis of an ISM based on ISO 27001.
Int. Conf. on Availability, Reliability and Security (ARES 2009), Fukuoka, Japan. IEEE
CS, 392-399.
Browne, D. et al. (2010), IBM Cognos Business Intelligence V10.1 Handbook. IBM
Redbooks. Online, http://www.redbooks.ibm.com/abstracts/sg247912.html
Chen, P. (2008) Goal-oriented Business Process Monitoring. M.Sc. thesis, SCS, Carleton
University, Ottawa, Canada.
Chung, L., Nixon, B.A., Yu, E, and Mylopoulos, J. (2000) Non-Functional Requirements
in Software Engineering. Kluwer Academic Publishers, Dordrecht, USA.
Dang, J., Hedayati, A., Hampel, K., and Toklu, C. (2008) An ontological knowledge
framework for adaptive medical workflow. JBI, vol.41, Elsevier Science, Amsterdam,
829-836.
Horkoff, J., Yu, Y., and Yu, E. (2011) OpenOME: An Open-source Goal and Agent-
Oriented Model Drawing and Analysis Tool. 5th International i* Workshop (iStar 2011),
Trento, Italy, August. CEUR-WS, Vol-766, 154-156.
IBM (2012a) Cognos Business Insight – Features and Benefits. Online, http://www-
01.ibm.com/software/analytics/cognos/business-insight/features-and-benefits.html
IBM (2012b) Cognos Mashup Service – Features and Benefits. Online, http://www-
01.ibm.com/software/analytics/cognos/mashup-service/features-and-benefits.html
ITU-T (2008) Recommendation Z.151 (11/08): User Requirements Notation (URN) -
Language Definition. Geneva, Switzerland, November 2008.
Kaplan, R.S. and Norton, D.P. (1996) Balanced Scorecard: Translating Strategy into Ac-
tion. Harvard Business School Press.
Kaplan, R.S. and Norton, D.P. (2004) Strategy Maps: Converting Intangible Assets into
Tangible Outcomes. Harvard Business School Press, September 2004, 1-4.
Chapter 8 Conclusions 98
Kealey, J. (2007) Enhanced Use Case Map Analysis and Transformation Tooling. M.Sc.
thesis, SITE, University of Ottawa, Canada.
Luo, H. and Amyot, D. (2011) Towards a Declarative, Constraint-Oriented Semantics
with a Generic Evaluation Algorithm for GRL. 5th International i* Workshop (iStar
2011), Trento, Italy, August. CEUR-WS, Vol-766, 26-31.
Martin, C. and Refai, M. (2007) A Policy-based Metrics Framework for Information Se-
curity Performance Measurement. 2nd IEEE/IFIP Int. Workshop on Business-Driven IT
Management (BDIM’07), Munich, Germany. IEEE CS, 94-101.
Martinez, A., Gonzalez, N., and Estrada, H. (2010) A Goal-oriented approach for work-
flow monitoring. Fourth Int. i* Workshop, Tunisia. CEUR-WS, 118-122.
Miga, A. (1998) Application of Use Case Maps to System Design with Tool Support.
Masters thesis, SCE, Carleton University.
Nigam, A., Jeng, J., Chao, T., and Change, H. (2008) Managed Business Artifacts. 2008
IEEE International Conference on e-Business Engineering, China, IEEE CS, 390-395.
Peffers, K., Tuunanen, T., Rothenberger, M., and Chatterjee, S. (2007) A Design Science
Research Methodology for Information Systems Research. Journal of Management In-
formation Systems, Volume 24, Issue 3, 45-78.
Popescu, C. (2011), IBM Cognos Proven Practices: Hands-on IBM Cognos Software De-
velopment Kit Programming. IBM developerWorks. Online, http://www.ibm.com/
developerworks/data/library/cognos/development/how_to/page565.html
Popova, V. and Sharpanskykh, A. (2011) Formal modelling of organisational goal based
on performance indicators. Data & Knowledge Engineering, 70, 335-364.
Popova, V. and Treur, J. (2005) A Specification Language for Organizational Perfor-
mance Indicators. Innovations in applied artificial intelligence, LNCS 3533, Springer,
179-182.
Chapter 8 Conclusions 99
Pourshahid, A., Chen, P., Amyot, D., Forster, A.J., Ghanavati, S., Peyton, L., and Weiss,
M. (2009) Business Process Management with the User Requirements Notation. Elec-
tronic Commerce Research, 9(4), Springer, December 2009, 269-316.
Pourshahid, A., Richards, G., and Amyot, D. (2011) Toward a Goal-Oriented, Business
Intelligence Decision-Making Framework. 5th International MCETECH Conference on
eTechnologies, Les Diablerets, Switzerland, January. LNBIP 78, Springer, 100-115.
Rao Vallabhaneni, S. (2008) Corporate Management, Governance, and Ethics Best Prac-
tices. Wiley.
Roy, J.F. (2007) Requirement Engineering with URN: Integrating Goals and Scenarios.
M.Sc. thesis, SITE, University of Ottawa, Canada.
Shamsaei, A., Pourshahid, A., and Amyot, D. (2011) A Systematic Review of Compli-
ance Management Based on Goals and Indicators. Third Int. Workshop on Governance,
Risk and Compliance - Applications in Information Systems (GRCIS 2011), CAiSE 2011
Workshops, London, UK, June. LNBIP 83, Springer, 228-237.
Siena, A., Bonetti, P., and Giorgini, P. (2008) Balanced Goalcards: Combining balanced
scorecards and goal analysis. Third International Conference on Evaluation of Novel Ap-
proaches to Software Engineering (ENASE 2008), Funchal, Portugal, May.
Sleigh, C. and Johari, I. (2010) Get started with the IBM Cognos Mashup Service. IBM
developerWorks, January. http://www.ibm.com/developerworks/data/library/techarticle/
dm-1001cognosmashup/index.html
Vrbaski, M., Mussbacher, G., Petriu, D.C., and Amyot, D. (2012) Goal Models as Run-
time Entities in Context-Aware Systems. Models@Run-Time, MODELS Workshops, Vi-
enna, Austria, October 2012. ACM (to appear)
Weiss, M. and Amyot, D. (2005) Business Process Modeling with URN. International
Journal of E-Business Research, 1(3), July-September, 63-90.

Chapter 8 Conclusions 100
Yu, E. (1997) Towards Modelling and Reasoning Support for Early-Phase Requirements
Engineering. 3rd IEEE Int. Symp. on Requirements Engineering (RE’97), Washington,
USA. IEEE CS, 226-235.
Yu, E., Giorgini, P., Maiden, N., Mylopoulos, J., Fickas, S. (2010) Social Modeling for
Requirements Engineering. MIT Press, Cooperative Information Systems series.
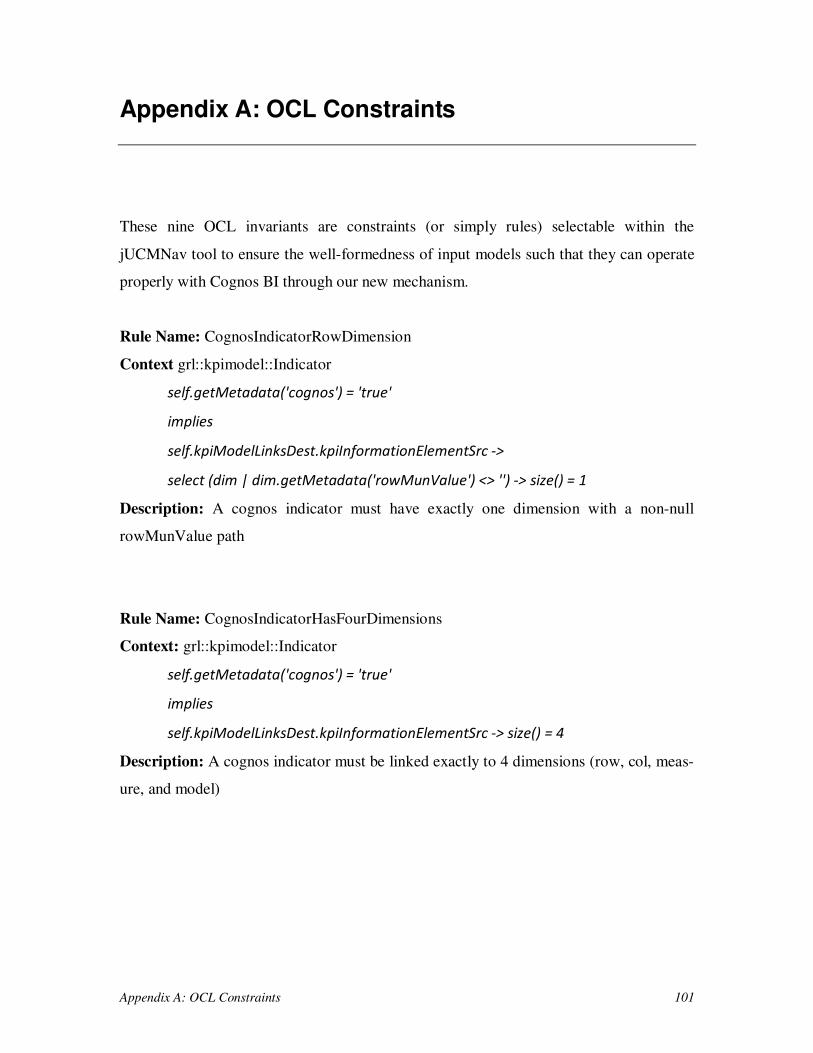
Appendix A: OCL Constraints 101
Appendix A: OCL Constraints
These nine OCL invariants are constraints (or simply rules) selectable within the
jUCMNav tool to ensure the well-formedness of input models such that they can operate
properly with Cognos BI through our new mechanism.
Rule Name: CognosIndicatorRowDimension
Context grl::kpimodel::Indicator
self.getMetadata('cognos') = 'true'
implies
self.kpiModelLinksDest.kpiInformationElementSrc ->
select (dim | dim.getMetadata('rowMunValue') <> '') -> size() = 1
Description: A cognos indicator must have exactly one dimension with a non-null
rowMunValue path
Rule Name: CognosIndicatorHasFourDimensions
Context: grl::kpimodel::Indicator
self.getMetadata('cognos') = 'true'
implies
self.kpiModelLinksDest.kpiInformationElementSrc -> size() = 4
Description: A cognos indicator must be linked exactly to 4 dimensions (row, col, meas-
ure, and model)
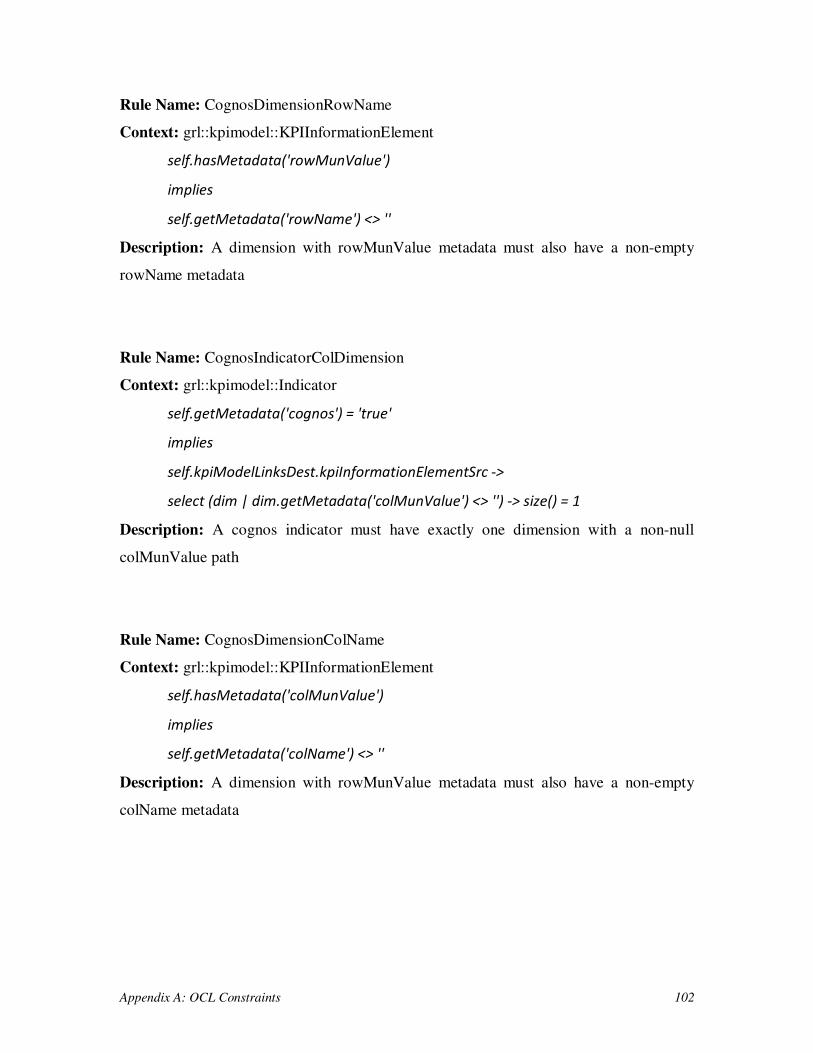
Appendix A: OCL Constraints 102
Rule Name: CognosDimensionRowName
Context: grl::kpimodel::KPIInformationElement
self.hasMetadata('rowMunValue')
implies
self.getMetadata('rowName') <> ''
Description: A dimension with rowMunValue metadata must also have a non-empty
rowName metadata
Rule Name: CognosIndicatorColDimension
Context: grl::kpimodel::Indicator
self.getMetadata('cognos') = 'true'
implies
self.kpiModelLinksDest.kpiInformationElementSrc ->
select (dim | dim.getMetadata('colMunValue') <> '') -> size() = 1
Description: A cognos indicator must have exactly one dimension with a non-null
colMunValue path
Rule Name: CognosDimensionColName
Context: grl::kpimodel::KPIInformationElement
self.hasMetadata('colMunValue')
implies
self.getMetadata('colName') <> ''
Description: A dimension with rowMunValue metadata must also have a non-empty
colName metadata
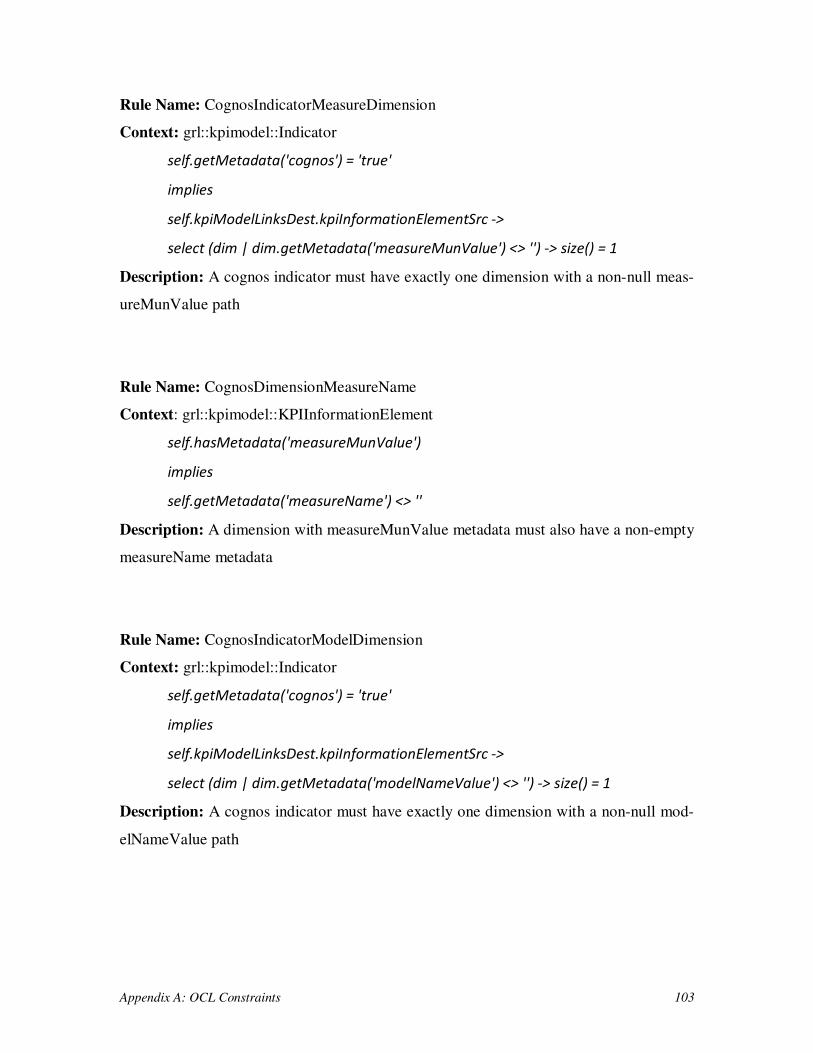
Appendix A: OCL Constraints 103
Rule Name: CognosIndicatorMeasureDimension
Context: grl::kpimodel::Indicator
self.getMetadata('cognos') = 'true'
implies
self.kpiModelLinksDest.kpiInformationElementSrc ->
select (dim | dim.getMetadata('measureMunValue') <> '') -> size() = 1
Description: A cognos indicator must have exactly one dimension with a non-null meas-
ureMunValue path
Rule Name: CognosDimensionMeasureName
Context: grl::kpimodel::KPIInformationElement
self.hasMetadata('measureMunValue')
implies
self.getMetadata('measureName') <> ''
Description: A dimension with measureMunValue metadata must also have a non-empty
measureName metadata
Rule Name: CognosIndicatorModelDimension
Context: grl::kpimodel::Indicator
self.getMetadata('cognos') = 'true'
implies
self.kpiModelLinksDest.kpiInformationElementSrc ->
select (dim | dim.getMetadata('modelNameValue') <> '') -> size() = 1
Description: A cognos indicator must have exactly one dimension with a non-null mod-
elNameValue path
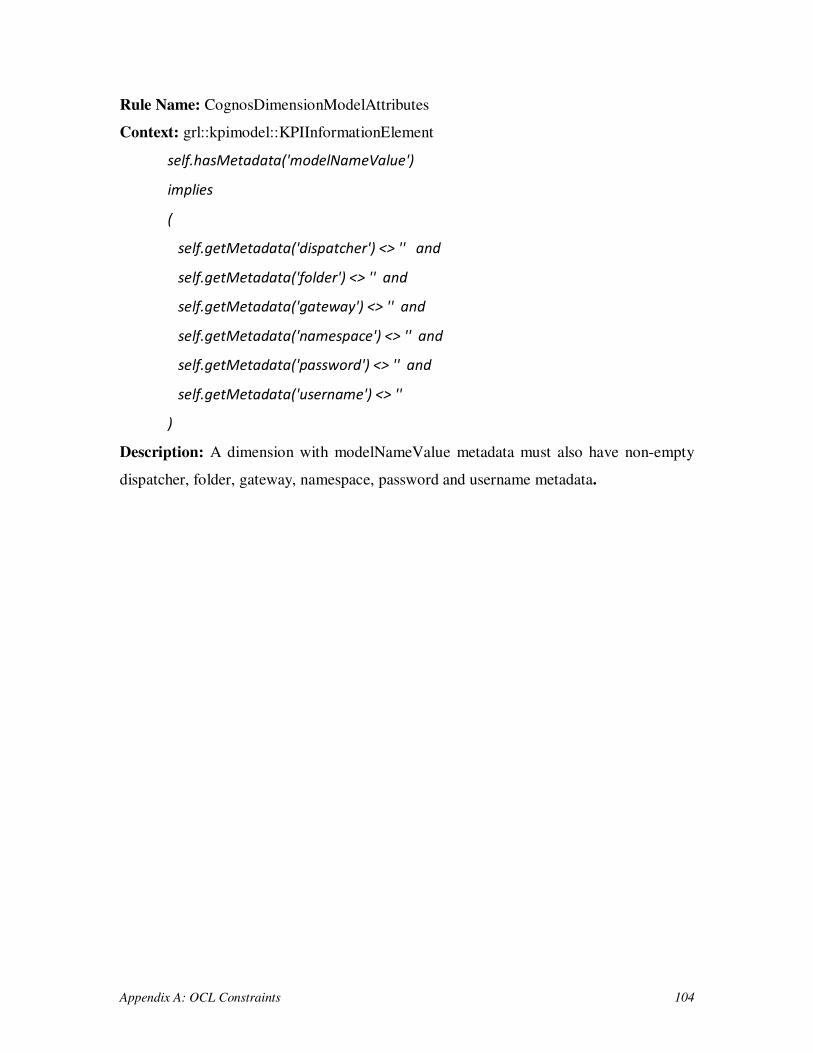
Appendix A: OCL Constraints 104
Rule Name: CognosDimensionModelAttributes
Context: grl::kpimodel::KPIInformationElement
self.hasMetadata('modelNameValue')
implies
(
self.getMetadata('dispatcher') <> '' and
self.getMetadata('folder') <> '' and
self.getMetadata('gateway') <> '' and
self.getMetadata('namespace') <> '' and
self.getMetadata('password') <> '' and
self.getMetadata('username') <> ''
)
Description: A dimension with modelNameValue metadata must also have non-empty
dispatcher, folder, gateway, namespace, password and username metadata.