Embed Size (px)
Citation preview

Comprehensive Legislative Proposals to Enhance Social Security
Testimony by Stephen C. Goss, Chief Actuary, Social Security Administration
House Committee on Ways and Means, Subcommittee on Social Security
April 10, 2019
Chairman Larson, Ranking Member Reed, and members of the subcommittee, thank you very
much for the opportunity to speak to you today about comprehensive legislative proposals that
would enhance Social Security. As indicated in the 2018 Social Security Trustees Report, the
accumulated reserves of the combined OASI and DI Trust Funds are projected to become
depleted in 2034 under current law.
Trust fund reserve depletion is a critical prospect for Social Security, because there is no current
authority in the law that would allow borrowing in order to continue paying scheduled benefits in
full and on time. For this reason, Congress has always acted to avert reserve depletion, as shown
in the figure below. The last comprehensive legislation for Social Security was enacted in 1983.
Since 1983, the total payroll tax rate was reallocated in 1994 and again in 2015 to avert depletion
of DI Trust Fund reserves. Further comprehensive legislation will be needed by 2034 in order to
avoid combined OASI and DI reserve depletion.
0%
50%
100%
150%
200%
250%
300%
350%
400%
1975 1980 1985 1990 1995 2000 2005 2010 2015 2020 2025 2030 2035
Social Security Trust Fund Ratios: Reserves as Percent of Annual Cost History and 2018 Trustees Report Intermediate Projections
OASI
OASI+DICombined
DI
1983 Amendments
Payroll Tax Rate Reallocation

2
Enacting changes well before reserve depletion, even with delayed effective dates, will allow
more options to be considered, more advance warning for those affected, and a more gradual
phase-in of adjustments. Over the past 28 years, Trustees Reports have projected reserve
depletion for the combined OASI and DI Trust Funds as early as 2029 and as late as 2042.
If reserve depletion is allowed to occur in 2034, continuing income to Social Security at that time
would be sufficient to finance only 79 percent of the benefits scheduled in the law, with that
percentage declining to 74 percent by 2092. The figure below shows the projected level of the
cost for paying full scheduled benefits and the scheduled revenue for the program, both as a
percentage of Social Security’s payroll tax base. After reserve depletion, the cost of paying full
benefits is shown in a dashed line, because under current law that cost could not and would not
be met. In fact, after reserve depletion, the level of payable benefits would be reduced to the
amount available from the continuing tax income for the program.
OASDI Annual Cost and Non-Interest Income as Percent of Taxable Payroll
Therefore, under the intermediate projections in the 2018 Trustees Report, in order to avoid
reserve depletion and a sudden reduction in the level of payable benefits, we will need to make
adjustments in the law by 2034. These adjustments will need to: (1) increase scheduled revenue
0%
5%
10%
15%
20%
25%
2005 2015 2025 2035 2045 2055 2065 2075 2085 2095
Calendar year
Cost: Scheduled and
payable benefits
Non-interest Income
Payable benefits as percent
of scheduled benefits:2017-33: 100%
2034: 79%2092: 74%
Cost: Scheduled but not
fully payable benefits
Expenditures: Payable benefits = income
after trust fund depletion in 2034
3
for the OASDI program by about 29 percent, (2) reduce scheduled benefits by about 23 percent,
or (3) provide some combination of these revenue increases and benefit reductions.
Another way of viewing the cost of providing currently scheduled Social Security benefits is to
consider cost as a percent of Gross Domestic Product (GDP). The figure below shows that while
the cost of Social Security benefits was about 4.5 percent of GDP for many years before around
2008, the cost of the program will rise to about 6 percent of GDP by 2034 and will remain
essentially stable at that level thereafter. The currently scheduled non-interest income is
projected to remain relatively level at about 4.6 percent of GDP. Thus, after 2034, there will be a
stable gap of about 1.4 percent of GDP between scheduled income and the cost of scheduled
benefits. This speaks to Social Security’s financial sustainability for the future. The stability of
the shortfall of income under current law relative to GDP suggests that the structure of the
program is sustainable for the future, but that adjustments in the level of income or benefits will
be needed.
SUSTAINABILITY: Cost as Percent of GDP
The cost of the Social Security program as a percent of GDP closely follows the ratio of Social
Security beneficiaries to workers in covered employment, because the average monthly benefit
under the program is designed to rise from one generation to the next at about the same rate as
the average earnings for workers making payroll tax contributions.
0%
2%
4%
6%
8%
10%
1990 2000 2010 2020 2030 2040 2050 2060 2070 2080 2090
Calendar year
Non-interest Income
Historical Estimated
Cost

4
Projected Number of OASDI Beneficiaries per 100 Covered Workers
In turn, the ratio of beneficiaries to covered workers closely follows the “aged dependency
ratio,” which is the population age 65 and over as a percent of the working age population at
ages 20 through 64. The next figure illustrates that the large increase in this ratio between 2010
and 2035 is due primarily to the drop in birth rates, from about 3 children per woman historically
(3.3 during the baby-boom years) to about 2 children per woman in more recent years.
0
10
20
30
40
50
60
70
80
1980 1990 2000 2010 2020 2030 2040 2050 2060 2070 2080 2090
Calendar year
Historical Estimated
0.00
0.05
0.10
0.15
0.20
0.25
0.30
0.35
0.40
0.45
0.50
1940 1950 1960 1970 1980 1990 2000 2010 2020 2030 2040 2050 2060 2070 2080 2090 2100
Aged Dependency Ratio 2018 TRPopulation 65+/(20-64)
Actual and TR Intermediate
TFR remains at 3.0 after 1964
TFR remains at 3.3 after 1964

5
Changes in longevity due to declines in death rates play a more gradual but steady role in the
trend of the aged dependency ratio. Fortunately, the mortality projections used in the Trustees
Reports have provided a sound basis for evaluating the actuarial status of Social Security in the
past. While some have suggested assuming dramatically faster mortality improvement, the track
record for the Trustees Reports, plus the very substantial deceleration in mortality improvement
since 2009, suggest that projections in the 2018 report represent a sound basis for evaluating
prospects for the future.
Future Social Security Benefit Levels and Tax Levels
Financial planners generally recommend that workers plan to have retirement income at a level
of about 75 to 80 percent of their income during their working career. Social Security has been
designed to provide a portion of that retirement income, with the expectation that employer-
provided pensions and personal savings will contribute as well. Because lower-paid workers are
generally less able to save, and often have little non-Social Security pension income, the Social
Security benefit formula is designed to provide a higher percentage of career-average income for
lower earners than for higher earners. The figure below illustrates this benefit “replacement
rate” for workers at a range of career earnings levels, assuming they start receipt of Social
Security retired worker benefits at age 65.
0
10
20
30
40
50
60
70
1940 1960 1980 2000 2020 2040 2060 2080
Scheduled Monthly Benefit Levels as Percent of Career-Average
Earnings by Year of Retirement at age 65
Low Earner ($23,353 for 2018; 25th percentile)
Medium Earner ($51,894 for 2018; 56th percentile)
High Earner ($83,031 for 2018; 82nd percentile)
Max Earner ($128,400 for 2018; 100th percentile)
6
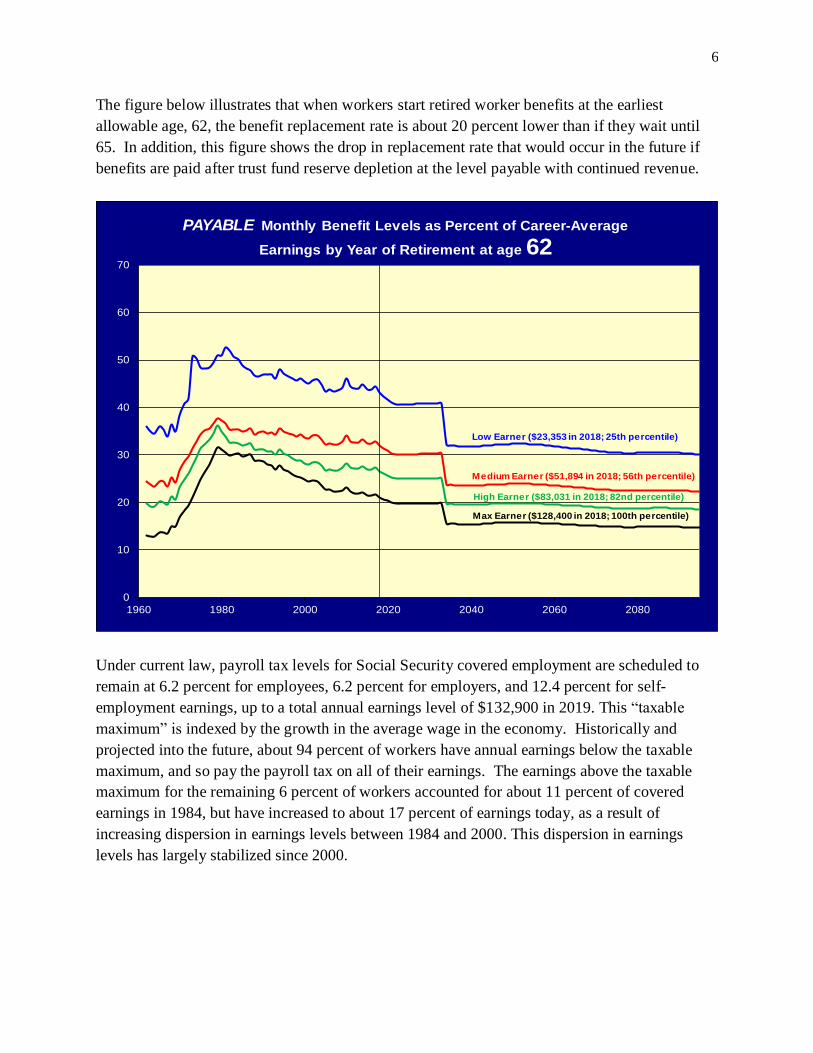
The figure below illustrates that when workers start retired worker benefits at the earliest
allowable age, 62, the benefit replacement rate is about 20 percent lower than if they wait until
65. In addition, this figure shows the drop in replacement rate that would occur in the future if
benefits are paid after trust fund reserve depletion at the level payable with continued revenue.
Under current law, payroll tax levels for Social Security covered employment are scheduled to
remain at 6.2 percent for employees, 6.2 percent for employers, and 12.4 percent for self-
employment earnings, up to a total annual earnings level of $132,900 in 2019. This “taxable
maximum” is indexed by the growth in the average wage in the economy. Historically and
projected into the future, about 94 percent of workers have annual earnings below the taxable
maximum, and so pay the payroll tax on all of their earnings. The earnings above the taxable
maximum for the remaining 6 percent of workers accounted for about 11 percent of covered
earnings in 1984, but have increased to about 17 percent of earnings today, as a result of
increasing dispersion in earnings levels between 1984 and 2000. This dispersion in earnings
levels has largely stabilized since 2000.
0
10
20
30
40
50
60
70
1960 1980 2000 2020 2040 2060 2080
PAYABLE Monthly Benefit Levels as Percent of Career-Average
Earnings by Year of Retirement at age 62
Low Earner ($23,353 in 2018; 25th percentile)
Medium Earner ($51,894 in 2018; 56th percentile)
High Earner ($83,031 in 2018; 82nd percentile)
Max Earner ($128,400 in 2018; 100th percentile)

7
Comprehensive Legislative Proposals to Enhance Social Security Actuarial Status
Many comprehensive legislative proposals have been introduced in Congress since the
enactment of the landmark 1983 Social Security Amendments. At the time of the enactment of
the 1983 Amendments, combined OASI and DI Trust Fund reserve depletion was projected to
occur just beyond the end of the long-range 75-year projection period. However, the projected
annual cost and income of the program showed that the reserves, after building up substantially
for many years, would thereafter decline steeply to the point of depletion. To avoid this
undesirable pattern, since the mid-1990’s, comprehensive legislative proposals that aim to avoid
reserve depletion over the next 75 years have generally been designed to meet the requirements
of “sustainable solvency.” These requirements are (1) avoiding reserve depletion throughout the
period, and (2) having the trust fund ratio (reserves as a percent of annual program cost) stable or
rising at the end of the 75-year projection period. When these requirements are met, Social
Security is expected to be adequately financed for the foreseeable future, under the intermediate
assumptions for the Trustees Report.
On the Office of the Chief Actuary’s website, we provide analyses of all comprehensive
proposals that we have provided estimates for since 1995, including many that have been
introduced as legislation in Congress; see https://www.ssa.gov/oact/solvency/index.html. These
proposals cover a wide range of approaches for modifying the revenue and benefits specified in
the law. In recent years, our proposal analyses have included tables illustrating the effects of
0.8
0.82
0.84
0.86
0.88
0.9
1984 1987 1990 1993 1996 1999 2002 2005 2008 2011 2014 2017 2020 2023 2026
Taxable Ratio
intermediate
low-cost
high-cost
Historical Projected
Average Annual Rate of Changein OASDI Taxable Ratio1983-2001 -0.34%2001-2015 -0.14%2015-2027 -0.02%

8
comprehensive proposals on the benefit and tax levels for workers with a range of career-average
earnings levels. These tables provide insight into the differential effects proposals would have
for beneficiaries and workers in future years, as the provisions of the proposal are implemented.
Estimates of the financial effects of most of the individual provisions included in these
comprehensive proposals can be found at
https://www.ssa.gov/oact/solvency/provisions/index.html. These estimates are updated based on
the baseline projections and assumptions of each annual Trustees Report.
An Example of a Comprehensive Legislative Proposal
The Social Security 2100 Act, introduced by Chairman Larson in the House on January 19 of
this year (and by Senators Blumenthal and Van Hollen in the Senate on the same day) provides a
recently introduced example of a comprehensive legislative proposal. The Social Security 2100
Act would enhance Social Security by: (1) meeting the requirements of sustainable solvency; (2)
fully financing the benefits scheduled in current law; and (3) providing selected increases in
benefits, which are also financed under the legislation. Our description of the provisions of this
Bill and our estimates of the effects on the actuarial status of the trust funds, benefit levels, tax
levels, and budget measures are available at
https://www.ssa.gov/oact/solvency/LarsonBlumenthalVanHollen_20190130.pdf.
Under current law, scheduled financing falls short of the cost of scheduled OASDI benefits by
about 2.84 percent of taxable payroll over the next 75 years, which amounts to about 1 percent of
GDP over the period. The increases in scheduled revenue included in the Social Security 2100
Act would:
Provide the extra 1 percent of GDP needed to fully finance currently scheduled benefits;
Generate an additional 0.3 percent of GDP over the next 75 years, which would finance
increases in currently scheduled benefits (benefit levels in the Bill are about 4.6 percent
above the levels scheduled in current law); and
Generate a further 0.1 percent of GDP over the next 75 years, leading to a significant and
rising level of trust fund reserves at the end of the period (250 percent of annual program
cost at the end of 2092), providing some extra measure of certainty that Social Security
would be adequately financed over the 75-year projection period and beyond.
At the end of the 75-year projection period, annual income and annual cost for the program
would both be about 6.4 percent of GDP, whereas under current law, cost is projected to be 6.1
percent of GDP and income is projected to be only 4.6 percent of GDP.
9
Section 204 of the Bill would combine the OASI and DI Trust Funds into a single fund starting
in 2020. Additional provisions would either increase scheduled benefits or increase scheduled
revenue.
Provisions that provide increased levels of scheduled benefits under the proposal include:
Section 101—increases the first “PIA factor” from 90 to 93, thus increasing benefits by
about 3 percent for the 10 percent of beneficiaries with the lowest PIA, with smaller
increases for all other beneficiaries.
Section 102—computes the annual Social Security COLA using the CPI-E (based on
purchase patterns by the elderly) rather than the CPI-W (based on purchase patterns for
urban workers). This would increase scheduled retiree benefits by about 2 percent at age
72, and by about 4 percent at age 82.
Section 103—updates the special minimum benefit provision (which under current law,
provides virtually no additional benefit). The updated special minimum provision would
assure a minimum PIA at 125 percent of the poverty level for long-career workers
becoming eligible in 2020, with that minimum increased by the average wage growth for
individuals becoming eligible after 2020, so the effectiveness of the minimum provision
would persist into the future.
Section 104—increases the threshold at which Social Security benefits become subject to
income tax, but still allocates as much revenue to the Medicare HI Trust Fund as if this
change had not been made.
Section 202—provides a 2 percent PIA factor for earnings subject to the increase in the
payroll tax base above the current-law maximum (see section 201).
Provisions in the Bill that provide additional revenue include:
Section 201—applies the current payroll tax to earnings in excess of $400,000, starting in
2020. This threshold would not be indexed and would eventually meet the current-law
maximum amount, so that all covered earnings would be subject to the payroll tax.
Section 203—increases the combined Social Security payroll tax rate by 0.1 percentage
point each year from 12.4 percent for 2019, reaching 14.8 percent for 2043 and later.
The Social Security 2100 Act is one of many Bills introduced in the House and the Senate that
would modify benefit and income provisions for Social Security, and one of several that would
meet the requirements for sustainable solvency.

10
Conclusion
Annual actuarial valuations of the OASI and DI Trust Funds show that the program faces
financial shortfalls in the future under the current law provisions. Social Security’s financing has
not yet been adequately adjusted to accommodate the changing age distribution of our
population, which has been well understood and anticipated for many years. The shift to a
higher but stable level of cost as a percent of GDP, as a result of the aging population, must be
addressed in the next 10 to 15 years, before either trust fund reaches reserve depletion.
All of us in the Office of the Chief Actuary look forward to continuing to work with the
members of this subcommittee, and all other members of the House and the Senate, in
developing comprehensive legislation to maintain Social Security solvency for the foreseeable
future.
Thank you again for the opportunity to talk to you today. I look forward to answering any
questions you may have.

SOCIAL SECURITY
Office of the Chief Actuary
May 7, 2019
The Honorable John Larson
Chairman, Subcommittee on Social Security
Committee on Ways and Means
House of Representatives
Washington, DC 20515
Dear Mr. Larson:
Thank you again for the opportunity to testify before the Committee on Ways and Means,
Subcommittee on Social Security, at the April 10, 2019 hearing on “Comprehensive Legislative
Proposals to Enhance Social Security.” It is always a pleasure working with you and everyone
associated with the Subcommittee. I hope the information that I provided at the hearing will be
helpful. Below I have restated the two questions for the record that you sent to me on April 26,
2019 and have provided answers.
A) In your analyses, how would the Social Security 2100 Act affect benefit levels for
current and future generations of retirees, especially Millennials?
First, enactment of the Social Security 2100 Act would make the Social Security Trust
Funds “sustainably solvent” by entirely eliminating the prospect of depletion of reserves
for Social Security Trust Funds for the foreseeable future under the intermediate
assumptions of the 2018 Trustees Report. Considering the OASI and DI benefits and
trust funds on a combined basis, the 2018 Trustees Report shows a projected 21-percent
shortfall of revenue needed to pay full benefits scheduled in current law at the time of
reserve depletion in 2034, and a 26-percent shortfall projected for 2092. If the Social
Security 2100 Act were signed into law, the reserves would not be projected to deplete,
so the level of benefits payable by Social Security in 2034 would be increased by more
than 26 percent, and this increase would rise to at least 35 percent by 2092.
However, the Bill also includes provisions that raise benefits above the level scheduled in
current law. Provisions to change the Primary Insurance Amount (PIA) formula would
provide an immediate increase for all beneficiaries in 2020 and later, including those who
have already been receiving benefits in prior years. Changing to use the Consumer Price
Index reflecting purchases by the elderly (CPI-E) would also be expected to provide
higher benefits for virtually all beneficiaries in 2020 and later. The modification of the
Page 2 – The Honorable John Larson
special minimum benefit formula would restore its ability to enhance benefit levels for
long-career low earners.
In my letter to you and Senators Blumenthal and Van Hollen of January 30, 2019, we
provided tables showing projected changes in benefit levels by future year and career
earnings level for selected retired workers. By 2050, the final column in table B1 shows
that workers retiring at age 65 would receive between 28 percent and 82 percent higher
benefits than would be payable under current law, with the largest increases for low
earners with 30-year careers. For example, a 30-year career earner, with average annual
earnings at a level of $13,000 in 2018 wage-indexed dollars, would expect a benefit 82
percent above the level payable under current law. In addition, many workers with
earnings above the current-law taxable maximum would have increases in benefits based
on earnings becoming subject to payroll tax under the Bill. The percentage increases in
benefits over what would be payable under current law would be even higher for later
years.
B) During the hearing there was discussion of the increase in payroll tax for a
Millennial earning $50,000, and the effect that might have on their ability to save for
retirement. Can you provide a fuller sense of both the additional payroll tax that
would be paid by such individuals and the additional retirement benefits they would
expect to receive if the Social Security 2100 Act were enacted?
It was stated in the hearing that a millennial would eventually pay an additional $600 per
year on annual earnings of $50,000. However, there was no discussion of the increase a
millennial would receive in their subsequent Social Security benefits in retirement under
the Social Security 2100 Act. In fact, the increase in future benefits for a millennial at
this earnings level would be far greater than the additional payroll tax contributions made
by almost any measure.
Pew Research Center defines millennials as individuals born between 1981 and 1996. In
2020, these individuals will be at ages 24 through 39. So, as an example, consider a
millennial worker born in 1985 who will turn age 35 in 2020, work until age 64, and then
start Social Security retired worker benefits in 2050 at age 65. Also assume this
millennial has earnings (expressed in terms of today’s dollars, on an average-wage-
indexed basis) of about $50,000 per year through age 64. Assuming enactment of the
Social Security 2100 Act, this worker will pay an additional $25 in payroll tax during the
year 2020, an additional $50 in 2021, an additional $75 in 2022, and so on, reaching an
additional $600 in each year 2043 through 2049. The additional payroll taxes paid by the
worker would be matched by an equal additional amount paid by his or her employer in
these years. Thus, the average additional amount paid by this worker in the 30 years
2020 through 2049 would be about $370 per year in today’s dollars, with an equal
additional amount paid by the employer, for a total additional payroll tax contribution
averaging $740 per year over 30 years.
Consistent with values shown in table B1 of the January 30, 2019 letter, this worker
would have a current-law “scheduled” monthly benefit level of about $1,450 in 2050, or

Page 3 – The Honorable John Larson
about $17,400 per year. However, under current law, the amount that would be actually
payable would be closer to $13,760 for the year, because scheduled benefits would be cut
by about 21 percent in 2050 after reserves are depleted. Assuming enactment of the Bill,
the benefit payable at age 65 would be increased to $17,750. This would be an increase
in the payable benefit for the worker of about 30 percent, or about $3,990 per year of
retirement in today’s dollars. Taking this example a step further, the 35-year old
millennial in 2020 has about a 90 percent probability of surviving to age 65, and if he or
she does survive, would be expected to live roughly 22 additional years thereafter.
Considering discounting for interest, the expected additional benefits in retirement for the
millennial earning $50,000 would be over 2.5 times as much as the additional payroll
taxes paid by the employee and employer. In addition, enactment of the Bill would also
support increased payable benefits should the worker die or become disabled between
2034 and 2050.
It is true, as stated in the hearing, that the proposed increase in payroll tax would likely
reduce to a degree the personal savings that millennials would put aside, but we should
not forget the additional payable benefits that would also come from enacting the Bill.
I hope this further information will be helpful. If you have any additional questions or need
assistance in any way, please let me know.
Sincerely,
Stephen C. Goss, ASA, MAAA
Chief Actuary
cc: Kathryn Olson