Embed Size (px)
Citation preview
Combination Therapy for
Type 2 DiabetesSpringfield, IL, Nov 15, 2003
Paul Davidson, MD, FACE
Atlanta Diabetes Associates
Atlanta, Georgia
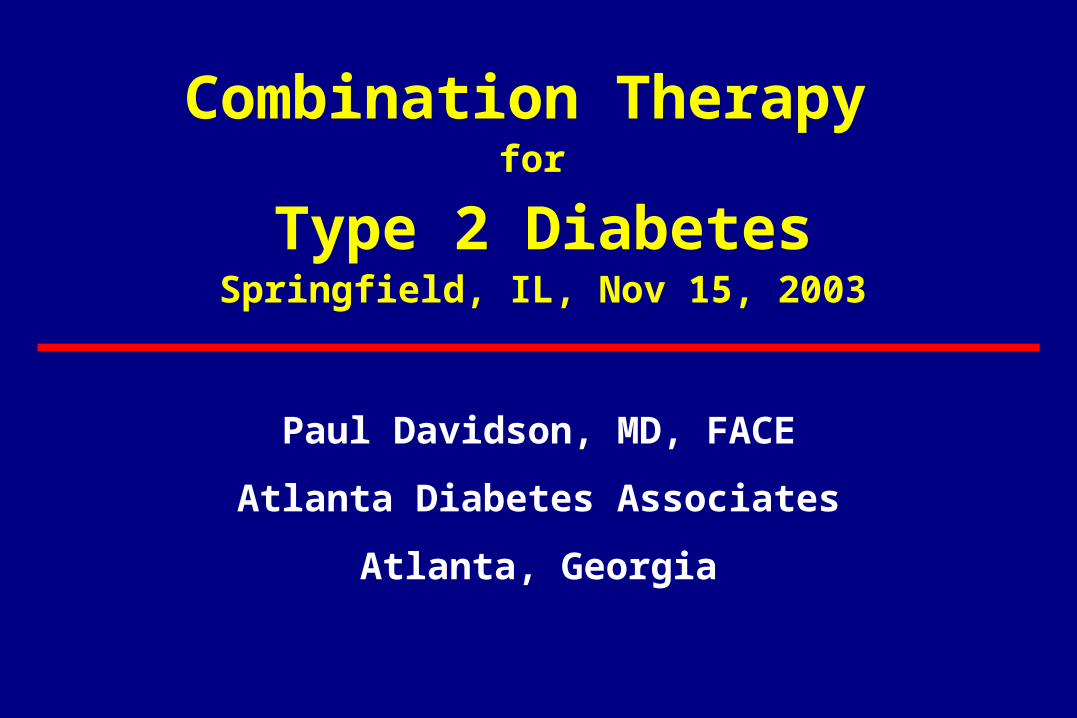
ACE / AACE Targets for Glycemic Control
HbA1c < 6.5 %
Fasting/preprandial glucose < 110 mg/dL
Postprandial glucose < 140 mg/dL
ACE / AACE Consensus Conference, Washington DC August 2001
Goals of Intensive Diabetes Management
A Normal HbA1c Is Not Everything.
It Is the Only Thing!
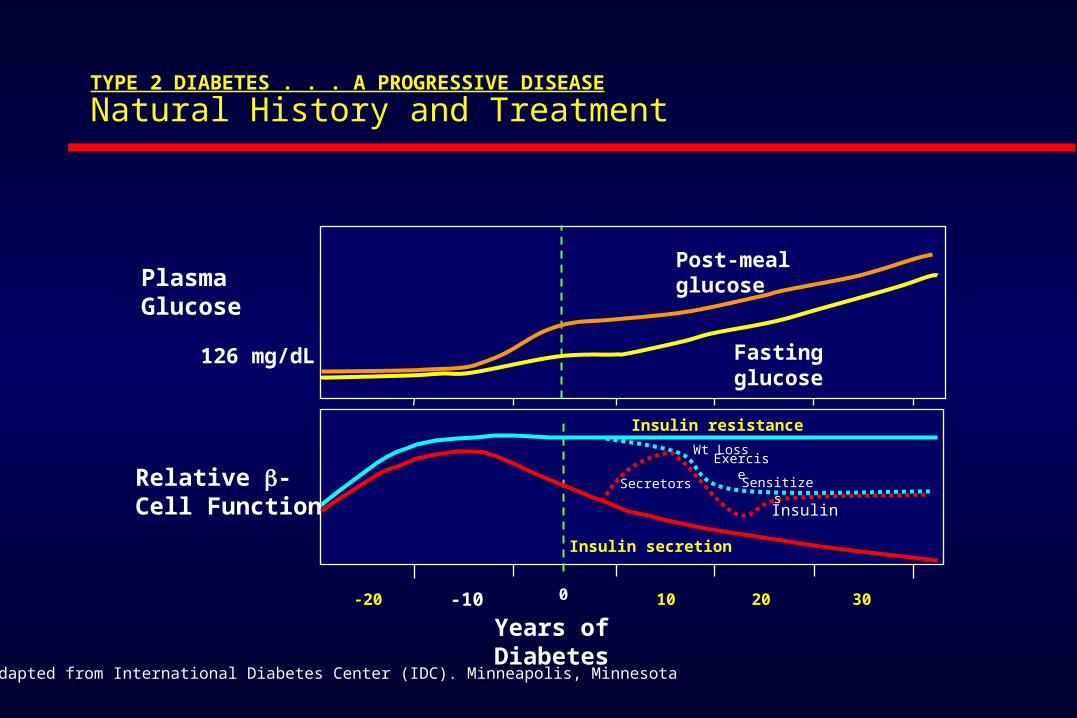
TYPE 2 DIABETES . . . A PROGRESSIVE DISEASE
Natural History and Treatment
0
Years of Diabetes
Relative -Cell Function
PlasmaGlucose
Insulin resistance
Insulin secretion
126 mg/dL Fasting glucose
Post-meal glucose
Wt Loss
Sensitizes
Adapted from International Diabetes Center (IDC). Minneapolis, Minnesota
Secretors
Insulin
Exercise
-10-20 10 20 30
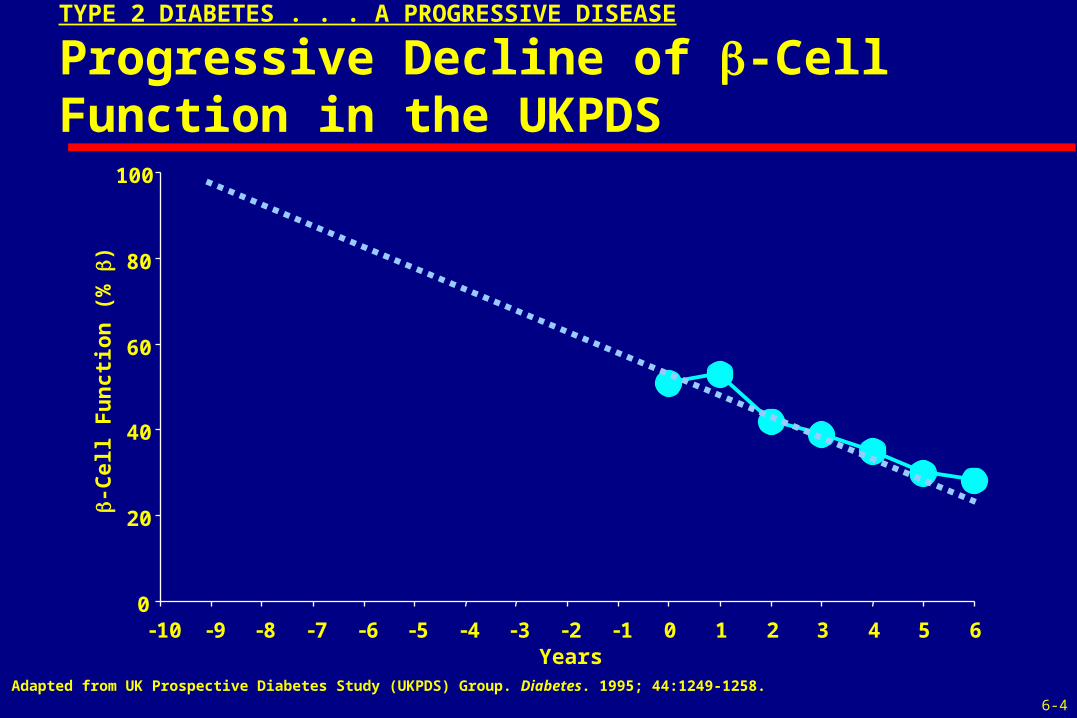
TYPE 2 DIABETES . . . A PROGRESSIVE DISEASE
Progressive Decline of -Cell Function in the UKPDS
0
20
40
60
80
100
10 9 8 7 6 5 4 3 2 1 0 1 2 3 4 5 6Years
-C
ell F
un
ctio
n (
%
)
Adapted from UK Prospective Diabetes Study (UKPDS) Group. Diabetes. 1995; 44:1249-1258.6-4
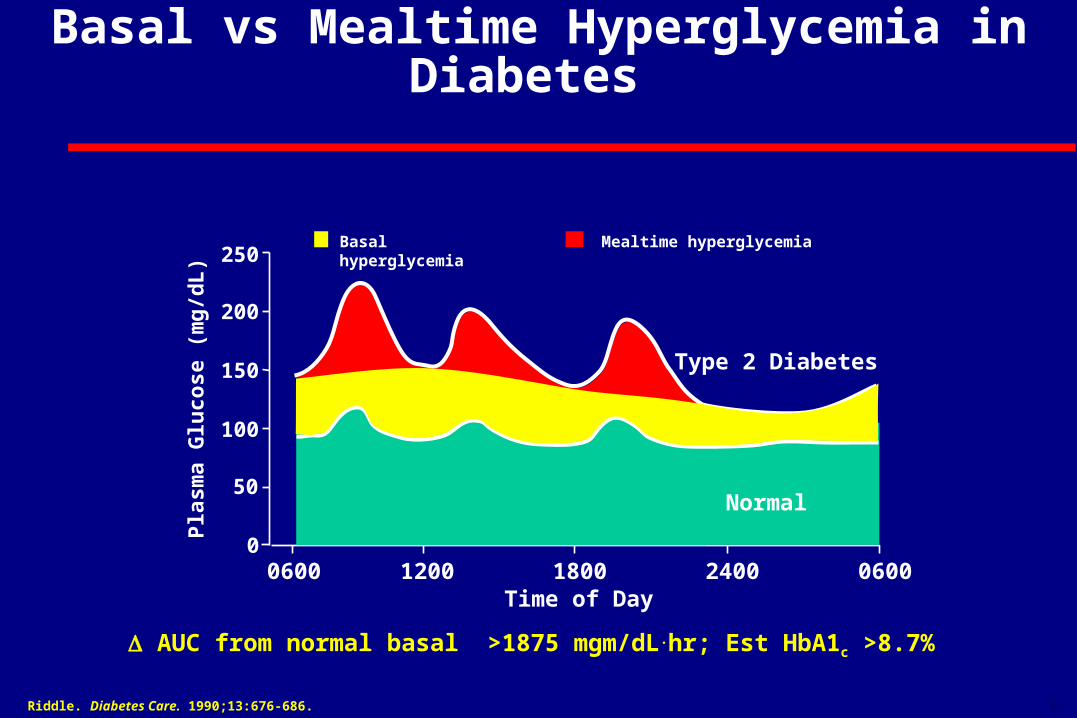
Basal vs Mealtime Hyperglycemia in Diabetes
Riddle. Diabetes Care. 1990;13:676-686.
Pla
sma
Glu
cose
(m
g/d
L)
200
100
00600 1200
Time of Day1800 2400
Type 2 Diabetes
0600
150
250
50
Basal hyperglycemia Mealtime hyperglycemia
6-18
Normal
AUC from normal basal >1875 mgm/dL.hr; Est HbA1c >8.7%
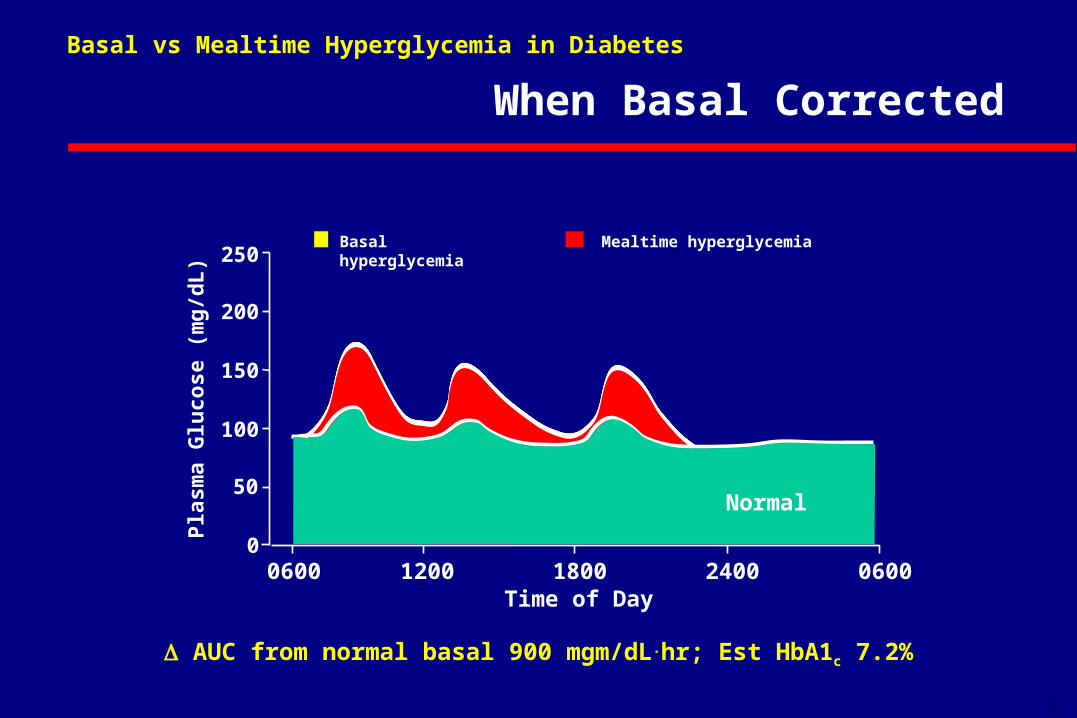
When Basal Corrected
Pla
sma
Glu
cose
(m
g/d
L)
200
100
00600 1200
Time of Day1800 2400 0600
150
250
50
Basal hyperglycemia Mealtime hyperglycemia
6-18
Normal
Basal vs Mealtime Hyperglycemia in Diabetes
AUC from normal basal 900 mgm/dL.hr; Est HbA1c 7.2%
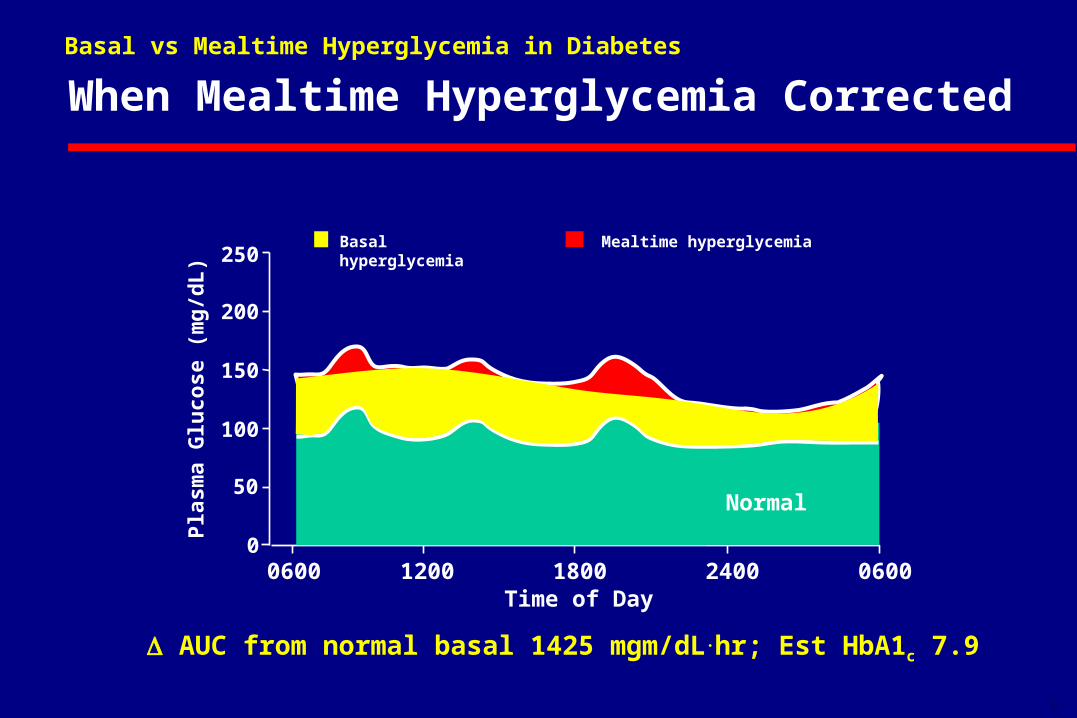
When Mealtime Hyperglycemia Corrected
Pla
sma
Glu
cose
(m
g/d
L)
200
100
00600 1200
Time of Day1800 2400 0600
150
250
50
Basal hyperglycemia Mealtime hyperglycemia
6-18
Normal
Basal vs Mealtime Hyperglycemia in Diabetes
AUC from normal basal 1425 mgm/dL.hr; Est HbA1c 7.9
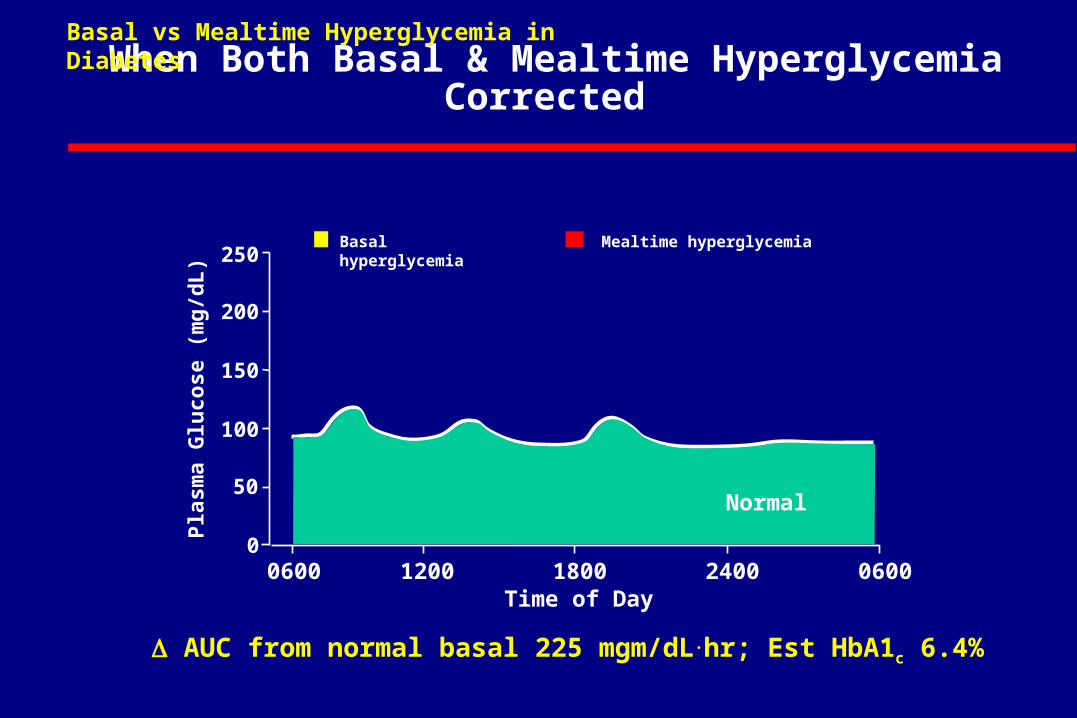
When Both Basal & Mealtime Hyperglycemia Corrected
Pla
sma
Glu
cose
(m
g/d
L)
200
100
00600 1200
Time of Day1800 2400 0600
150
250
50
Basal hyperglycemia Mealtime hyperglycemia
6-18
Normal
Basal vs Mealtime Hyperglycemia in Diabetes
AUC from normal basal 225 mgm/dL.hr; Est HbA1c 6.4%
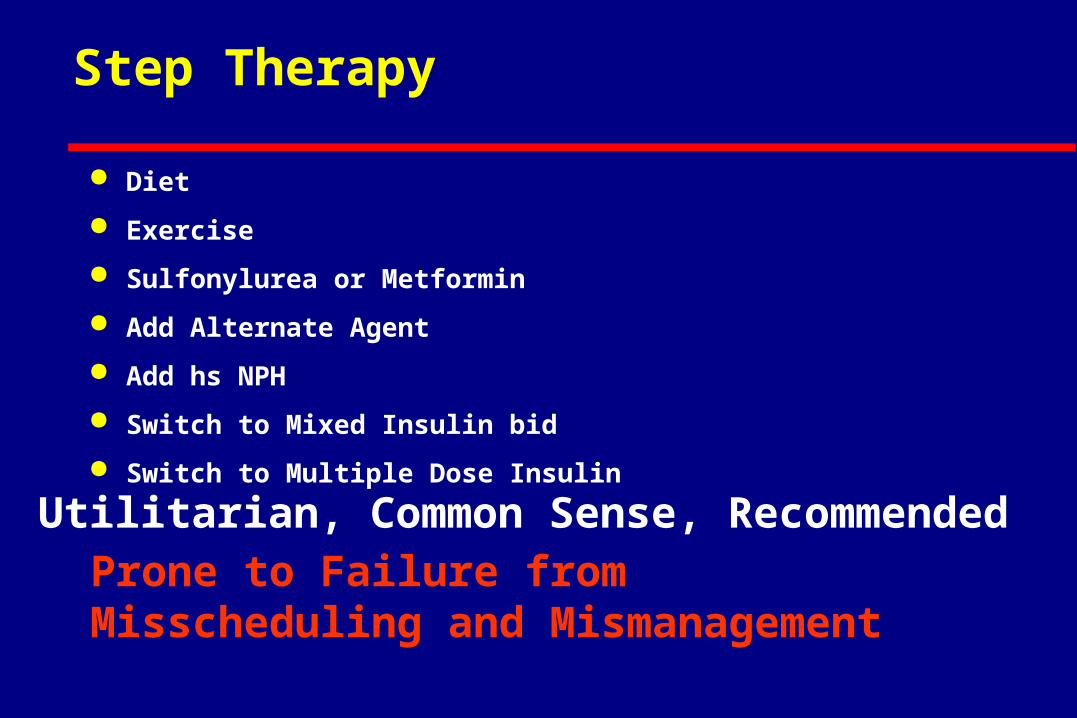
Step Therapy
Diet
Exercise
Sulfonylurea or Metformin
Add Alternate Agent
Add hs NPH
Switch to Mixed Insulin bid
Switch to Multiple Dose Insulin
Utilitarian, Common Sense, RecommendedProne to Failure fromMisscheduling and Mismanagement
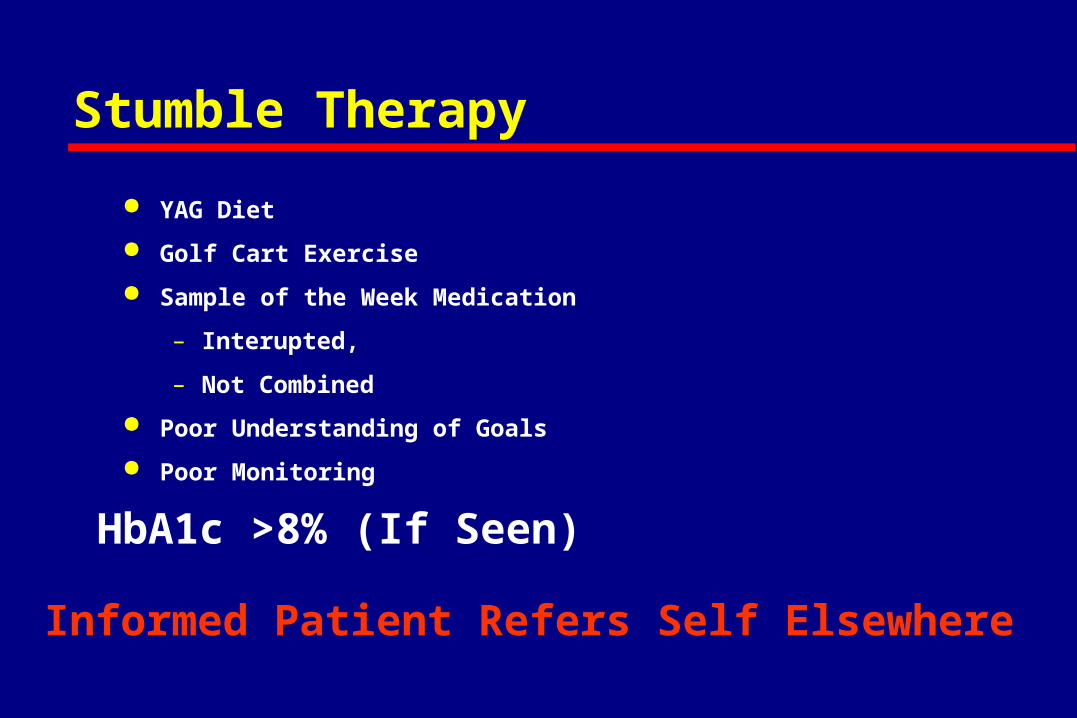
Stumble Therapy
YAG Diet
Golf Cart Exercise
Sample of the Week Medication
– Interupted,
– Not Combined
Poor Understanding of Goals
Poor Monitoring
HbA1c >8% (If Seen)
Informed Patient Refers Self Elsewhere
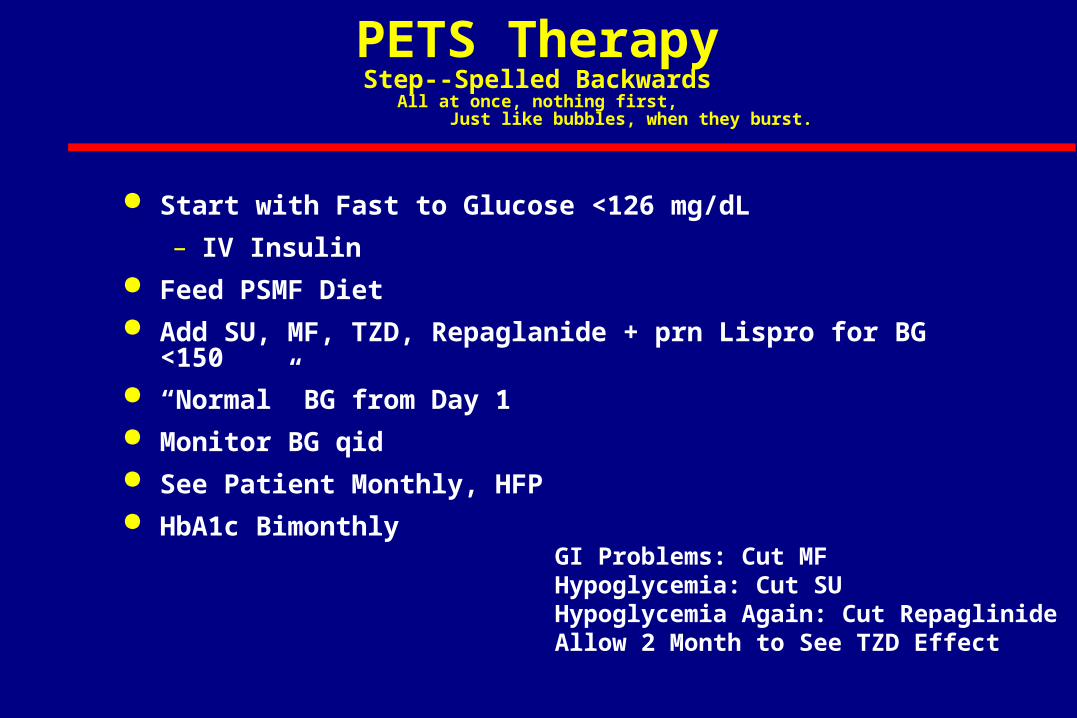
PETS TherapyStep--Spelled Backwards
All at once, nothing first, Just like bubbles, when they burst.
Start with Fast to Glucose <126 mg/dL
– IV Insulin Feed PSMF Diet Add SU, MF, TZD, Repaglanide + prn Lispro for BG <150 “Normal” BG from Day 1 Monitor BG qid See Patient Monthly, HFP HbA1c Bimonthly
GI Problems: Cut MFHypoglycemia: Cut SUHypoglycemia Again: Cut RepaglinideAllow 2 Month to See TZD Effect
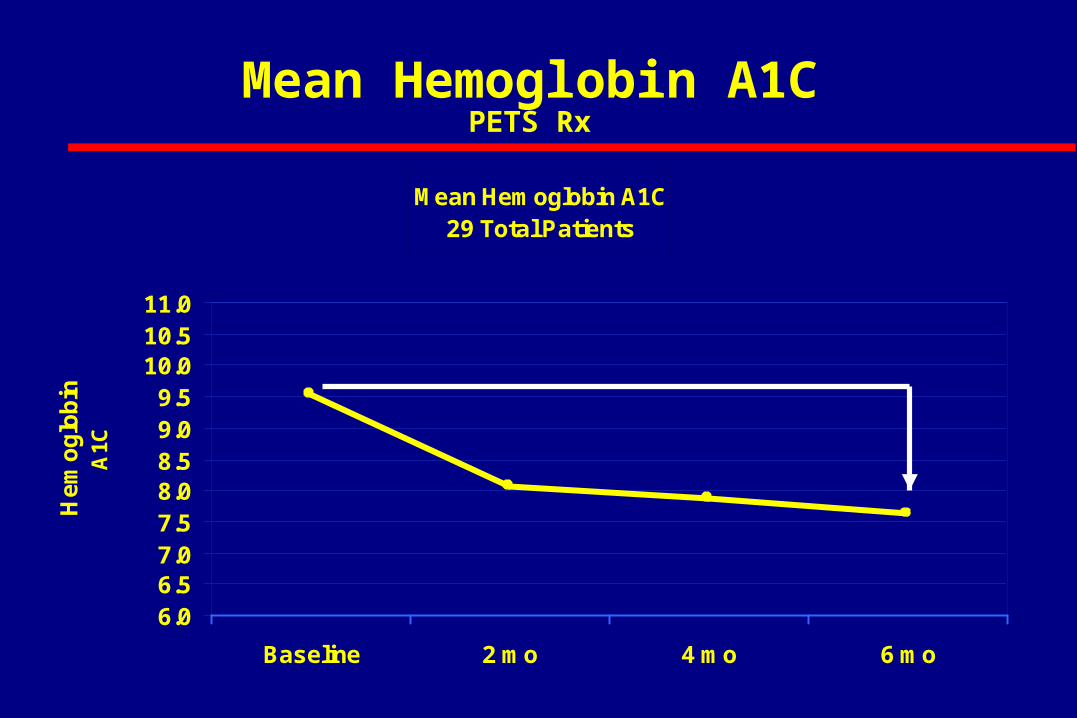
Mean Hemoglobin A1C29 Total Patients
6.06.57.07.58.08.59.09.5
10.010.511.0
Baseline 2 mo 4 mo 6 mo
He
mo
glo
bin
A
1C -2.0
Mean Hemoglobin A1CPETS Rx
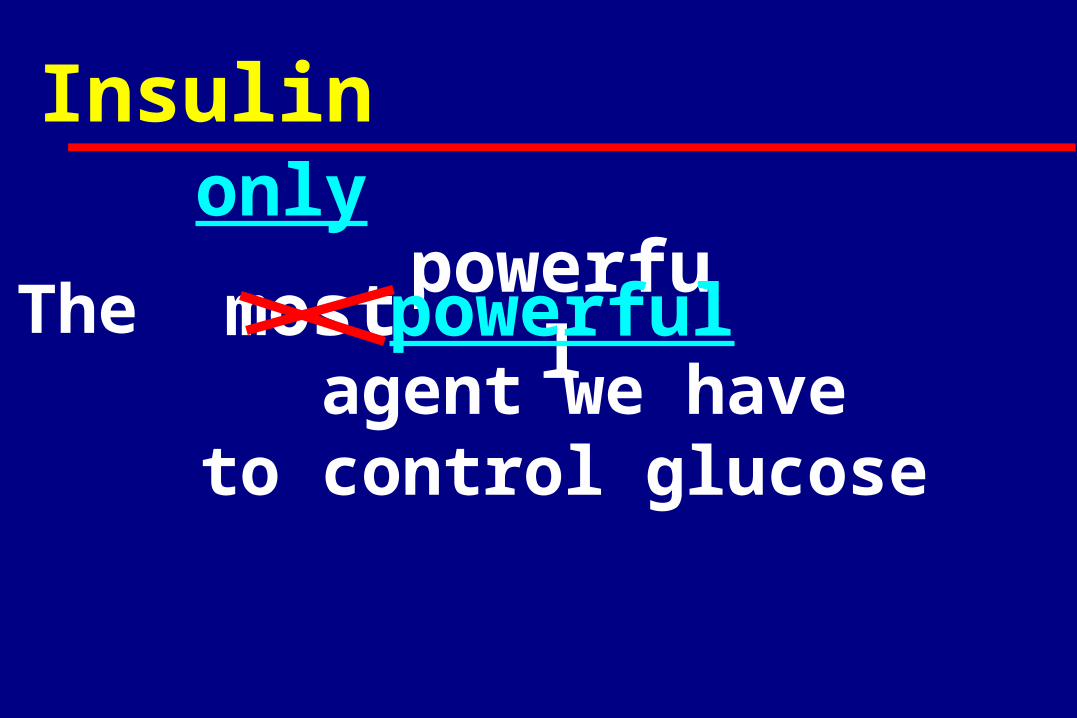
Insulin
The agent we have
to control glucose
only
most powerfulpowerful
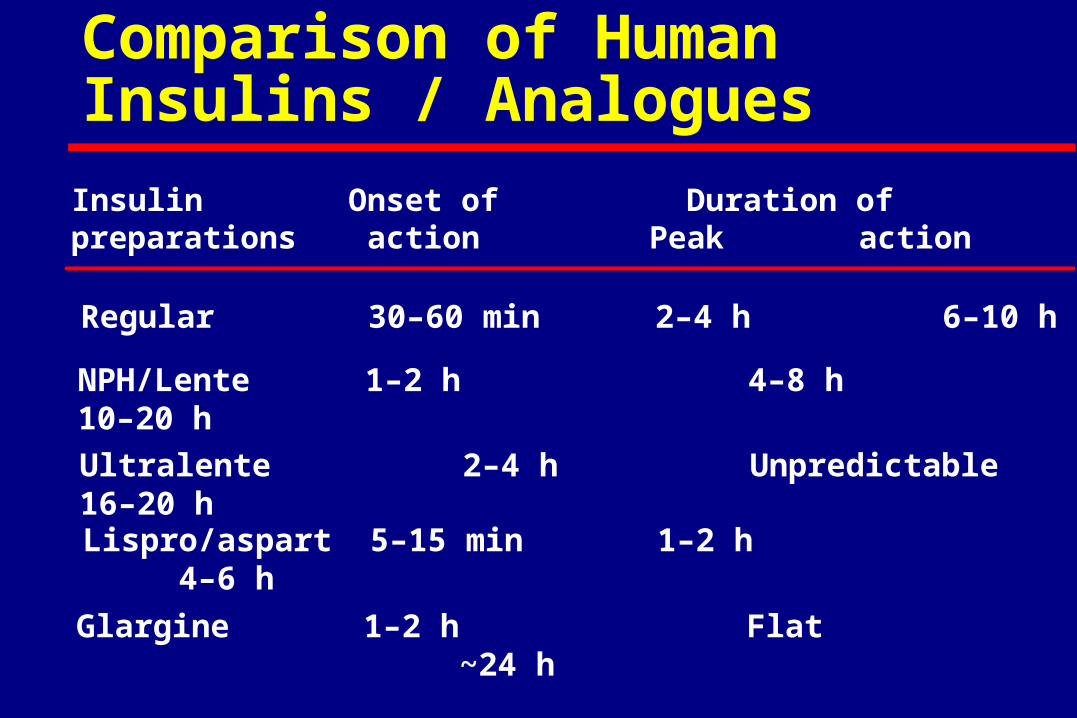
Comparison of Human Insulins / Analogues
Insulin Onset of Duration ofpreparations action Peak action
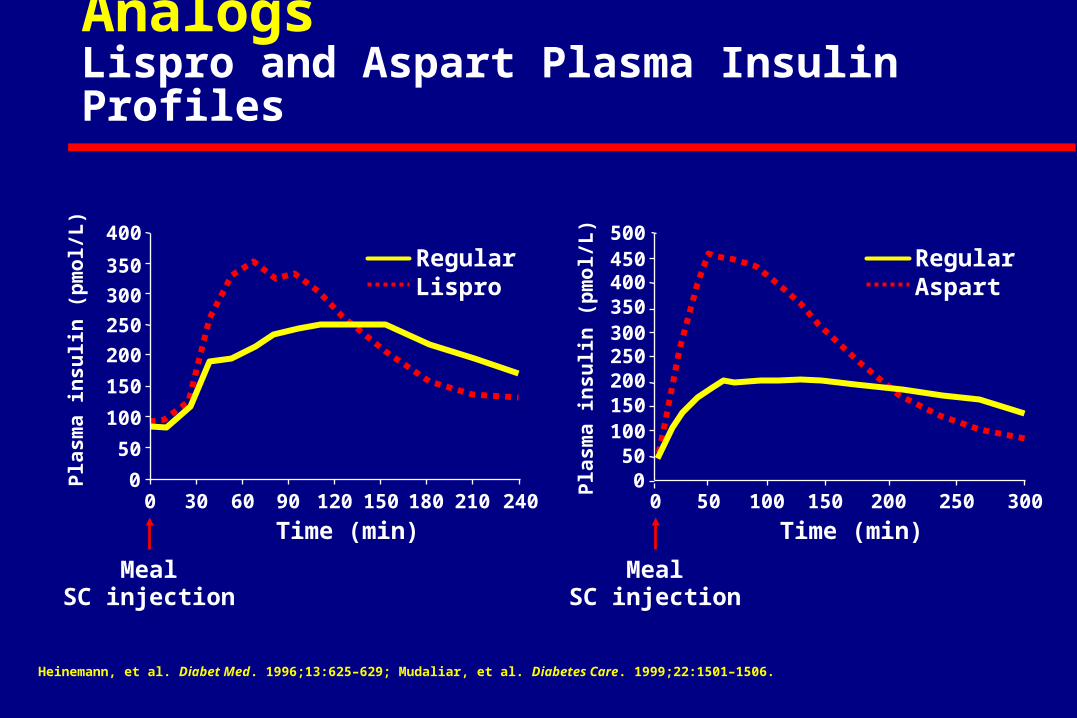
Regular 30–60 min 2–4 h 6–10 h
Lispro/aspart 5–15 min 1–2 h 4–6 h
NPH/Lente 1–2 h 4–8 h 10–20 h
Ultralente 2–4 h Unpredictable 16–20 h
Glargine 1–2 h Flat ~24 h
400
350
300
250
200
150
100
MealSC injection
50
00 30 60
Time (min)90 120 180 210150 240
Regular Lispro
500450400350300250
150
50
200
100
00 50 100
Time (min)150 200 300250
Pla
sm
a i
ns
uli
n (
pm
ol/
L)
Pla
sm
a i
ns
uli
n (
pm
ol/
L)
MealSC injection
Heinemann, et al. Diabet Med. 1996;13:625–629; Mudaliar, et al. Diabetes Care. 1999;22:1501–1506.
Short-Acting Insulin AnalogsLispro and Aspart Plasma Insulin Profiles
Regular Aspart
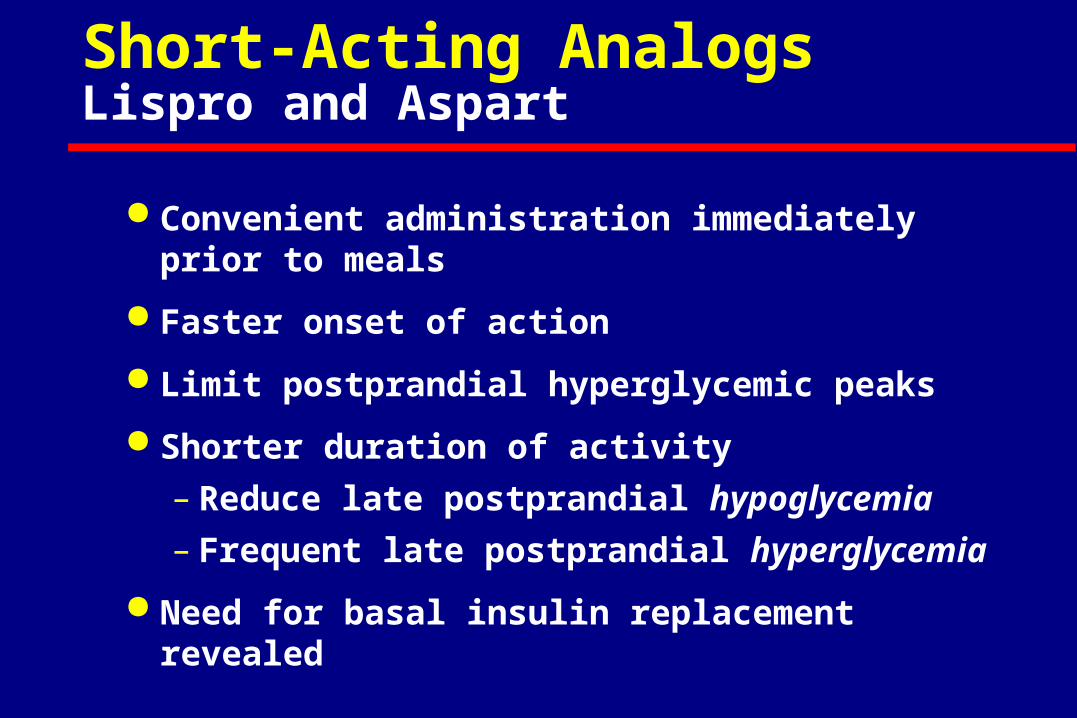
Short-Acting Analogs Lispro and Aspart
Convenient administration immediately prior to meals
Faster onset of action
Limit postprandial hyperglycemic peaks
Shorter duration of activity
– Reduce late postprandial hypoglycemia
– Frequent late postprandial hyperglycemia
Need for basal insulin replacement revealed
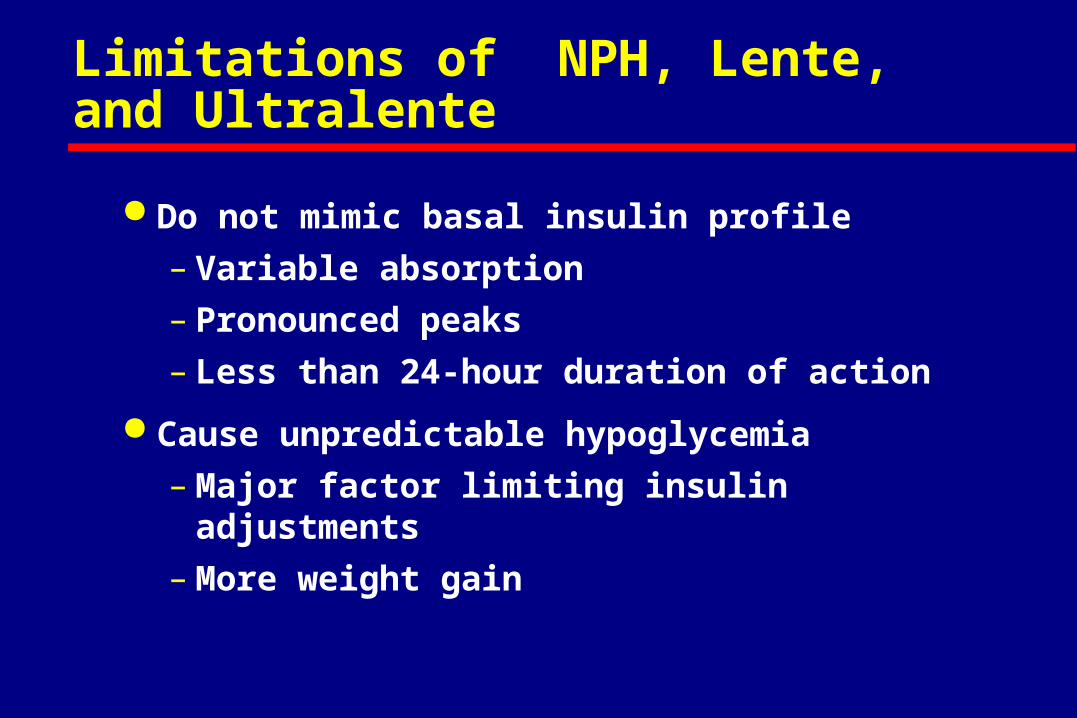
Limitations of NPH, Lente,and Ultralente
Do not mimic basal insulin profile
– Variable absorption
– Pronounced peaks
– Less than 24-hour duration of action
Cause unpredictable hypoglycemia
– Major factor limiting insulin adjustments
– More weight gain
1 5 10 15 20 25 30
1 5 10 15 20 Asp
Gly
ArgExtension
Substitution
Arg
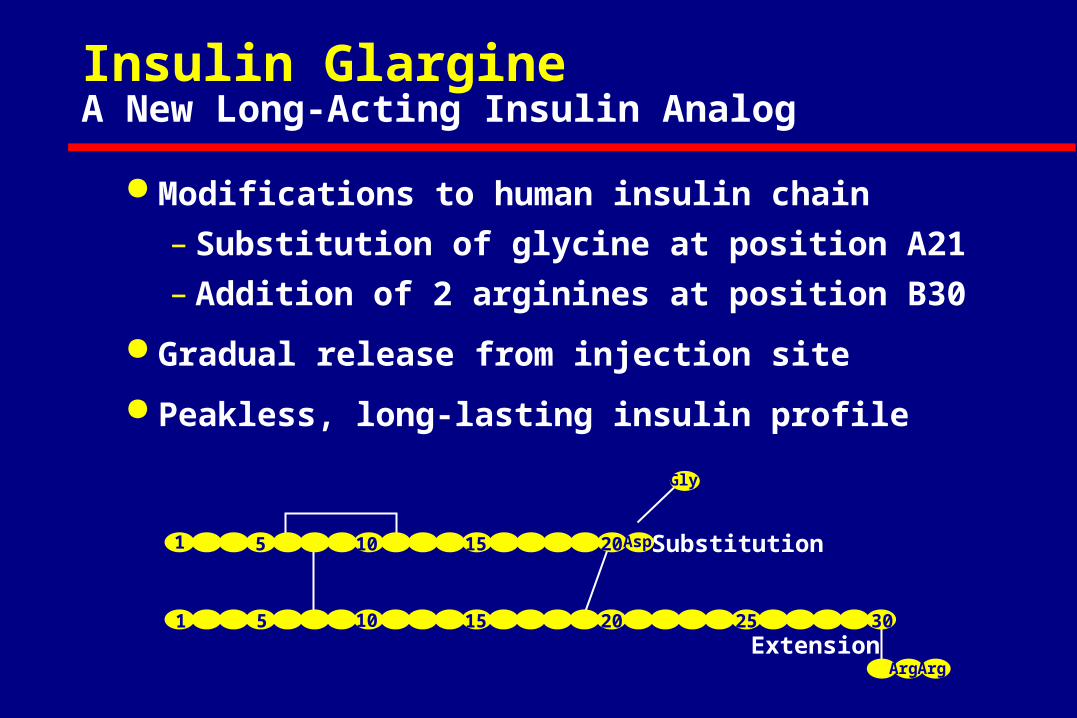
Insulin GlargineA New Long-Acting Insulin Analog
Modifications to human insulin chain
– Substitution of glycine at position A21
– Addition of 2 arginines at position B30
Gradual release from injection site
Peakless, long-lasting insulin profile
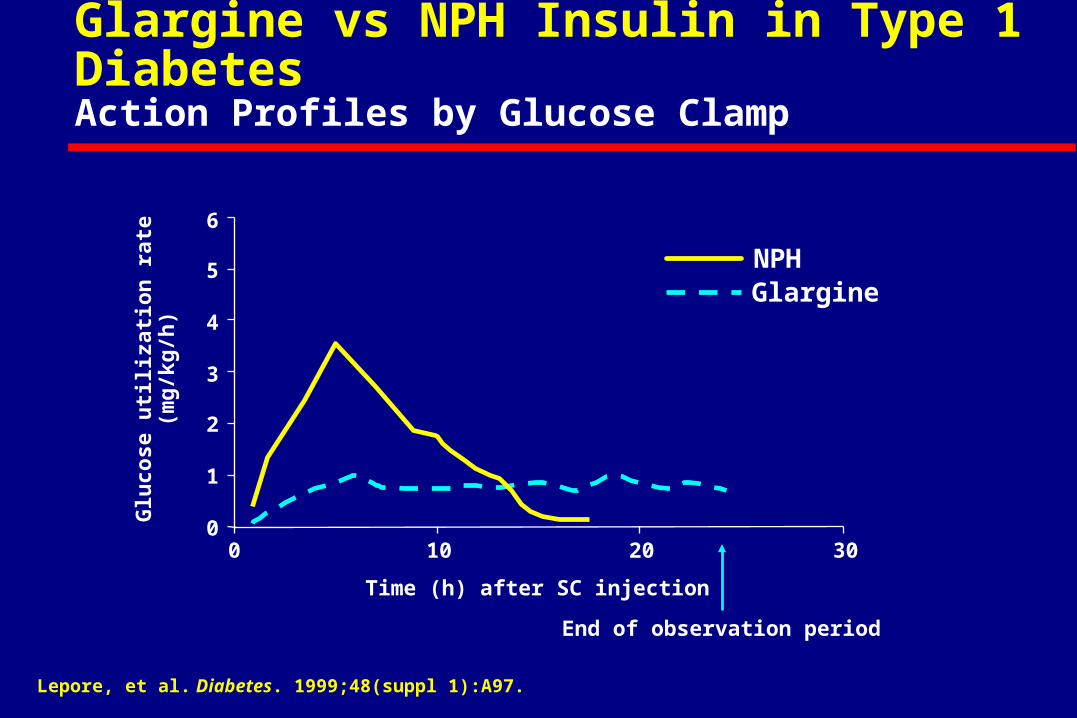
Lepore, et al. Diabetes. 1999;48(suppl 1):A97.
6
5
4
3
2
1
00 10
Time (h) after SC injection
End of observation period
20 30
GlargineNPH
Glu
cose
uti
lizat
ion
rat
e(m
g/k
g/h
)
Glargine vs NPH Insulin in Type 1 DiabetesAction Profiles by Glucose Clamp
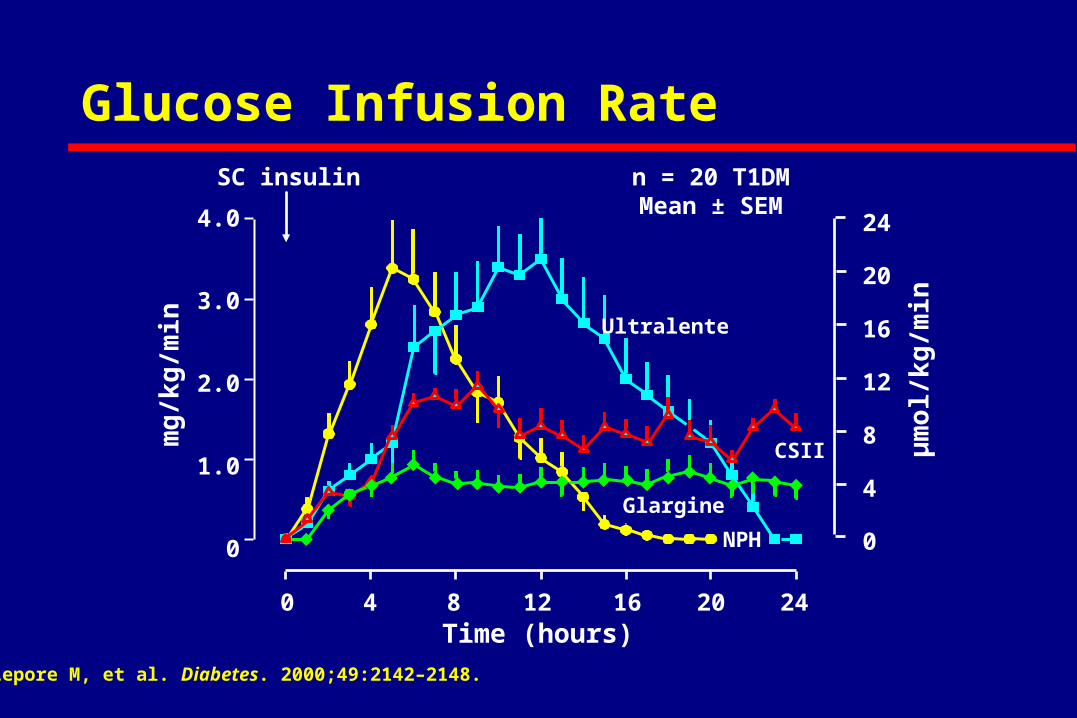
Glucose Infusion Raten = 20 T1DMMean ± SEM
SC insulin
4.0
3.0
2.0
1.0
0
24
20
16
12
8
4
0
0 4 8 12 16 20 24Time (hours)
mg
/kg
/min
µm
ol/k
g/m
in
Lepore M, et al. Diabetes. 2000;49:2142–2148.
NPH
Ultralente
Glargine
CSII
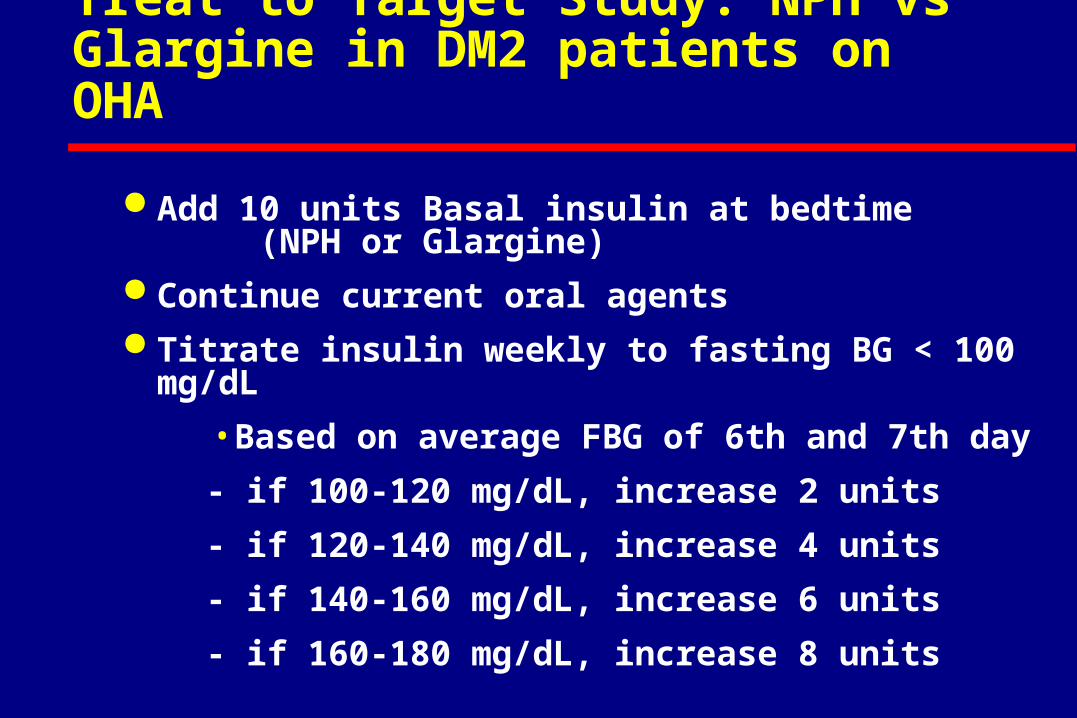
Treat to Target Study: NPH vs Glargine in DM2 patients on OHA
Add 10 units Basal insulin at bedtime (NPH or Glargine)
Continue current oral agents Titrate insulin weekly to fasting BG < 100 mg/dL
• Based on average FBG of 6th and 7th day
- if 100-120 mg/dL, increase 2 units
- if 120-140 mg/dL, increase 4 units
- if 140-160 mg/dL, increase 6 units
- if 160-180 mg/dL, increase 8 units
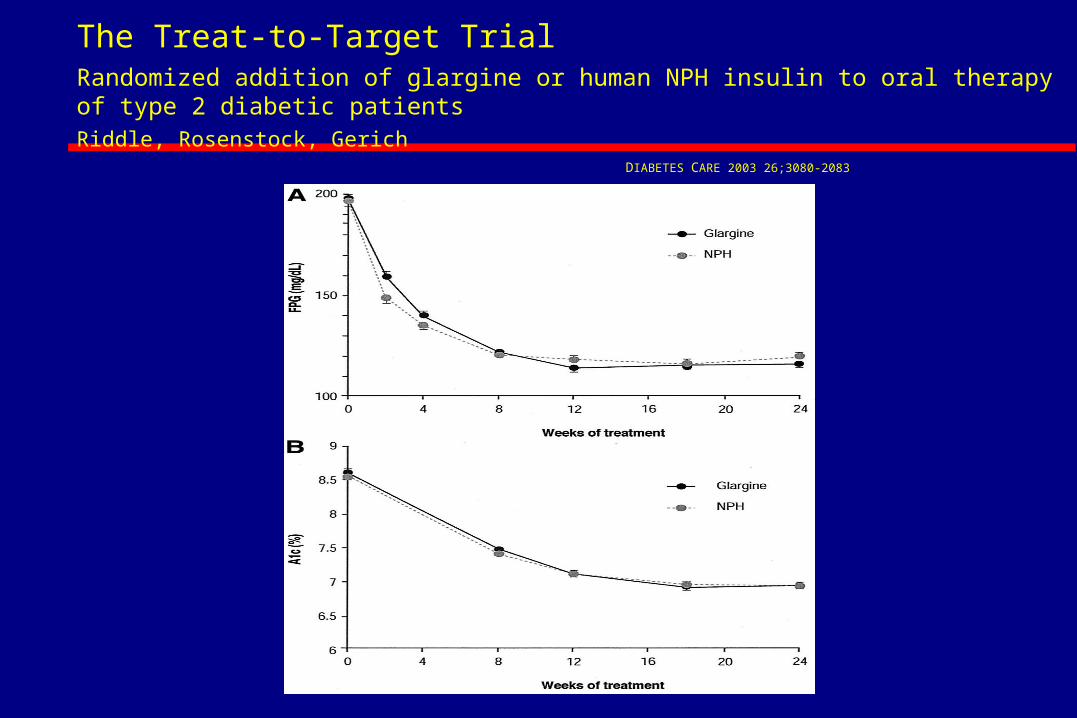
The Treat-to-Target TrialRandomized addition of glargine or human NPH insulin to oral therapy of type 2 diabetic patientsRiddle, Rosenstock, Gerich DIABETES CARE 2003 26;3080-2083
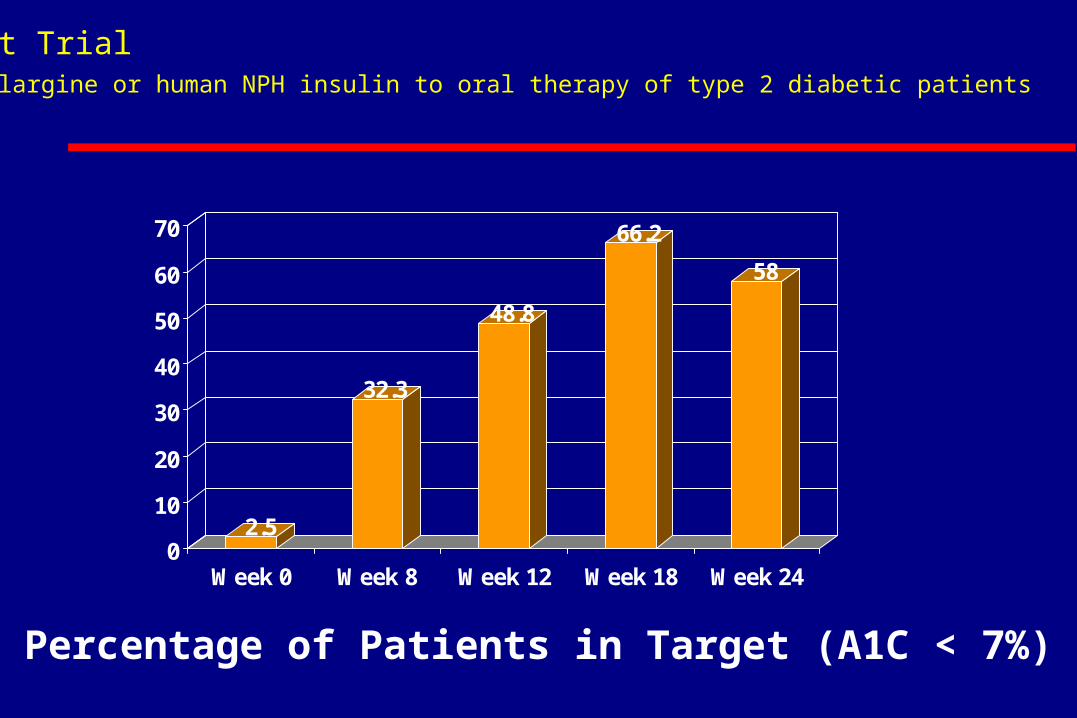
Percentage of Patients in Target (A1C < 7%)
2.5
32.3
48.8
66.2
58
0
10
20
30
40
50
60
70
Week 0 Week 8 Week 12 Week 18 Week 24
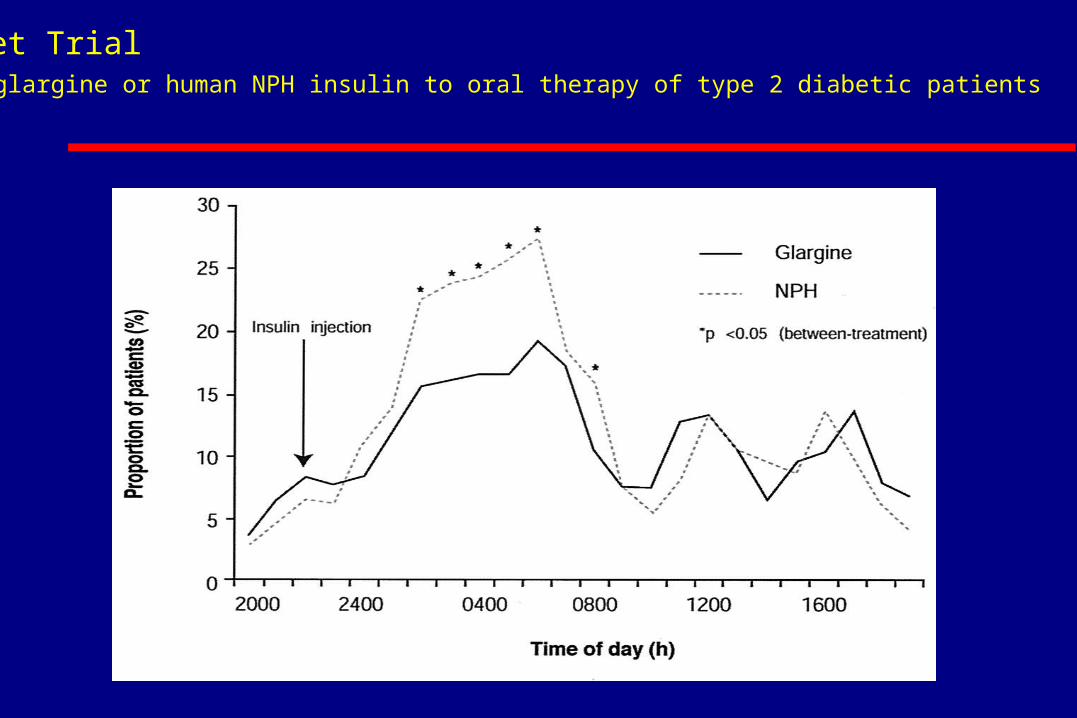
The Treat-to-Target TrialRandomized addition of glargine or human NPH insulin to oral therapy of type 2 diabetic patientsRiddle, Rosenstock, Gerich DIABETES CARE 2003 26;3080-2083
The Treat-to-Target TrialRandomized addition of glargine or human NPH insulin to oral therapy of type 2 diabetic patientsRiddle, Rosenstock, Gerich DIABETES CARE 2003 26;3080-2083
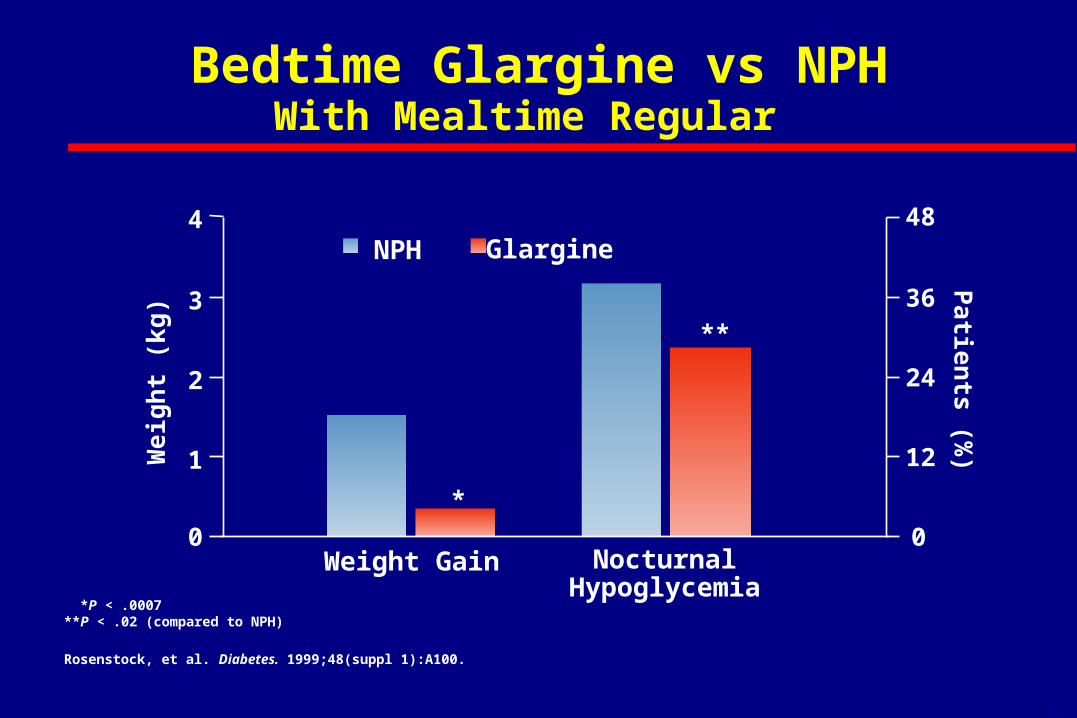
The Treat-to-Target Trial . Bedtime Glargine vs NPH
With Mealtime Regular
4
3
2
1
0
48
36
24
12
0Nocturnal
HypoglycemiaWeight Gain
*
**
Wei
gh
t (k
g)
NPH Glargine
Patien
ts (%)
*P < .0007**P < .02 (compared to NPH)
Rosenstock, et al. Diabetes. 1999;48(suppl 1):A100.
6-52
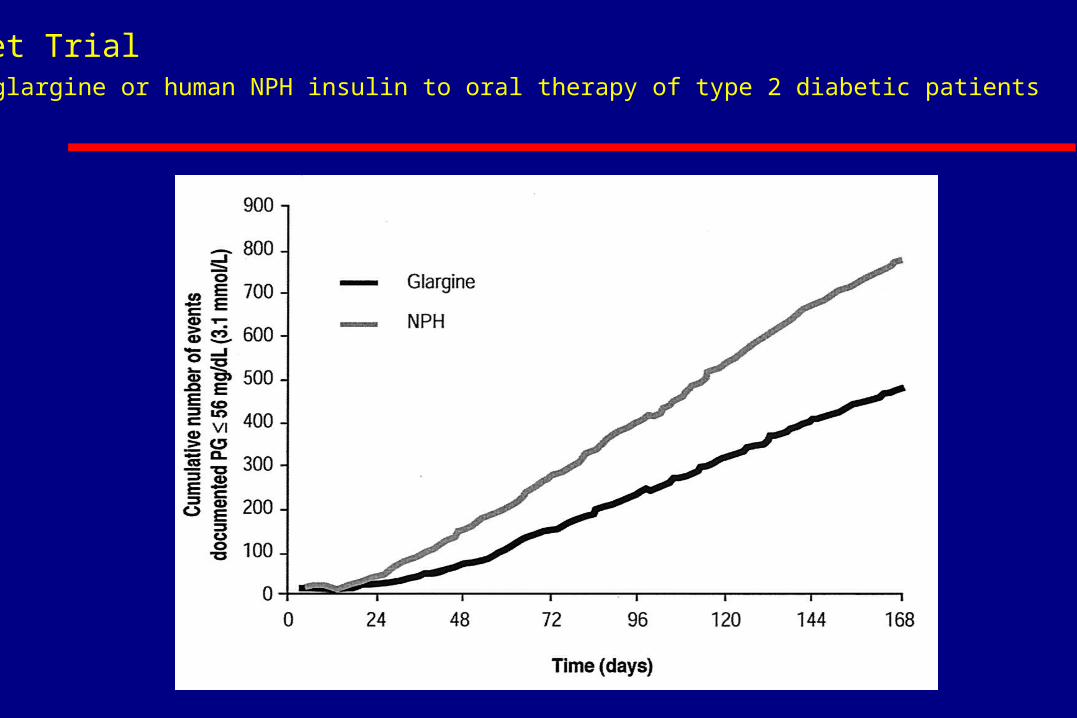
The Treat-to-Target TrialRandomized addition of glargine or human NPH insulin to oral therapy of type 2 diabetic patientsRiddle, Rosenstock, Gerich DIABETES CARE 2003 26;3080-2083
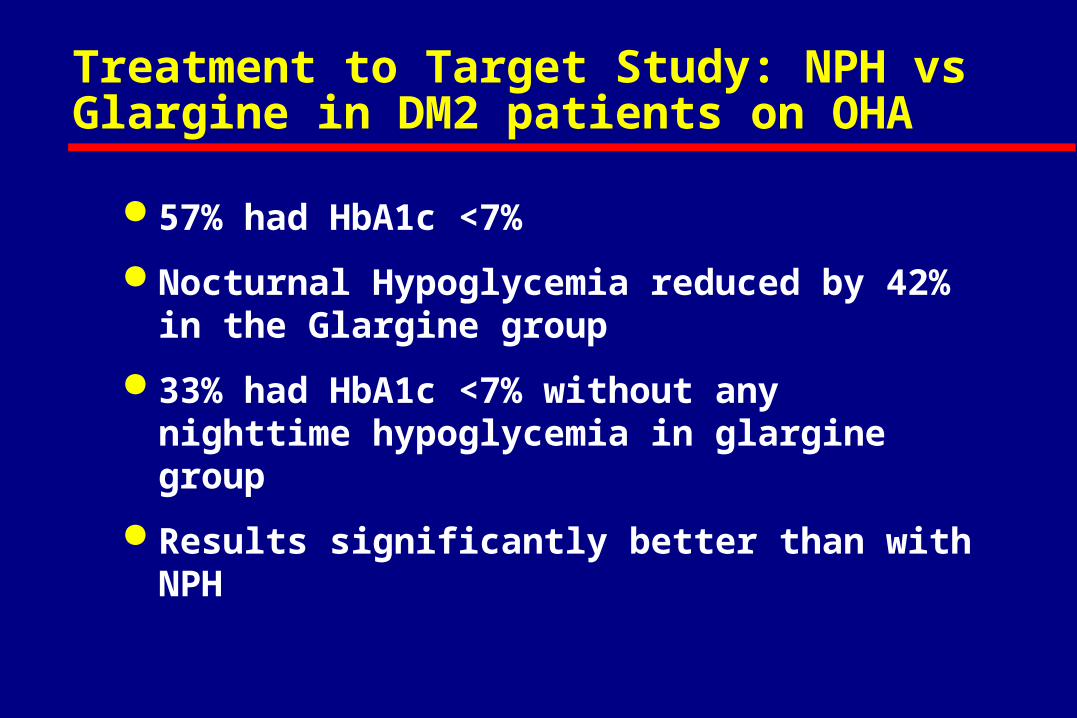
Treatment to Target Study: NPH vs Glargine in DM2 patients on OHA
57% had HbA1c <7%
Nocturnal Hypoglycemia reduced by 42% in the Glargine group
33% had HbA1c <7% without any nighttime hypoglycemia in glargine group
Results significantly better than with NPH
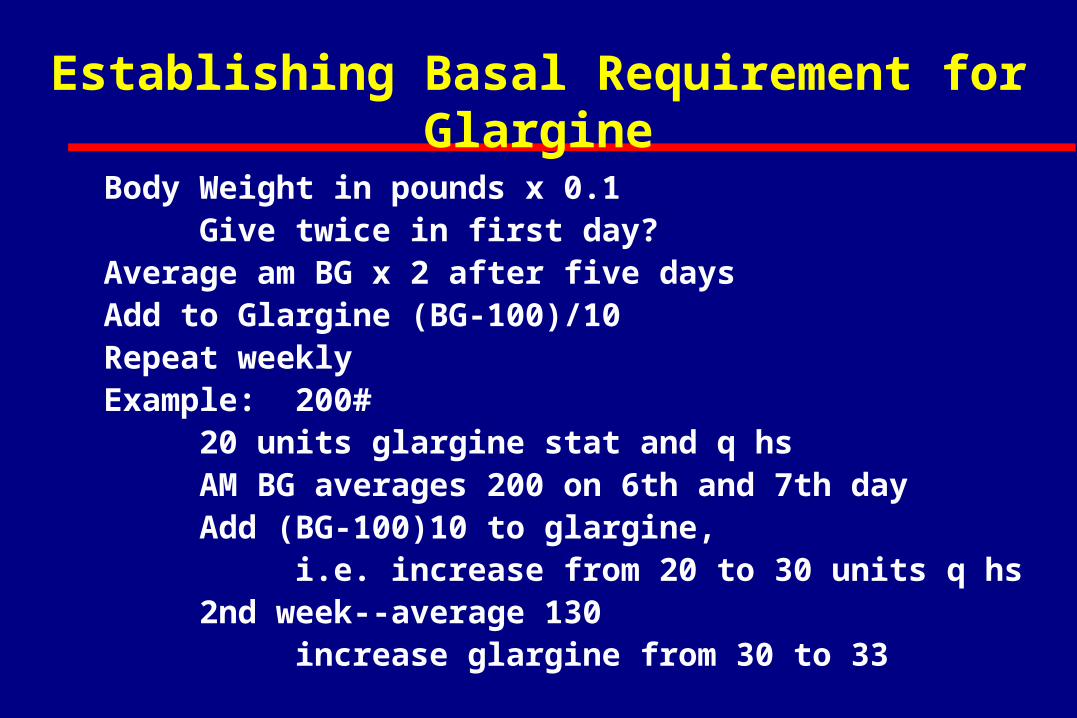
Body Weight in pounds x 0.1Give twice in first day?
Average am BG x 2 after five daysAdd to Glargine (BG-100)/10Repeat weeklyExample: 200#
20 units glargine stat and q hsAM BG averages 200 on 6th and 7th dayAdd (BG-100)10 to glargine,
i.e. increase from 20 to 30 units q hs2nd week--average 130
increase glargine from 30 to 33
Establishing Basal Requirement for Glargine
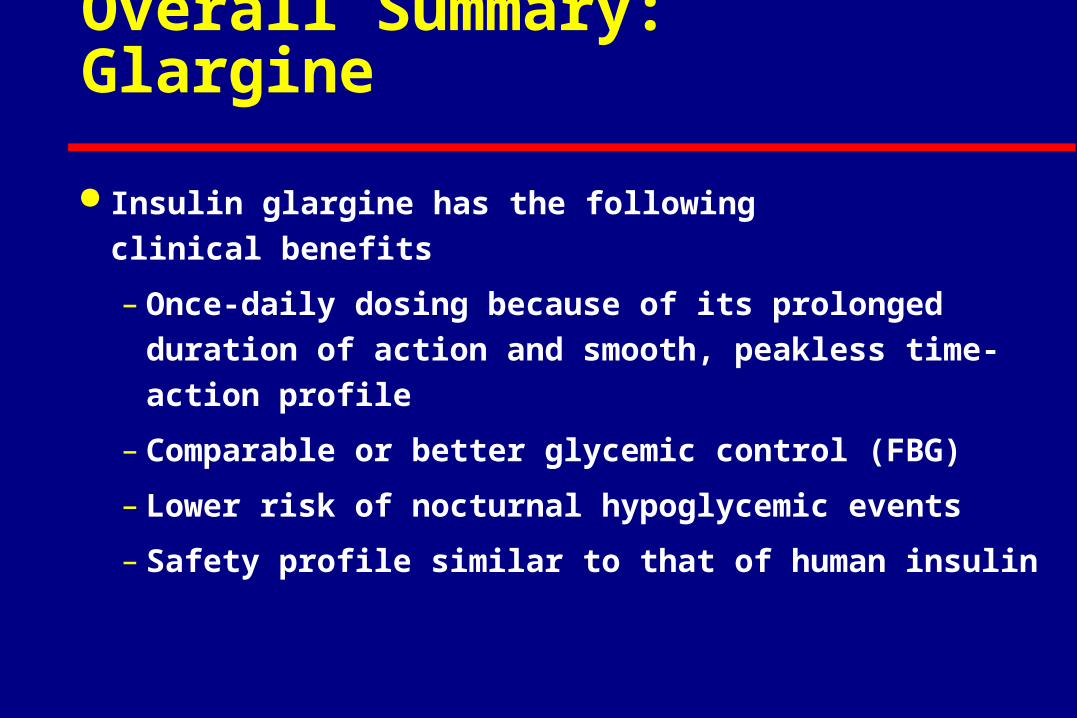
Overall Summary: Glargine
Insulin glargine has the following
clinical benefits
– Once-daily dosing because of its prolonged duration
of action and smooth, peakless time-action profile
– Comparable or better glycemic control (FBG)
– Lower risk of nocturnal hypoglycemic events
– Safety profile similar to that of human insulin
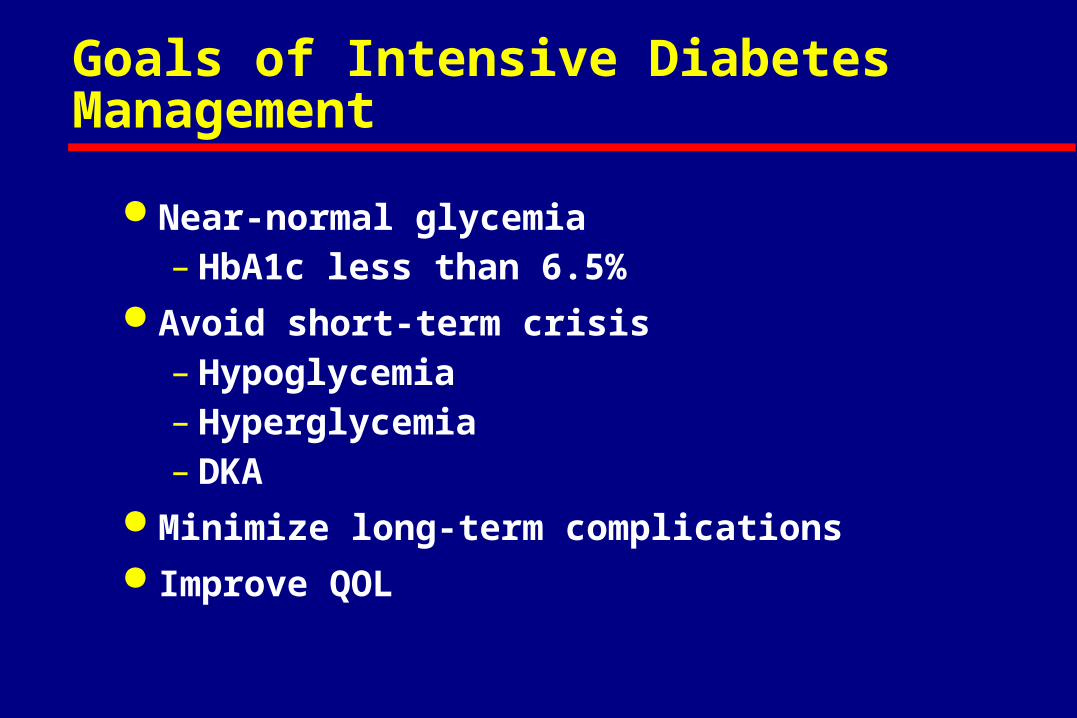
Goals of Intensive Diabetes Management
Near-normal glycemia– HbA1c less than 6.5%
Avoid short-term crisis– Hypoglycemia– Hyperglycemia– DKA
Minimize long-term complications Improve QOL
Type 2 Diabetes … A Progressive Disease
Over time, all patients will need insulin
to control glucose
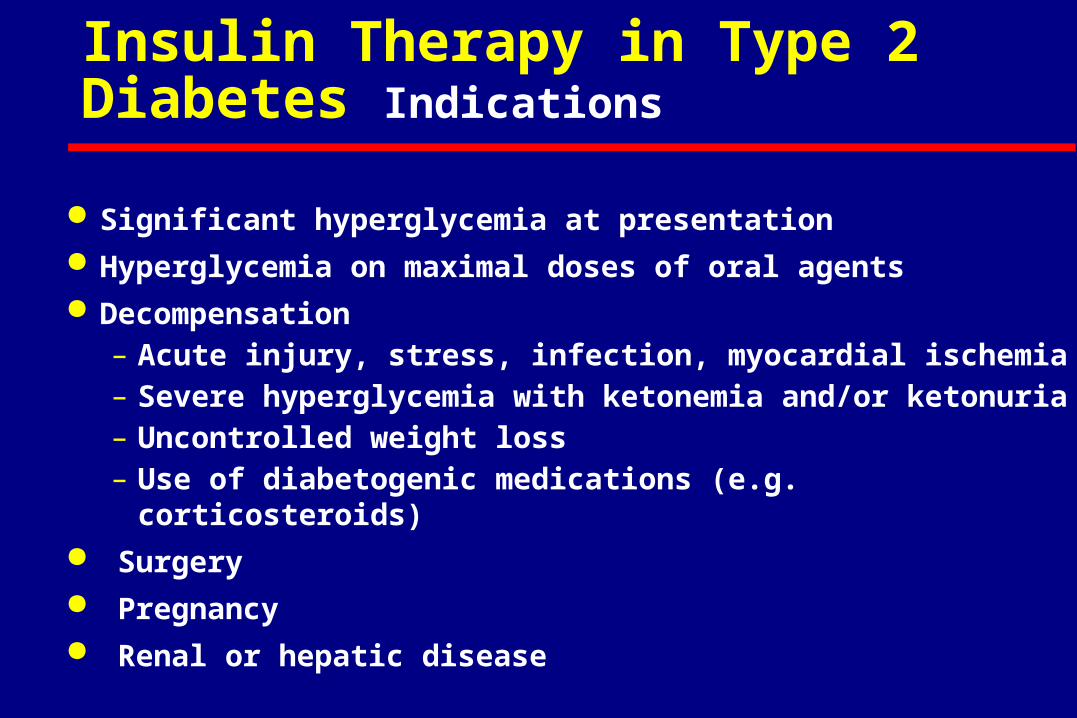
Insulin Therapy in Type 2 Diabetes Indications
Significant hyperglycemia at presentation Hyperglycemia on maximal doses of oral agents Decompensation
– Acute injury, stress, infection, myocardial ischemia– Severe hyperglycemia with ketonemia and/or ketonuria– Uncontrolled weight loss– Use of diabetogenic medications (e.g. corticosteroids)
Surgery Pregnancy Renal or hepatic disease
MIMICKING NATURE WITH INSULIN THERAPY
All persons need
both basal and mealtime insulin
(endogenous or exogenous)
to controlcontrol glucose
6-19
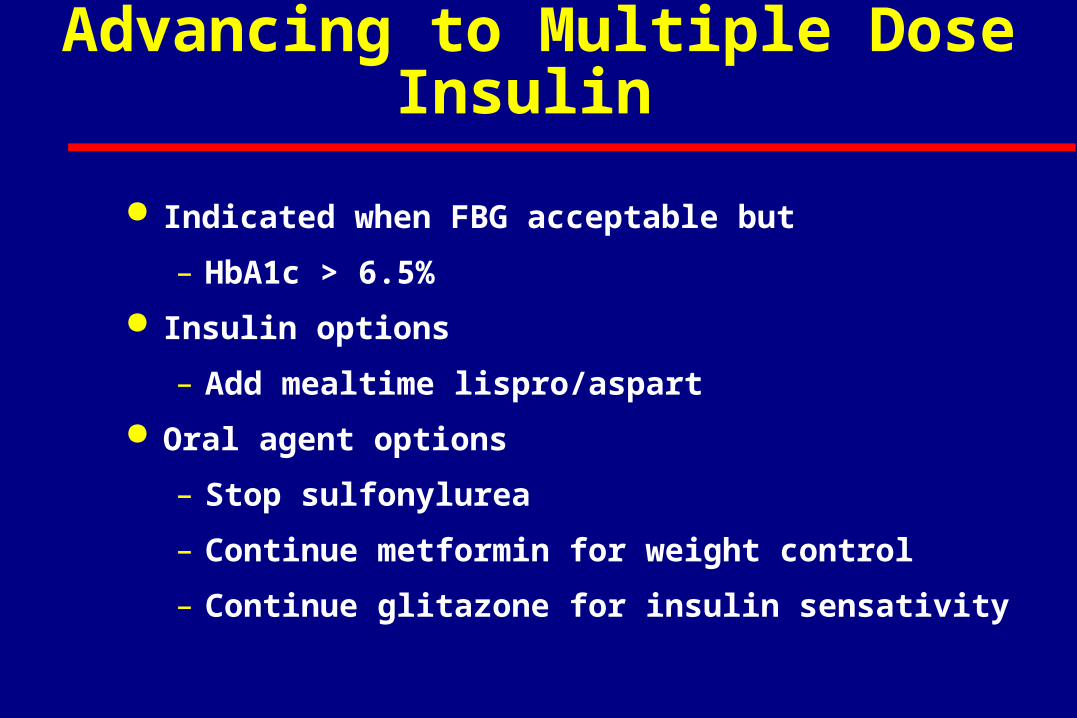
Advancing to Multiple Dose Insulin
Indicated when FBG acceptable but
– HbA1c > 6.5%
Insulin options
– Add mealtime lispro/aspart
Oral agent options
– Stop sulfonylurea
– Continue metformin for weight control
– Continue glitazone for insulin sensativity
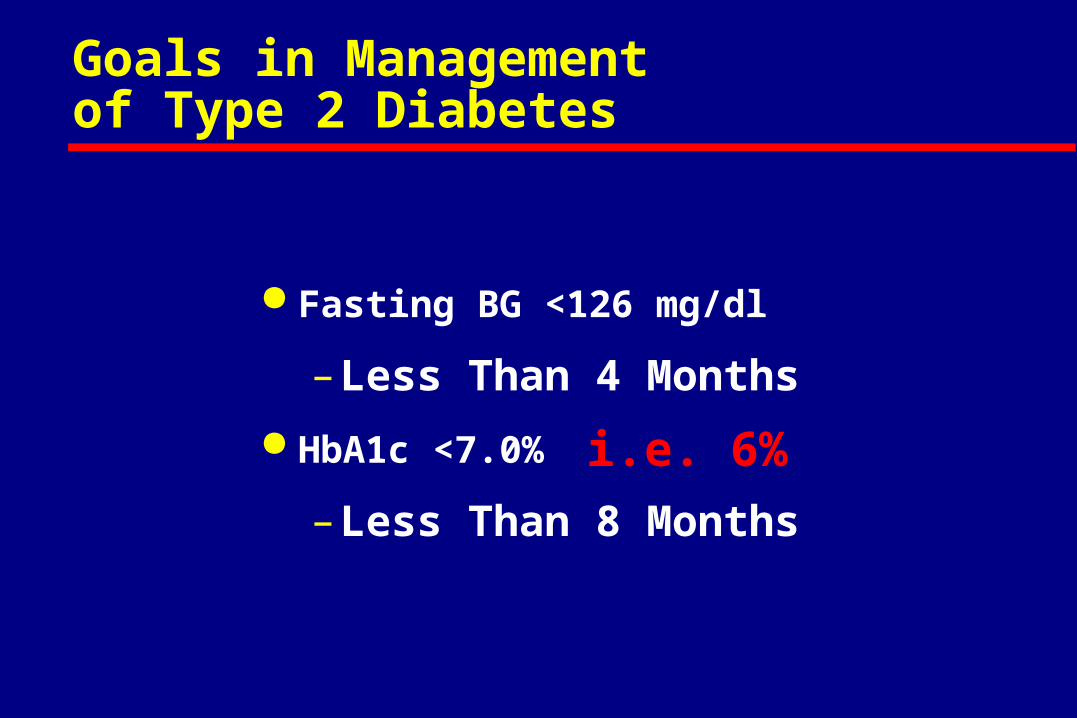
Goals in Management of Type 2 Diabetes
Fasting BG <126 mg/dl
– Less Than 4 Months
HbA1c <7.0%
– Less Than 8 Months
i.e. 6%
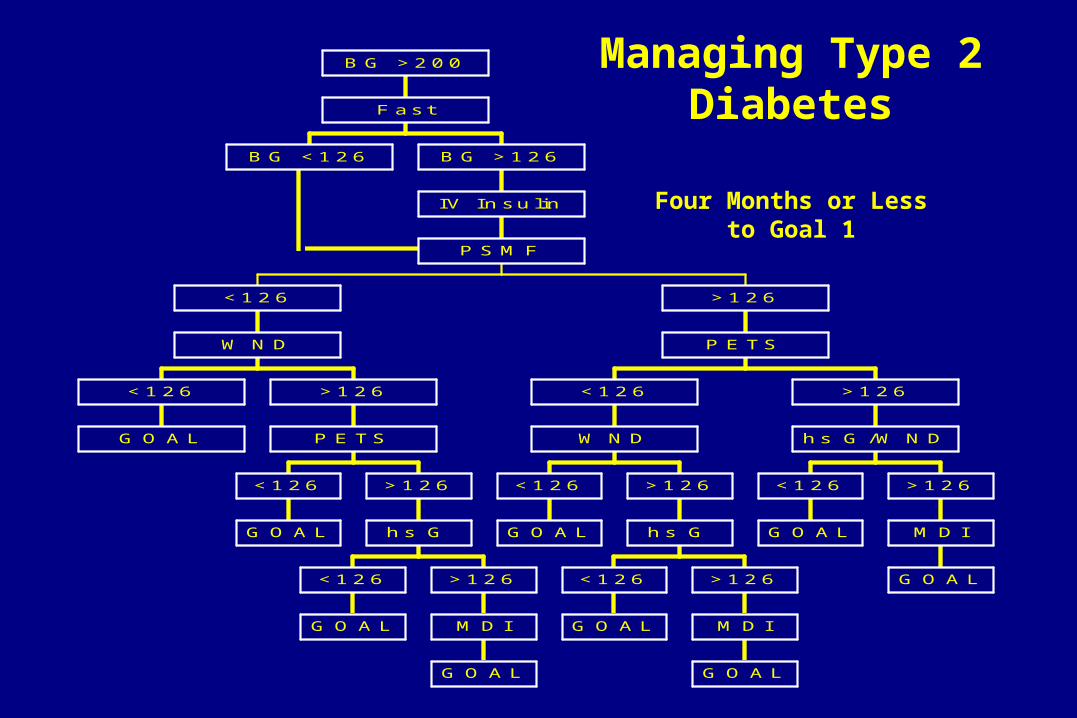
Managing Type 2 Diabetes
Four Months or Lessto Goal 1
B G < 1 2 6
G O A L
< 1 2 6
G O A L
< 1 2 6
G O A L
< 1 2 6
G O A L
M D I
> 1 2 6
h s G
> 1 2 6
P E TS
> 1 2 6
W N D
< 1 2 6
G O A L
< 1 2 6
G O A L
< 1 2 6
G O A L
M D I
> 1 2 6
h s G
> 1 2 6
W N D
< 1 2 6
G O A L
< 1 2 6
G O A L
M D I
> 1 2 6
h s G /W N D
> 1 2 6
P E TS
> 1 2 6
P S M F
IV In su lin
B G > 1 2 6
F as t
B G > 2 0 0
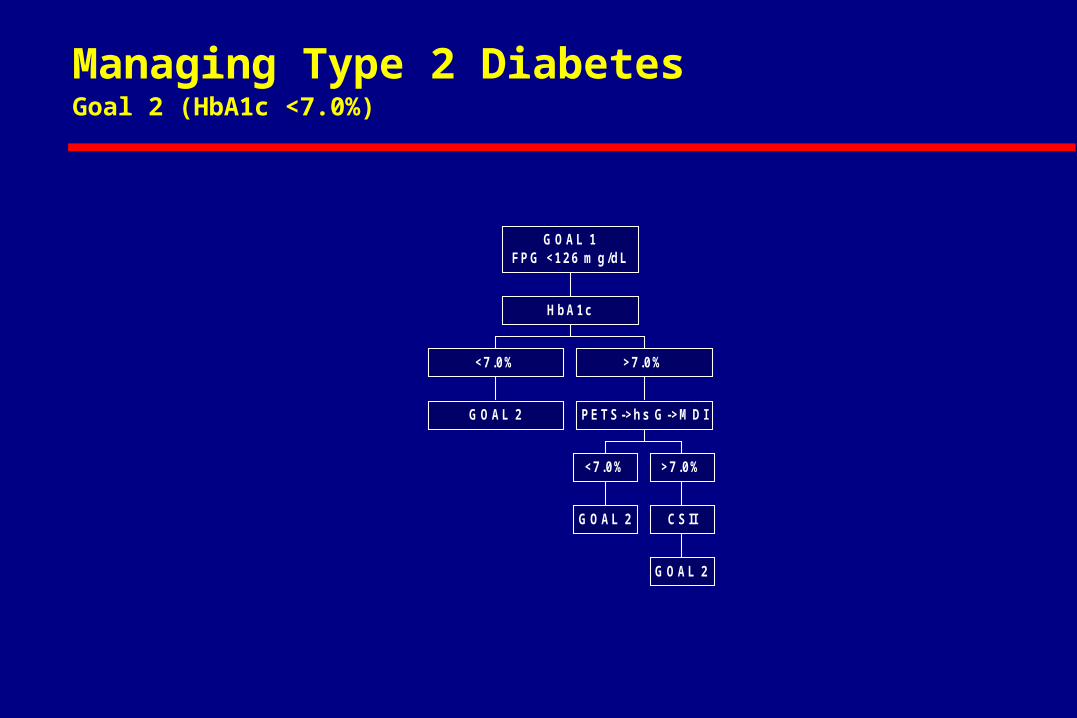
Managing Type 2 DiabetesGoal 2 (HbA1c <7.0%)
G OAL 2
<7.0%
G OAL 2
<7.0%
G OAL 2
CSII
>7.0%
PET S->hs G ->M DI
>7.0%
HbA1c
G OAL 1FPG <126 m g/dL
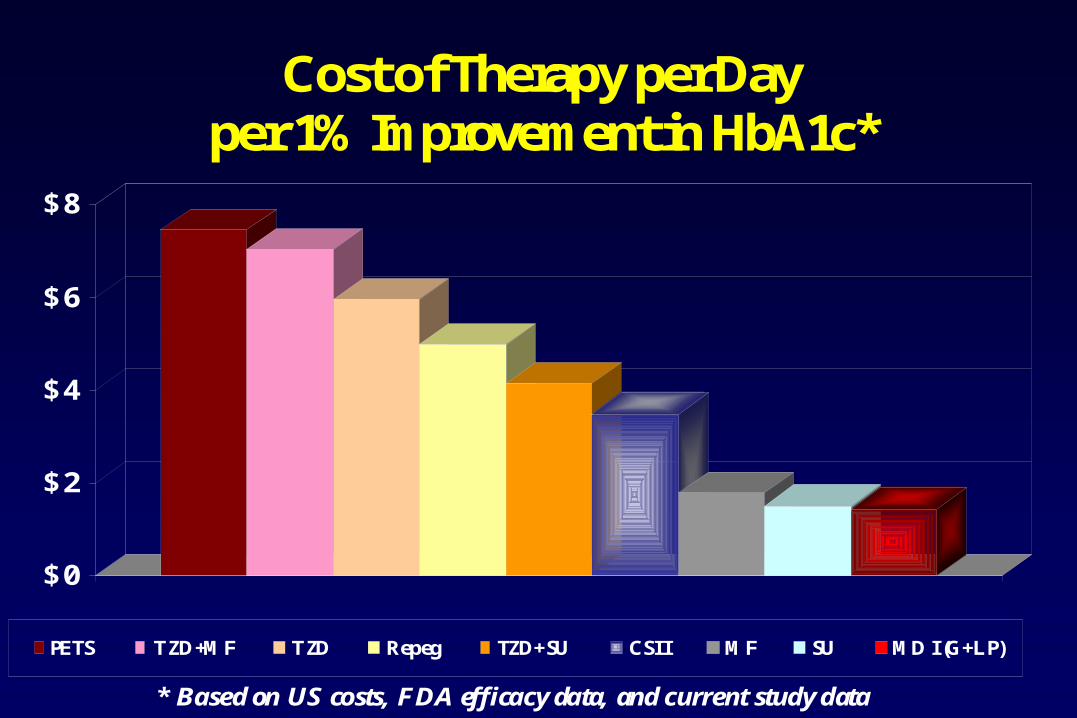
Cost of Therapy per Dayper 1% Improvement in HbA1c*
$0
$2
$4
$6
$8
PETS TZD+MF TZD Repeg TZD+SU CSII MF SU MD I (G+LP)
* Based on US costs, FDA efficacy data, and current study data
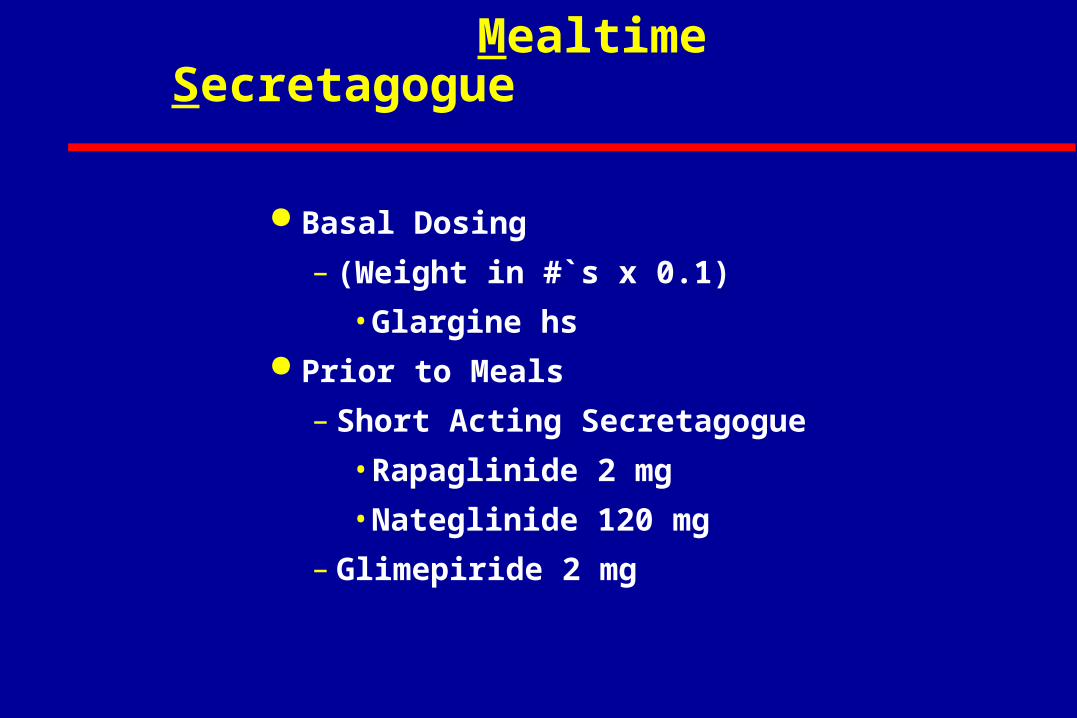
GEMS--Glargine Evening Mealtime Secretagogue
Basal Dosing
– (Weight in #`s x 0.1)
• Glargine hs Prior to Meals
– Short Acting Secretagogue
• Rapaglinide 2 mg
• Nateglinide 120 mg
– Glimepiride 2 mg
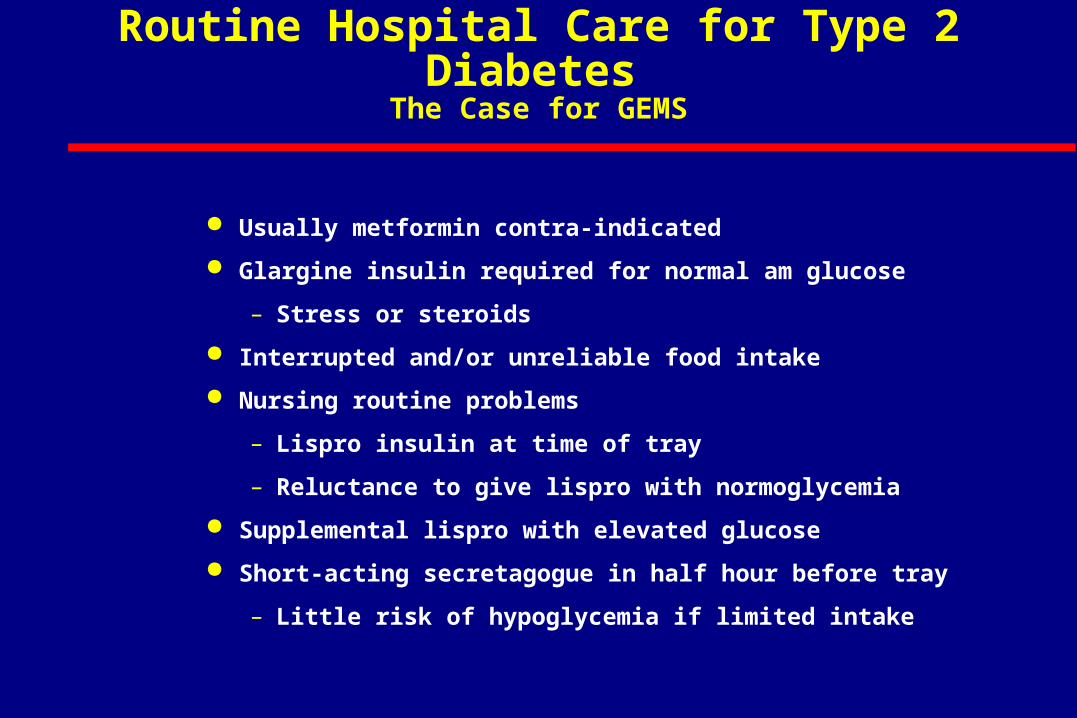
Routine Hospital Care for Type 2 Diabetes The Case for GEMS
Usually metformin contra-indicated
Glargine insulin required for normal am glucose
– Stress or steroids
Interrupted and/or unreliable food intake
Nursing routine problems
– Lispro insulin at time of tray
– Reluctance to give lispro with normoglycemia
Supplemental lispro with elevated glucose
Short-acting secretagogue in half hour before tray
– Little risk of hypoglycemia if limited intake
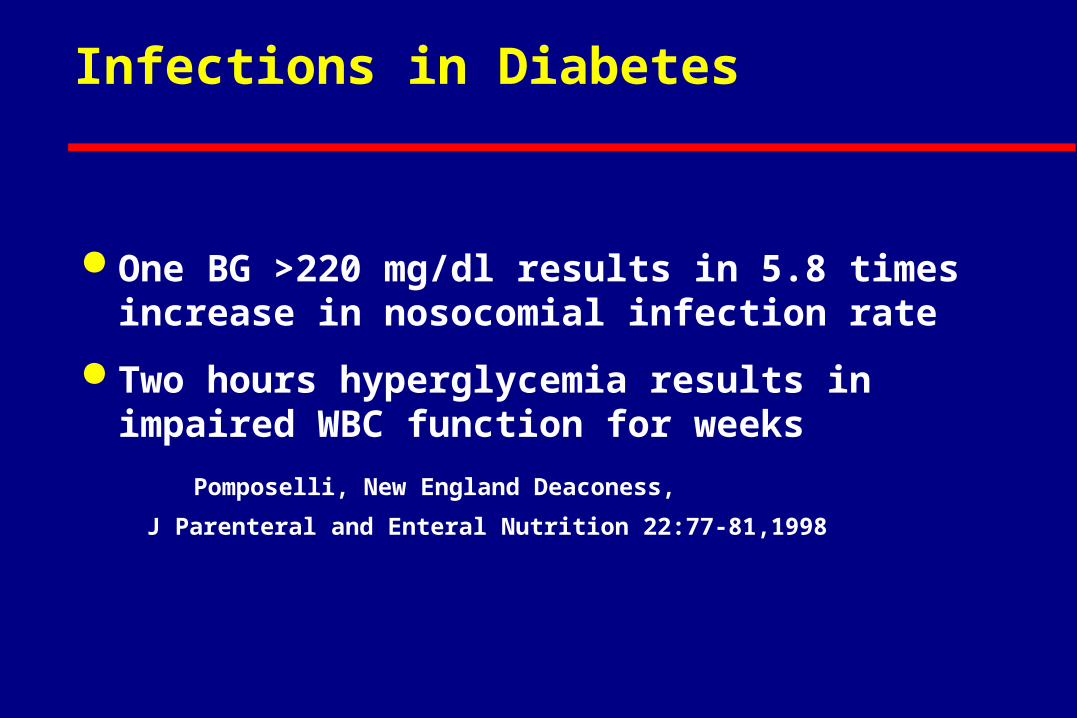
Infections in Diabetes
One BG >220 mg/dl results in 5.8 times increase in nosocomial infection rate
Two hours hyperglycemia results in impaired WBC function for weeks
Pomposelli, New England Deaconess,
J Parenteral and Enteral Nutrition 22:77-81,1998
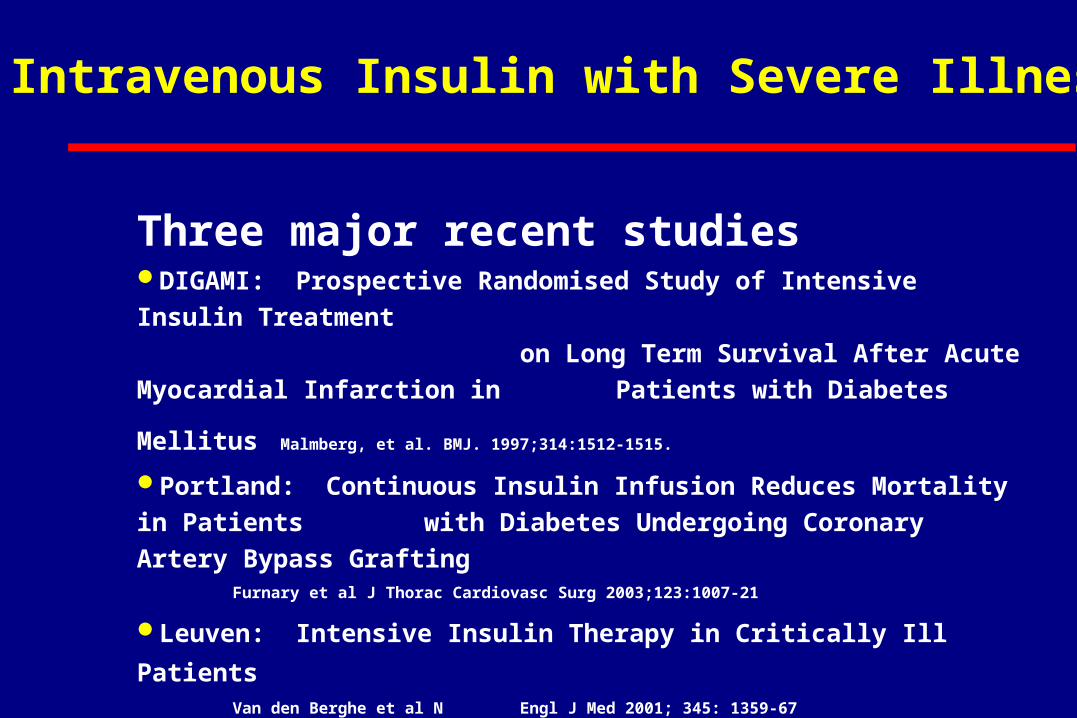
Intravenous Insulin with Severe Illness
Three major recent studiesDIGAMI: Prospective Randomised Study of Intensive Insulin Treatment
on Long Term Survival After
Acute Myocardial Infarction in Patients with Diabetes Mellitus Malmberg, et al. BMJ. 1997;314:1512-1515.
Portland: Continuous Insulin Infusion Reduces Mortality in Patients
with Diabetes Undergoing Coronary Artery Bypass Grafting Furnary et al J Thorac Cardiovasc Surg 2003;123:1007-21
Leuven: Intensive Insulin Therapy in Critically Ill Patients Van den Berghe et al N Engl J Med 2001; 345: 1359-67
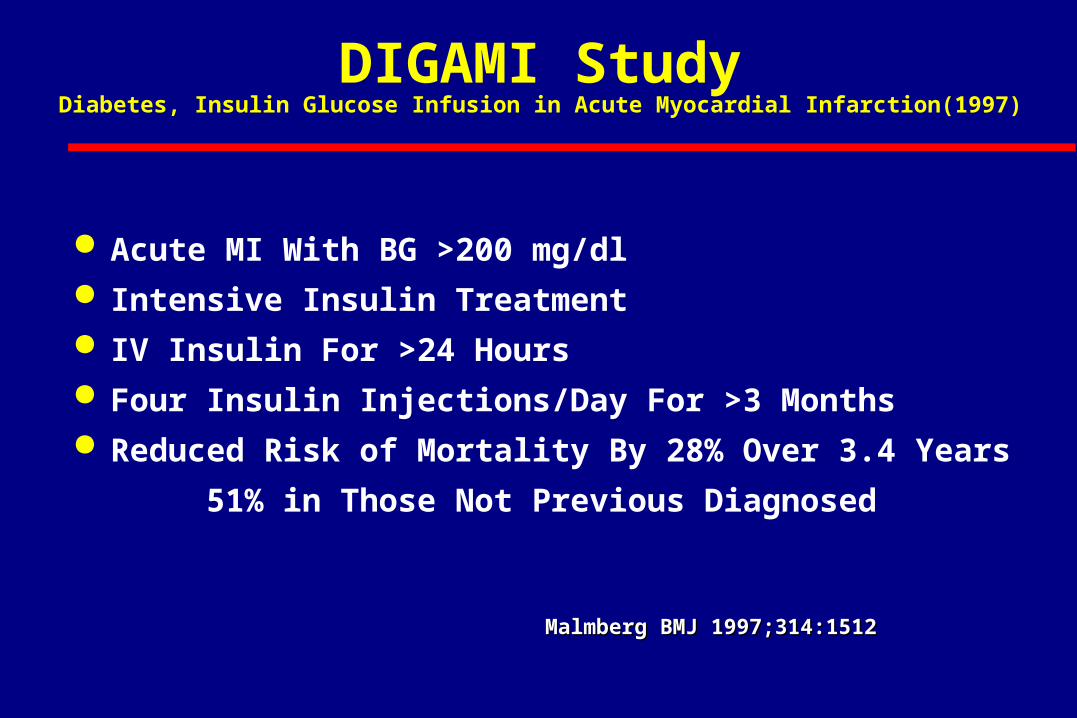
DIGAMI StudyDiabetes, Insulin Glucose Infusion in Acute Myocardial Infarction(1997)
Acute MI With BG >200 mg/dl Intensive Insulin Treatment IV Insulin For >24 Hours Four Insulin Injections/Day For >3 Months Reduced Risk of Mortality By 28% Over 3.4 Years
51% in Those Not Previous Diagnosed
Malmberg BMJ 1997;314:1512Malmberg BMJ 1997;314:1512
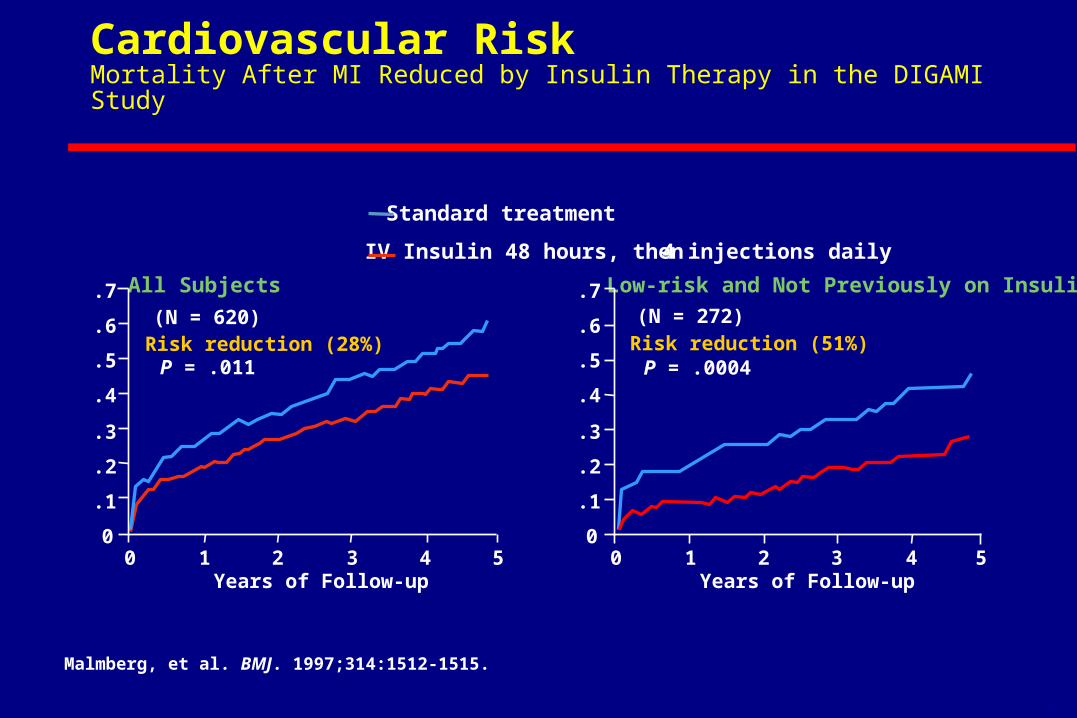
Cardiovascular RiskMortality After MI Reduced by Insulin Therapy in the DIGAMI Study
Malmberg, et al. BMJ. 1997;314:1512-1515.
All Subjects
(N = 620)Risk reduction (28%) P = .011
Standard treatment
0
.3
.2
.4
.7
.1
.5
.6
0 1Years of Follow-up
2 3 4 5
Low-risk and Not Previously on Insulin
(N = 272)Risk reduction (51%) P = .0004
IV Insulin 48 hours, then 4 injections daily
0
.3
.2
.4
.7
.1
.5
.6
0 1Years of Follow-up
2 3 4 5
6-11
0
2
4
6
8
10
12
14
16
<150 150-175 175-200 200-225 225-50 >250
Average Post-operative glucose (mg/dl)
Mo
rtali
ty
Cardiac-related mortalityNoncardiac-related mortality
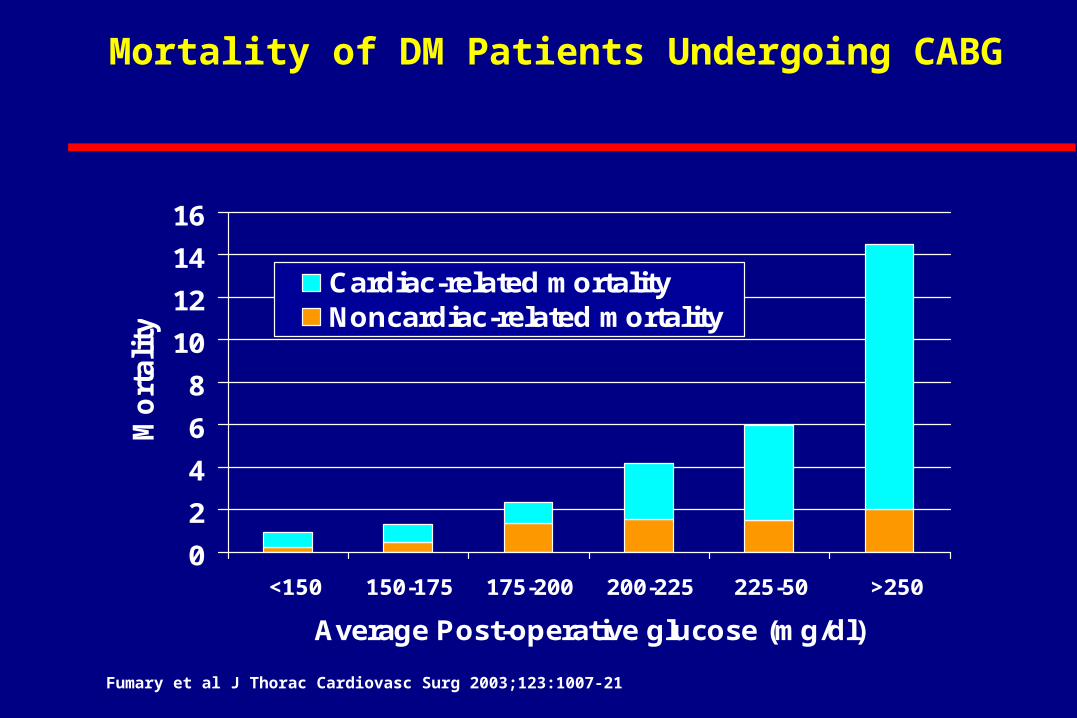
Mortality of DM Patients Undergoing CABG
Fumary et al J Thorac Cardiovasc Surg 2003;123:1007-21
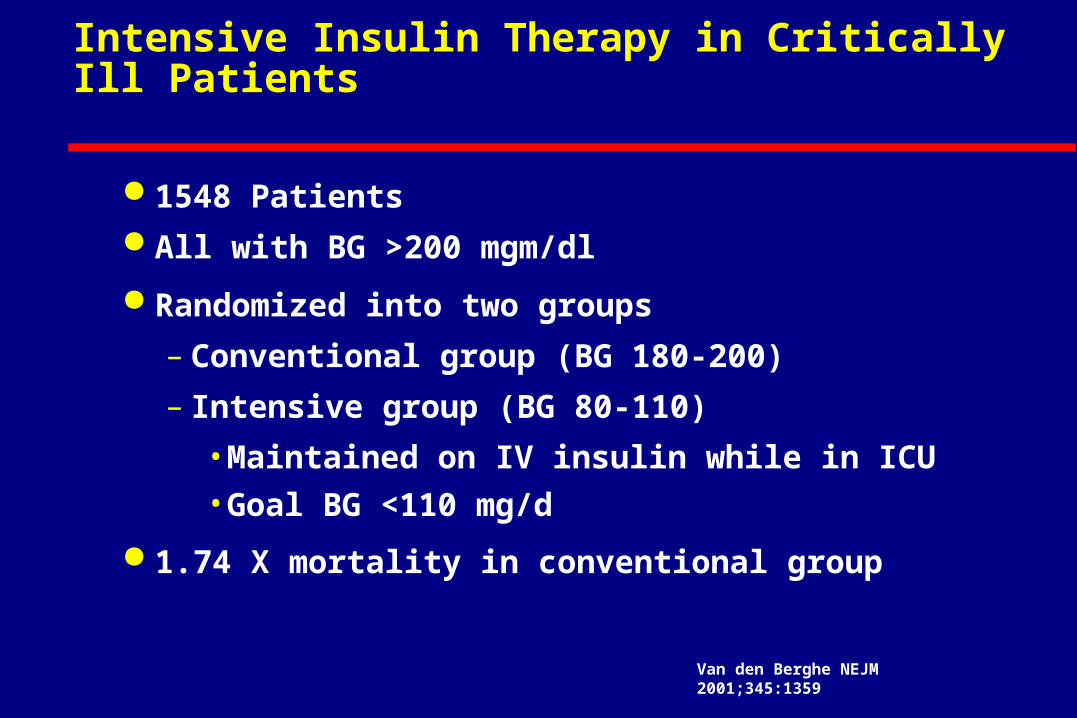
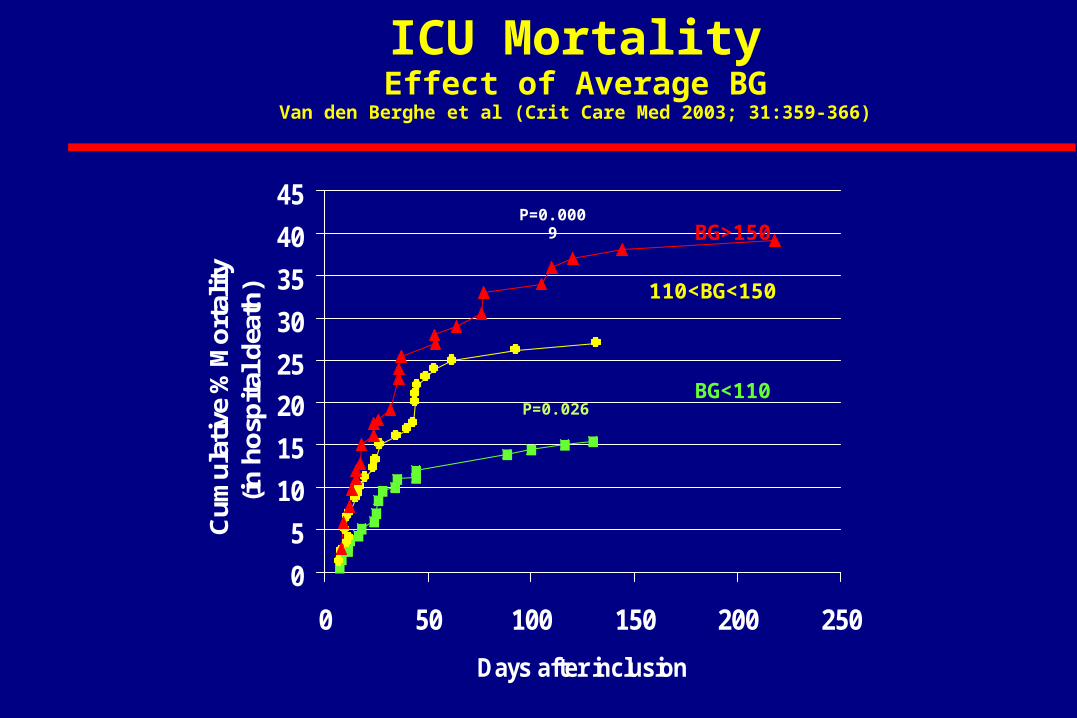
Intensive Insulin Therapy in Critically Ill Patients
1548 Patients All with BG >200 mgm/dl
Randomized into two groups
– Conventional group (BG 180-200)
– Intensive group (BG 80-110)
• Maintained on IV insulin while in ICU
• Goal BG <110 mg/d
1.74 X mortality in conventional group
Van den Berghe NEJM 2001;345:1359
0
5
10
15
20
25
30
35
40
45
0 50 100 150 200 250
Days after inclusion
Cum
ulat
ive
% M
orta
lity
(in h
ospi
tal d
eath
)P=0.000
9
P=0.026BG<110
110<BG<150
BG>150
ICU MortalityEffect of Average BG
Van den Berghe et al (Crit Care Med 2003; 31:359-366)
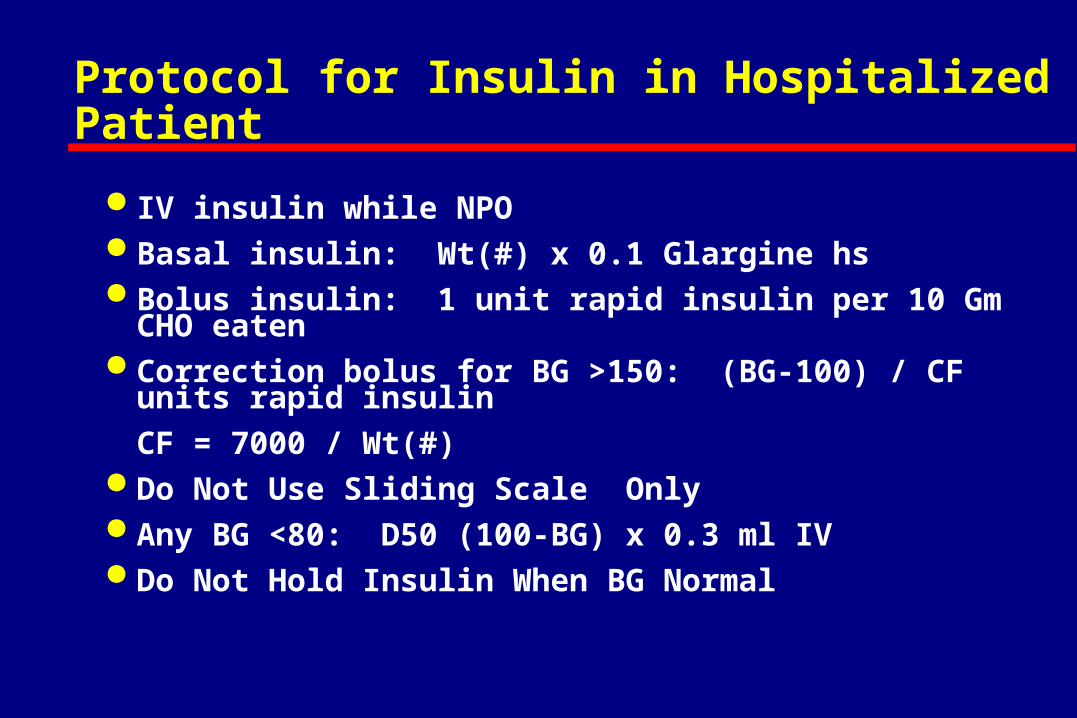
Protocol for Insulin in Hospitalized Patient
IV insulin while NPO Basal insulin: Wt(#) x 0.1 Glargine hs Bolus insulin: 1 unit rapid insulin per 10 Gm CHO eaten Correction bolus for BG >150: (BG-100) / CF units rapid
insulin
CF = 7000 / Wt(#) Do Not Use Sliding Scale Only Any BG <80: D50 (100-BG) x 0.3 ml IV Do Not Hold Insulin When BG Normal
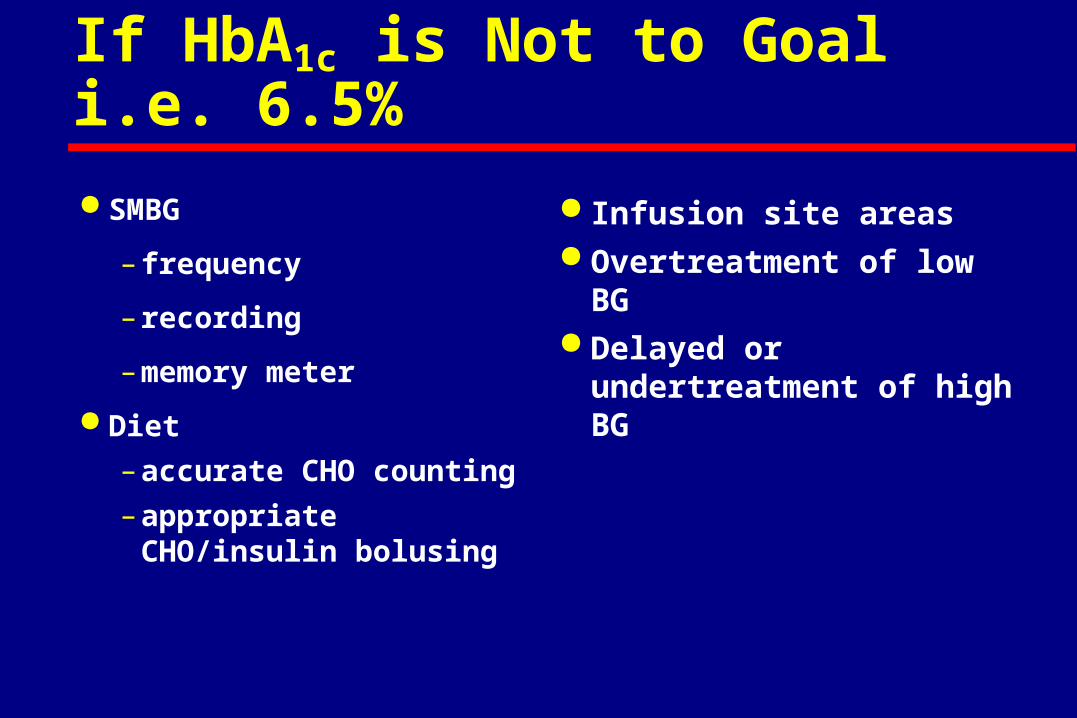
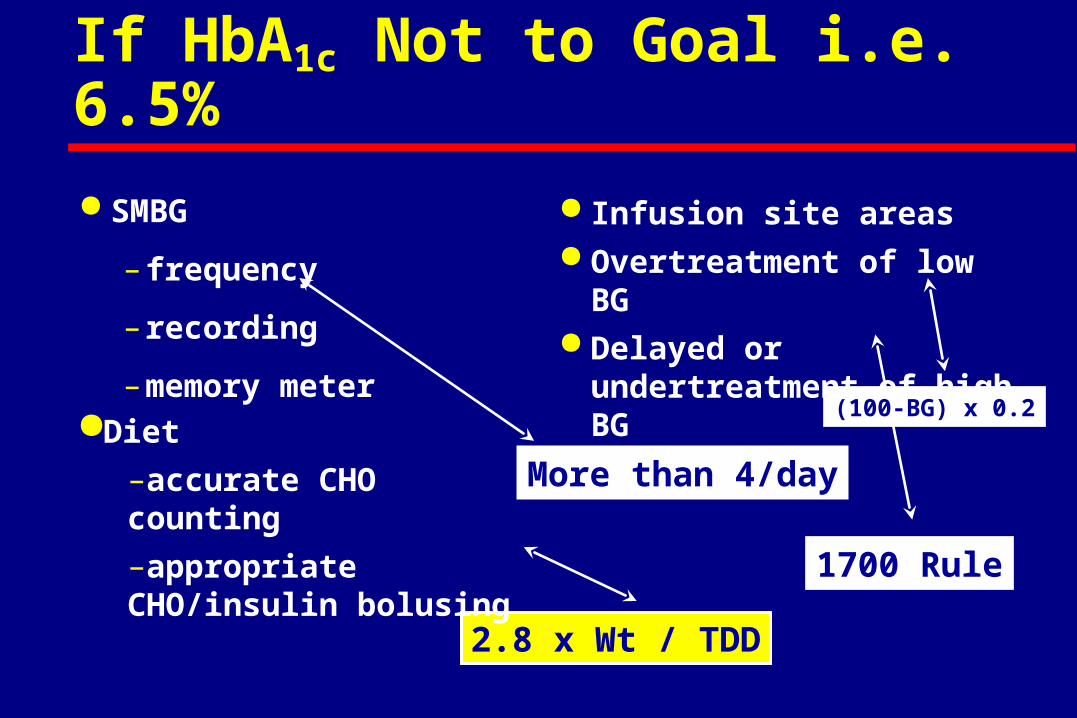
If HbA1c is Not to Goal i.e. 6.5%
SMBG
– frequency
– recording
– memory meter
Diet
– accurate CHO counting
– appropriate CHO/insulin bolusing
Infusion site areas Overtreatment of low BG Delayed or undertreatment
of high BG
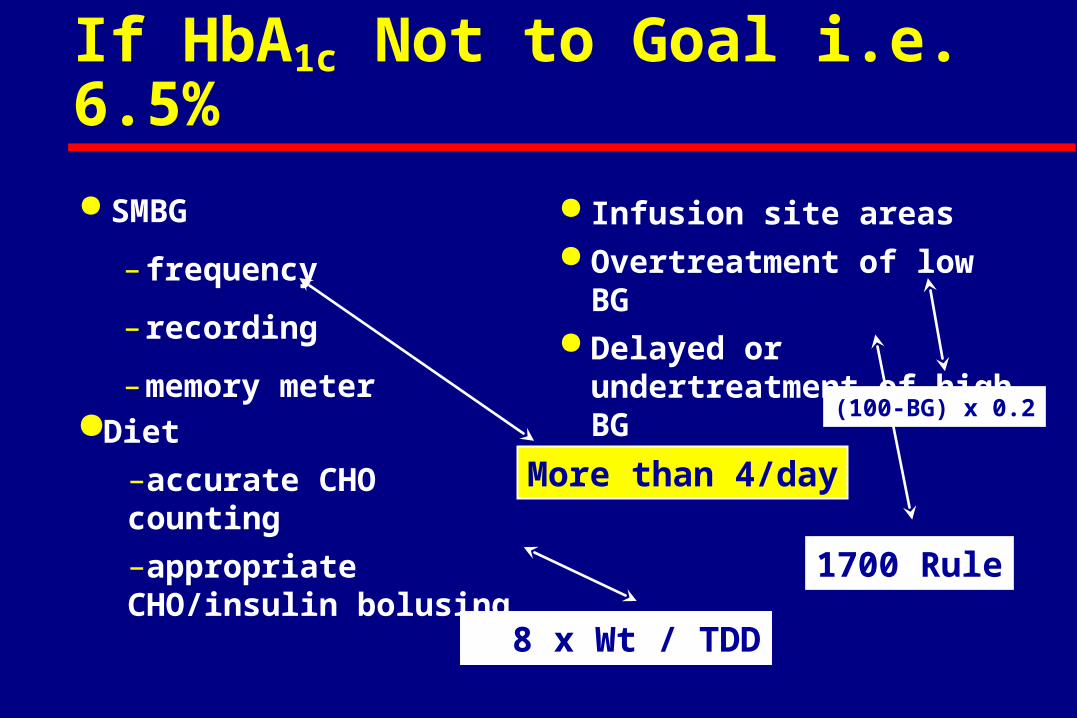
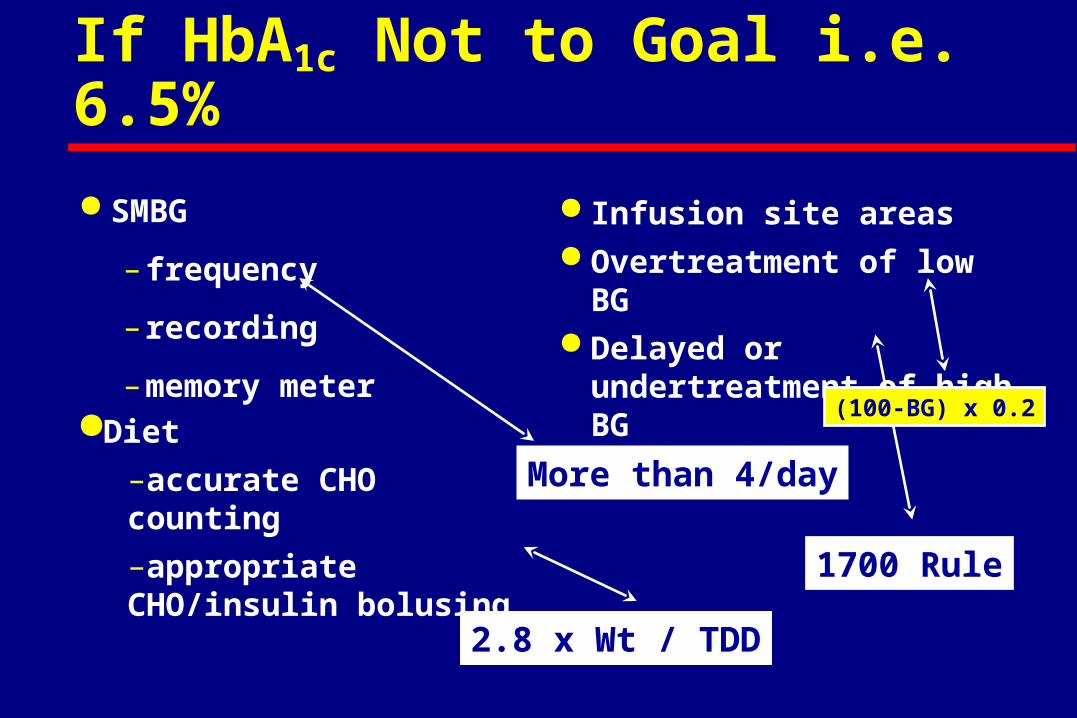
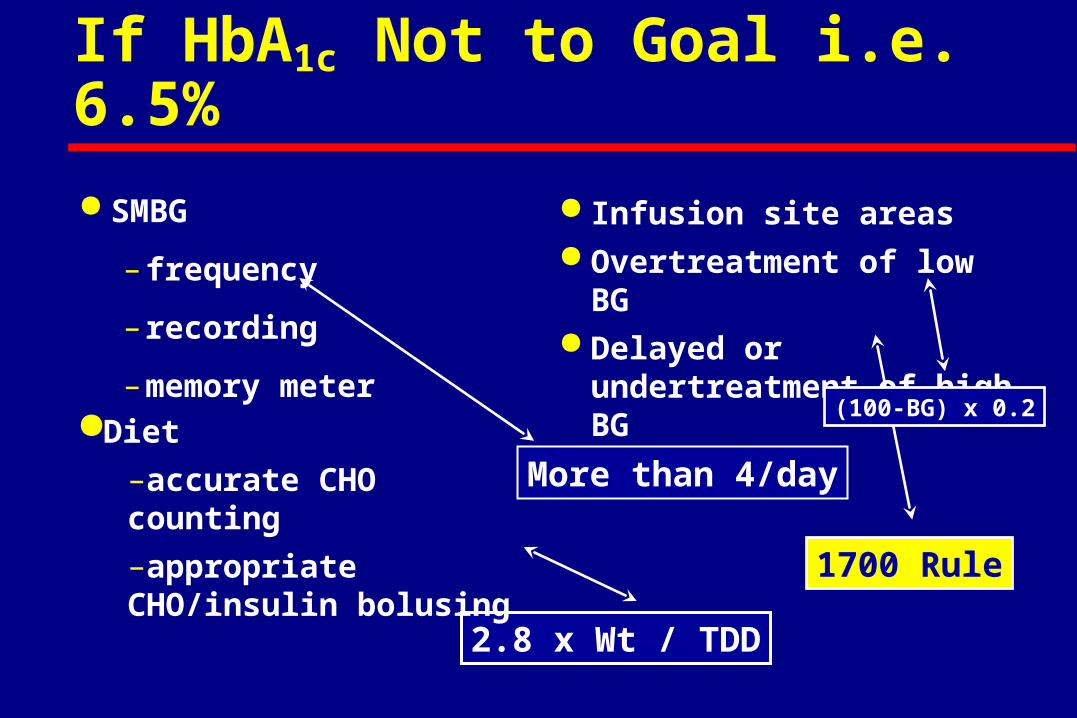
If HbA1c Not to Goal i.e. 6.5%
SMBG
– frequency
– recording
– memory meter
Infusion site areas Overtreatment of low BG Delayed or undertreatment
of high BG
More than 4/day
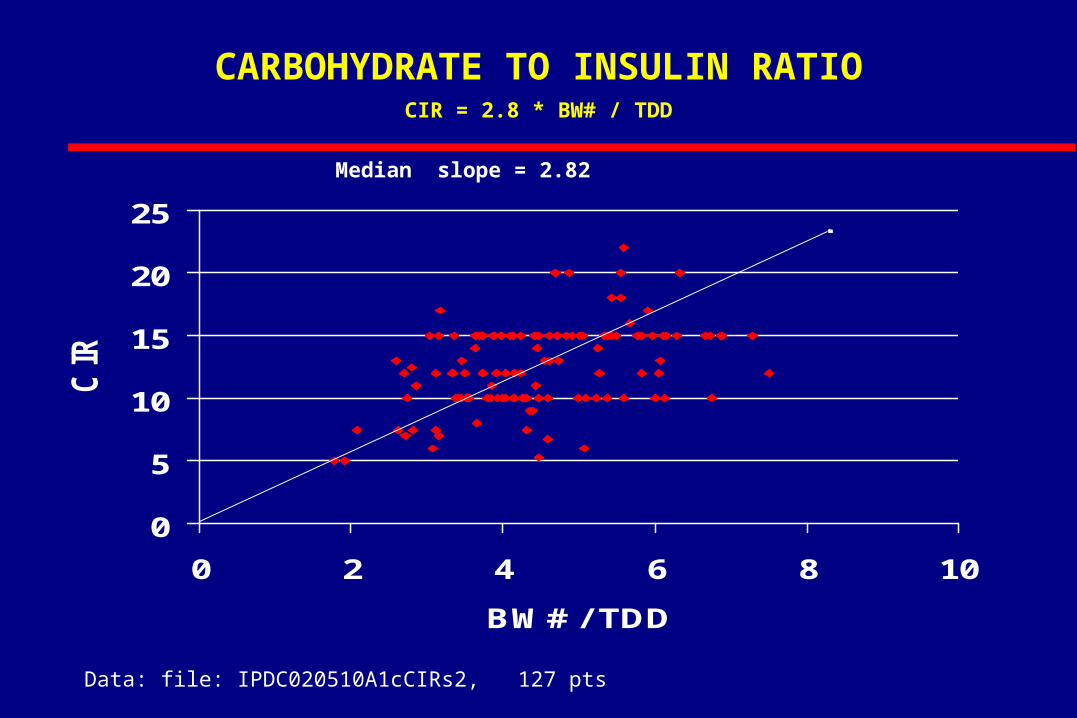
2.8 x Wt / TDD
1700 Rule
(100-BG) x 0.2
Diet
–accurate CHO counting
–appropriate CHO/insulin bolusing
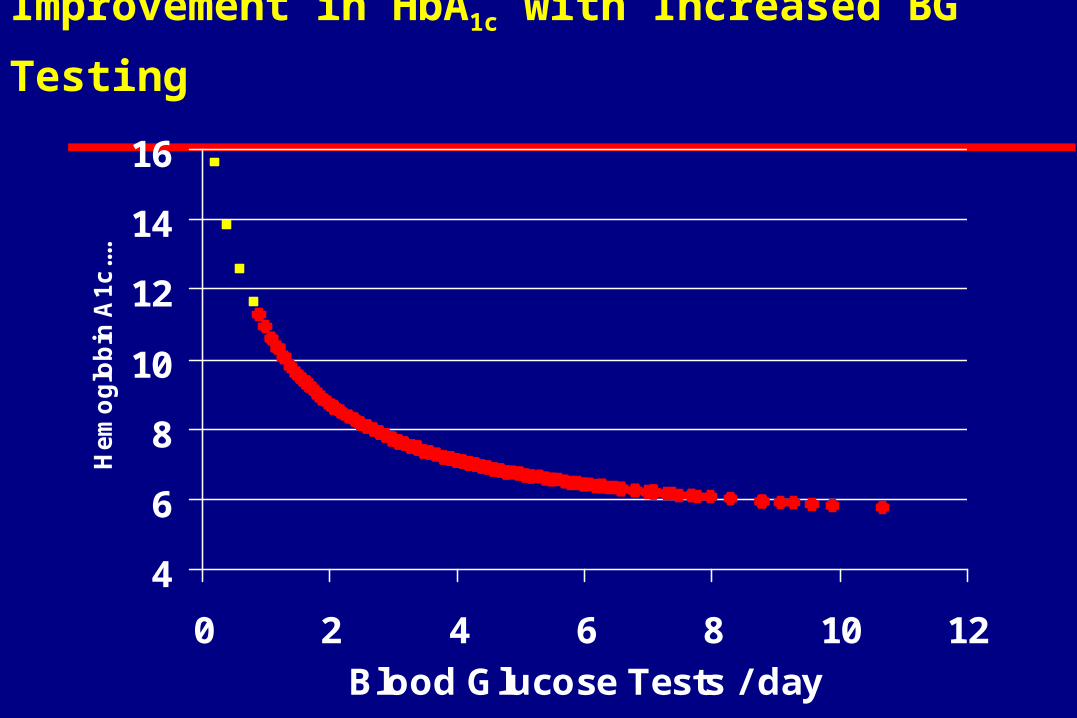
Improvement in HbA1c with Increased BG Testing
4
6
8
10
12
14
16
0 2 4 6 8 10 12
Blood Glucose Tests / day
He
mo
glo
bin
A1
c...
..
If HbA1c Not to Goal i.e. 6.5%
SMBG
– frequency
– recording
– memory meter
Infusion site areas Overtreatment of low BG Delayed or undertreatment
of high BG
More than 4/day
2.8 x Wt / TDD
1700 Rule
(100-BG) x 0.2
Diet
–accurate CHO counting
–appropriate CHO/insulin bolusing
0
5
10
15
20
25
0 2 4 6 8 10
BW# / TDD
CIR
Median slope = 2.82
Data: file: IPDC020510A1cCIRs2, 127 pts
CARBOHYDRATE TO INSULIN RATIOCIR = 2.8 * BW# / TDD
If HbA1c Not to Goal i.e. 6.5%
SMBG
– frequency
– recording
– memory meter
Infusion site areas Overtreatment of low BG Delayed or undertreatment
of high BG
More than 4/day
2.8 x Wt / TDD
1700 Rule
(100-BG) x 0.2
Diet
–accurate CHO counting
–appropriate CHO/insulin bolusing
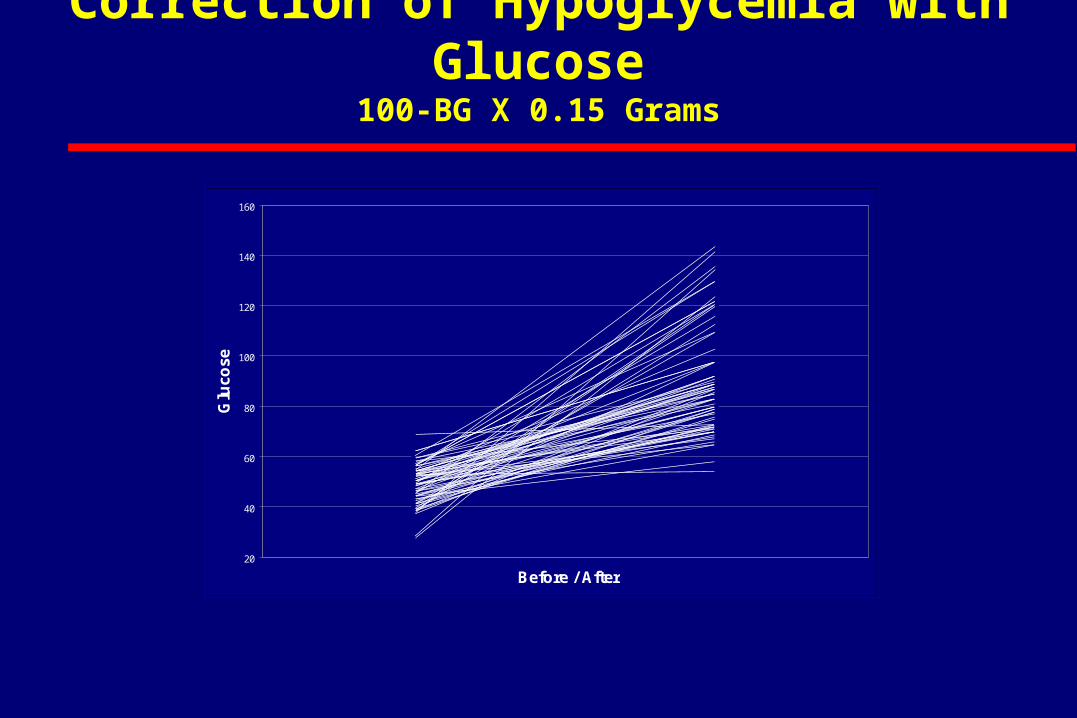
20
40
60
80
100
120
140
160
Before / After
Glu
cose
Correction of Hypoglycemia with Glucose100-BG X 0.15 Grams
If HbA1c Not to Goal i.e. 6.5%
SMBG
– frequency
– recording
– memory meter
Infusion site areas Overtreatment of low BG Delayed or undertreatment
of high BG
More than 4/day
2.8 x Wt / TDD
1700 Rule
(100-BG) x 0.2
Diet
–accurate CHO counting
–appropriate CHO/insulin bolusing
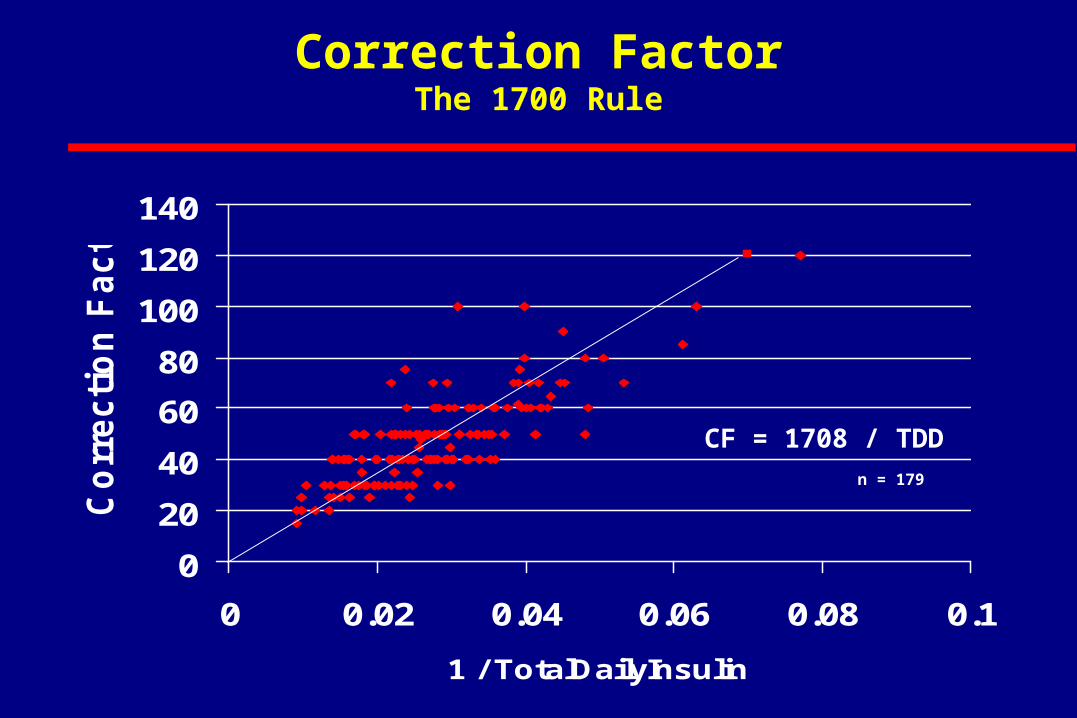
0
20
40
60
80
100
120
140
0 0.02 0.04 0.06 0.08 0.1
1 / TotalDailyInsulin
Co
rrecti
on
Facto
rCorrection Factor
The 1700 Rule
CF = 1708 / TDD
n = 179
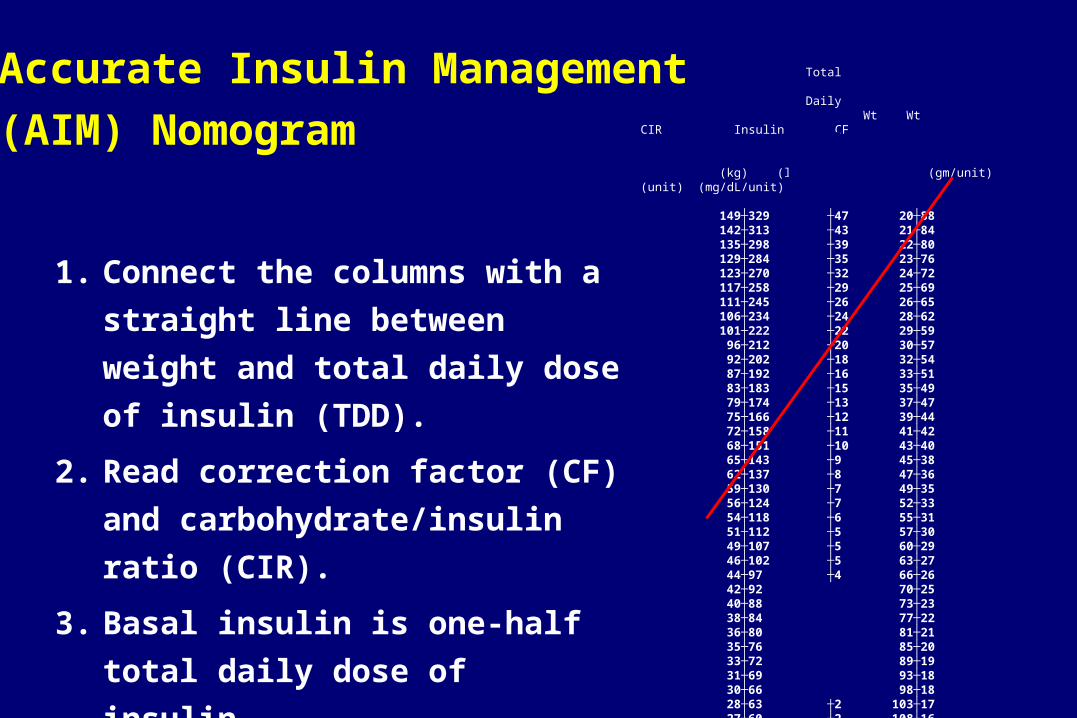
Total Daily Wt Wt CIR Insulin CF (kg) (lb) (gm/unit) (unit) (mg/dL/unit) 149┼329 ┼47 20┼88 142┼313 ┼43 21┼84 135┼298 ┼39 22┼80 129┼284 ┼35 23┼76 123┼270 ┼32 24┼72 117┼258 ┼29 25┼69 111┼245 ┼26 26┼65 106┼234 ┼24 28┼62 101┼222 ┼22 29┼59 96┼212 ┼20 30┼57 92┼202 ┼18 32┼54 87┼192 ┼16 33┼51 83┼183 ┼15 35┼49 79┼174 ┼13 37┼47 75┼166 ┼12 39┼44 72┼158 ┼11 41┼42 68┼151 ┼10 43┼40 65┼143 ┼9 45┼38 62┼137 ┼8 47┼36 59┼130 ┼7 49┼35 56┼124 ┼7 52┼33 54┼118 ┼6 55┼31 51┼112 ┼5 57┼30 49┼107 ┼5 60┼29 46┼102 ┼5 63┼27 44┼97 ┼4 66┼26 42┼92 ┼4 70┼25 40┼88 ┼3 73┼23 38┼84 ┼3 77┼22 36┼80 ┼3 81┼21 35┼76 ┼3 85┼20 33┼72 ┼2 89┼19 31┼69 ┼2 93┼18 30┼66 ┼2 98┼18 28┼63 ┼2 103┼17 27┼60 ┼2 108┼16 26┼57 ┼1 113┼15 25┼54 ┼1 119┼14 23┼51 ┼1 125┼14
Accurate Insulin Management
(AIM) Nomogram
1. Connect the columns with a
straight line between weight and
total daily dose of insulin (TDD).
2. Read correction factor (CF) and
carbohydrate/insulin ratio (CIR).
3. Basal insulin is one-half total daily
dose of insulin.
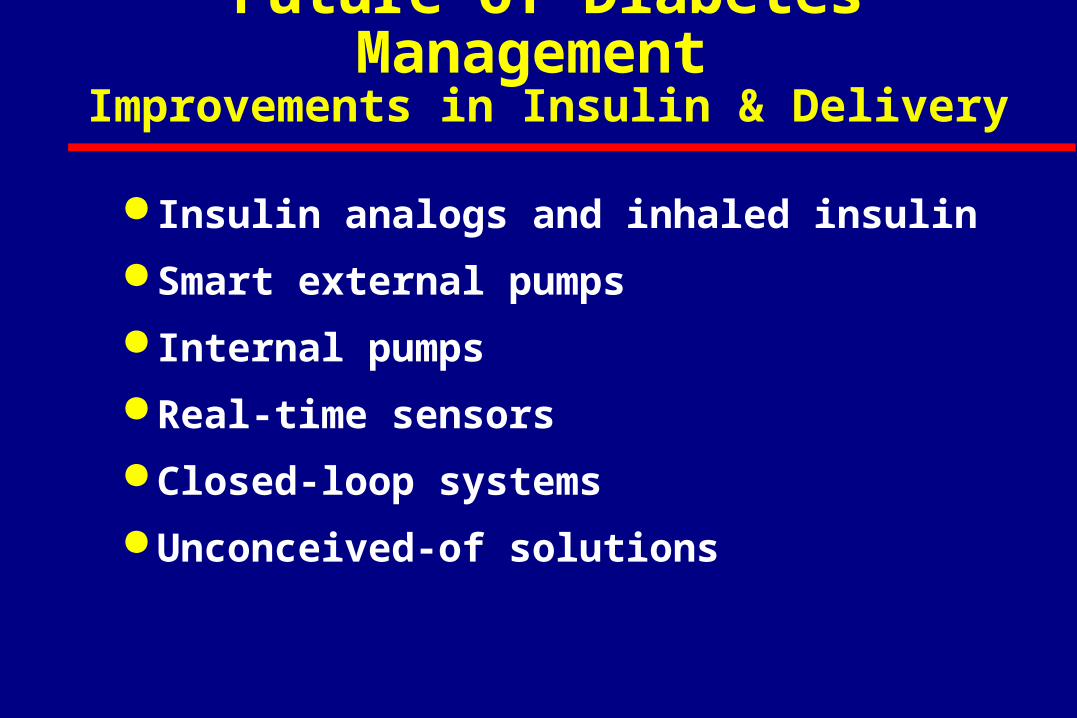
Future of Diabetes Management Improvements in Insulin & Delivery
Insulin analogs and inhaled insulin
Smart external pumps
Internal pumps
Real-time sensors
Closed-loop systems
Unconceived-of solutions
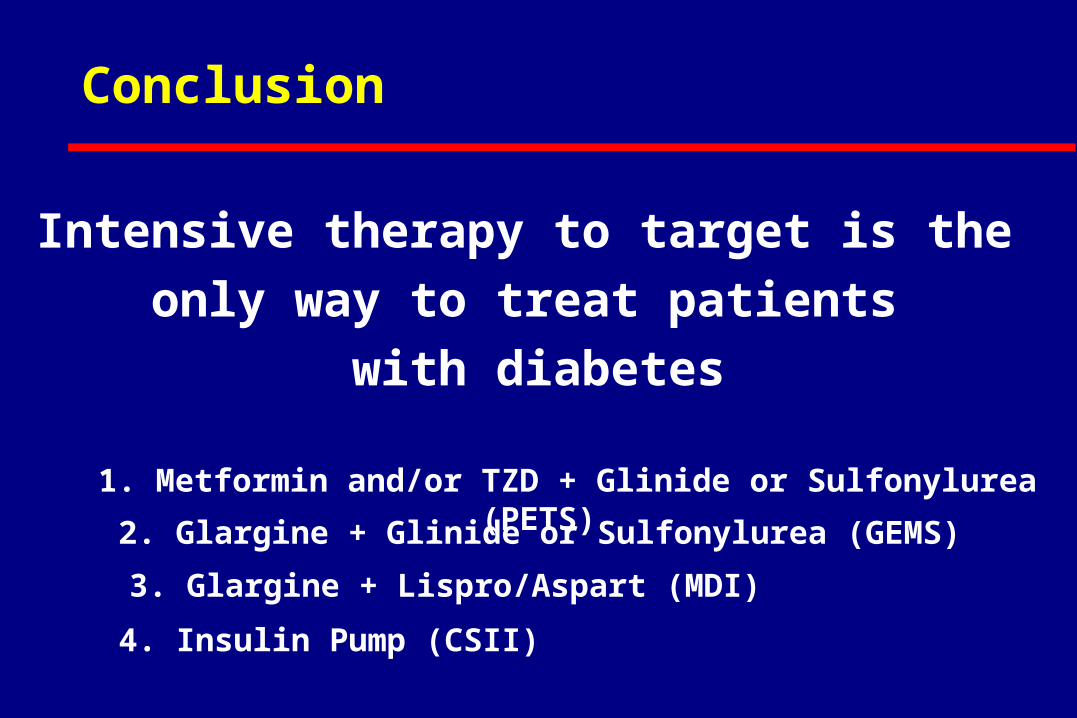
Conclusion
Intensive therapy to target is the
only way to treat patients
with diabetes
4. Insulin Pump (CSII)
3. Glargine + Lispro/Aspart (MDI)
2. Glargine + Glinide or Sulfonylurea (GEMS)
1. Metformin and/or TZD + Glinide or Sulfonylurea (PETS)
QUESTIONS?
For a copy or viewing of these slides
– Contact
• www.adaendo.com
How can I get use of Glucommander? (Computer-directed IV insulin program)
– Available for review on internet,
• www.glucommander.com
– Contact us: