Embed Size (px)
Citation preview
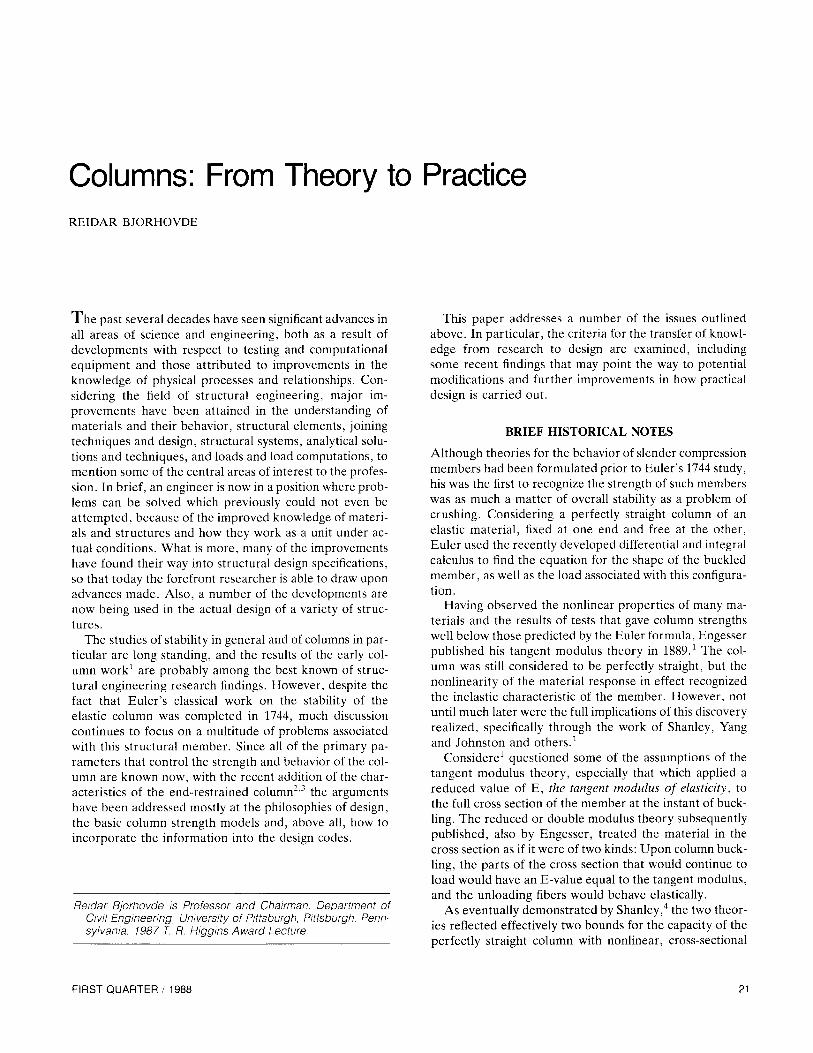
Columns: From Theory to Practice REIDAR BJORHOVDE
The past several decades have seen significant advances in all areas of science and engineering, both as a result of developments with respect to testing and computational equipment and those attributed to improvements in the knowledge of physical processes and relationships. Considering the field of structural engineering, major improvements have been attained in the understanding of materials and their behavior, structural elements, joining techniques and design, structural systems, analytical solutions and techniques, and loads and load computations, to mention some of the central areas of interest to the profession. In brief, an engineer is now in a position where problems can be solved which previously could not even be attempted, because of the improved knowledge of materials and structures and how they work as a unit under actual conditions. What is more, many of the improvements have found their way into structural design specifications, so that today the forefront researcher is able to draw upon advances made. Also, a number of the developments are now being used in the actual design of a variety of structures.
The studies of stability in general and of columns in particular are long standing, and the results of the early column work^ are probably among the best known of structural engineering research findings. However, despite the fact that Euler's classical work on the stabihty of the elastic column was completed in 1744, much discussion continues to focus on a multitude of problems associated with this structural member. Since all of the primary parameters that control the strength and behavior of the column are known now, with the recent addition of the characteristics of the end-restrained column '- the arguments have been addressed mostly at the philosophies of design, the basic column strength models and, above all, how to incorporate the information into the design codes.
Reidar Bjorhovde is Professor and Chairman, Department of Civil Engineering, University of Pittsburgfi, Pittsburgh!, Pennsylvania. 1987 T. R. Higgins Award Lecture.
This paper addresses a number of the issues outlined above. In particular, the criteria for the transfer of knowledge from research to design are examined, including some recent findings that may point the way to potential modifications and further improvements in how practical design is carried out.
BRIEF HISTORICAL NOTES
Although theories for the behavior of slender compression members had been formulated prior to Euler's 1744 study, his was the first to recognize the strength of such members was as much a matter of overall stabihty as a problem of crushing. Considering a perfectly straight column of an elastic material, fixed at one end and free at the other, Euler used the recently developed differential and integral calculus to find the equation for the shape of the buckled member, as well as the load associated with this configuration.
Having observed the nonlinear properties of many materials and the results of tests that gave column strengths well below those predicted by the Euler formula, Engesser pubhshed his tangent modulus theory in 1889. The column was still considered to be perfectly straight, but the nonlinearity of the material response in effect recognized the inelastic characteristic of the member. However, not until much later were the full imphcations of this discovery realized, specifically through the work of Shanley, Yang and Johnston and others.^
Considered questioned some of the assumptions of the tangent modulus theory, especially that which applied a reduced value of E, the tangent modulus of elasticity, to the full cross section of the member at the instant of buck-Ung. The reduced or double modulus theory subsequently published, also by Engesser, treated the material in the cross section as if it were of two kinds: Upon column buck-Hng, the parts of the cross section that would continue to load would have an E-value equal to the tangent modulus, and the unloading fibers would behave elastically.
As eventually demonstrated by Shanley,"^ the two theories reflected effectively two bounds for the capacity of the perfectly straight column with nonlinear, cross-sectional
FIRST QUARTER / 1988 21
behavior. Thus, the tangent modulus load was shown to be a lower bound, meaning it was the lowest load at which the column could remain perfectly straight, and the reduced modulus load was an upper bound only attainable under ideal circumstances.
Both of the above strength theories can reflect the influence of nonlinearity caused by yielding in parts of the cross section. The studies of residual stress effects conducted (Refs. 1 and 5 are but a small sample of the extensive literature on this subject) showed that upon adding an axial, appUed load stress to the existing residual stress distribution in a member, local yielding would start when the sum of the two was equal to the yield stress. Increasing the axial load caused the yielding to spread further throughout the cross section. Only the remaining elastic portion of the member would be capable of offering resistance to any buckling tendency. This was the truly significant impact of the tangent modulus theory, since it therefore could be applied to determine the critical load for a perfectly straight column made under realistic conditions in a steel mill.
The Euler and the tangent modulus solutions for the column were both of the closed-form type, since the buckling capacities could be found as one-step solutions of a differential equation based on mechanistic principles. This is typical of a classical stability problem and similar eigenvalue phenomena. On the other hand, it was recognized all along that real columns were not perfectly straight. Column strength solutions for crooked members based on reaching a certain limiting, maximum stress, were used for the development of many design curves. Collectively known as secant formulas, these basically reflected the combination of axial load and bending moment, where the latter was supplied by the axial load times the deflection of the member. Some well-known design curves of this type were the Tredgold and Rankine-Gordon formulas.^ The limiting condition was usually that of the maximum stress-reaching yield or a given fraction thereof. However, the disadvantage of these solutions was that none of them were capable of taking into account the inelastic reserve capacity of the column. This means the strength was set equal to the load that caused first yield only, and no aUowance was made for the fact a large portion of the cross section still was elastic and therefore possessed additional capacity.
The secant solutions all suffered from the closed-form solution syndrome, coupled with the limitation of the maximum stress. However, it was recognized that in order to find the maximum strength of an initiaUy crooked column which also contained residual stresses, a step-by-step or iterative solution procedure was required. This was needed to estabhsh the extent of yielding in the cross section at a given axial load, and the load would have to increase in small steps or increments to find the magnitude corresponding to the peak of the axial load vs. lateral deflection curve for the member.
For all practical purposes, the solution of the incremental, iterative maximum strength problem was not obtained until the advent of digital computers. The numerical procedure outlined in the preceding has been discussed in detail in several publications.^'^'^ This was not achieved until the early 1970s, because of the complexity of the problem. At this point, a number of design specifications utilize column formulas based on maximum strength criteria, i.e., the AISC Load and Resistance Factor Design Specification,^ the Canadian limit-states design standard^ and many others. It represents a significant conceptual change from earlier design codes, which were mostly based on tangent modulus criteria (i.e., the AISC allowable stress design specification, since its 6th Edition).^^
The most recent, and one of the major advances in the level of understanding of column strength phenomenon, has been made in the last five years. To facilitate column design rules, customary practice is to use the pinned-end column as the basic member, even though it has been acknowledged aU along that in a real structure, true pinned-ends do not exist. Extensive research by Chen and oth-j.g2,3,6,ii j ^g documented the strength effects of having
column ends restrained by reahstic beam-to-column connections, although at this time the influence is being considered in the overall structural design, and not in the column formula. This wiU be discussed in detail later.
Summarizing the historical developments, the state-of-the-art of the understanding of column strength and behavior reflect members that contain residual stresses, that are initial curved, and whose ends are restrained in the way real structures act. It is therefore clear that primary column strength parameters have been identified and quantified; some other effects still need to be examined, such as straightening procedures used in the steel miUs when shapes are rolled. But by and large, from the researchers' standpoint, the column problem has been solved. The difficulties remaining focus on how to take advantage of improvements in the design codes, without making them unnecessarily complex and difficult for the practicing engineer. This is the essence of many discussions continuing in design code committees. Some of these items will be addressed in the following.
COLUMN STRENGTH PARAMETERS
Other than the length, whose effect on the strength of columns is very weU known, the primary parameters of influence can be itemized as follows:
1. Grade of steel 2. Manufacturing method 3. Size of the cross section 4. Shape of the cross section 5. Axis of bending 6. Magnitude of the initial crookedness 7. Degree of end restraint Most of the items in this listing are recognized as essen-
22 ENGINEERING JOURNAL / AMERICAN INSTITUTE OF STEEL CONSTRUCTION
tial factors in the assessment of the maximum strength of columns. Thus, the influence of the steel grade, the shape of the cross section and the axis of bending is understood, and will not be discussed any further here. The method of manufacturing determines the shape, and to a certain extent the magnitudes of the peak values of the residual stress distribution. Reference 1 gives an exhaustive examination of causes and effects of the residual stresses in rolled and welded shapes and plates, and any additional description in the following is limited to some recent findings which may have an effect on the way compression members are used and designed. The examination will therefore deal only with items 3, 6 and 7 of the column strength parameters tabulation.
THE STRENGTH OF HEAVY COLUMNS
In general, the residual stresses in plates and shapes assume negative (compressive) values in the regions of the cross section that cools first, and positive (tensile) values in the areas that cool the last. Thus, the flange tips of rolled wide-flange shapes will exhibit compression, as wifl the rolled edges of universal mill plates, to mention two primary categories of steel products used for structural purposes. Similarly, the web-to-flange junction of the wide-flange shapes wiU usually be in tension, and so will the weld metal regions of welded built-up shapes and the flame-cut edges of plates and shapes.
The patterns of variation of the residual stresses in shapes and plates are known. Reference 1 and others give excellent examples of specific cases as well as trends. To give a very brief review, the typical across-the-flange distribution in rolled wide-flange shapes is generally parabolic or linear, with a maximum compressive stress varying between 0.3 times the yield stress and 0.75 times the yield stress, depending on the size of the component plates of the cross section. In particular, the flange thickness has been found an important indicator, confirming similar results as they apply to residual stresses in hot-rolled plates. ' ' ' ' "^ As is readily understood, for columns the compressive residual stress is the important one.
The web of the wide-flange shapes usually exhibits tensile residual stresses. But since the flanges control the flex-ural stiffness, and especially for minor axis buckling, the web data are less important. Finally, the grade of steel plays a minor role, with the result that the residual stress distributions and magnitudes are essentially the same, whether the shape is made from 36 ksi yield-stress steel or 100 ksi steel.
It was determined residual stresses could also vary in the through-thickness direction of the plate elements. For example, the difference between stresses measured on the surfaces of plates and those in the interior could be as high as 5 ksi. ' ' "* However, it was also shown the effect of this characteristic on column strength would generally be small, in all likelihood due to the fact only relatively small
areas of the cross section were affected. ' "^ This finding has a significant influence on the modeling of the column cross section in preparation for maximum strength computations, since the latter is greatly simplified if the through-thickness variation does not have to be considered.
The picture is not as clear when it comes to welded built-up, wide-flange shapes, although certain trends are known. Thus, a shape welded from universal mifl plates will have a more unfavorable distribution than the corresponding rolled one, especially if the shape is small. ' ^ The reason is the weld metal deposited wifl be the last to cool; it generally will have residual tension around 65 to 70 ksi. For the overall shape to maintain cross-sectional equi-Hbrium, the pre-welding stresses have been increased as a result of the heat input and subsequent cooUng of the welds. This is the reason some design specifications^ do not permit use of welded shapes made from universal mifl plates.
Flame cutting introduces intense heat in a small area of a cross section. This wifl be the last part of the plate or shape to cool, therefore it ends up being stressed in tension. The tensile residual stress in such a region will be about the same as that of a weld, or 65 to 70 ksi. However, since a wide-flange shape using flame-cut plates for flanges will exhibit residual tension at the flange tips, its column strength and behavior is preferable over other types.^'^'^^
As previously indicated for roUed plates and shapes, the controlling (i.e. compressive) residual stresses had been found to be correlated positively to the largest component plate thickness. This is also true for welded shapes that use universal mill plates, but the data are not at all decisive as far as welded shapes with flame-cut edges go. ' ' ^ This led to the conclusion that, relatively speaking, the column strength of very heavy shapes would be lower than that of smaller ones. In other words, it was not possible to derive as much benefit from using a heavy cross section as the added area would seem to indicate, because of the unfavorable residual stresses.
It is emphasized in the preceding, the absolute value of the column strength of the heavy shape is still large. But it was felt the choice of such a shape would not necessarily be an economical one. ' '* An early research study, however, proposed that, because of the effect of the large thickness, the design strength of such compression members should be lowered, when expressed as a multiple of the yield load of the cross section.^^ As a guideline, the separation between "heavy" and "light" was made for a flange thickness of one inch, although it was noted data used to support this recommendation were limited and needed to be verified through systematic studies of heavy shapes.
Questions were encountered as a result of the suggestions made regarding the use and design of heavy columns. Part of the problem clearly was related to the fact the heavy column database was very limited. A study was undertaken consequently to investigate the characteristics of
FIRST QUARTER/1988 23

the strength of heavy columns, considering the effects of steel grade, method of manufacture, weld metal and flame cutting usage, among others.^^ To the author's knowledge, this is the first time heavy column strength has been investigated systematically and with a view to the response of small and medium size shapes, as well as to current and future design practices. As will be shown, the database was limited to shapes for which the residual stress distributions were known. This was done to make the findings compatible with those obtained for smaller sections. A necessary limitation, the results obtained are nevertheless a rational extension of current knowledge and point the way to practical applications.
Heavy Column Shapes and Materials
The heavy shapes incorporated into the analysis are given in Tables 1 and 2 for hot-rolled and welded built-up wide-flange shapes, respectively. Two of the rolled shapes were of European manufacture, as noted. The residual stress data for the shapes were obtained from research reports and published papers, ' ' ' '*' ' ' ^ as were the material properties also given in the tables. Further, the tables show the largest component plate thickness for each section. This was used as part of the overall identification evaluation of the data to determine the primary geometric parameter for the heavy columns. The research paper that describes the study in detail includes the additional factors examined.^^ It is shown the two European shapes are directly comparable to American ones, in particular the shapes W14x426 and HD400x685 are virtually identical.
Table 1: Heavy-rolled Wide-flange Shapes
Shape
W12X120 HD260X274* W14X426 HD400X685* W14X730
Yield Stress (ksi)
36 and 50 28
36 and 50 25
36 and 50
Overall Dia. (in.)
13.12 X 12.32 12.83 X 10.87 18.67 X 16.70 18.94 X 16.97 21.75 X 18.00
Max. t (in.)
1.11 1.97 3.04 3.15 5.00
* European rolled shapes (Arbed, S.A., Luxembourg).
Table 2: Heavy-welded, Built-up Wide-flange Shapes
Shape
H12X210 H20X354 H24X428 H 14x15 H24X1122
Yield Stress (ksi)
36 and 50 36 and 50 36 and 50 36 and 50 36 and 50
Overall Dia. (in.)
13.0 X 12.0 24.0 X 20.0 24.0 X 24.0 14.55 X 13.8 24.0 X 24.0
Max. t (in.)
2.0 2.0 2.0 2.36 6.0
Note the residual stress data were available for each shape in a single steel grade only. However, because the stress magnitudes are independent of the yield stress of the steel, it was decided to augment the column strength population by using the same residual stress data for the
same shapes, but in other steel grades. Thus, most tests had been run with 36 ksi steel; the 50 ksi grade material was added.
The maximum strength computation technique used in the study followed accepted procedures, as developed in earher studies.^ Thus, using a member with a given level of initial out-of-straightness, and determining the axial load that was required for equilibrium at every increment of lateral deflection of the column, the technique permitted evaluation of the spread of yielding in the cross section as the load level increased and for the solution of the maximum strength of the column. To determine whether different levels of initial crookedness would have different influences on the maximum strength of the columns, several such values were used as the starting points for the calculations. Thus, column strength data were developed for all of the above shapes for e-values of 1/500, 1/1,000, 1/1,500 and 1/2,000. Finally, the computations were carried out for a range of slenderness ratios, to permit development of complete column curves for each of the cases.
It is readily understood that with the examination parameters developed as described in the preceding, the total data set produced included a large number of column curves for heavy shapes.
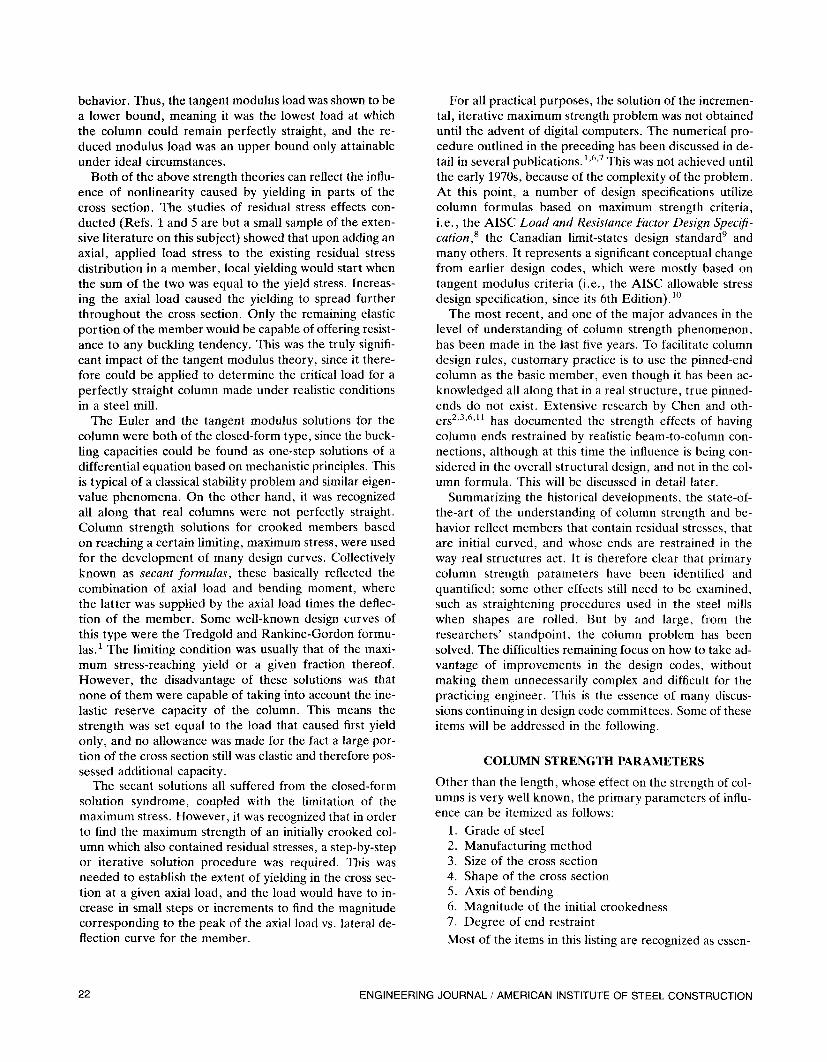
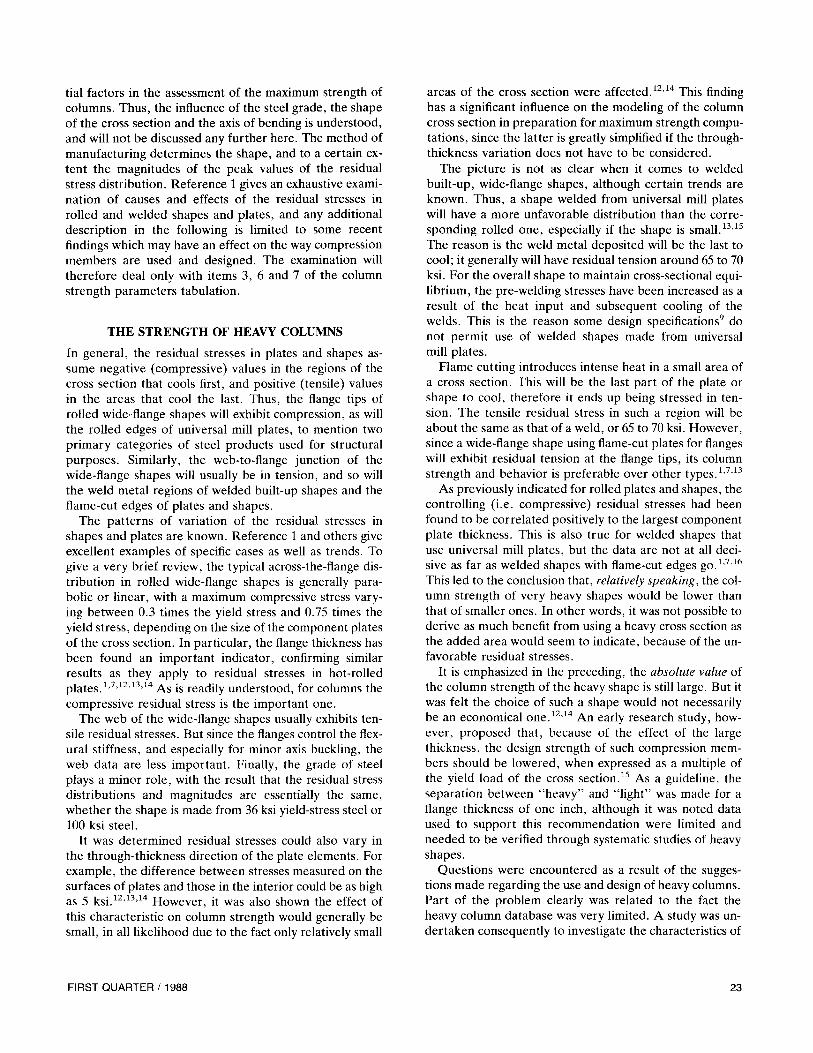
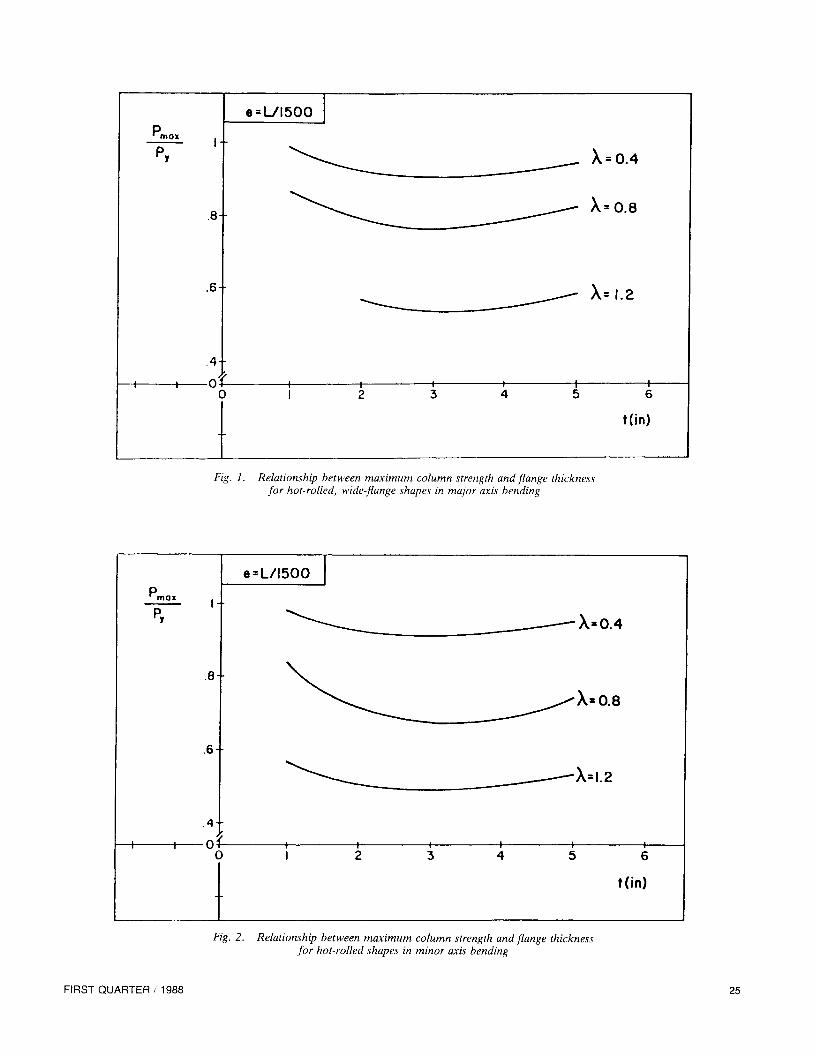
To determine the geometric term which would be most representative for the heavy-column cross section, the computation results were analyzed with respect to the relationship to factors such as the flange and web thicknesses, the overaU dimensions, as given in Col. 3 of Tables 1 and 2, the term bt/dw and several others.^^ It was found the flange thickness by itself was the most useful term, as wefl as the one easiest to interpret. This finding also ties in with earlier work,^'^^ which separated light and heavy at a flange thickness of one inch. A collection of the results is in Figs. 1 and 2, where the average curves for the relationships between the relative maximum strength and the flange thickness are given for three typical slenderness terms. The figures give the data for columns with initial crookedness values of 1/1,500, the one which formed the basis for the AISC LRFD column curve.^
The figures demonstrate some very important results for hot-roUed shapes. First, it appears column buckUng about both principal axes is affected equaUy by the thickness variation. Secondly, short column strength is virtually not influenced at aU (the figures indicate the curves for X-value of 0.4, which corresponds to a slenderness ratio KL/r of around 36, for 36 ksi steel), and the very long columns do not experience a significant drop in strength either. The latter is shown by the lower curves, whose X-value corresponds to a slenderness ratio of approximately 108 for A36 steel.
The important information is given by the middle curves of Figs. 1 and 2. For minor axis buckling in particular, the drop in column strength that occurs as the flange thickness increases from 1 to approximately 3 inches amounts to roughly 15%. In addition, the slenderness of
24 ENGINEERING JOURNAL / AMERICAN INSTITUTE OF STEEL CONSTRUCTION
p * max
1 • • • • • • '
.8-
.6-
.4-
C
e = L/l500
> 1
) 1 1 2
1 3
1 4
X = 0.4
^ . -^ X=0.8
.^^ X=l.2
• • 1
5 6
t(in)
Fig. 1. Relationship between maximum column strength and flange thickness for hot-rolled, wide-flange shapes in major axis bending
14
•8 +
.6
.4 +
-) Oi
e=L/l500
X»0.4
•X»0.8
•X=l.2
t(in)
Fig. 2. Relationship between maximum column strength and flange thickness for hot-rolled shapes in minor axis bending
FIRST QUARTER/1988 25
0.8 that applies to the middle curves reflects a KL/r-value of 72, which is in the middle of the very common and important structural slenderness range. It is understood this reflects the influence of the flange thickness only. All of the other column strength parameters have been kept constant. It is also important to note that following the dip in capacity, the strength then increases as the thickness goes beyond 3 to 3.5 inches towards 5 inches and larger. The reason for this is simply that shapes with such large thicknesses generally have a large cross-sectional area and this makes up for the decrease caused by the thickness effect.
The data in Figs. 1 and 2 represent rolled shapes only. For welded shapes, the effects are not clear at this time.^^ The thickness influence is certainly a great deal less important for such shapes. However, further research needs to address this subject in detail.
The question now is, what can or should one do with results of this kind? It would appear important to be able to incorporate the thickness effect in some form in the column design criteria, although it would not be realistic to expect the column formula itself could cover it. The most likely outcome may be to deal with this problem through a modification of the resistance factor, when large shapes are to be used. In past usage, this variation from nominal capacity would be covered by the factor of safety.
INITIAL OUT-OF-STRAIGHTNESS EFFECTS
It has been mentioned the AISC allowable stress design (ASD) specification^^ uses a column strength formula based on the tangent modulus concept. Hence, the column is assumed to be perfectly straight, although the effects of residual stresses are accounted for.
In the original development of the ASD formula, it was recognized real columns are normally initially crooked; and also the crookedness could have a significant effect on load-carrying capacity. To account for this influence, it was decided to introduce a factor of safety which increased in value as the column length became larger, up to a certain maximum. It was also felt this would be a convenient way to take into account the effects of phenomena such as eccentricity of load, etc. The decision consequently was made to use a factor of safety that increased from 1.67 at a slenderness ratio of zero, to a value of 1.92 for slenderness ratios equal to or greater than the value separating elastic and inelastic buckling Q . This was done on the express premise the most significant influence of the crookedness was found in the intermediate slenderness ratio range; for very short and for very long columns other strength factors would override the effects of the initial curvature.
The materials delivery standards^^ and other documents specify the maximum level of out-of-straightness that can be tolerated, from a product quaUty standpoint only. For example, rolled wide-flange shapes are allowed a crookedness no larger than 1/1,000, and tubular shapes are allowed
no more than 1/500. Actual values have been measured, to some extent, although the generally available data are sparse. However, it has been found an average of approximately 1/1,500 prevails for the wide-flange shapes used in North America, with a coefficient of variation of around 10%.^ Tubes are fabricated so actual e-values tend to be significantly smaller than the maximum aflowable. Thus, the average e for tubes is on the order of 1/6,000. ^
Initial Out-of-straightness for Design Use
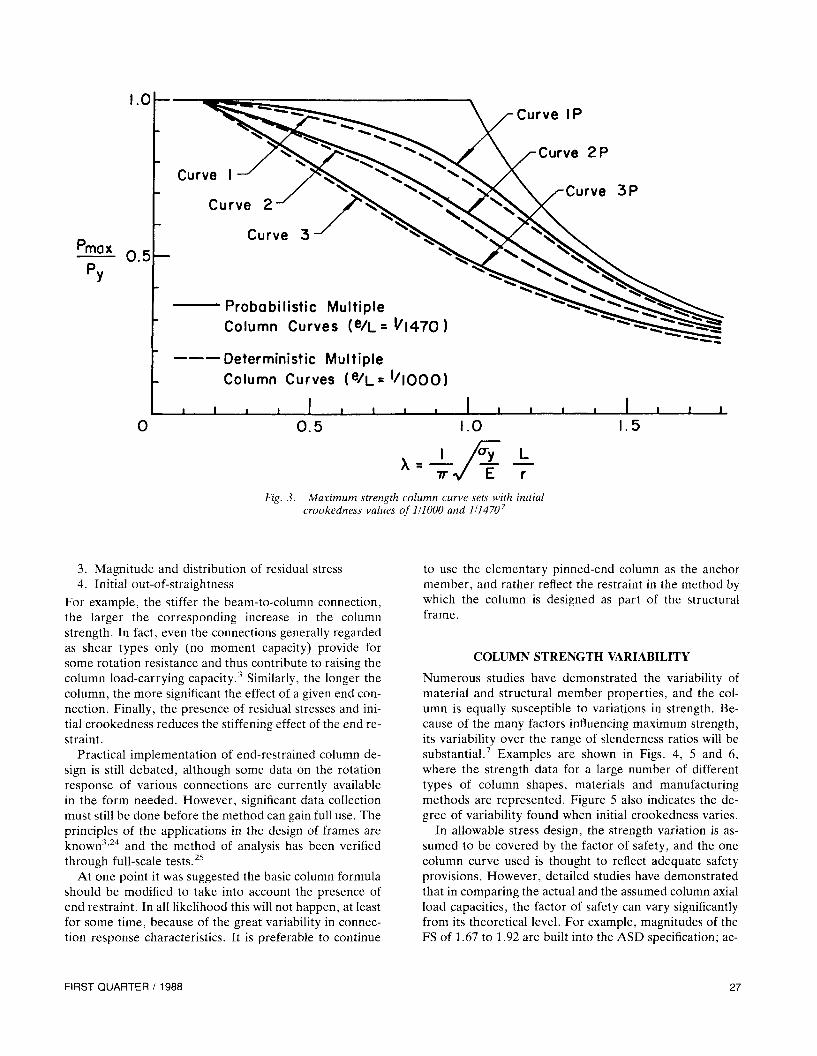
In the development of maximum strength formulas for LRFD-type specifications the question arose early on what the most suitable value of e would be. It was found the maximum permissible out-of-straightness generaUy was around 1/1,000, independent of country or other design jurisdiction. To adhere to what was regarded as conservative practice, it was decided to utilize the maximum value as the basic one for the development of the column design equations. Research on column strength curves was conducted using this as one of the central values.' ' ^ In the U.S. this led to formulation of what is now known as the SSRC (Structural Stability Research Council) Curves.^'^ Numerous design standards were prepared on this basis. For example, the Canadian limit-states code,^ the European recommendations^^ and others aU used the 1/1,000 magnitude.
However, in more advanced evaluations of LRFD criteria, which made use of first-order, second-moment principles of rehability theory,^^ it was observed that since means and standard deviations formed the bases for the development of the strength requirements, it would be rational and reasonable to use the mean out-of-straightness, along with its variability, to form the basic input value in the column strength computations. As a result, it was decided the mean of 1/1,500 should be the focal value for e, and design curves were developed on this basis.^'^'^
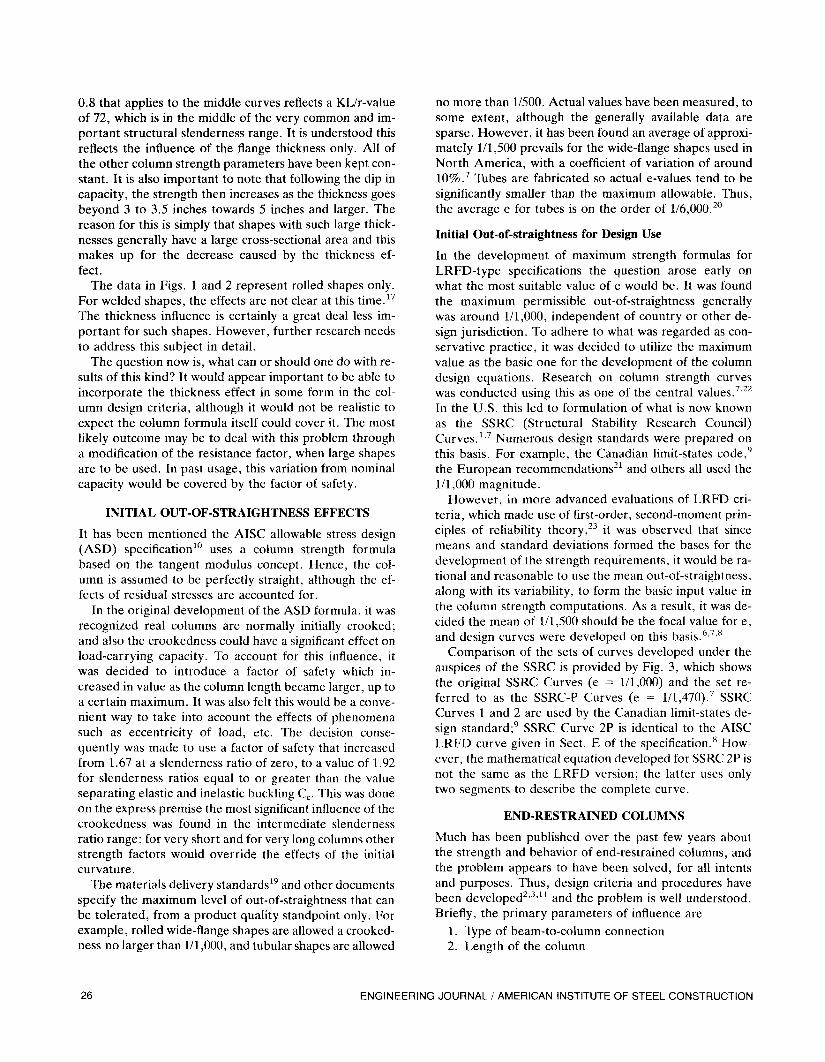
Comparison of the sets of curves developed under the auspices of the SSRC is provided by Fig. 3, which shows the original SSRC Curves (e = 1/1,000) and the set referred to as the SSRC-P Curves (e = 1/1,470).^ SSRC Curves 1 and 2 are used by the Canadian Hmit-states design standard;^ SSRC Curve 2P is identical to the AISC LRFD curve given in Sect. E of the specification.^ However, the mathematical equation developed for SSRC 2P is not the same as the LRFD version; the latter uses only two segments to describe the complete curve.
END-RESTRAINED COLUMNS
Much has been published over the past few years about the strength and behavior of end-restrained columns, and the problem appears to have been solved, for all intents and purposes. Thus, design criteria and procedures have been developed^- ' ^ and the problem is well understood. Briefly, the primary parameters of influence are
1. Type of beam-to-column connection 2. Length of the column
26 ENGINEERING JOURNAL / AMERICAN INSTITUTE OF STEEL CONSTRUCTION
max 0.5
Curve IP
Curve 2P
Curve 3P
— Probabilistic Multiple Column Curves (^ /L^ ' /KTO)
— Deterministic Multiple Column Curves (®/L= ' / | 0 0 0 )
-Ji t I I I I I i _ 0.5 1.0 1.5
TT V E r
Fig. 3. Maximum strength column curve sets with initial crookedness values of 1/1000 and 111470^
3. Magnitude and distribution of residual stress 4. Initial out-of-straightness
For example, the stiffer the beam-to-column connection, the larger the corresponding increase in the column strength. In fact, even the connections generally regarded as shear types only (no moment capacity) provide for some rotation resistance and thus contribute to raising the column load-carrying capacity.^ Similarly, the longer the column, the more significant the effect of a given end connection. Finally, the presence of residual stresses and initial crookedness reduces the stiffening effect of the end restraint.
Practical implementation of end-restrained column design is still debated, although some data on the rotation response of various connections are currently available in the form needed. However, significant data collection must still be done before the method can gain full use. The principles of the applications in the design of frames are known ' "* and the method of analysis has been verified through full-scale tests.^^
At one point it was suggested the basic column formula should be modified to take into account the presence of end restraint. In all likelihood this will not happen, at least for some time, because of the great variability in connection response characteristics. It is preferable to continue
to use the elementary pinned-end column as the anchor member, and rather reflect the restraint in the method by which the column is designed as part of the structural frame.
COLUMN STRENGTH VARIABILITY
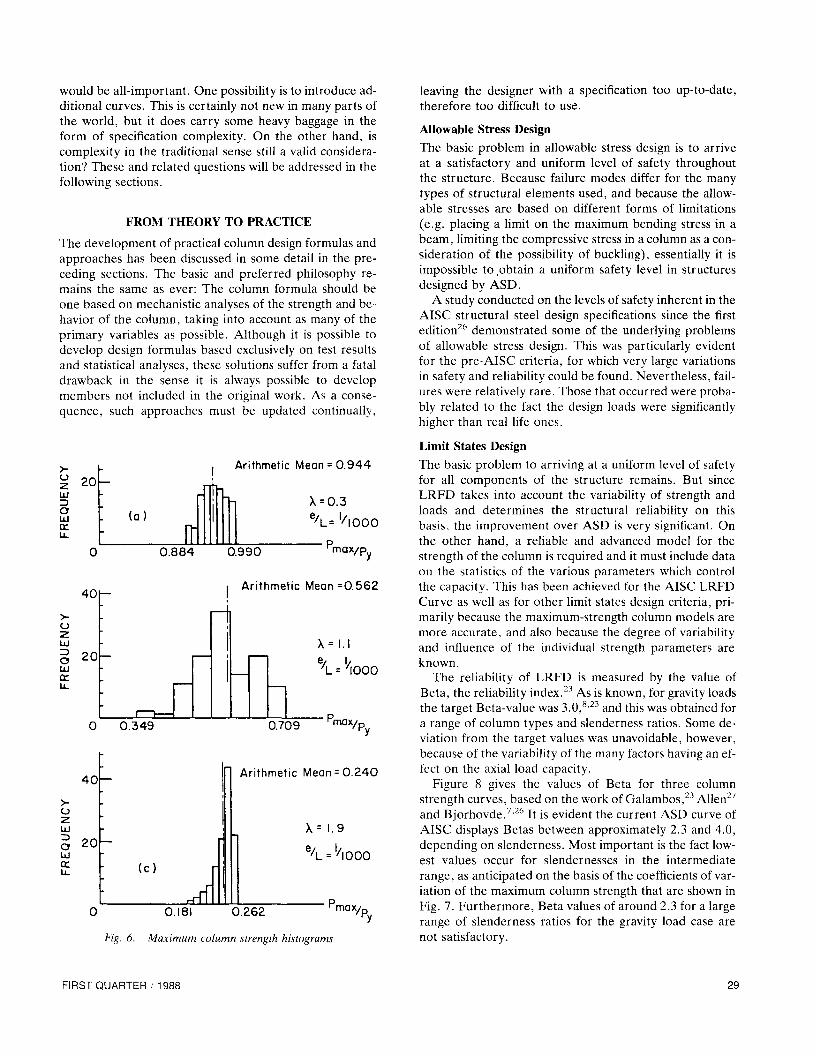
Numerous studies have demonstrated the variability of material and structural member properties, and the column is equally susceptible to variations in strength. Because of the many factors influencing maximum strength, its variability over the range of slenderness ratios will be substantial.^ Examples are shown in Figs. 4, 5 and 6, where the strength data for a large number of different types of column shapes, materials and manufacturing methods are represented. Figure 5 also indicates the degree of variabiHty found when initial crookedness varies.
In allowable stress design, the strength variation is assumed to be covered by the factor of safety, and the one column curve used is thought to reflect adequate safety provisions. However, detailed studies have demonstrated that in comparing the actual and the assumed column axial load capacities, the factor of safety can vary significantly from its theoretical level. For example, magnitudes of the FS of 1.67 to 1.92 are built into the ASD specification; ac-
FIRST QUARTER/1988 27

I.oh 1*
" cr
1° J
oV-^® o^Vt VV A
x =
1.0
IT * E r
F/g. 4. Column strength variation in tests
tual data exhibit factors as low as 1.4 and as high as 2.5.^^ In LRFD, the strength variation is covered by the value
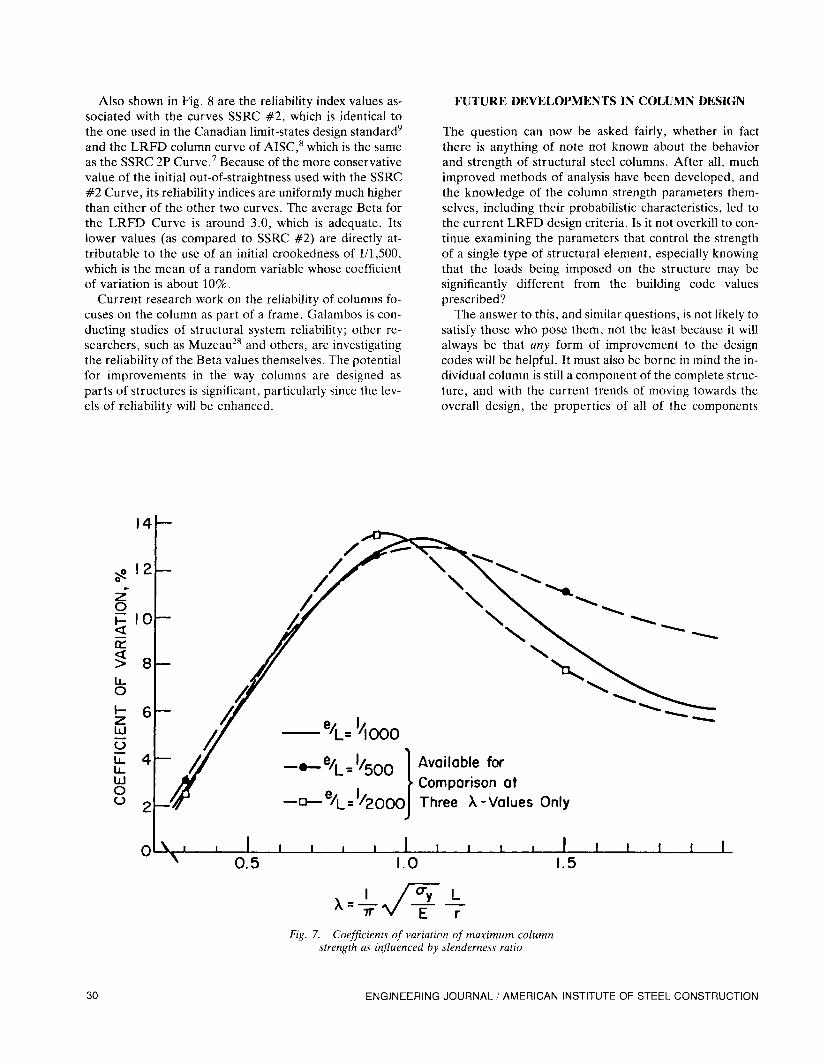
of the resistance factor, which has been specifically determined to give an adequate level of rehability when the strength as well as the load variations occur. This is a distinct improvement over the ASD approach, but some form of simplification has still been used. Thus, it is known column strength varies differently at different slen-derness ratios.^ As an illustration, Fig. 7 shows the influence of the slenderness ratio on the coefficient of variation of the maximum strength for three different initial out-of-straightnesses.^ Note the COV reaches a maximum for slendernesses around 1.0, which is also the region where residual stresses and initial crookedness combine to produce the most severe influence on the axial load capacity.
The value of the resistance factor used in the LRFD specification of AISC is 0.85, a reasonable value. On the other hand, would it be possible to increase the value, if a modified form of the column formula or an alternate method of design were devised? The potential economies could be substantial, but the form of the new requirements
1.0
Pmox 0.5
Upper Envelope Curves
2000
Lower Envelope Curves
.= '2000
\ = 500
J i_ 0.5
ig.5. Bands of
x= j_ IT
maximum
1.0
^ / ^ V E
\^
r column strength curves
1.5
28 ENGINEERING JOURNAL / AMERICAN INSTITUTE OF STEEL CONSTRUCTION
would be all-important. One possibility is to introduce additional curves. This is certainly not new in many parts of the world, but it does carry some heavy baggage in the form of specification complexity. On the other hand, is complexity in the traditional sense still a vahd consideration? These and related questions will be addressed in the following sections.
FROM THEORY TO PRACTICE
The development of practical column design formulas and approaches has been discussed in some detail in the preceding sections. The basic and preferred philosophy remains the same as ever: The column formula should be one based on mechanistic analyses of the strength and behavior of the column, taking into account as many of the primary variables as possible. Although it is possible to develop design formulas based exclusively on test results and statistical analyses, these solutions suffer from a fatal drawback in the sense it is always possible to develop members not included in the original work. As a consequence, such approaches must be updated continually,
20h-UJ 3 O UJ
Arithmetic Mean = 0.944
JTfh (a)
fri X = 0.3
1000
40
o 2 UJ
S 20f-
0.884 0.990 rriaVPy
I Arithmetic Mean =0.562
X=l . l e, 1/
X = nooo
0 0.349
40
o UJ
o 2 0 ^ -UJ Q:
II
(c)
^
0.709 ™Vp^
Arithmetic Mean = 0.240
X= 1.9
' /L = '/IOOO
0.181 0.262
Fig. 6. Maximum column strength histograms
max/
leaving the designer with a specification too up-to-date, therefore too difficult to use.
Allowable Stress Design The basic problem in allowable stress design is to arrive at a satisfactory and uniform level of safety throughout the structure. Because failure modes differ for the many types of structural elements used, and because the allowable stresses are based on different forms of limitations (e.g. placing a limit on the maximum bending stress in a beam, limiting the compressive stress in a column as a consideration of the possibility of buckling), essentially it is impossible to .obtain a uniform safety level in structures designed by ASD.
A study conducted on the levels of safety inherent in the AISC structural steel design specifications since the first edition^^ demonstrated some of the underlying problems of allowable stress design. This was particularly evident for the pre-AISC criteria, for which very large variations in safety and rehability could be found. Nevertheless, failures were relatively rare. Those that occurred were probably related to the fact the design loads were significantly higher than real life ones.
Limit States Design The basic problem to arriving at a uniform level of safety for all components of the structure remains. But since LRFD takes into account the variability of strength and loads and determines the structural rehability on this basis, the improvement over ASD is very significant. On the other hand, a rehable and advanced model for the strength of the column is required and it must include data on the statistics of the various parameters which control the capacity. This has been achieved for the AISC LRFD Curve as well as for other limit states design criteria, primarily because the maximum-strength column models are more accurate, and also because the degree of variability and influence of the individual strength parameters are known.
The reliability of LRFD is measured by the value of Beta, the reliability index.^^ As is known, for gravity loads the target Beta-value was 3.0, ' ^ and this was obtained for a range of column types and slenderness ratios. Some deviation from the target values was unavoidable, however, because of the variability of the many factors having an effect on the axial load capacity.
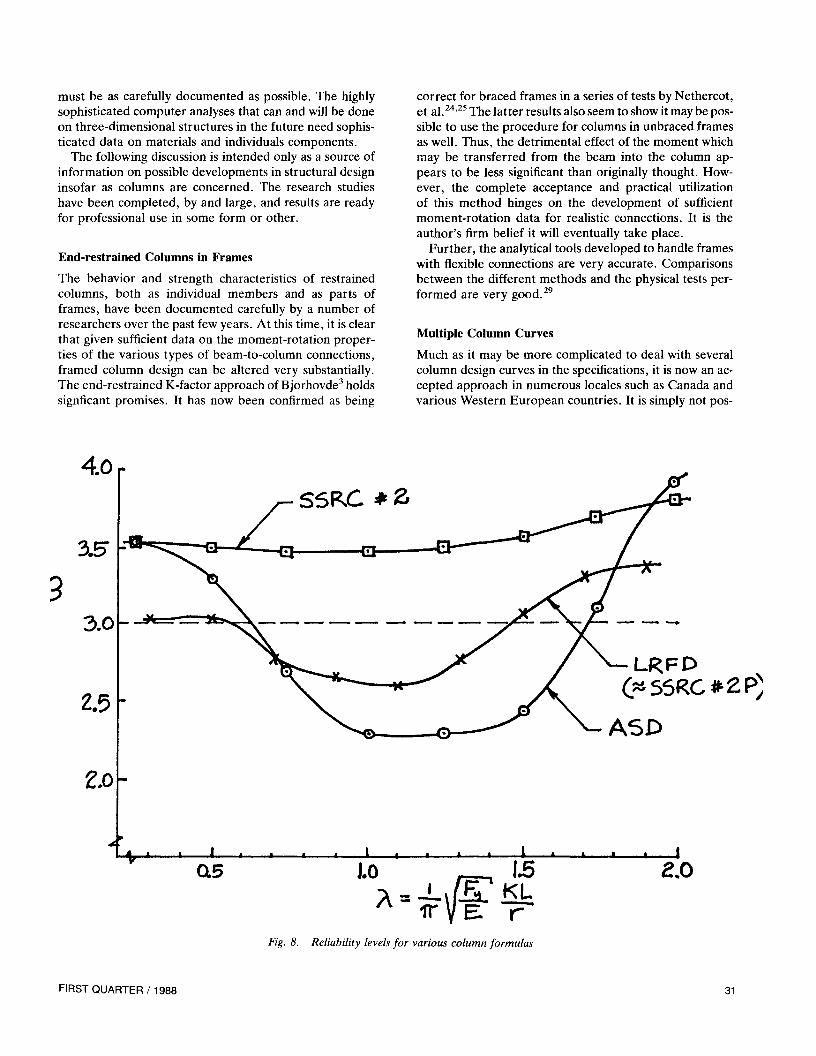
Figure 8 gives the values of Beta for three column strength curves, based on the work of Galambos,^^ Allen^^ and Bjorhovde.^'^^ It is evident the current ASD curve of AISC displays Betas between approximately 2.3 and 4.0, depending on slenderness. Most important is the fact lowest values occur for slendernesses in the intermediate range, as anticipated on the basis of the coefficients of variation of the maximum column strength that are shown in Fig. 7. Furthermore, Beta values of around 2.3 for a large range of slenderness ratios for the gravity load case are not satisfactory.
FIRST QUARTER / 1988 29
Also shown in Fig. 8 are the rehability index values associated with the curves SSRC #2, which is identical to the one used in the Canadian limit-states design standard^ and the LRFD column curve of AISC,^ which is the same as the SSRC 2P Curve.^ Because of the more conservative value of the initial out-of-straightness used with the SSRC #2 Curve, its reliabihty indices are uniformly much higher than either of the other two curves. The average Beta for the LRFD Curve is around 3.0, which is adequate. Its lower values (as compared to SSRC #2) are directly attributable to the use of an initial crookedness of 1/1,500, which is the mean of a random variable whose coefficient of variation is about 10%.
Current research work on the reliability of columns focuses on the column as part of a frame. Galambos is conducting studies of structural system reliability; other researchers, such as Muzeau^^ and others, are investigating the rehability of the Beta values themselves. The potential for improvements in the way columns are designed as parts of structures is significant, particularly since the levels of reliability will be enhanced.
FUTURE DEVELOPMENTS IN COLUMN DESIGN
The question can now be asked fairly, whether in fact there is anything of note not known about the behavior and strength of structural steel columns. After all, much improved methods of analysis have been developed, and the knowledge of the column strength parameters themselves, including their probabilistic characteristics, led to the current LRFD design criteria. Is it not overkill to continue examining the parameters that control the strength of a single type of structural element, especially knowing that the loads being imposed on the structure may be significantly different from the building code values prescribed?
The answer to this, and similar questions, is not Ukely to satisfy those who pose them, not the least because it will always be that any form of improvement to the design codes will be helpful. It must also be borne in mind the individual column is still a component of the complete structure, and with the current trends of moving towards the overall design, the properties of all of the components
\ ' ^ ^ / -^ I JL E r
Fig. 7. Coefficients of variation of maximum column strength as influenced by slenderness ratio
30 ENGINEERING JOURNAL / AMERICAN INSTITUTE OF STEEL CONSTRUCTION
must be as carefully documented as possible. The highly sophisticated computer analyses that can and will be done on three-dimensional structures in the future need sophisticated data on materials and individuals components.
The following discussion is intended only as a source of information on possible developments in structural design insofar as columns are concerned. The research studies have been completed, by and large, and results are ready for professional use in some form or other.
End-restrained Columns in Frames
The behavior and strength characteristics of restrained columns, both as individual members and as parts of frames, have been documented carefully by a number of researchers over the past few years. At this time, it is clear that given sufficient data on the moment-rotation properties of the various types of beam-to-column connections, framed column design can be altered very substantially. The end-restrained K-factor approach of Bjorhovde^ holds signficant promises. It has now been confirmed as being
correct for braced frames in a series of tests by Nethercot, et al. " ' ^ The latter results also seem to show it may be possible to use the procedure for columns in unbraced frames as well. Thus, the detrimental effect of the moment which may be transferred from the beam into the column appears to be less significant than originally thought. However, the complete acceptance and practical utilization of this method hinges on the development of sufficient moment-rotation data for realistic connections. It is the author's firm belief it will eventually take place.
Further, the analytical tools developed to handle frames with flexible connections are very accurate. Comparisons between the different methods and the physical tests performed are very good.^^
Multiple Column Curves
Much as it may be more complicated to deal with several column design curves in the specifications, it is now an accepted approach in numerous locales such as Canada and various Western European countries. It is simply not pos-
4.0 r
3.5-
3.0
Z5
Z.0
LRFD
v- as 2.0
Fig. 8. Reliability levels for various column formulas
FIRST QUARTER/1988 31
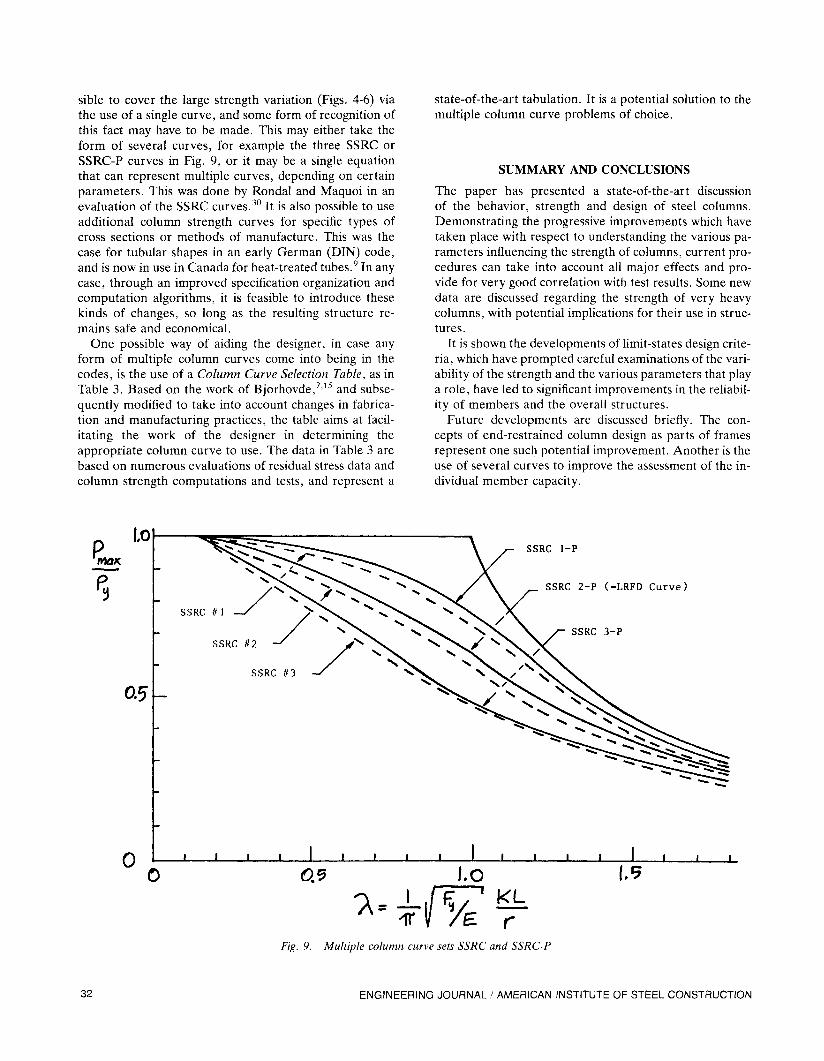
sible to cover the large strength variation (Figs. 4-6) via the use of a single curve, and some form of recognition of this fact may have to be made. This may either take the form of several curves, for example the three SSRC or SSRC-P curves in Fig. 9, or it may be a single equation that can represent multiple curves, depending on certain parameters. This was done by Rondal and Maquoi in an evaluation of the SSRC curves.^^ It is also possible to use additional column strength curves for specific types of cross sections or methods of manufacture. This was the case for tubular shapes in an early German (DIN) code, and is now in use in Canada for heat-treated tubes.^ In any case, through an improved specification organization and computation algorithms, it is feasible to introduce these kinds of changes, so long as the resulting structure remains safe and economical.
One possible way of aiding the designer, in case any form of multiple column curves come into being in the codes, is the use of a Column Curve Selection Table, as in Table 3. Based on the work of Bjorhovde,^'^^ and subsequently modified to take into account changes in fabrication and manufacturing practices, the table aims at facilitating the work of the designer in determining the appropriate column curve to use. The data in Table 3 are based on numerous evaluations of residual stress data and column strength computations and tests, and represent a
state-of-the-art tabulation. It is a potential solution to the multiple column curve problems of choice.
SUMMARY AND CONCLUSIONS
The paper has presented a state-of-the-art discussion of the behavior, strength and design of steel columns. Demonstrating the progressive improvements which have taken place with respect to understanding the various parameters influencing the strength of columns, current procedures can take into account all major effects and provide for very good correlation with test results. Some new data are discussed regarding the strength of very heavy columns, with potential implications for their use in structures.
It is shown the developments of Hmit-states design criteria, which have prompted careful examinations of the variability of the strength and the various parameters that play a role, have led to significant improvements in the reUabil-ity of members and the overall structures.
Future developments are discussed briefly. The concepts of end-restrained column design as parts of frames represent one such potential improvement. Another is the use of several curves to improve the assessment of the individual member capacity.
P to
0.5
0
r"
r
L
p
h~
r"
P
' ""QS oSL ^ - I i.. A ^ ^ ; ; ^ ^ . ^ ^ ^ : c -..... . ^^^ \ ^ SSRC I -P
^ ^ . ^^^^^^^ "^ ^ ^ ^ V^ ^ ^ S ^ «««i^^*''N^^ *S^ ^^"^S^^ / \
> \ S . ^ < ^ V ^ ^ v^*^^^ / \ ^ - ^^^^ 2"^ (-LRFD Curve)
SSRC in —X > ^ N . ^^^^^N^ ^^^^v X ^ X ^ s . ^ ' w ^ ^^S.-^ X
/ "^^V O N ^ ^ \ >V \ y SSRC 3-P SSRC //2 - ^ y ^ ^ v \ ^ ^ > ^ ^ >v >c
/ \ >v V ^ C ^ > / \
SSRC //3 - ^ VS^,^ ^^"^^^^^ V S ^ ^ V
^ ^ ^ ^ ^ "" X. ^ ^ ^ v ^ ^ v T ^ ' ^ ^ s ^ ' ^ ^ ' ^ ^ ^ S ^
^ *'****«»«* ^^^^^^ ^ " ^ ^ ^ ^'>>-::^^ C ' ^ ^ ^ ^
^ ^ ^ ^ s ^ ^ ^ ^ ^ ^ ^
"^^^^^^^C^^^ ^^ ^ ^ ^
- J \ 1 1 1 1 1 1 1 1 1 1 1 i 1 t 1 1
0.5 I.O (.5
^- TV YE — Fig. 9. Multiple column curve sets SSRC and SSRC-P
32 ENGINEERING JOURNAL / AMERICAN INSTITUTE OF STEEL CONSTRUCTION
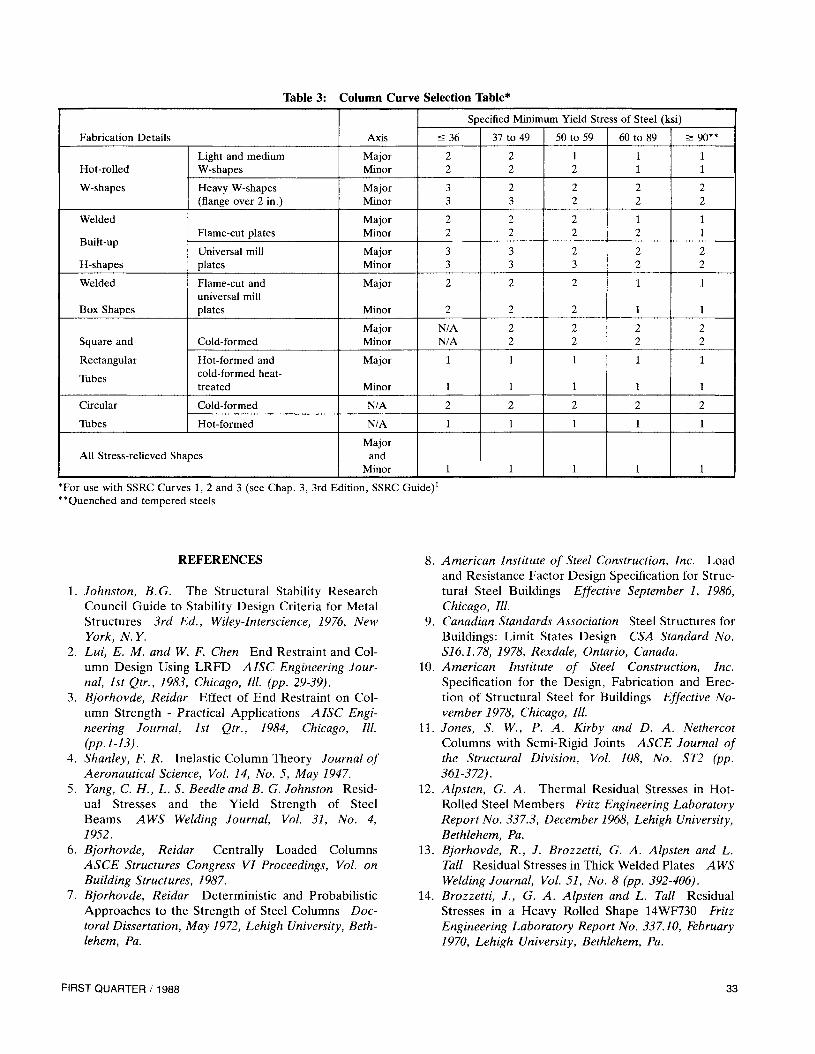
Table 3: Column Curve Selection Table*
1 Fabrication Details
Hot-rolled
W-shapes
1 Welded
Built-up
H-shapes
1 Welded
Box Shapes
Square and
Rectangular
Tubes
Circular
Tubes
Light and medium W-shapes
Heavy W-shapes (flange over 2 in.)
Flame-cut plates
Universal mill plates
Flame-cut and universal mill plates
Cold-formed
Hot-formed and cold-formed heat-treated
Cold-formed
Hot-formed
All Stress-relieved Shapes
Axis
Major Minor
Major Minor
Major Minor
Major Minor
Major
Minor
Major Minor
Major
Minor
N/A
N/A
Major and
Minor
Specified Minimum Yield Stress of Steel (ksi) |
< 3 6
2 2
3 3
2 2
3 3
2
2
N/A N/A
1
1
2
1
1
37 to 49
2 2
2 3
2 2
3 3
2
2
2 2
1
1
2
1
1
50 to 59
1 2
2 2
2 2
2 3
2
2
2 2
1
1
2
1
1
60 to 89
1 1
2 2
1 2
2 2
1
1
2 2
1
1
2
1
1
> 90**
1 1 1
2 1 2 1 1 1 1
2 1 2 1 1 1
1
2
2 1 1 1
1
2
1 1
1 1 *For use with SSRC Curves 1, 2 and 3 (see Chap. 3, 3rd Edition, SSRC Guide)^ ** Quenched and tempered steels
REFERENCES
1. Johnston, B.G. The Structural Stabihty Research Council Guide to Stability Design Criteria for Metal Structures 3rd Ed., Wiley-Interscience, 1976, New York, N.Y.
2. Lui, E. M. and W. F. Chen End Restraint and Column Design Using LRFD A ISC Engineering Journal, 1st Qtr., 1983, Chicago, III. (pp. 29-39).
3. Bjorhovde, Reidar Effect of End Restraint on Column Strength - Practical Applications AISC Engineering Journal, 1st Qtr., 1984, Chicago, III. (pp.1-13).
4. Shanley, F. R. Inelastic Column Theory Journal of Aeronautical Science, Vol. 14, No. 5, May 1947.
5. Yang, C. H., L. S. Beedle and B. G. Johnston Residual Stresses and the Yield Strength of Steel Beams AWS Welding Journal, Vol. 31, No. 4, 1952.
6. Bjorhovde, Reidar Centrally Loaded Columns ASCE Structures Congress VI Proceedings, Vol. on Building Structures, 1987.
1. Bjorhovde, Reidar Deterministic and Probabilistic Approaches to the Strength of Steel Columns Doctoral Dissertation, May 1972, Lehigh University, Bethlehem, Pa.
10
11
American Institute of Steel Construction, Inc. Load and Resistance Factor Design Specification for Structural Steel Buildings Effective September 1, 1986, Chicago, III. Canadian Standards Association Steel Structures for Buildings: Limit States Design CSA Standard No. S16.1.78, 1978, Rexdale, Ontario, Canada. American Institute of Steel Construction, Inc. Specification for the Design, Fabrication and Erection of Structural Steel for Buildings Effective November 1978, Chicago, III. Jones, S. W., P. A. Kirby and D. A. Nethercot Columns with Semi-Rigid Joints ASCE Journal of the Structural Division, Vol. 108, No. ST2 (pp. 361-372).
12. Alpsten, G. A. Thermal Residual Stresses in Hot-Rolled Steel Members Fritz Engineering Laboratory Report No. 337.3, December 1968, Lehigh University, Bethlehem, Pa. Bjorhovde, R., J. Brozzetti, G. A. Alpsten and L. Tall Residual Stresses in Thick Welded Plates AWS Welding Journal, Vol. 51, No. 8 (pp. 392-406). Brozzetti, J., G. A. Alpsten and L. Tall Residual Stresses in a Heavy Rolled Shape 14WF730 Fritz Engineering Laboratory Report No. 337.10, February 1970, Lehigh University, Bethlehem, Pa.
13
14
FIRST QUARTER/1988 33
15. Bjorhovde, Reidar and L. Tall Maximum Column Strength and the Muhiple Column Curve Concept Fritz Engineering Laboratory Report No, 337.29, October 1971, Lehigh University, Bethlehem, Pa.
16. McFalls, R. K. and L. Tall A Study of Welded Columns Manufactured from Flame-Cut Plates AWS Welding Journal, Vol. 48, No. 4.
17. Al-Shihri, M. and Reidar Bjorhovde The Strength of Heavy Columns Paper in Preparation, 1987, University of Pittsburgh, Pittsburgh, Pa.
18. Aschendorff, K. K., A. Bernard, O. Bucak, F. Mang and A. Plumier Knickuntersuchungen an Gewalzten Stiitzen mit I-Querschnitt aus St 37 und St 52 mit Grosser Flanschdicke und aus St E 460 mit Standardabmessungen Der Bauingenieur, Vol. 58, 1983 (pp. 261-268).
19. American Society for Testing and Materials ASTM Standard A6, 1987, Philadelphia, Pa.
20. Bjorhovde, Reidar and P. C. Birkemoe Limit States Design of HSS Columns Canadian Journal of Civil Engineering, Vol. 5, No. 2 (pp. 276-291).
21. European Economic Community Eurocode 3: Limit States Design of Steel Structures 1986, Brussels, Belgium.
22. Beer, H. and G. Schultz Bases Theoriques des Courbes Europeennes de Flambement Construction Metallique, No. 3, 1970, Paris, France.
23. Galambos, T. V. and M. K. Ravindra Load and Resistance Factor Design ASCE Journal of the Structural Division, Vol. 104, No. ST9.
24. Davison, J. B., P. A. Kirby and D. A. Nethercot Semi-Rigid Connections in Isolation and in Frames Connections and the Behavior, Strength and Design of Steel Structures, Elsevier Applied Science Publishers, 1988, England.
25. Kirby, P. A., J. B. Davison and D. A. Nethercot Large Scale Tests on Column Subassemblages and Frames Connections and the Behavior, Strength and Design of Steel Structures, Elsevier Applied Science Publishers, 1988, England.
26. Bjorhovde, Reidar The Safety of Steel Columns ASCE Journal of the Structural Division, Vol. 104, No. ST3 (pp. 463-477).
27. Allen, D. E. Limit States Design - A ProbabiHstic Study Canadian Journal of Civil Engineering, Vol. 2, 1975 (pp. 36-49).
28. Museau, J.-P. Modele de ITnfluence dTmperfections sur la Securite des Structures Metalliques en Comportement Non-Lineaire These de Doctorat d'Etat, May 1987, Universite Blaise Pascal, Clermont-Ferrand, France.
29. Bjorhovde, R., J. Brozzetti and A. Colson (Editors) Connections and the Behavior, Strength and Design of Steel Structures International Workshop Proceedings, 1987, Cachan, France (published by Elsevier Applied Science Publishers, 1988, England.
30. Rondal, J. and R. Maquoi Single Equation for SSRC Column Strength Curves ASCE Journal of the Structural Division, Vol. 105, No. STl (pp. 247-250).
34 ENGINEERING JOURNAL / AMERICAN INSTITUTE OF STEEL CONSTRUCTION