Embed Size (px)
Citation preview

B O N N E V I L L E P O W E R A D M I N I S T R A T I O N
Columbia River OperationOverview

B O N N E V I L L E P O W E R A D M I N I S T R A T I O N
FCRPS Background• The US Army Corps of Engineers (USACE) and
the Bureau of Reclamation (BOR) operate the 31 federal dams for multiple public purposes:– Flood Control– Navigation– Fish Operations (Endangered Species Act, Clean Water
Act)– Irrigation– Recreation– Resource Integration– Reliability– Safety
• “High Priority Objectives” = Flood Control, Reliability, Safety Fish Operations,

B O N N E V I L L E P O W E R A D M I N I S T R A T I O N
Regional Stakeholders• In addition to Bonneville, the Corps and Reclamation, there are a
number of other stakeholders in the region– National Oceanic and Atmospheric Administration
• National Marine Fisheries Service mission is to protect habitats under the Endangered Species Act (ESA)
– States of Oregon, Washington, Idaho, and Montana• Federal and non-Federal hydro projects on rivers which pass through 4 states
– Canada (BC Hydro manages water; Powerex markets power)• Watersheds in Canada feed into the Columbia River• Columbia River Treaty
– Tribal interests• Columbia Basin Fish Accords – partnership between federal agencies, states
and tribes to manage and protect natural resources in the Pacific Northwest– Recreation
• Boating, camping, fishing, marinas, vacation homes, races– Irrigation– Resource Integration– Rate Payers
Planning and coordinating the operation of the FCRPS is very complex and involves many different competing interests

B O N N E V I L L E P O W E R A D M I N I S T R A T I O N
Uncertainty and Flexibility - Today• Uncertainty
– Streamflows: significant variation in annual average runoff as well as day-to-day streamflows
– Loads: dependent upon accurate temperature forecasts– Contracts: counter-parties behavior dependent upon power
market prices– Resource Performance: unit outages and intermittent resources– Project Operations:
• Present and future BiOp requirements reduce FCRPS capability and flexibility
• Non-Federal reservoir operations: Mid-Columbia, Hells Canyon, Canada
– Flood control, recreation, irrigation, fish mitigation, etc…– Market Depth: is there sufficient depth in the market to handle
resulting inventory?• Flexibility
– The ability of FCRPS resources to respond to changing conditions– More operational constraints = less operational flexibility

B O N N E V I L L E P O W E R A D M I N I S T R A T I O N
FCRPS Background• October - September average runoff 133 million
acre feet (Maf) measured at The Dalles (roughly ranges from 80 – 196 Maf)– Geographical differences between major sources of snowpack
results in timing differences between when the runoff starts (called “runoff shape”)
• Federal storage about 30 Maf, which is a fraction of the annual runoff – The Colorado and Missouri systems can store two to three times
the annual runoff

B O N N E V I L L E P O W E R A D M I N I S T R A T I O N
Water Year Runoff (Oct-Sep) at The Dalles1929-2011*
0
10
20
30
40
50
60
70
80
90
100
110
120
130
140
150
160
170
180
190
200
210
22019
29
1931
1933
1935
1937
1939
1941
1943
1945
1947
1949
1951
1953
1955
1957
1959
1961
1963
1965
1967
1969
1971
1973
1975
1977
1979
1981
1983
1985
1987
1989
1991
1993
1995
1997
1999
2001
2003
2005
2007
2009
2011
Oct
ober
- Se
ptem
ber R
unof
f (m
af)
Average = 135 maf*WY 2011: Observed Oct-May, Estimated for Jul-Sep as of June
Final Forecast
• 1 Maf is approximately equal to 1000 MW-mos but the amount of energy can vary depending upon where in the basin the water comes from
Hydrological Data

B O N N E V I L L E P O W E R A D M I N I S T R A T I O N
Streamflow Uncertainty
The Volume Forecast Jan 5 was ~77.4 maf
The Volume Forecast July 15 was ~123 maf

B O N N E V I L L E P O W E R A D M I N I S T R A T I O N
Comparison of Storage Volume to Variations in Runoff
8
020406080
100120140160180200
Volu
me
(Maf
)
Annual Runoff Storage
USACanada
Dry Years (78)
Average Years (134)
Wet Years (193)

B O N N E V I L L E P O W E R A D M I N I S T R A T I O N
020406080
100120140160180200220240
Columbia at The Dalles
Colorado Missouri RIVER BASINS
MIL
LIO
NS
OF
AC
RE
FEET
Average Annual RunoffUsable Reservoir Storage
Average Annual Runoff and Usable Reservoir StorageMajor Western River Basins

B O N N E V I L L E P O W E R A D M I N I S T R A T I O N
Comparison of space availablefor system flood control storage
2
5 3.2
1
4
1.3
3
5
Indicates total flood control space
available, in million acre-feet
Total space available for flood control:
Total active storage:24.5 MAF45 MAF

B O N N E V I L L E P O W E R A D M I N I S T R A T I O N
Federal Columbia River Power SystemStorage and Run-of-River Dams
Run-of-River Projects•Operating range up to 5 feet•A little active storage
Storage Projects•Operating range up to 225 feet•Active storage 16.5 million acre-feet

B O N N E V I L L E P O W E R A D M I N I S T R A T I O N
Changes in River Flows(since 1980)
0
100
200
300
400
500
600
Sep Oct Nov Dec Jan Feb Mar Apr May Jun Jul Aug
NaturalPre-CouncilCurrent BiOp
12

B O N N E V I L L E P O W E R A D M I N I S T R A T I O N
Monthly Operations in Average Water(Sept. – Nov.)
September: Refill to Grand Coulee 1283 ft. for Kokanee spawning Headwater Project finalize summer augmentation drafts and transition to
minimum flows. October: Vernita Bar Fall Chinook operation (50-100 kcfs) Prepare Grand Coulee to support the Bonneville Chum operation (125-
145kcfs) Banks Lake irrigation pumping ends November: Bonneville Chum and Vernita Bar Fall Chinook protection

B O N N E V I L L E P O W E R A D M I N I S T R A T I O N
Monthly Operations in Average Water(Dec. – Feb.)December:
High regional power demand Grand Coulee draft limited to 1270 ft. for power and Chum (1265 ft. during a cold snap) Vernita Bar operation continues Chum spawning operation ends ~12/31 transitions to protection operation. Headwater projects on minimum flows. Libby Dam January High regional power demand Grand Coulee operation limited to 85% probability of refill to April 10 objective. Bonneville Chum & Vernita Bar operations continue Headwater projects on Minimum flows or drafting for Flood ControlFebruary: Grand Coulee operation limited to 85% probability of refill to April 10 objective. Chum and Vernita Bar operations Continue Headwater projects on Minimum flows or drafting for Flood Control

B O N N E V I L L E P O W E R A D M I N I S T R A T I O N
Monthly Operations in Average Water(Mar. – May)
March: Grand Coulee operation limited to 85% probability of refill to April 10 objective. Banks Lake irrigation pumping begins Vernita Bar & Chum operations continue
April: Refill / draft storage projects to April 10 elevation objective to maximize flows in the mid-
Columbia for spring Steelhead and Chinook Draft storage projects to April 30 flood control elevations (all storage projects) Manage Grand Coulee to support the Priest Rapids Steelhead flow objective of 135 kcfs Snake River and Columbia River fish spill begins Spring McNary flow objective of 220 – 260 kcfs Chum operation ends MOP operation on the Lower Snake River begins
May: Maintain McNary and Priest Rapids flow objectives Support Vernita Bar stranding operations

B O N N E V I L L E P O W E R A D M I N I S T R A T I O NMcNary - Spring Outflow - All Years
0
50000
100000
150000
200000
250000
300000
350000
400000
450000
500000
1 3 5 7 9 11 13 15 17 19 21 23 25 27 29 31 33 35 37 39 41 43 45 47 49 51 53 55 57 59 61 63 65 67 69
cfs
220 kcfs
260 kcfs
McNary Spring Flow Average (April 15 –June)
70 WY Hydro-Regulation Results
53 / 70 WY Spring Flows above 220 kcfs
41 / 70 WY Spring Flows above 260 kcfs

B O N N E V I L L E P O W E R A D M I N I S T R A T I O N
Monthly Operations in Average Water(Jun. – Aug.)
June: Refill storage projects for summer recreation and summer flows Support McNary flow objective of 220 – 260 kcfs Support Vernita Bar stranding operation (typically ends some time in June)
July: Manage Storage projects to support McNary Flow objective of 200 kcfs
August: Draft storage projects for fish flow augmentation Fish spill ends at the end of August Banks Lake pumping reduced to draft 5’ for flow augmentation MOP operation on Lower Snake River ends

B O N N E V I L L E P O W E R A D M I N I S T R A T I O NMcNary - Summer Outflow - All Years
0
50000
100000
150000
200000
250000
300000
1 3 5 7 9 11 13 15 17 19 21 23 25 27 29 31 33 35 37 39 41 43 45 47 49 51 53 55 57 59 61 63 65 67 69
cfs
200 kcfs
19 / 70 Water Years Summer Flow Objective Met
McNary Summer Flow Average (July-August)
70 WY Hydro-Regulation Results

B O N N E V I L L E P O W E R A D M I N I S T R A T I O N
Changes in FCRPS Hydro Generation due toFish Requirements (2008 NOAA BiOp)
(Average of 70 water conditions)
Average Federal Generation Lost Due to Operations for Fish
-3500
-3000
-2500
-2000
-1500
-1000
-500
0
500
1000
1500
Oct
Nov
Dec Jan
Feb
Mar Apr
May Ju
n
Jul
Aug
Sep
Aver
age
MW
Average Annual Loss = ~1000 aMW

B O N N E V I L L E P O W E R A D M I N I S T R A T I O N
‐
50.0
100.0
150.0
200.0
250.0
BPA Direct Fish & Wildlife ProgramFY Expenditures (in Millions)
Capital Expense

B O N N E V I L L E P O W E R A D M I N I S T R A T I O N
Percentage of Spending Categories Allocated to F&W
FY 2010-2011Forecast($ in Millions)
UNSLICED 50-year Annual Average Hydro Operations Effects (Power Purchases & Foregone Revenues)
Fish and Wildlife Integrated Program
NPCC – Annual Average
US Fish & Wildlife Service – Annual AverageLower Snake Compensation Plan
Corps of Engineers O&M – Annual Average
Reclamation O&M – Annual Average
100%
50%
100%
~25%
~7%
Depreciation & Interest on COE / Reclamation / USF&WS Capital F&W Investments (based on Plant in Service)
Depreciation & Interest on BPA Direct Program Capital F&W Investments
Total Annual Average Cost of BPA Fish & Wildlife Actions
225.5 4.9
24.0 41.0 7.6
310.0 137.3 750.3 Total $
155.1 4.3
19.8 33.9 4.2
444.9 116.4 778.6
FY 2007-2009 Actuals
($ in Millions)
239.4 5.1
29.4 42.8 5.4
280.0 143.4 745.5

B O N N E V I L L E P O W E R A D M I N I S T R A T I O N
Model Input: Natural Streamflows at The Dalles for 2020’s & 2040’s
2020's Natural Flow at TDA: 70 year avg.
-50,000
100,000150,000200,000
250,000300,000350,000
400,000450,000500,000
550,000600,000
Oct
Nov
Dec Ja
n
Feb
Mar
Apr
I
Apr
II
May
June July
Aug
I
Aug
II
Sep
Qn
(cfs
)
'
Study 21: Base Study 23: MW/D Study 24: LW/W Study 25: MC
Study 26: C Study 27: MW/W Study 28: LW/D
2040's Natural Flow at TDA: 70 year avg.
-
50,000
100,000
150,000
200,000
250,000
300,000
350,000
400,000
450,000
500,000
550,000
600,000
Oct
Nov
Dec Ja
n
Feb
Mar
Apr I
Apr I
I
May
June
July
Aug
I
Aug
II
Sep
Qn
(cfs
)
'
Study 21: Base Study 29: LW/W Study 30: MC Study 31: LW/DStudy 32: C Study 33: MW/D Study 34: MW/W
Climate Change scenarios result in higher natural streamflows in the winter to spring period…
and lower streamflows in the summer, generally speaking
B O N N E V I L L E P O W E R A D M I N I S T R A T I O N
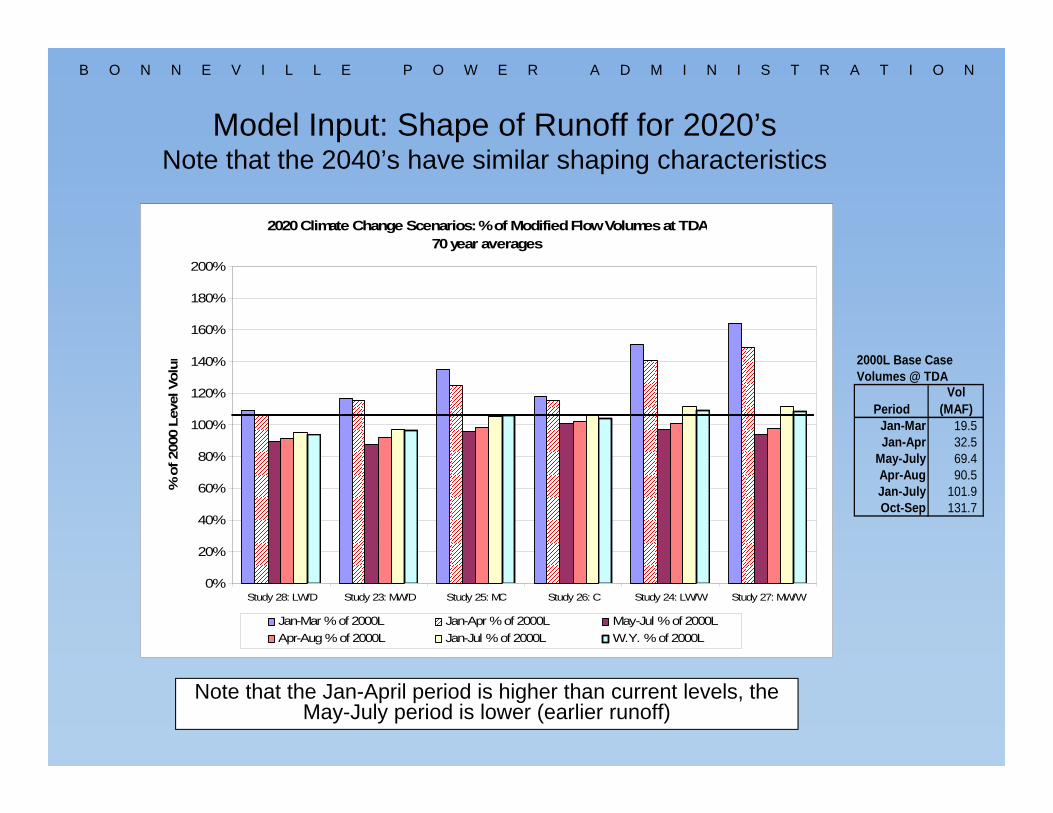
Model Input: Shape of Runoff for 2020’sNote that the 2040’s have similar shaping characteristics
Note that the Jan-April period is higher than current levels, the May-July period is lower (earlier runoff)
2020 Climate Change Scenarios: % of Modified Flow Volumes at TDA70 year averages
0%
20%
40%
60%
80%
100%
120%
140%
160%
180%
200%
Study 28: LW/D Study 23: MW/D Study 25: MC Study 26: C Study 24: LW/W Study 27: MW/W
% o
f 200
0 Le
vel V
olum
Jan-Mar % of 2000L Jan-Apr % of 2000L May-Jul % of 2000LApr-Aug % of 2000L Jan-Jul % of 2000L W.Y. % of 2000L
2000L Base CaseVolumes @ TDA
PeriodVol
(MAF)Jan-Mar 19.5 Jan-Apr 32.5
May-July 69.4 Apr-Aug 90.5 Jan-July 101.9 Oct-Sep 131.7

B O N N E V I L L E P O W E R A D M I N I S T R A T I O N
Lower Granite Discharge Comparisons to Base Case
24
Change in Average Discharge at Lower Granite
-30000
-20000
-10000
0
10000
20000
30000
Oct Nov Dec Jan Feb Mar Apr I Apr II May Jun Jul Aug I Aug II Sep
Qd
(cfs
)
'
2020s minus Base 2040s minus Base
B O N N E V I L L E P O W E R A D M I N I S T R A T I O N
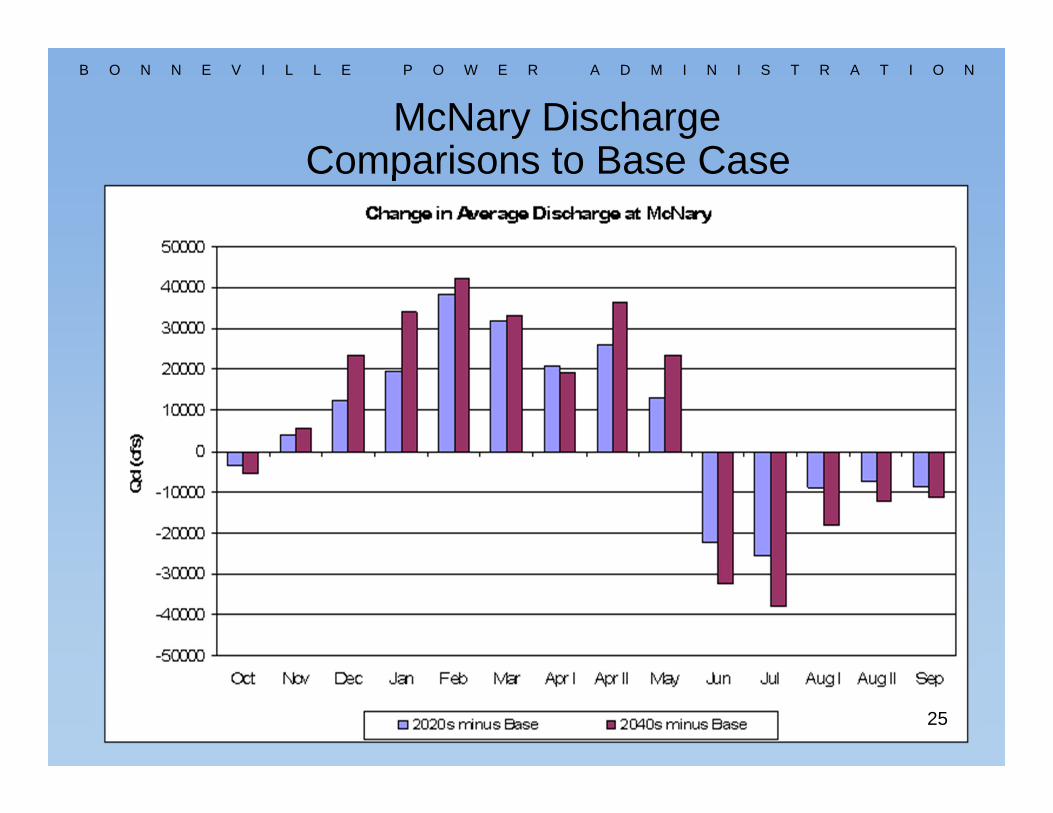
McNary DischargeComparisons to Base Case
25

B O N N E V I L L E P O W E R A D M I N I S T R A T I O N
Summary of Potential CC Impacts
Changes to: Winter SummerFlows Higher LowerDemand Lower HigherImpacts to:Power Better WorseFish Neutral WorseRevenue Higher Lower
B O N N E V I L L E P O W E R A D M I N I S T R A T I O N
BPA Partnerships and Investments• BPA is supportive of the Oregon Solutions and
other like initiatives and will work to continue improved coordination in support of these efforts.
• Commitments through our Accord agreements with the Umatilla Tribe as well as other project sponsors in the basin are critical to meeting our fish and wildlife mitigation objectives
• Significant investments have been made and planning for future like investments is underway. BPA would have concerns about initiatives that are at cross purposes with current and anticipated achievements.