Embed Size (px)
Citation preview
April 2010
Columbia River Project Water Use Plan Middle Columbia River (Year 3) Reference: CLBMON-23A White Sturgeon Spawn Monitoring Study: 2009 Investigations
Data Report Study Period: July and August 2009
Michael Hildebrand Golder Associates Ltd. 250-365-0344 ext. 222 [email protected]

April 2010
CLBMON-23A: MIDDLE COLUMBIA RIVER
White Sturgeon Spawn Monitoring Study: 2009 Investigations Data Report
REPO
RT
Report Number: 09-1480-0044F
Distribution:
4 copies - BC Hydro, Castlegar 3 copies - Golder Associates Ltd., Castlegar
Submitted to: BC Hydro 601 18th Street Castlegar, BC V1N 4G7
MIDDLE COLUMBIA RIVER WHITE STURGEON SPAWN MONITORING: 2009 INVESTIGATIONS DATA REPORT
April 2010 Report No. 09-1480-0044F i
Cover Photo: Downstream view of the middle Columbia River white sturgeon spawning area from approximately river kilometre 229.2.
Suggested Citation: Golder Associates Ltd. 2010. Middle Columbia River white sturgeon spawn monitoring: 2009 investigations data report. Report prepared for BC Hydro, Castlegar, B.C. Golder Report No. 09-1480-0044F: 20 p. + 2 app.
MIDDLE COLUMBIA RIVER WHITE STURGEON SPAWN MONITORING: 2009 INVESTIGATIONS DATA REPORT
April 2010 Report No. 09-1480-0044F ii
ACKNOWLEDGEMENTS Special thanks are extended to BC HYDRO as the funding source for the project and to James Crossman (BC Hydro, Castlegar) for support, advice, and assistance. We would also like to thank Denise Hutt (BC Hydro) for temperature and elevation data provided. Editorial review provided by James Crossman and Guy Martel.
The following employees of GOLDER ASSOCIATES LTD. contributed to the collection of data and the preparation of this report.
Michael Hildebrand, B.Sc., R.P.Bio. Fisheries Biologist, Author, Project Manager
Larry Hildebrand, B.Sc., R.P.Bio. Senior Fisheries Scientist, Editor, Project Director
Sarah Stephenson, B.Sc. Biologist, GIS
Bradley Hildebrand, B.Sc. Fisheries Biologist
Dustin Ford, B.SC., R.P.Bio. Fisheries Biologist
Demitria Burgoon, Tech. Dipl. Biological Technician
Steve Whitehead, Tech. Dipl. Biological Technician
Megan Crozier, Tech. Dipl. Biological Technician
The following employees of OKANAGAN NATION ALLIANCE contributed to the collection of data and/or the preparation of this report.
Natasha Audy, Tech. Dipl. Certified Technician
Casmir Tonasket Technician
MIDDLE COLUMBIA RIVER WHITE STURGEON SPAWN MONITORING: 2009 INVESTIGATIONS DATA REPORT
April 2010 Report No. 09-1480-0044F iii
EXECUTIVE SUMMARY The Arrow Lakes Reservoir (ALR) supports a small population of white sturgeon that has been studied since 1995. These studies indicate that spawning occurs intermittently (approximately 6 km downstream of Revelstoke Dam), but recruitment of juveniles from these spawning events has not been detected. In 2006, populations of white sturgeon in the Canadian portion of the Columbia River were listed as endangered under the federal Species at Risk Act (SARA).
The primary objectives of the Middle Columbia River white sturgeon spawn monitoring study were to assess sturgeon egg incubation sites and conditions downstream of Revelstoke Dam, determine the risk of egg stranding, and provide input to recommendations for the water allocation schedule for white sturgeon spawning and incubation. This study, the third year of an ongoing monitoring program, is a component of the Columbia River Water Use Plan, and complements a companion study assessing the feasibility of Dual-frequency Identification Sonar (DIDSON) to monitor the presence of white sturgeon in the Revelstoke spawning area.
White sturgeon spawn monitoring was conducted below Revelstoke Dam from 15 July to 27 August 2009. Egg collection mats (20 stations) and D-ring drift nets were used to collect white sturgeon eggs and free embryos. In total, 65 white sturgeon eggs and 18 free embryos were collected. Developmental staging of eggs and back-calculation to estimate spawn timing indicated spawning occurred on the 3rd, 8th, and 18th of August 2009. These three events increased the total number of spawning events detected in the study area since 1999 to 11 (3 in 1999, 2 in 2003, 1 in 2006, 2 in 2008, and 3 in 2009). Cold water (often less than 10°C) and variable flow and water temperature conditions continue to create uncertainty in the amount of time required by eggs to reach certain stages of development.
White sturgeon egg stranding was confirmed in 2009 following a flow reduction from Revelstoke Dam. Surveys in a portion of a large dewatered cobble/gravel bar situated downstream from the spawning area recovered seven eggs (estimated density of 0.24 eggs/m2). Additional data is required to assess whether this stranding rate is applicable to the entire cobble bar or other adjacent areas of the dewatered river bed.
Monitoring results did not provide additional insight into potential spawning cues. In 2008, the study results and re-examination of past data suggested that periods of increasing water temperatures may provide a spawning cue for white sturgeon in the middle Columbia River. The estimated timing of spawning events in 2009 indicated that one event may have occurred during a period of increasing water temperatures or during the peak of such a period, but the remaining two spawning events likely occurred during periods of decreasing temperatures.
The results indicated that the main egg deposition and incubation areas were the same as in past years and that egg collection mats and D-rings continue to be the most effective methods to monitor white sturgeon spawning. To date, the low number of spawning events and the highly variable physical environment within the spawning area confound our ability to address management questions related to the effects of Revelstoke Dam and ALR operations on egg and larval survival and whether modifications can be made to these operations to protect or enhance white sturgeon incubation habitat in the middle Columbia River.
MIDDLE COLUMBIA RIVER WHITE STURGEON SPAWN MONITORING: 2009 INVESTIGATIONS DATA REPORT
April 2010 Report No. 09-1480-0044F iv
Table of Contents
1.0 INTRODUCTION ............................................................................................................................................................... 1
1.1 Background.......................................................................................................................................................... 1
1.2 Objectives ............................................................................................................................................................ 1
1.3 Study Area ........................................................................................................................................................... 2
1.4 Study Period ........................................................................................................................................................ 2
2.0 METHODS ........................................................................................................................................................................ 5
2.1 Discharge, Water Temperature and Water Surface Elevations ........................................................................... 5
2.2 Sampling Methods ............................................................................................................................................... 5
2.2.1 Egg Collection Mats ....................................................................................................................................... 5
2.2.2 D-ring Sampling ............................................................................................................................................. 6
2.2.3 White Sturgeon Egg Stranding Survey ........................................................................................................... 7
2.2.4 Egg and Free Embryo Preservation, Staging and Estimation of Spawn Timing ............................................. 7
3.0 RESULTS ......................................................................................................................................................................... 7
3.1 Discharge, Water Temperature and Water Surface Elevations ........................................................................... 7
3.2 Sampling .............................................................................................................................................................. 9
3.2.1 Egg Collection Mats ....................................................................................................................................... 9
3.2.2 D-rings ........................................................................................................................................................... 9
3.2.3 White Sturgeon Egg Stranding Survey ......................................................................................................... 10
3.3 White Sturgeon Spawning Assessment ............................................................................................................. 10
4.0 DISCUSSION .................................................................................................................................................................. 12
4.1 Sampling Results ............................................................................................................................................... 12
4.1.1 LGL Limited DIDSON Surveys ..................................................................................................................... 13
4.2 Physical Parameters and Estimates of Spawn Timing ....................................................................................... 14
4.3 Comparison to Waneta Spawning Area ............................................................................................................. 15
4.4 Management Questions ..................................................................................................................................... 16
4.4.1 Management Question 1 .............................................................................................................................. 16
4.4.2 Management Question 2 .............................................................................................................................. 16
MIDDLE COLUMBIA RIVER WHITE STURGEON SPAWN MONITORING: 2009 INVESTIGATIONS DATA REPORT
April 2010 Report No. 09-1480-0044F v
4.4.3 Management Question 3 .............................................................................................................................. 16
4.4.4 Management Question 4 .............................................................................................................................. 16
4.4.5 Management Question 5 .............................................................................................................................. 17
5.0 RECOMMENDATIONS FOR FUTURE MONITORING................................................................................................... 17
6.0 LITERATURE CITED ...................................................................................................................................................... 18
APPENDICES APPENDIX A 2009 Sample Data
APPENDIX B Photographic Plates
MIDDLE COLUMBIA RIVER WHITE STURGEON SPAWN MONITORING: 2009 INVESTIGATIONS DATA REPORT
April 2010 Report No. 09-1480-0044F vi
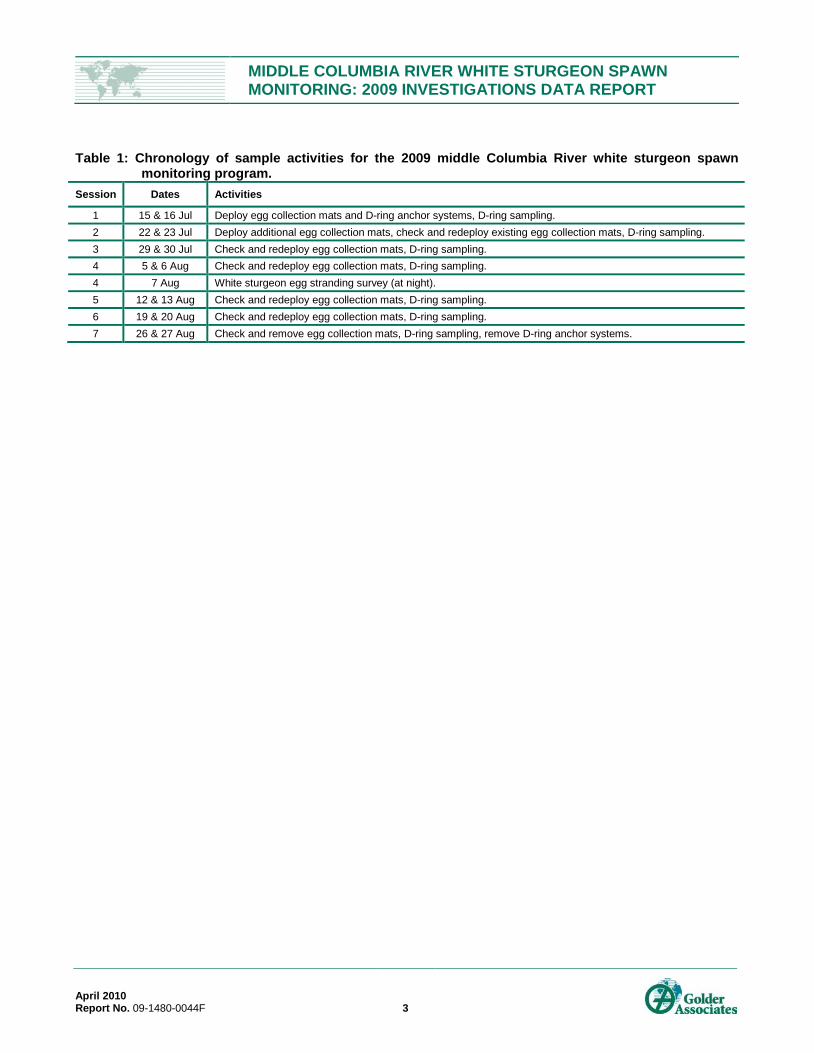
LIST OF TABLES Table 1: Chronology of sample activities for the 2009 middle Columbia River white sturgeon spawn monitoring
program. .................................................................................................................................................................... 3
Table 2: Summary of egg collection mat sampling in the middle Columbia River white sturgeon spawning area, July 15 to August 27, 2009. ................................................................................................................................................... 9
Table 3: Summary of D-ring sampling in the middle Columbia River white sturgeon spawning area, July 15 to August 27, 2009. ................................................................................................................................................................... 9
Table 4: Estimated timing of spawning events based on the developmental stages of captured eggs and mean water temperatures in the middle Columbia River during the 2009 white sturgeon spawning period. .............................. 12
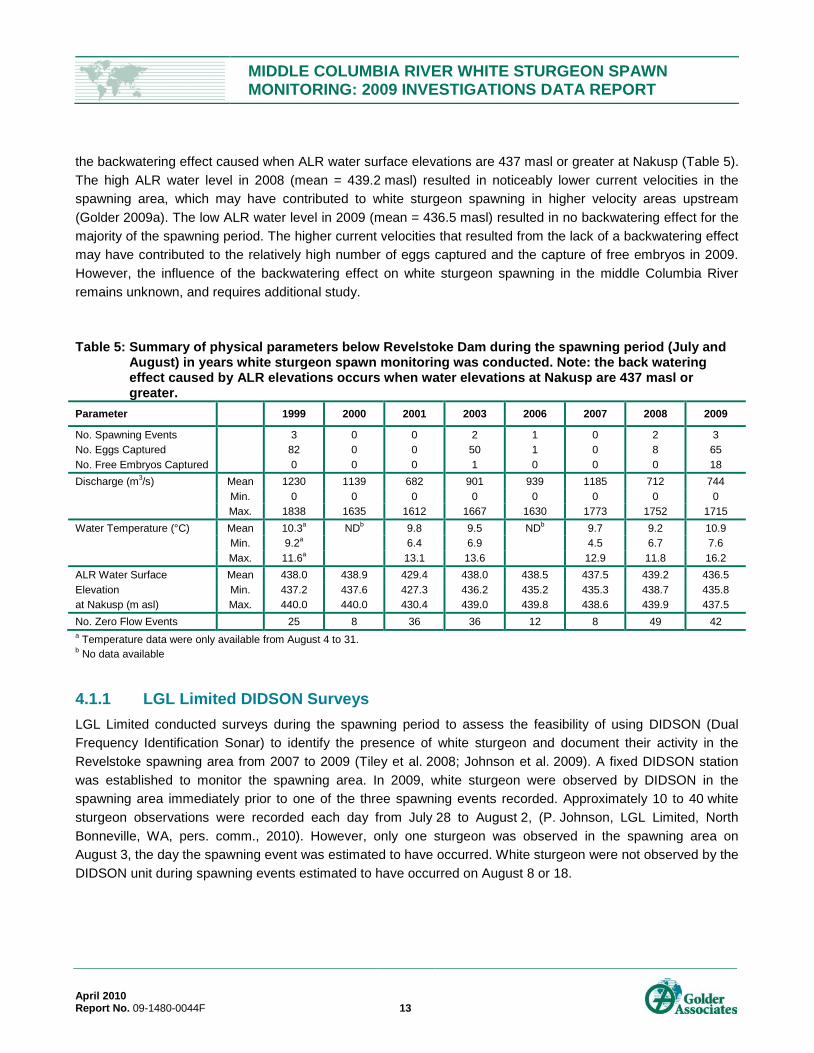
Table 5: Summary of physical parameters below Revelstoke Dam during the spawning period (July and August) in years white sturgeon spawn monitoring was conducted. Note: the back watering effect caused by ALR elevations occurs when water elevations at Nakusp are 437 masl or greater. ........................................................ 13
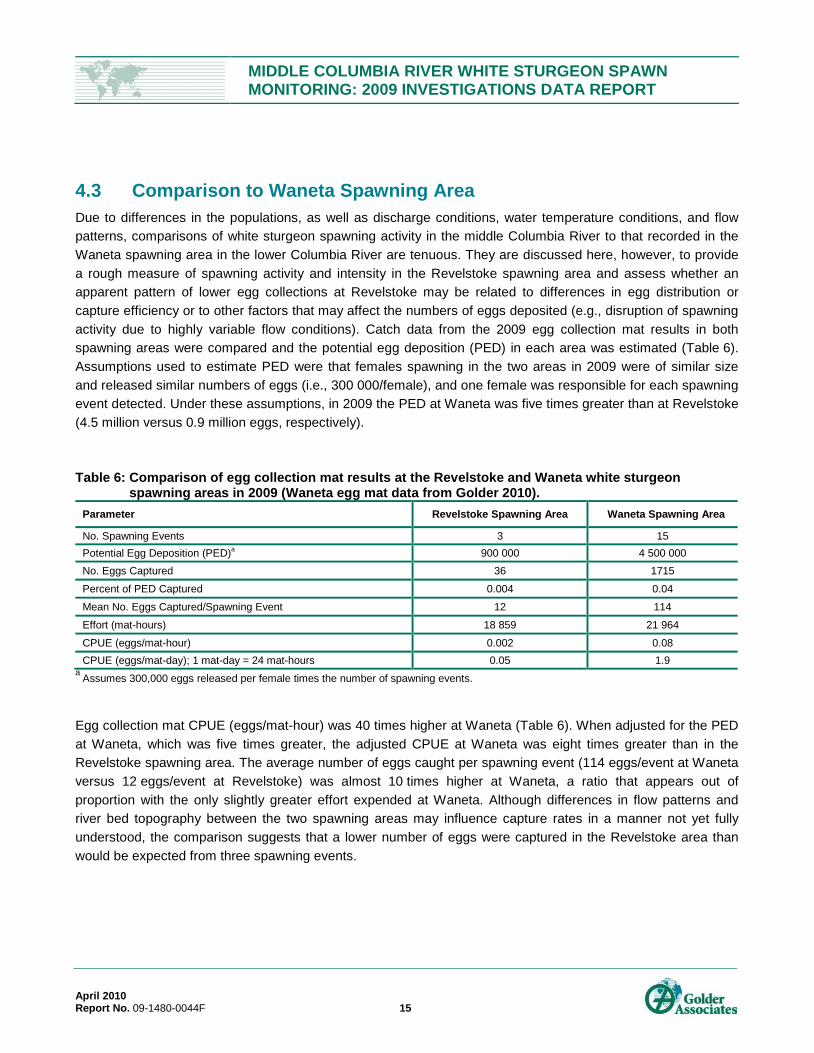
Table 6: Comparison of egg collection mat results at the Revelstoke and Waneta white sturgeon spawning areas in 2009 (Waneta egg mat data from Golder 2010). ..................................................................................................... 15
MIDDLE COLUMBIA RIVER WHITE STURGEON SPAWN MONITORING: 2009 INVESTIGATIONS DATA REPORT
April 2010 Report No. 09-1480-0044F vii
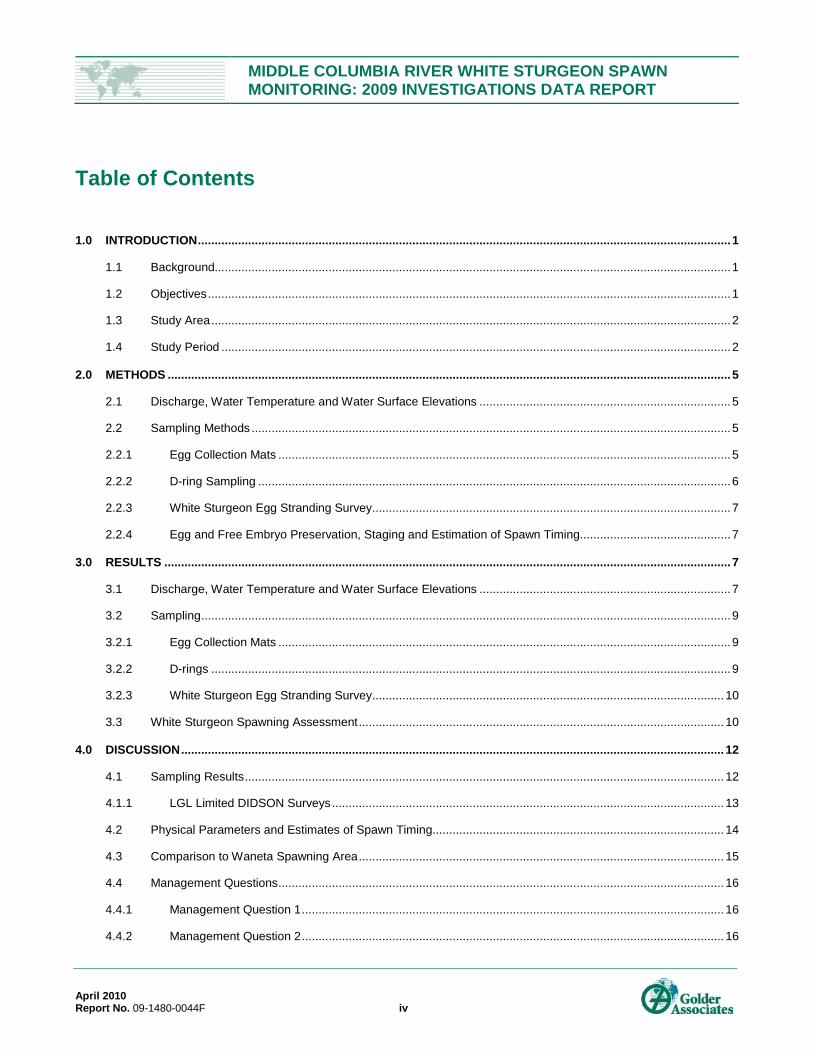
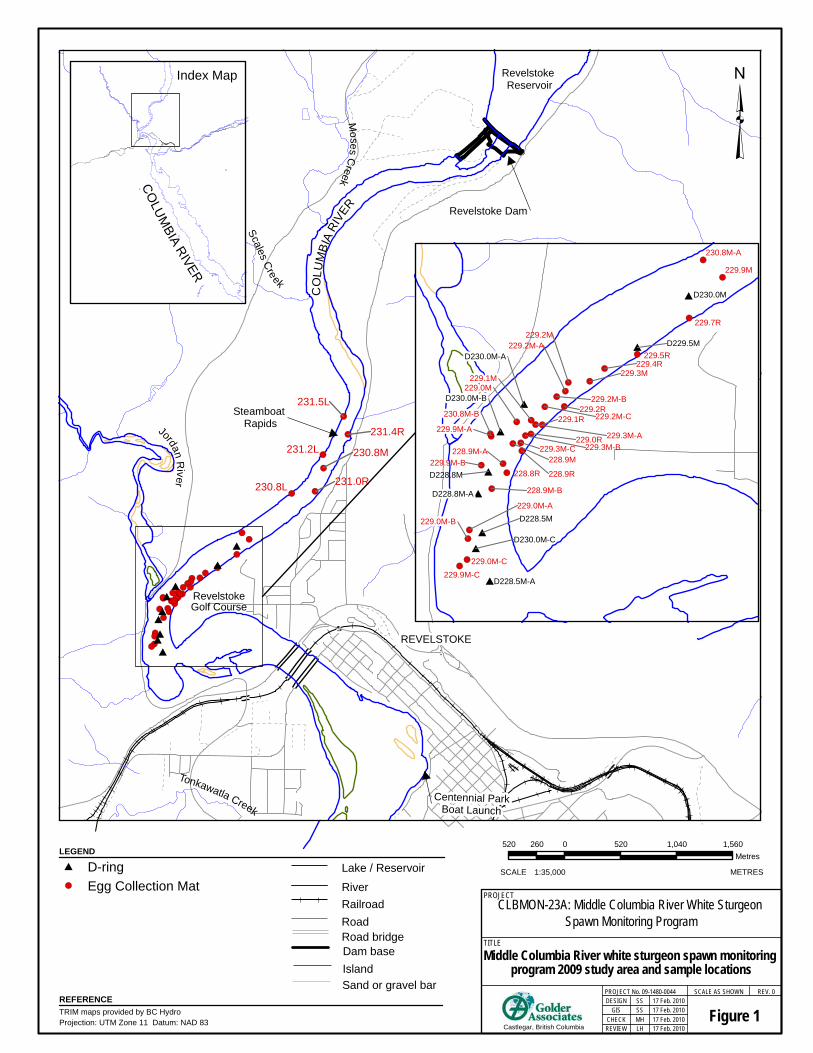
LIST OF FIGURES Figure 1: Middle Columbia River white sturgeon spawn monitoring program, 2009 study area and sample site
locations. ................................................................................................................................................................... 4
Figure 2: Hourly discharge, water temperature, and water surface elevations in the Columbia River below Revelstoke Dam, at the white sturgeon spawning area during the spawning period, July 1 to August 31, 2009. ........................ 8
Figure 3: Locations of egg grids during the white sturgeon egg stranding survey, 7 August 2009. .......................................... 11
MIDDLE COLUMBIA RIVER WHITE STURGEON SPAWN MONITORING: 2009 INVESTIGATIONS DATA REPORT
April 2010 Report No. 09-1480-0044F 1
1.0 INTRODUCTION 1.1 Background The construction of hydro electric dams in the Columbia River basin has resulted in the fragmentation of white sturgeon (Acipenser transmontanus) populations in both Canada and the United States. In Canada, Hugh L. Keenleyside Dam (HLK; completed in 1968) and Mica Dam (completed in 1973) on the mainstem Columbia River in Canada, were constructed following ratification of the Columbia River Treaty between Canada and the U.S. These dams formed large storage reservoirs to provide power generation and flood control as required by the Treaty. Revelstoke Dam, a non-treaty generation facility, was completed by BC Hydro in 1984.
In 1995, the BC Ministry of Environment, Lands and Parks (currently the Ministry of Environment) initiated reconnaissance level surveys to assess the status of white sturgeon in Arrow Lakes Reservoir (ALR), based on anecdotal reports of the presence of this species (R.L. & L. 1996). This, along with subsequent studies, indicated that a small, remnant population, estimated to consist of 52 individuals (95% CI = 37 to 92; Golder 2006), was present in ALR between HLK and Revelstoke Dam. Although subsequent studies identified a spawning area in the Columbia River below Revelstoke Dam through documented spawning activity, recruitment to the larval and juvenile stages from these spawning events has not been demonstrated (UCWSRI 2002). In 2006, populations of white sturgeon in the Canadian portion of the Columbia River were listed as endangered under the federal Species at Risk Act (SARA).
In 1999, several sexually mature, sonic-tagged adult white sturgeon were tracked to an area adjacent to the Revelstoke golf course, approximately 6 km downstream of Revelstoke Dam. These movements were interpreted as spawning-related and resulted in the deployment of egg collection mats in the area. Fertilized white sturgeon eggs were captured, which confirmed spawning use of the area by this species (Golder 2006). This was the first documentation of white sturgeon spawning between Revelstoke Dam and HLK and represents the only known spawning area in this section of the Columbia River to date. Egg collection mats were deployed in the mouth of the Incomappleux River in 1998 and at the mouth of the Illecillewaet River in 2000, but spawning was not documented at either of these locations (Golder 2006). Spawning investigations were also conducted in this area (hereafter referred to as the Revelstoke spawning area) in 2000, 2001, 2003, 2006, 2007, 2008, and 2009 (the present study). White sturgeon spawning was recorded in 2003, 2006, 2008, and 2009 (Golder 2006; Tiley 2006a; Golder 2008a, 2009a).
The present study represents the third year of an ongoing white sturgeon spawn monitoring program in the Revelstoke area as a component of the middle Columbia River Water Use Plan (WUP). This report provides a summary of work conducted in the 2009 field season (Year 3) for BC Hydro under the project CLBMON-23A Middle Columbia River White Sturgeon Egg Mat Monitoring, with comparisons to past studies and other white sturgeon populations. The present study complements a companion study (CLBMON-23B) that assessed the feasibility of underwater videography or other remote sensing techniques to monitor the presence of white sturgeon spawners in the Revelstoke spawning area (Tiley et al. 2008; Johnson et al. 2009).
1.2 Objectives The primary objectives of the 2009 spawn monitoring study were to:
1. assess white sturgeon spawning and incubation sites and conditions downstream of Revelstoke Dam;
MIDDLE COLUMBIA RIVER WHITE STURGEON SPAWN MONITORING: 2009 INVESTIGATIONS DATA REPORT
April 2010 Report No. 09-1480-0044F 2
2. relate egg stranding risk to discharge from the dam and water elevation of ALR; and,
3. provide input to recommendations for the water allocation schedule for white sturgeon spawning and incubation.
In addition to these objectives, the following management questions (as taken from the terms of reference) were considered during this study:
1. Can modifications be made to operations of Revelstoke Dam and ALR to protect or enhance white sturgeon incubation habitat?
2. How do dam and reservoir operations affect egg and larval survival in this area? Specifically, do
significant numbers of eggs become dewatered as a result of operations?
The present study was designed to provide additional baseline data rather than test management hypotheses or measure biological responses to specific flow treatments. Data obtained during the present study will aid in determining how current dam and reservoir operations affect spawning and incubation success, associated habitat availability and suitability, and whether changes to operations have the potential to improve these conditions.
1.3 Study Area The study area consisted of the Columbia River between Revelstoke Dam and Big Eddy (Figure 1). Egg collection mats were deployed along the left and right upstream banks (LUB and RUB, respectively) and in mid-channel locations within this area, with a focus on the area adjacent to the Revelstoke golf course where white sturgeon eggs have been collected in past studies (Golder 2006; Tiley 2006a). D-ring stations were established mid-channel in this same area. UTM coordinates for sample sites are provided in Appendix A, Table A1.
1.4 Study Period The field component of the study was conducted from July 15 to August 27 2009, during the white sturgeon spawning period below Revelstoke Dam (Table 1). Travel from Castlegar to Revelstoke occurred on the first day of each sample session and return travel after sampling activities were completed on the last day.
MIDDLE COLUMBIA RIVER WHITE STURGEON SPAWN MONITORING: 2009 INVESTIGATIONS DATA REPORT
April 2010 Report No. 09-1480-0044F 3
Table 1: Chronology of sample activities for the 2009 middle Columbia River white sturgeon spawn monitoring program.
Session Dates Activities
1 15 & 16 Jul Deploy egg collection mats and D-ring anchor systems, D-ring sampling. 2 22 & 23 Jul Deploy additional egg collection mats, check and redeploy existing egg collection mats, D-ring sampling. 3 29 & 30 Jul Check and redeploy egg collection mats, D-ring sampling. 4 5 & 6 Aug Check and redeploy egg collection mats, D-ring sampling. 4 7 Aug White sturgeon egg stranding survey (at night). 5 12 & 13 Aug Check and redeploy egg collection mats, D-ring sampling. 6 19 & 20 Aug Check and redeploy egg collection mats, D-ring sampling. 7 26 & 27 Aug Check and remove egg collection mats, D-ring sampling, remove D-ring anchor systems.
!(
!(!(!(
!(
!(
!(!(!(
!(!(!(
!(!(!(!(!(!(
!(!(!(
!(!(
!(
!(
!(
!(
!(
!(
!(
!(
!( !(
!(
!(
!(
#
#
##
#
#
##
#
CO
LUM
BIA
RIV
ER
Scales C
reek
Moses C
reek
Revelstoke Dam
Revelstoke Reservoir
Jordan River
Centennial ParkBoat Launch
Tonkawatla Creek
REVELSTOKE
Steamboat Rapids
RevelstokeGolf Course
231.5L
231.4R
231.2L
231.0R230.8L
230.8M
REV. 0
Castlegar, British Columbia
DESIGN
Middle Columbia River white sturgeon spawn monitoring program 2009 study area and sample locations
Figure 1PROJECT No. 09-1480-0044 SCALE AS SHOWN
PROJECT
TITLE
GIS
REVIEW
SS 17 Feb. 2010
CHECK
CLBMON-23A: Middle Columbia River White Sturgeon Spawn Monitoring Program
MHLH
SS 17 Feb. 201017 Feb. 201017 Feb. 2010
LEGEND
TRIM maps provided by BC HydroProjection: UTM Zone 11 Datum: NAD 83
REFERENCE
³
# D-ring!( Egg Collection Mat
520 0 520 1,040 1,560260
Metres
METRES1:35,000SCALE
!(
!(
!(
!(
!(
!(
!(!(
!(
!(
!(!(
!(!(
!(
!( !(
!(
!(
!(!(
!(
!(
!(
!(
!(
!(
!(
!(
!(
#
#
#
#
#
#
#
#
#
D230.0M
D229.5M
D228.8M
D228.5M
D230.0M-C
D230.0M-B
D230.0M-A
D228.8M-A
D228.5M-A
229.9M
229.7R
229.5R229.4R
229.3M
229.2R
229.2M
229.1R
229.1M
229.0R
228.9R
228.9M
228.8R
230.8M-B
230.8M-A
229.9M-C
229.9M-B
229.9M-A
229.2M-A
229.0M-B
228.9M-B
229.0M
229.3M-C 229.3M-B
229.3M-A
229.2M-C
229.2M-B
229.0M-C
229.0M-A
228.9M-A
CO
LUM
BIA R
IVE
R
Index Map
Lake / Reservoir
River
Railroad
Road
Dam base
Island
Sand or gravel bar
Road bridge
MIDDLE COLUMBIA RIVER WHITE STURGEON SPAWN MONITORING: 2009 INVESTIGATIONS DATA REPORT
April 2010 Report No. 09-1480-0044F 5
2.0 METHODS 2.1 Discharge, Water Temperature and Water Surface Elevations Hourly discharge data (m3/s) from the Columbia River at Revelstoke Dam and hourly water temperature (°C) and water surface elevation (masl; metres above sea level) data adjacent to the Revelstoke golf course were obtained from BC Hydro Power Records. On sample days, surface water temperatures were obtained using a mercury hand-held thermometer (±0.1°C).
2.2 Sampling Methods 2.2.1 Egg Collection Mats White sturgeon are broadcast spawners that exhibit a protracted spawning period, which allows for the collection of eggs using passive sampling techniques such as egg collection mats (egg mats). Egg mats are a proven method of collecting white sturgeon eggs (McCabe and Beckman 1990; McCabe and Tracy 1993) and were the main method used to capture white sturgeon eggs during this study. Studies conducted in the Waneta area of the Columbia River since 1993 have suggested that egg mats are the most effective and cost efficient method of collecting eggs spawned by white sturgeon (Golder 2007). The egg mats used in this study consisted of a 0.77 by 0.77 m steel frame that enclosed latex coated animal hair filter material. Egg mats were deployed on the river bottom to collect drifting eggs that become entrapped in the filter material.
White sturgeon spawn monitoring was conducted weekly, for a total of seven sample sessions (egg collections mats sampled continuously during this time and were checked weekly; Table 1). The present study used methods and equipment similar to those used during previous spawning studies in the area (Golder 2006, 2008a, 2009a). To maximize the likelihood of documenting spawning activity, the study focussed on the known egg deposition area adjacent to the Revelstoke golf course, with coverage extending from the Steamboat Rapids area to immediately upstream of Big Eddy (Figure 1; Golder 2006; Tiley 2006a; Golder 2009). In total, 20 egg mat stations (7 mid-channel and 13 shore stations) were established in 2009. Sampling was also conducted upstream of the known (main) egg deposition area, but to a lesser degree, to examine the possibility that spawning may occur in other areas of the flowing section of the Columbia River below Revelstoke Dam.
Mid-channel egg mats were attached to float and anchor lines using carabineers, similar to the 2007 and 2008 studies (Golder 2008a, 2009a). If mid-channel stations drifted downstream, they either were left where they were found (if the location was considered a suitable sampling location), moved back to their original location, or moved to a more suitable sampling location. Egg mats were retrieved, checked for eggs and double checked by a different crew member before being redeployed. This process generally took 10 to 20 minutes per mat. For the majority of mid-channel stations, the egg mat was detached from the anchor system and replaced with a spare egg mat before the retrieved mat was checked for eggs. This saved time by preventing the need to re-pull the float line to redeploy the egg mat after it was checked for eggs. To reduce the likelihood that egg mats at certain shore stations would drift into the shallows near shore, 5 to 10 kg of weight were added to the upstream facing end of these mats. In addition, these mats were deployed with slack in the shore line to allow the mats to settle on the river bottom before the shore line pulled taught.
MIDDLE COLUMBIA RIVER WHITE STURGEON SPAWN MONITORING: 2009 INVESTIGATIONS DATA REPORT
April 2010 Report No. 09-1480-0044F 6
Information collected from each egg mat station included set and retrieval date and time, water temperature, depth, catch, and comments. Information was recorded on sample forms designed for the project. Data entered into electronic format (MS Excel™) were checked and verified for quality assurance/quality control.
2.2.2 D-ring Sampling D-ring drift nets (D-rings) were used to sample for emergent white sturgeon free embryos and larvae, as well as eggs. Sturgeon free embryos and larvae have been collected extensively using this system in the Roosevelt Reach (Howell and McLellan 2006) and in the lower Columbia River in Canada (Golder 2008b, 2009b), as well as for other sturgeon species (Auer and Baker 2002; Smith and King 2005). The D-ring consisted of a D-shaped metal frame (0.8 m wide at the base and 0.4 m high) to which a drift net was attached (3.6 m long, 0.16 cm knotless mesh, tapered to an 11.4 cm diameter collection bottle). A cable bridle was attached to the frame to allow the D-ring to be connected to the anchor system using a carabineer. The D-ring was weighted at the front corners (4.5 kg lead weight attached to each corner) and a General Oceanics flow meter was affixed to the D-ring frame (over the opening) to measure the volume of water sampled. The position of the D-ring while sampling was maintained by an anchor system similar to that used by the Washington Department of Fish and Wildlife (WDFW) in the Roosevelt Reach (Canada - U.S. border to Grand Coulee Dam; Howell and McLellan 2006).
Initially, four D-ring stations were established (two upstream of the main spawning area and two at the downstream end of it; Figure 1). Some D-ring stations drifted downstream during sampling. If they were not moved back upstream to their original location, an “-A”, “-B”, or “-C” designation was added to the station name to signify this, and to enable easier tracking of the movement of individual stations (Figure 1; Appendix A, Table A3). Due to the loss of two egg collection mat mid-sets and time constraints (only two D-rings could be sampled on a given day), the anchor systems of two D-ring stations were used to replace the lost mid-set egg collection mat stations. Each D-ring station consisted of an anchor system, which remained in the river after deployment until the conclusion of the study, and the D-ring sampler which was deployed and retrieved on the day sampling was conducted. D-rings were sampled in the afternoon (on the first day of a session) or the morning (on the second day of a session).
D-ring nets were deployed at the start of the sample day and sampled while other activities were conducted (i.e., egg mat retrieval). D-rings were retrieved using a winch mounted on the bow of a river boat. Upon retrieval of the D-ring, the contents of the collection bottle and drift net were emptied into a white sample tray, examined, sorted, and identified. Data recorded included the time of D-ring set and pull, the start and end readings of the flow meter (for calculation of the volume of water sampled), details of the catch (species, life stage, number, detritus load), depth, and any drift exhibited by the D-ring/anchor system. Data were recorded in a waterproof field book and on sample forms designed for the project, which were later photocopied and stored in fire-proof filing cabinets. Data entered from hard copy to electronic format (MS ExcelTM) were checked and verified for quality assurance/quality control.
MIDDLE COLUMBIA RIVER WHITE STURGEON SPAWN MONITORING: 2009 INVESTIGATIONS DATA REPORT
April 2010 Report No. 09-1480-0044F 7
2.2.3 White Sturgeon Egg Stranding Survey One of the study objectives was to assess the effects of daily flow fluctuations from Revelstoke Dam on the stranding of white sturgeon eggs. Following the capture of white sturgeon eggs on August 5 2009, the Golder crew leader contacted the BC Hydro contract administrator (Karen Bray, BC Hydro, Revelstoke, BC) to obtain information on water levels in the spawning area. BC Hydro used a flow model to estimate that the water level in the spawning area adjacent to the Revelstoke golf course would drop an estimated 1.5 to 2 m if discharge from Revelstoke Dam was reduced to near zero. On the basis of this information and information from the dam operator that discharge from Revelstoke Dam had been reduced to near zero nightly since August 4, a decision was made to conduct an egg stranding survey on the night of August 6/morning of August 7, when flows were predicted to be at zero discharge from midnight to approximately 04:00.
A white sturgeon egg stranding survey was conducted on August 7, 2009 at night (from 00:00 to 05:00) when flows from Revelstoke Dam were low (0 m3/s from 00:00 to 02:00, 4 m3/s at 03:00, 290 m3/s at 04:00, and 326 m3/s at 05:00). This synoptic survey was conducted opportunistically based on the capture off white sturgeon eggs during the fourth sample session and the availability of low flows from Revelstoke Dam on the morning of August 7, 2009. The goal was to sample 30 quadrats to determine if white sturgeon eggs become stranded during low flow events below Revelstoke Dam, and an indication of the numbers involved. The survey began near the upstream end of the cobble bar situated downstream of the spawning area and continued in a downstream direction. A series of 1 m by 1 m quadrats were laid on the exposed substrate and the substrate within the grid was examined for white sturgeon eggs by sorting loose substrate above the base substrate. The number of white sturgeon eggs found, time surveyed, UTM coordinates, and the distance to the water’s edge were recorded for each grid. The area of the cobble bar that was exposed could not be measured due to rising water levels after 29 quadrats were surveyed. Because of this, the area of the cobble bar that was exposed as a result of the flow reduction from Revelstoke Dam was estimated using GIS.
2.2.4 Egg and Free Embryo Preservation, Staging and Estimation of Spawn Timing White sturgeon eggs captured were preserved in 10% formalin. Free embryos were fixed in 10% formalin and later transferred to 95% ethanol. The developmental stages of eggs and free embryos were assessed with a dissecting microscope and based on published rates of white sturgeon development at known temperatures (Beer 1981, Conte et al. 1988, Wang et al. 1985). The determination of developmental stage of eggs allowed back calculation (using mean water temperature between the estimated spawn timing and capture) to estimate the number and timing of spawning events.
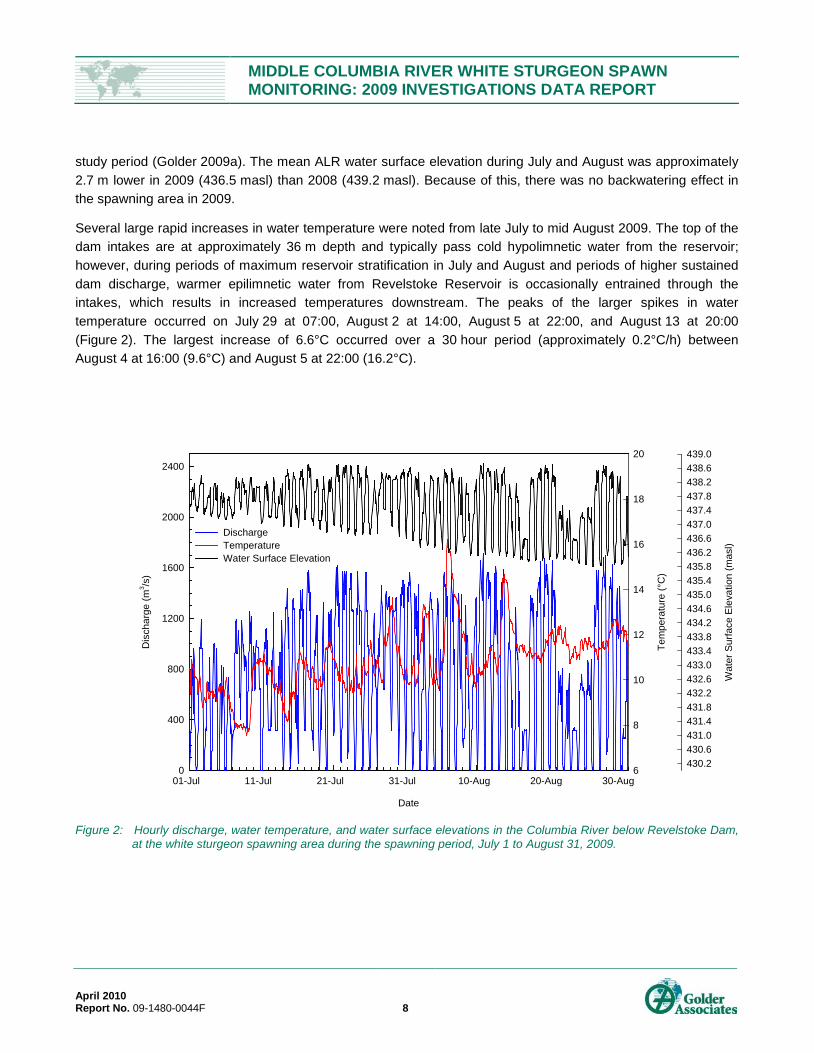
3.0 RESULTS 3.1 Discharge, Water Temperature and Water Surface Elevations From July 1 to August 31 2009, discharge in the Revelstoke Dam tailwater area exhibited substantial daily fluctuations, typical of a load following facility (Figure 2). This resulted in fluctuations in water temperatures and water surface elevations in the spawning area. In 2008, fluctuations in water surface elevations in the spawning area were stable due to the backwatering effect caused by high water surface elevations in ALR throughout the
MIDDLE COLUMBIA RIVER WHITE STURGEON SPAWN MONITORING: 2009 INVESTIGATIONS DATA REPORT
April 2010 Report No. 09-1480-0044F 8
study period (Golder 2009a). The mean ALR water surface elevation during July and August was approximately 2.7 m lower in 2009 (436.5 masl) than 2008 (439.2 masl). Because of this, there was no backwatering effect in the spawning area in 2009.
Several large rapid increases in water temperature were noted from late July to mid August 2009. The top of the dam intakes are at approximately 36 m depth and typically pass cold hypolimnetic water from the reservoir; however, during periods of maximum reservoir stratification in July and August and periods of higher sustained dam discharge, warmer epilimnetic water from Revelstoke Reservoir is occasionally entrained through the intakes, which results in increased temperatures downstream. The peaks of the larger spikes in water temperature occurred on July 29 at 07:00, August 2 at 14:00, August 5 at 22:00, and August 13 at 20:00 (Figure 2). The largest increase of 6.6°C occurred over a 30 hour period (approximately 0.2°C/h) between August 4 at 16:00 (9.6°C) and August 5 at 22:00 (16.2°C).
Date
01-Jul 11-Jul 21-Jul 31-Jul 10-Aug 20-Aug 30-Aug
Dis
char
ge (m
3 /s)
0
400
800
1200
1600
2000
2400
Tem
pera
ture
(°C
)
6
8
10
12
14
16
18
20
Wat
er S
urfa
ce E
leva
tion
(mas
l)
430.2430.6431.0431.4431.8432.2432.6433.0433.4433.8434.2434.6435.0435.4435.8436.2436.6437.0437.4437.8438.2438.6439.0
DischargeTemperatureWater Surface Elevation
Figure 2: Hourly discharge, water temperature, and water surface elevations in the Columbia River below Revelstoke Dam,
at the white sturgeon spawning area during the spawning period, July 1 to August 31, 2009.
MIDDLE COLUMBIA RIVER WHITE STURGEON SPAWN MONITORING: 2009 INVESTIGATIONS DATA REPORT
April 2010 Report No. 09-1480-0044F 9
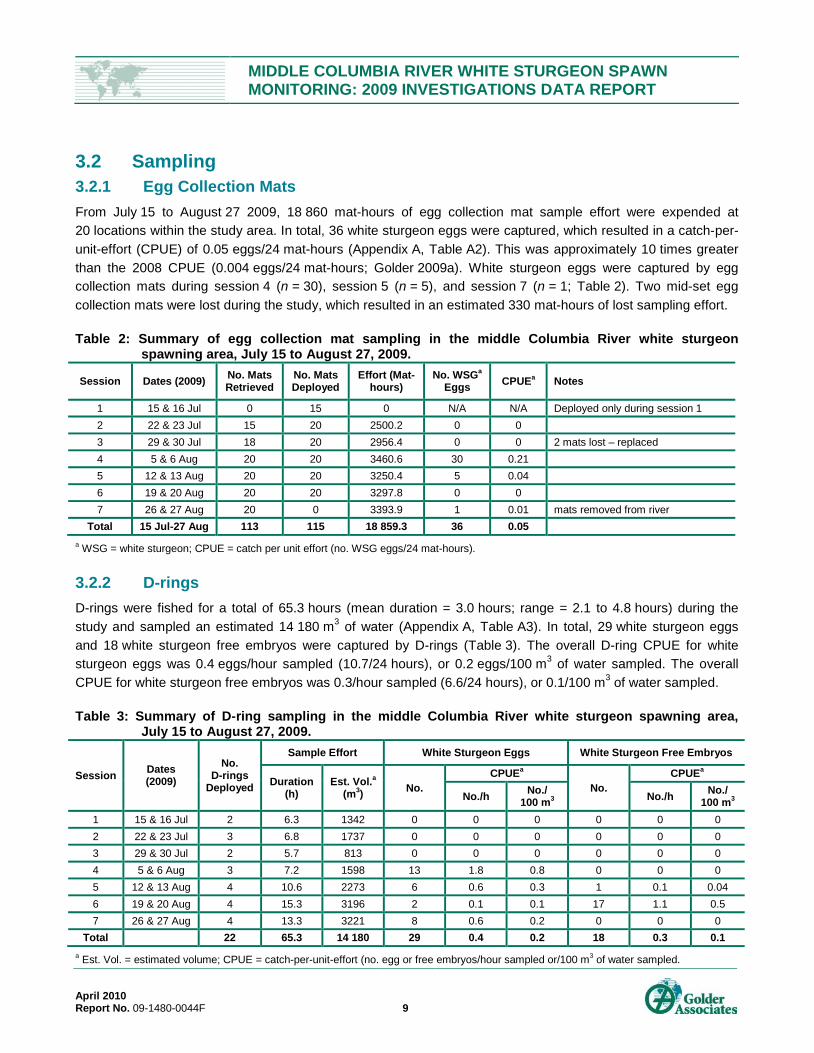
3.2 Sampling 3.2.1 Egg Collection Mats From July 15 to August 27 2009, 18 860 mat-hours of egg collection mat sample effort were expended at 20 locations within the study area. In total, 36 white sturgeon eggs were captured, which resulted in a catch-per-unit-effort (CPUE) of 0.05 eggs/24 mat-hours (Appendix A, Table A2). This was approximately 10 times greater than the 2008 CPUE (0.004 eggs/24 mat-hours; Golder 2009a). White sturgeon eggs were captured by egg collection mats during session 4 (n = 30), session 5 (n = 5), and session 7 (n = 1; Table 2). Two mid-set egg collection mats were lost during the study, which resulted in an estimated 330 mat-hours of lost sampling effort. Table 2: Summary of egg collection mat sampling in the middle Columbia River white sturgeon
spawning area, July 15 to August 27, 2009.
Session Dates (2009) No. Mats Retrieved
No. Mats Deployed
Effort (Mat-hours)
No. WSGa Eggs CPUEa Notes
1 15 & 16 Jul 0 15 0 N/A N/A Deployed only during session 1 2 22 & 23 Jul 15 20 2500.2 0 0 3 29 & 30 Jul 18 20 2956.4 0 0 2 mats lost – replaced 4 5 & 6 Aug 20 20 3460.6 30 0.21 5 12 & 13 Aug 20 20 3250.4 5 0.04 6 19 & 20 Aug 20 20 3297.8 0 0 7 26 & 27 Aug 20 0 3393.9 1 0.01 mats removed from river
Total 15 Jul-27 Aug 113 115 18 859.3 36 0.05 a WSG = white sturgeon; CPUE = catch per unit effort (no. WSG eggs/24 mat-hours).
3.2.2 D-rings D-rings were fished for a total of 65.3 hours (mean duration = 3.0 hours; range = 2.1 to 4.8 hours) during the study and sampled an estimated 14 180 m3 of water (Appendix A, Table A3). In total, 29 white sturgeon eggs and 18 white sturgeon free embryos were captured by D-rings (Table 3). The overall D-ring CPUE for white sturgeon eggs was 0.4 eggs/hour sampled (10.7/24 hours), or 0.2 eggs/100 m3 of water sampled. The overall CPUE for white sturgeon free embryos was 0.3/hour sampled (6.6/24 hours), or 0.1/100 m3 of water sampled. Table 3: Summary of D-ring sampling in the middle Columbia River white sturgeon spawning area,
July 15 to August 27, 2009.
Session Dates (2009)
No. D-rings
Deployed
Sample Effort White Sturgeon Eggs White Sturgeon Free Embryos
Duration (h)
Est. Vol.a (m3) No.
CPUEa No.
CPUEa
No./h No./ 100 m3 No./h No./
100 m3 1 15 & 16 Jul 2 6.3 1342 0 0 0 0 0 0 2 22 & 23 Jul 3 6.8 1737 0 0 0 0 0 0 3 29 & 30 Jul 2 5.7 813 0 0 0 0 0 0 4 5 & 6 Aug 3 7.2 1598 13 1.8 0.8 0 0 0 5 12 & 13 Aug 4 10.6 2273 6 0.6 0.3 1 0.1 0.04 6 19 & 20 Aug 4 15.3 3196 2 0.1 0.1 17 1.1 0.5 7 26 & 27 Aug 4 13.3 3221 8 0.6 0.2 0 0 0
Total 22 65.3 14 180 29 0.4 0.2 18 0.3 0.1 a Est. Vol. = estimated volume; CPUE = catch-per-unit-effort (no. egg or free embryos/hour sampled or/100 m3 of water sampled.
MIDDLE COLUMBIA RIVER WHITE STURGEON SPAWN MONITORING: 2009 INVESTIGATIONS DATA REPORT
April 2010 Report No. 09-1480-0044F 10
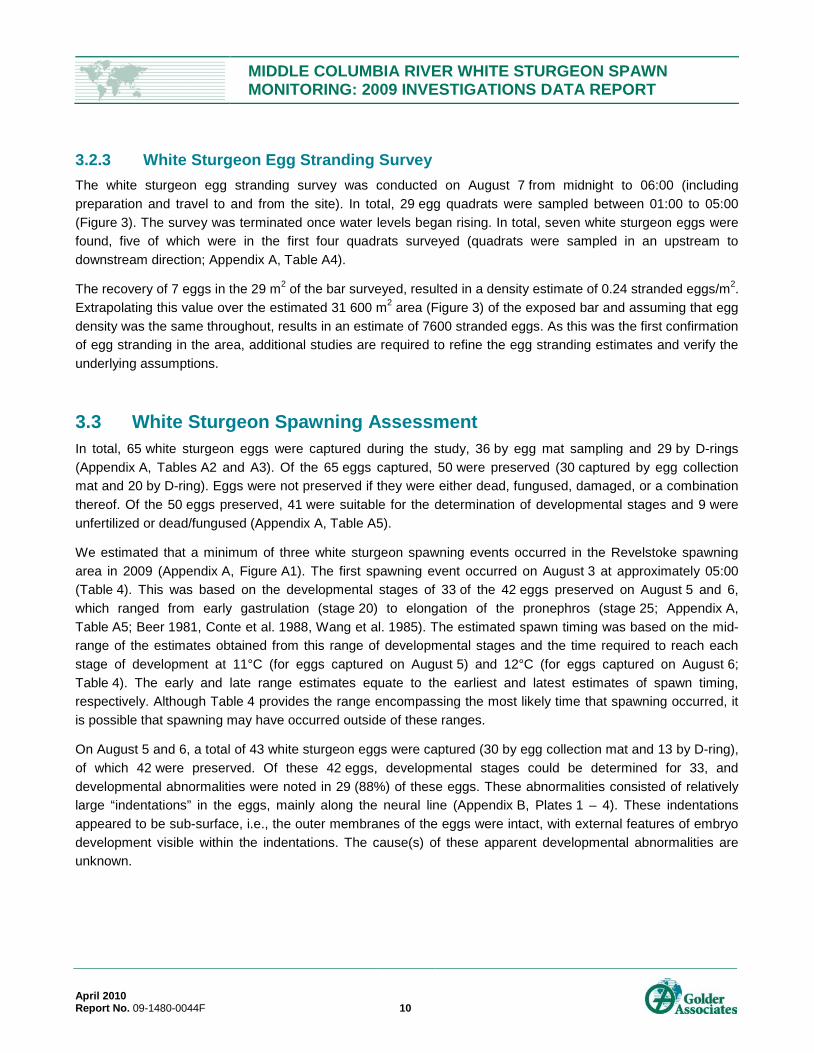
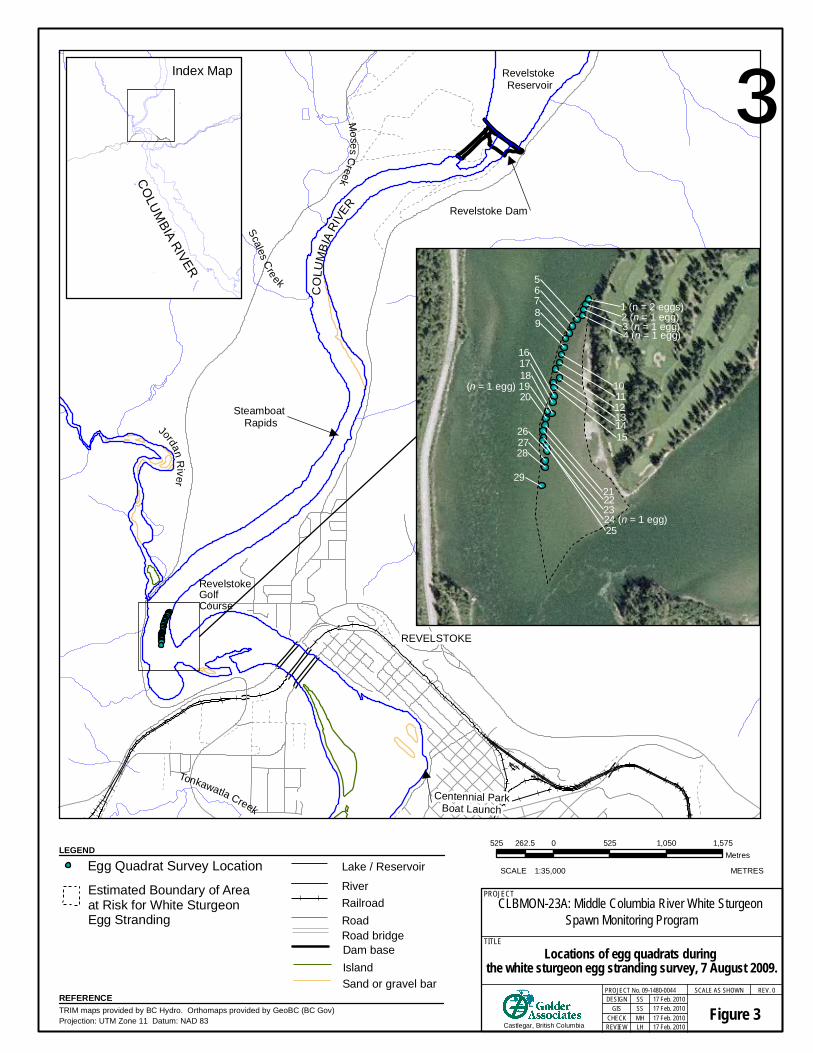
3.2.3 White Sturgeon Egg Stranding Survey The white sturgeon egg stranding survey was conducted on August 7 from midnight to 06:00 (including preparation and travel to and from the site). In total, 29 egg quadrats were sampled between 01:00 to 05:00 (Figure 3). The survey was terminated once water levels began rising. In total, seven white sturgeon eggs were found, five of which were in the first four quadrats surveyed (quadrats were sampled in an upstream to downstream direction; Appendix A, Table A4).
The recovery of 7 eggs in the 29 m2 of the bar surveyed, resulted in a density estimate of 0.24 stranded eggs/m2. Extrapolating this value over the estimated 31 600 m2 area (Figure 3) of the exposed bar and assuming that egg density was the same throughout, results in an estimate of 7600 stranded eggs. As this was the first confirmation of egg stranding in the area, additional studies are required to refine the egg stranding estimates and verify the underlying assumptions.
3.3 White Sturgeon Spawning Assessment In total, 65 white sturgeon eggs were captured during the study, 36 by egg mat sampling and 29 by D-rings (Appendix A, Tables A2 and A3). Of the 65 eggs captured, 50 were preserved (30 captured by egg collection mat and 20 by D-ring). Eggs were not preserved if they were either dead, fungused, damaged, or a combination thereof. Of the 50 eggs preserved, 41 were suitable for the determination of developmental stages and 9 were unfertilized or dead/fungused (Appendix A, Table A5).
We estimated that a minimum of three white sturgeon spawning events occurred in the Revelstoke spawning area in 2009 (Appendix A, Figure A1). The first spawning event occurred on August 3 at approximately 05:00 (Table 4). This was based on the developmental stages of 33 of the 42 eggs preserved on August 5 and 6, which ranged from early gastrulation (stage 20) to elongation of the pronephros (stage 25; Appendix A, Table A5; Beer 1981, Conte et al. 1988, Wang et al. 1985). The estimated spawn timing was based on the mid-range of the estimates obtained from this range of developmental stages and the time required to reach each stage of development at 11°C (for eggs captured on August 5) and 12°C (for eggs captured on August 6; Table 4). The early and late range estimates equate to the earliest and latest estimates of spawn timing, respectively. Although Table 4 provides the range encompassing the most likely time that spawning occurred, it is possible that spawning may have occurred outside of these ranges.
On August 5 and 6, a total of 43 white sturgeon eggs were captured (30 by egg collection mat and 13 by D-ring), of which 42 were preserved. Of these 42 eggs, developmental stages could be determined for 33, and developmental abnormalities were noted in 29 (88%) of these eggs. These abnormalities consisted of relatively large “indentations” in the eggs, mainly along the neural line (Appendix B, Plates 1 – 4). These indentations appeared to be sub-surface, i.e., the outer membranes of the eggs were intact, with external features of embryo development visible within the indentations. The cause(s) of these apparent developmental abnormalities are unknown.
CO
LUM
BIA
RIV
ER
Scales C
reek
Mo
ses C
reek
Revelstoke Dam
Revelstoke Reservoir
Jordan River
Centennial ParkBoat Launch
Tonkawatla Creek
REVELSTOKE
Steamboat Rapids
RevelstokeGolf Course
REV. 0
Castlegar, British Columbia
DESIGN
Locations of egg quadrats during the white sturgeon egg stranding survey, 7 August 2009.
Figure 3PROJECT No. 09-1480-0044 SCALE AS SHOWN
PROJECT
TITLE
GIS
REVIEW
SS 17 Feb. 2010
CHECK
CLBMON-23A: Middle Columbia River White Sturgeon Spawn Monitoring Program
MHLH
SS 17 Feb. 201017 Feb. 201017 Feb. 2010
LEGEND
TRIM maps provided by BC Hydro. Orthomaps provided by GeoBC (BC Gov)Projection: UTM Zone 11 Datum: NAD 83
REFERENCE
³
Egg Quadrat Survey Location
525 0 525 1,050 1,575262.5
Metres
METRES1:35,000SCALE
98765
4 (n = 1 egg)3 (n = 1 egg)2 (n = 1 egg)1 (n = 2 eggs)
29
282726
2524 (n = 1 egg)
2221
20(n = 1 egg) 19
1716
1514
1211
23
18
13
10
CO
LUM
BIA R
IVE
R
Index Map
Lake / Reservoir
River
Railroad
Road
Dam base
Island
Sand or gravel bar
Road bridge
Estimated Boundary of Areaat Risk for White Sturgeon Egg Stranding
MIDDLE COLUMBIA RIVER WHITE STURGEON SPAWN MONITORING: 2009 INVESTIGATIONS DATA REPORT
April 2010 Report No. 09-1480-0044F 12
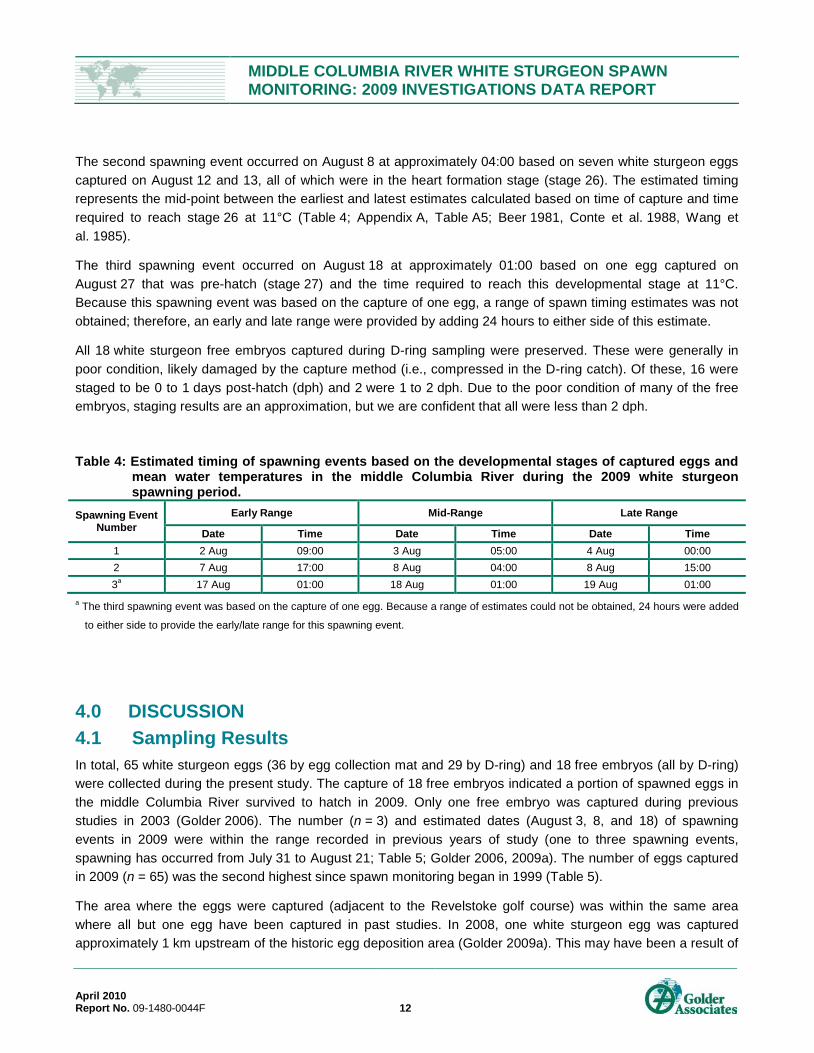
The second spawning event occurred on August 8 at approximately 04:00 based on seven white sturgeon eggs captured on August 12 and 13, all of which were in the heart formation stage (stage 26). The estimated timing represents the mid-point between the earliest and latest estimates calculated based on time of capture and time required to reach stage 26 at 11°C (Table 4; Appendix A, Table A5; Beer 1981, Conte et al. 1988, Wang et al. 1985).
The third spawning event occurred on August 18 at approximately 01:00 based on one egg captured on August 27 that was pre-hatch (stage 27) and the time required to reach this developmental stage at 11°C. Because this spawning event was based on the capture of one egg, a range of spawn timing estimates was not obtained; therefore, an early and late range were provided by adding 24 hours to either side of this estimate.
All 18 white sturgeon free embryos captured during D-ring sampling were preserved. These were generally in poor condition, likely damaged by the capture method (i.e., compressed in the D-ring catch). Of these, 16 were staged to be 0 to 1 days post-hatch (dph) and 2 were 1 to 2 dph. Due to the poor condition of many of the free embryos, staging results are an approximation, but we are confident that all were less than 2 dph.
Table 4: Estimated timing of spawning events based on the developmental stages of captured eggs and mean water temperatures in the middle Columbia River during the 2009 white sturgeon spawning period.
Spawning Event Number
Early Range Mid-Range Late Range
Date Time Date Time Date Time 1 2 Aug 09:00 3 Aug 05:00 4 Aug 00:00 2 7 Aug 17:00 8 Aug 04:00 8 Aug 15:00 3a 17 Aug 01:00 18 Aug 01:00 19 Aug 01:00
a The third spawning event was based on the capture of one egg. Because a range of estimates could not be obtained, 24 hours were added
to either side to provide the early/late range for this spawning event.
4.0 DISCUSSION 4.1 Sampling Results In total, 65 white sturgeon eggs (36 by egg collection mat and 29 by D-ring) and 18 free embryos (all by D-ring) were collected during the present study. The capture of 18 free embryos indicated a portion of spawned eggs in the middle Columbia River survived to hatch in 2009. Only one free embryo was captured during previous studies in 2003 (Golder 2006). The number (n = 3) and estimated dates (August 3, 8, and 18) of spawning events in 2009 were within the range recorded in previous years of study (one to three spawning events, spawning has occurred from July 31 to August 21; Table 5; Golder 2006, 2009a). The number of eggs captured in 2009 (n = 65) was the second highest since spawn monitoring began in 1999 (Table 5).
The area where the eggs were captured (adjacent to the Revelstoke golf course) was within the same area where all but one egg have been captured in past studies. In 2008, one white sturgeon egg was captured approximately 1 km upstream of the historic egg deposition area (Golder 2009a). This may have been a result of
MIDDLE COLUMBIA RIVER WHITE STURGEON SPAWN MONITORING: 2009 INVESTIGATIONS DATA REPORT
April 2010 Report No. 09-1480-0044F 13
the backwatering effect caused when ALR water surface elevations are 437 masl or greater at Nakusp (Table 5). The high ALR water level in 2008 (mean = 439.2 masl) resulted in noticeably lower current velocities in the spawning area, which may have contributed to white sturgeon spawning in higher velocity areas upstream (Golder 2009a). The low ALR water level in 2009 (mean = 436.5 masl) resulted in no backwatering effect for the majority of the spawning period. The higher current velocities that resulted from the lack of a backwatering effect may have contributed to the relatively high number of eggs captured and the capture of free embryos in 2009. However, the influence of the backwatering effect on white sturgeon spawning in the middle Columbia River remains unknown, and requires additional study.
Table 5: Summary of physical parameters below Revelstoke Dam during the spawning period (July and August) in years white sturgeon spawn monitoring was conducted. Note: the back watering effect caused by ALR elevations occurs when water elevations at Nakusp are 437 masl or greater.
Parameter 1999 2000 2001 2003 2006 2007 2008 2009
No. Spawning Events 3 0 0 2 1 0 2 3 No. Eggs Captured 82 0 0 50 1 0 8 65 No. Free Embryos Captured 0 0 0 1 0 0 0 18 Discharge (m3/s) Mean 1230 1139 682 901 939 1185 712 744 Min. 0 0 0 0 0 0 0 0 Max. 1838 1635 1612 1667 1630 1773 1752 1715 Water Temperature (°C) Mean 10.3a NDb 9.8 9.5 NDb 9.7 9.2 10.9 Min. 9.2a 6.4 6.9 4.5 6.7 7.6 Max. 11.6a 13.1 13.6 12.9 11.8 16.2 ALR Water Surface Mean 438.0 438.9 429.4 438.0 438.5 437.5 439.2 436.5 Elevation Min. 437.2 437.6 427.3 436.2 435.2 435.3 438.7 435.8 at Nakusp (m asl) Max. 440.0 440.0 430.4 439.0 439.8 438.6 439.9 437.5 No. Zero Flow Events 25 8 36 36 12 8 49 42 a Temperature data were only available from August 4 to 31. b No data available
4.1.1 LGL Limited DIDSON Surveys LGL Limited conducted surveys during the spawning period to assess the feasibility of using DIDSON (Dual Frequency Identification Sonar) to identify the presence of white sturgeon and document their activity in the Revelstoke spawning area from 2007 to 2009 (Tiley et al. 2008; Johnson et al. 2009). A fixed DIDSON station was established to monitor the spawning area. In 2009, white sturgeon were observed by DIDSON in the spawning area immediately prior to one of the three spawning events recorded. Approximately 10 to 40 white sturgeon observations were recorded each day from July 28 to August 2, (P. Johnson, LGL Limited, North Bonneville, WA, pers. comm., 2010). However, only one sturgeon was observed in the spawning area on August 3, the day the spawning event was estimated to have occurred. White sturgeon were not observed by the DIDSON unit during spawning events estimated to have occurred on August 8 or 18.
MIDDLE COLUMBIA RIVER WHITE STURGEON SPAWN MONITORING: 2009 INVESTIGATIONS DATA REPORT
April 2010 Report No. 09-1480-0044F 14
4.2 Physical Parameters and Estimates of Spawn Timing The highly variable discharge and temperature fluctuations in the Revelstoke spawning area, coupled with the small sample size of spawning events and numbers of eggs captured continues to create difficulties in determining white sturgeon spawning cues. Several factors continue to potentially affect the accuracy of spawn timing estimates in the Revelstoke spawning area. The effects of water temperature fluctuations on the development of white sturgeon embryos are largely unknown, but appear to delay development (Tiley 2006b). This, coupled with longer development times associated with colder water (thereby providing more time for temperature variations to occur) may reduce the accuracy of estimates of spawn timing in the middle Columbia River.
Physical conditions below Revelstoke Dam have differed substantially among years when spawning assessments have been conducted. Due to load factoring operations, discharge from Revelstoke Dam can vary on a daily basis from over 1700 m3/s to zero (seepage flows). The average discharge from Revelstoke Dam during the 2009 white sturgeon spawning period (July and August) was low (744 m3/s) relative to previous years when spawn monitoring has been conducted (Table 5). Water temperatures in the spawning area may vary in response to discharge, depth of the thermocline above Revelstoke Dam, and the degree of backwatering from ALR. Water temperatures during the spawning period in 2009 were 1.1°C to 1.7°C warmer on average than previous years (not including 1999 when temperature data was limited). In 2009, ALR water surface elevations at Nakusp were the second lowest recorded in the years spawn monitoring has been conducted. Because of this, the backwatering effect caused by higher water levels (when ALR water surface elevations are 437 masl or greater at Nakusp), did not occur in 2009. There are no discernable patterns between discharge, water temperature, ALR elevations, the frequency of zero flow events and years when spawning has occurred.
Water temperature data were available for five (of eight in total) spawning events detected during previous studies (1999 to 2008; Golder 2009a). These five spawning events appear to have occurred during periods of increasing water temperatures. Tiley (2006b) reported that spawn timing appeared to be associated with increases in water temperatures in 2003.
The first spawning event on August 3, 2009 occurred approximately 15 hours after a water temperature increase on August 2 (Section 3.1; Appendix A, Figure A1). This peak in water temperature falls within the range of the spawn timing estimate (Table 4), so it is possible that the spawning event occurred during a period of increasing water temperature. However, the other two spawning events in 2009 did not occur during periods of rising water temperatures. The August 8 spawning event occurred during a period of declining water temperatures, approximately 2 days after a temperature peak on August 5. The August 18 spawning event also occurred during a period of declining water temperatures, approximately 4 days after a temperature peak on August 13.
Periods of sustained discharge (5 days or more with flows not less than 245 m3/s) from Revelstoke Dam also have been considered as a potential spawning cue (Tiley 2006b; Golder 2009a). However, only three of 11 spawning events from 1999 to 2009 have occurred during such periods (one in 1999 and two in 2003). In 2009, all three spawning events occurred during a period (August 1 to 27) when discharge from Revelstoke Dam was reduced to zero for portions of each night. Based on these data, periods of sustained discharge do not appear to provide a consistent cue for spawning in the middle Columbia River. The uncertainty in estimates of spawn timing and the frequent discharge fluctuations in the middle Columbia River create difficulties in determining the conditions prior to and during spawning events and confound the identification of potential discharge related spawning cues.
MIDDLE COLUMBIA RIVER WHITE STURGEON SPAWN MONITORING: 2009 INVESTIGATIONS DATA REPORT
April 2010 Report No. 09-1480-0044F 15
4.3 Comparison to Waneta Spawning Area Due to differences in the populations, as well as discharge conditions, water temperature conditions, and flow patterns, comparisons of white sturgeon spawning activity in the middle Columbia River to that recorded in the Waneta spawning area in the lower Columbia River are tenuous. They are discussed here, however, to provide a rough measure of spawning activity and intensity in the Revelstoke spawning area and assess whether an apparent pattern of lower egg collections at Revelstoke may be related to differences in egg distribution or capture efficiency or to other factors that may affect the numbers of eggs deposited (e.g., disruption of spawning activity due to highly variable flow conditions). Catch data from the 2009 egg collection mat results in both spawning areas were compared and the potential egg deposition (PED) in each area was estimated (Table 6). Assumptions used to estimate PED were that females spawning in the two areas in 2009 were of similar size and released similar numbers of eggs (i.e., 300 000/female), and one female was responsible for each spawning event detected. Under these assumptions, in 2009 the PED at Waneta was five times greater than at Revelstoke (4.5 million versus 0.9 million eggs, respectively).
Table 6: Comparison of egg collection mat results at the Revelstoke and Waneta white sturgeon spawning areas in 2009 (Waneta egg mat data from Golder 2010).
Parameter Revelstoke Spawning Area Waneta Spawning Area
No. Spawning Events 3 15 Potential Egg Deposition (PED)a 900 000 4 500 000 No. Eggs Captured 36 1715
Percent of PED Captured 0.004 0.04
Mean No. Eggs Captured/Spawning Event 12 114
Effort (mat-hours) 18 859 21 964
CPUE (eggs/mat-hour) 0.002 0.08 CPUE (eggs/mat-day); 1 mat-day = 24 mat-hours 0.05 1.9
a Assumes 300,000 eggs released per female times the number of spawning events.
Egg collection mat CPUE (eggs/mat-hour) was 40 times higher at Waneta (Table 6). When adjusted for the PED at Waneta, which was five times greater, the adjusted CPUE at Waneta was eight times greater than in the Revelstoke spawning area. The average number of eggs caught per spawning event (114 eggs/event at Waneta versus 12 eggs/event at Revelstoke) was almost 10 times higher at Waneta, a ratio that appears out of proportion with the only slightly greater effort expended at Waneta. Although differences in flow patterns and river bed topography between the two spawning areas may influence capture rates in a manner not yet fully understood, the comparison suggests that a lower number of eggs were captured in the Revelstoke area than would be expected from three spawning events.
MIDDLE COLUMBIA RIVER WHITE STURGEON SPAWN MONITORING: 2009 INVESTIGATIONS DATA REPORT
April 2010 Report No. 09-1480-0044F 16
4.4 Management Questions 4.4.1 Management Question 1 Where are the primary white sturgeon incubation sites below Revelstoke Dam?
Based on the first 3 years of study (2007 to 2009) and the results of past studies (1999 to 2006), the primary white sturgeon incubation sites are located adjacent to the Revelstoke golf course (Figure 1). The capture locations of white sturgeon eggs captured from 1999 to 2008 were provided in the 2008 report (Golder 2009a). In 2008, the capture of one egg approximately 1 km upstream of historic capture locations, indicated that the spawning location of some white sturgeon may be influenced by the degree of the backwatering effect caused by ALR water surface elevations greater than 437 masl. The pronounced backwatering effect in 2008 reduced current velocities in the spawning area, which may have resulted in some spawning in upstream areas, where velocities were greater. This would be consistent with white sturgeon spawning habitat preferences (depths over 4 m, most suitable velocities over 1.3 m/s; Parsley et al. 1993, Parsley and Beckman 1994), but more data is needed to determine the how the backwatering effect influences white sturgeon spawning locations in the middle Columbia River.
4.4.2 Management Question 2 How do dam and reservoir operations affect egg and larval survival in this area? Specifically, do significant numbers of eggs become dewatered as a result of operations?
White sturgeon egg stranding in the middle Columbia River as a result of load factoring operations of Revelstoke Dam was confirmed. The significance of this stranding could not be assessed based on the limited survey conducted. Additional surveys are required to definitively answer this management question.
4.4.3 Management Question 3 Can underwater videography or other remote sensing methods be used to effectively monitor staging and spawning of white sturgeon?
This management question will be addressed based on results of a companion study (CLBMON-23B, the middle Columbia River white sturgeon underwater videography feasibility study), conducted from 2007 to 2009 by LGL Limited.
4.4.4 Management Question 4 What is the most effective method for monitoring spawning of white sturgeon?
Based on results of the present study program and spawn monitoring conducted for other white sturgeon populations, the most effective method for monitoring white sturgeon spawning is a combined egg collection mat and D-ring program. Egg collection mats provide continuous monitoring during the spawning period and D-rings provide additional data on egg distribution, drift, and hatch success.
MIDDLE COLUMBIA RIVER WHITE STURGEON SPAWN MONITORING: 2009 INVESTIGATIONS DATA REPORT
April 2010 Report No. 09-1480-0044F 17
4.4.5 Management Question 5 Can modifications be made to operations of Revelstoke Dam and Arrow Lakes Reservoir to protect or enhance white sturgeon incubation habitat?
This cannot be answered at this time. To definitively answer this management question, additional studies on the effects of fluctuating water temperatures on white sturgeon embryo development and water temperature and discharge fluctuations on white sturgeon spawning area required. We view these factors as unlikely to have a beneficial effect on spawning, incubation, and development rates. If these factors do have an impact on spawning activity and embryo development, sustained flow levels during the spawning and incubation period may mitigate the effects. Determination of the flow volume or temperature regime required to achieve optimal egg and free embryo survival, and the influence of ALR water levels on these flows will also require additional research.
5.0 RECOMMENDATIONS FOR FUTURE MONITORING The following are recommendations for the 2010 white sturgeon spawn monitoring program in the middle Columbia River to improve the overall understanding of spawning and recruitment in this area. The main management question (MQ) each recommendation is related to are listed at the start of each recommendation.
• MQ4: Continue to monitor white sturgeon spawning in the middle Columbia River using a combined egg collection mat and D-ring program. Egg collection mat sampling will continue to provide coverage of spawning activity 24 hours a day, 7 days week, and D-ring sampling will provide an additional method to collect drifting eggs, free embryos and larvae.
• MQ1: Focus should remain on the historic egg deposition area adjacent to the Revelstoke golf course,
with continued monitoring upstream to the old Steamboat Rapids area. This will provide additional data on the spawning locations used and whether these locations are affected by changes current velocity caused by the backwatering effect of ALR.
• MQ1: Modify the 2010 monitoring program to assess the use of the new white sturgeon spawning
substrate bed constructed adjacent to the Revelstoke golf course in the fall of 2009. Increased use of this area could have implications on the locations of primary incubation sites (MQ1), egg and larval survival (MQ2), and the risk of egg stranding (MQ2). Any modification to the sampling program will be based on the input of the BC Hydro contract authority.
• MQ2, 5: To fully answer these management questions relating to Revelstoke Dam and ALR operations,
and to improve the accuracy of estimates of spawn timing, additional information regarding a variety of factors is required. These include, but are not limited to in situ and/or laboratory studies to provide information on the:
o rate of embryo development in water colder than 10°C; o effects of fluctuating temperatures on the rate of embryo development; and,
MIDDLE COLUMBIA RIVER WHITE STURGEON SPAWN MONITORING: 2009 INVESTIGATIONS DATA REPORT
April 2010 Report No. 09-1480-0044F 18
o effects of discharge and water temperature fluctuations on white sturgeon spawning (i.e., do these fluctuations interrupt spawning and reduce the number of eggs deposited per spawning event).
• MQ2, 5: Increase the frequency that egg mats are checked. This will help to improve accuracy in the
estimation of spawn timing because the eggs collected would be in earlier stages of development. Eggs in early developmental stages provide a more reliable indicator of spawn timing because of the narrower range of time required to reach early developmental stages (Golder 2007). Given the highly variable flow and temperature conditions in the area, more precise estimates of spawn timing are required to identify spawning cues. This would also allow for additional D-ring sampling, which would potentially increase the data obtained regarding egg drift, free embryos and larvae.
• MQ2, 5: Extend the sample period. Based on the developmental stage of the egg captured from the
August 18 spawning event, the estimated time of hatch was August 30 and estimated time of reaching the early larval stage (emergence from hiding phase) was September 7. The colder water temperatures in the middle Columbia River result in longer development times and extending the sample period into early September may provide additional data on white sturgeon reproduction and early life stage survival and drift in this area.
• MQ2: Continue white sturgeon egg stranding surveys as discharge and ALR elevation conditions allow.
Additional data are required to refine an assessment of stranding risk for white sturgeon eggs. A standardized stranding survey procedure should be developed to ensure the required data is collected.
6.0 LITERATURE CITED Auer, N.A. and E.A. Baker. 2002. Duration and drift of larval lake sturgeon in the Sturgeon River, Michigan.
Journal of Applied Ichthyology. 18: 557 – 564.
Beer, K.E. 1981. Embryonic and larval development of white sturgeon (Acipenser transmontanus). MS Thesis, UC Davis. 93 p.
Conte, F.S., S.I. Doroshov, P.B. Lutes, and E.M. Strange. 1988. Hatchery manual for the white sturgeon, Acipenser transmontanus Richardson with application to other North American Acipenseridae. Cooperative Extension, University of California, Division of Agriculture and Natural Resources, Publication 3322: 103 p.
Golder Associates Ltd. 2006. A synthesis of white sturgeon investigations in Arrow Lakes Reservoir, B.C. 1995 - 2003. Report prepared for BC Hydro, Castlegar, B.C. Golder Report No. 041480016F: 61 p. + plates + 11 app.
Golder Associates Ltd. 2007. White sturgeon spawning at Waneta, 2007 investigations. Report prepared for Teck Cominco Metals Ltd. Trail Operations. Golder Report No. 07-1480-0031F: 28 p. + 1 app.
MIDDLE COLUMBIA RIVER WHITE STURGEON SPAWN MONITORING: 2009 INVESTIGATIONS DATA REPORT
April 2010 Report No. 09-1480-0044F 19
Golder Associates Ltd. 2008a. Middle Columbia River white sturgeon spawn monitoring study: 2007 investigations, data report. Report prepared for BC Hydro, Revelstoke, B.C. Golder Report No. 07-1480-0053F: 12 p. + plates + 2 app.
Golder Associates Ltd. 2008b. Lower Columbia River white sturgeon early life history sampling: 2007 investigations. Report prepared for BC Hydro, Revelstoke, B.C. Golder Report No. 07-1480-0036F: 13 p. + 1 app.
Golder Associates Ltd. 2009a. Middle Columbia River white sturgeon spawn monitoring study: 2008 investigations. Report prepared for BC Hydro, Revelstoke, B.C. Golder Report No. 08-1480-0029F: 24 p. + 2 app.
Golder Associates Ltd. 2009b. Lower Columbia River juvenile white sturgeon detection: 2008 investigations data report. Report prepared for BC Hydro, Castlegar, B.C. Golder Report No. 08-1480-0040F: 24 p. + 2 app.
Golder Associates Ltd. 2010. White sturgeon spawning at Waneta, 2009 investigations. Data Report prepared for Columbia Power Corporation, Castlegar, B.C. Golder Report No. 09-1480-0034F: 20 p. + 1 app.
Howell, M.D. and J.G. McLellan. 2006. Lake Roosevelt white sturgeon recovery project, Annual Progress Report, January 2004 - March 2--5. Prepared for the U.S. Department of Energy, Bonneville Power Administration, Environment, Fish and Wildlife. Project Number 1995-027-00. 103 p. + 4 app.
Johnson, P. N., M. H. Tiley, S. LeBourdais and R.C. Bocking. 2009. Monitoring Study No. CLBMON#23b. Mid Columbia River White Sturgeon Underwater Videography Feasibility Study 2008 – 2009 Final Report.
McCabe, G.T. and L.G. Beckman. 1990. Use of an artificial substrate to collect white sturgeon eggs. California Fish and Game. 76(4): 248 – 250.
McCabe, G.T. and C.A. Tracy. 1993. Spawning characteristics and early life history of white sturgeon Acipenser transmontanus in the lower Columbia River. Report A, pages 19 – 46. In: R.C. Beamesderfer and A.A. Nigro (editors). Volume 1: Status and habitat requirements of the white sturgeon populations in the Columbia River downstream from McNary Dam. Final report to Bonneville Power Administration, Portland, Oregon.
Parsley, M.J., L.G. Beckman and G.T. McCabe Jr. 1993. Spawning and rearing habitat use by white sturgeon in the Columbia River downstream from McNary Dam. Transactions of the American Fisheries Society 122: 217 - 227.
Parsley, M.J. and L.G. Beckman. 1994. White sturgeon spawning and rearing habitat in the lower Columbia River. North American Journal of Fisheries Management 14: 812 - 827.
R.L. & L. Environmental Services Ltd. 1996. The distribution and status of white sturgeon in isolated water bodies within the Columbia River Basin in B.C., 1995 study results. Report prepared for BC Ministry of Environment, Lands and Parks. R. L. & L. Report No. 468aD: 12 p. + 2 app.
Smith, K.M. and D.K. King. 2005. Dynamics of larval lake sturgeon Acipenser fulvescens drift in the Upper Black River, Michigan. Journal of Applied Ichthyology. 21: 161 – 168.
MIDDLE COLUMBIA RIVER WHITE STURGEON SPAWN MONITORING: 2009 INVESTIGATIONS DATA REPORT
April 2010 Report No. 09-1480-0044F 20
Tiley, M. 2006a. Habitat use of Arrow Lakes Reservoir pre-spawning and spawning adult white sturgeon (Acipenser transmontanus), timing of spawning and embryo and larval survival. Prepared for World Wildlife Fund Canada Endangered Species Recovery fund. 14 p.
Tiley, M. 2006b. Arrow Lakes Reservoir white sturgeon (Acipenser transmontanus) spawning periodicity and embryo and larval development downstream of Revelstoke Dam and estimated effects of river impoundment on the timing of spawning. Prepared for World Wildlife Fund Canada Endangered Species Recovery fund. 45 p.
Tiley, M.H., P.N. Johnson and R.C. Bocking. 2008. Monitoring Study No. CLBMON#23b. Mid Columbia River white sturgeon underwater feasibility study 2007 annual report (final).
UCWSRI. 2002. Upper Columbia White Sturgeon Recovery Plan. 28 November, 2002. Prepared by the Upper Columbia White Sturgeon Recovery Initiative. 90p. + app.
Wang, Y.L., F.P. Binkowski, and S.I. Doroshov. 1985. Effect of temperature on early development of white and lake sturgeon, Acipenser transmontanus and A. fulvescens. Environmental Biology of Fishes 14: 43 - 50.
MIDDLE COLUMBIA RIVER WHITE STURGEON SPAWN MONITORING: 2009 INVESTIGATIONS DATA REPORT
April 2010 Report No. 09-1480-0044F 21
Report Signature Page
Michael Hildebrand Larry Hildebrand Fisheries Biologist Principal/Senior Fisheries Scientist
MH/LH/cm
n:\active\8000\2009 projects\09-1480-0044 mcr wsg spawn monitoring\reports\final\clbmon23 final report text.docx
MIDDLE COLUMBIA RIVER WHITE STURGEON SPAWN MONITORING: 2009 INVESTIGATIONS DATA REPORT
April 2010 Report No. 09-1480-0044F
APPENDIX A 2009 Sample Data
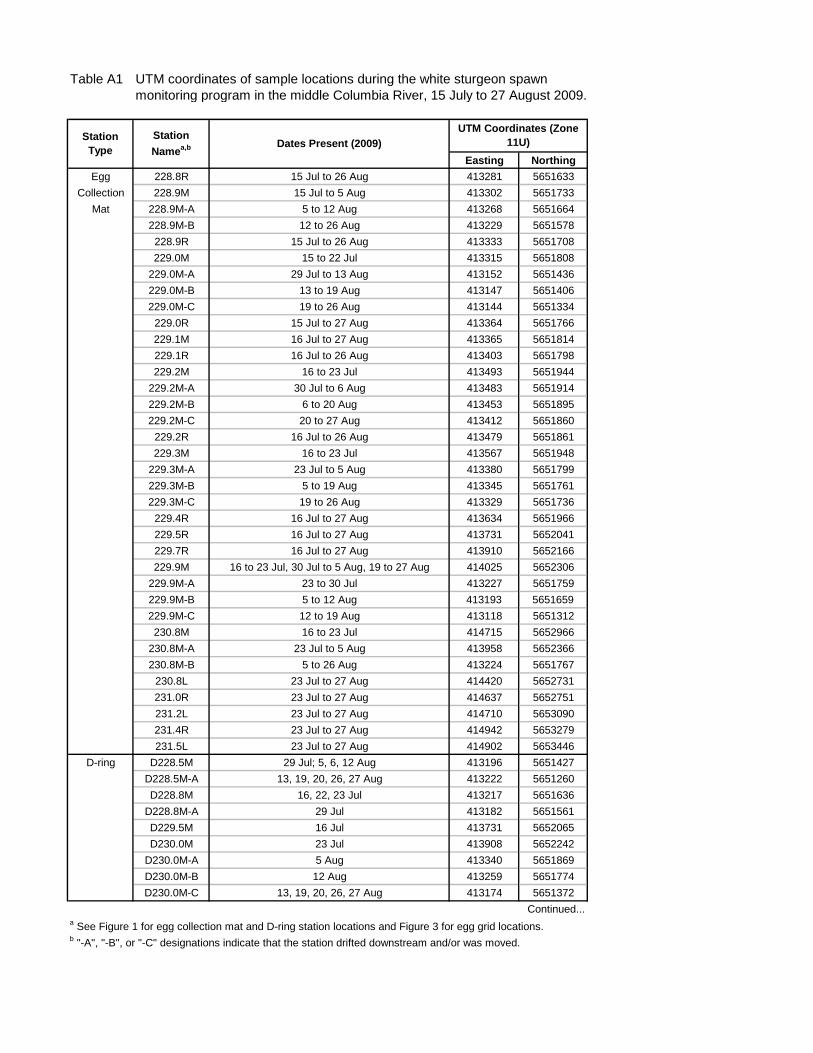
Table A1 UTM coordinates of sample locations during the white sturgeon spawnmonitoring program in the middle Columbia River, 15 July to 27 August 2009.
Easting NorthingEgg 228.8R 15 Jul to 26 Aug 413281 5651633
Collection 228.9M 15 Jul to 5 Aug 413302 5651733
Mat 228.9M-A 5 to 12 Aug 413268 5651664
228.9M-B 12 to 26 Aug 413229 5651578
228.9R 15 Jul to 26 Aug 413333 5651708
229.0M 15 to 22 Jul 413315 5651808
229.0M-A 29 Jul to 13 Aug 413152 5651436
229.0M-B 13 to 19 Aug 413147 5651406
229.0M-C 19 to 26 Aug 413144 5651334
229.0R 15 Jul to 27 Aug 413364 5651766
229.1M 16 Jul to 27 Aug 413365 5651814
229.1R 16 Jul to 26 Aug 413403 5651798
229.2M 16 to 23 Jul 413493 5651944
229.2M-A 30 Jul to 6 Aug 413483 5651914
229.2M-B 6 to 20 Aug 413453 5651895
229.2M-C 20 to 27 Aug 413412 5651860
229.2R 16 Jul to 26 Aug 413479 5651861
229.3M 16 to 23 Jul 413567 5651948
229.3M-A 23 Jul to 5 Aug 413380 5651799
229.3M-B 5 to 19 Aug 413345 5651761
229.3M-C 19 to 26 Aug 413329 5651736
229.4R 16 Jul to 27 Aug 413634 5651966
229.5R 16 Jul to 27 Aug 413731 5652041
229.7R 16 Jul to 27 Aug 413910 5652166
229.9M 16 to 23 Jul, 30 Jul to 5 Aug, 19 to 27 Aug 414025 5652306
229.9M-A 23 to 30 Jul 413227 5651759
229.9M-B 5 to 12 Aug 413193 5651659
229.9M-C 12 to 19 Aug 413118 5651312
230.8M 16 to 23 Jul 414715 5652966
230.8M-A 23 Jul to 5 Aug 413958 5652366
230.8M-B 5 to 26 Aug 413224 5651767
230.8L 23 Jul to 27 Aug 414420 5652731
231.0R 23 Jul to 27 Aug 414637 5652751
231.2L 23 Jul to 27 Aug 414710 5653090
231.4R 23 Jul to 27 Aug 414942 5653279
231.5L 23 Jul to 27 Aug 414902 5653446
D-ring D228.5M 29 Jul; 5, 6, 12 Aug 413196 5651427
D228.5M-A 13, 19, 20, 26, 27 Aug 413222 5651260
D228.8M 16, 22, 23 Jul 413217 5651636
D228.8M-A 29 Jul 413182 5651561
D229.5M 16 Jul 413731 5652065
D230.0M 23 Jul 413908 5652242
D230.0M-A 5 Aug 413340 5651869
D230.0M-B 12 Aug 413259 5651774
D230.0M-C 13, 19, 20, 26, 27 Aug 413174 5651372
Continued...a See Figure 1 for egg collection mat and D-ring station locations and Figure 3 for egg grid locations.b "-A", "-B", or "-C" designations indicate that the station drifted downstream and/or was moved.
Station Type
Station Namea,b Dates Present (2009)
UTM Coordinates (Zone 11U)
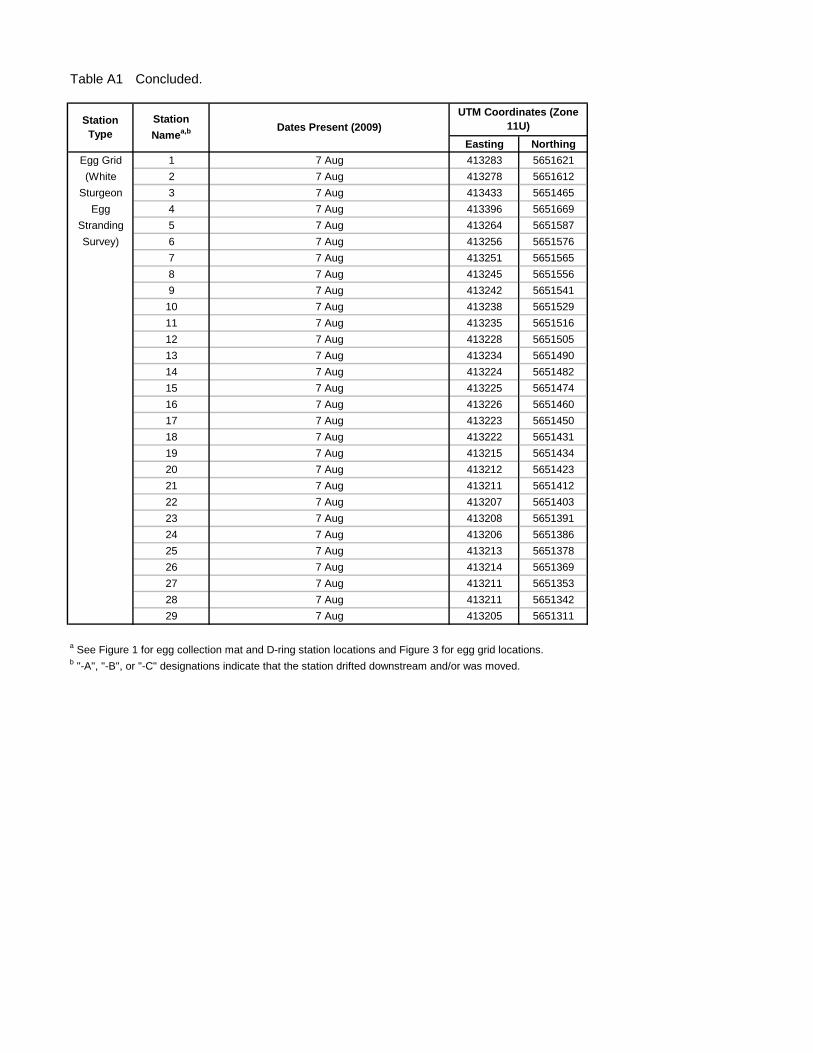
Table A1 Concluded.
Easting NorthingEgg Grid 1 7 Aug 413283 5651621
(White 2 7 Aug 413278 5651612
Sturgeon 3 7 Aug 413433 5651465
Egg 4 7 Aug 413396 5651669
Stranding 5 7 Aug 413264 5651587
Survey) 6 7 Aug 413256 5651576
7 7 Aug 413251 5651565
8 7 Aug 413245 5651556
9 7 Aug 413242 5651541
10 7 Aug 413238 5651529
11 7 Aug 413235 5651516
12 7 Aug 413228 5651505
13 7 Aug 413234 5651490
14 7 Aug 413224 5651482
15 7 Aug 413225 5651474
16 7 Aug 413226 5651460
17 7 Aug 413223 5651450
18 7 Aug 413222 5651431
19 7 Aug 413215 5651434
20 7 Aug 413212 5651423
21 7 Aug 413211 5651412
22 7 Aug 413207 5651403
23 7 Aug 413208 5651391
24 7 Aug 413206 5651386
25 7 Aug 413213 5651378
26 7 Aug 413214 5651369
27 7 Aug 413211 5651353
28 7 Aug 413211 5651342
29 7 Aug 413205 5651311
a See Figure 1 for egg collection mat and D-ring station locations and Figure 3 for egg grid locations.b "-A", "-B", or "-C" designations indicate that the station drifted downstream and/or was moved.
Station Type
Station Namea,b Dates Present (2009)
UTM Coordinates (Zone 11U)
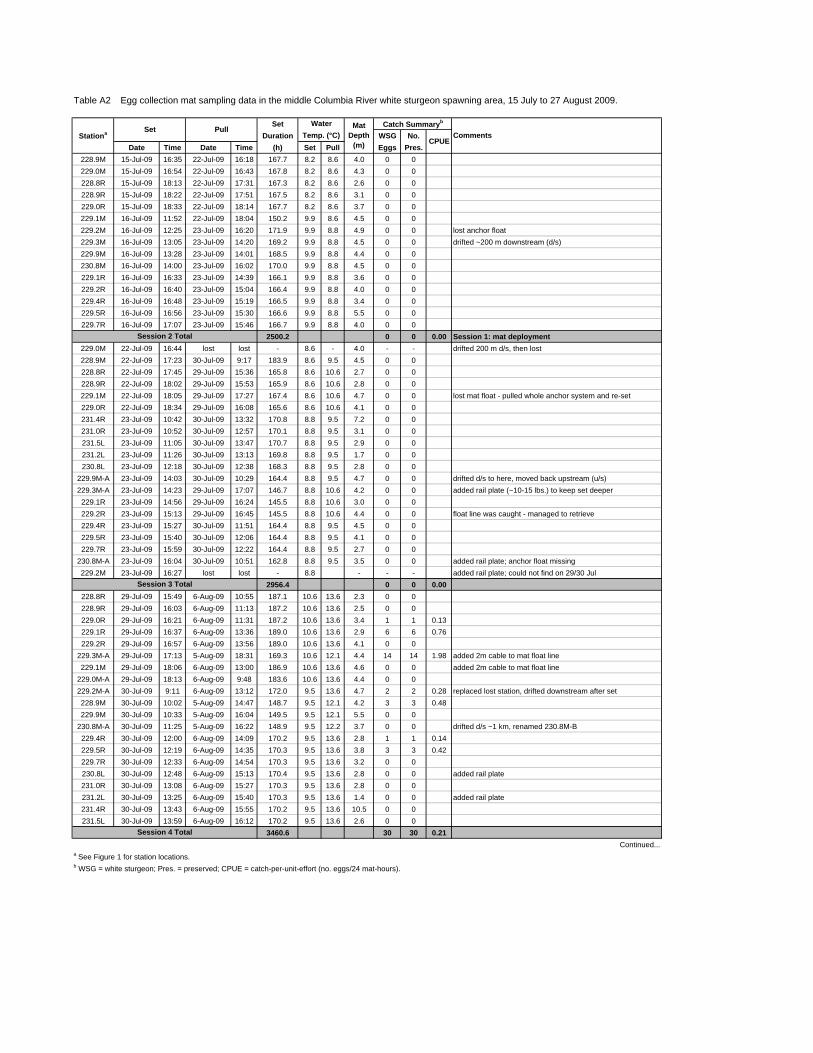
Table A2 Egg collection mat sampling data in the middle Columbia River white sturgeon spawning area, 15 July to 27 August 2009.
SetDuration WSG No.
Date Time Date Time (h) Set Pull Eggs Pres.228.9M 15-Jul-09 16:35 22-Jul-09 16:18 167.7 8.2 8.6 4.0 0 0
229.0M 15-Jul-09 16:54 22-Jul-09 16:43 167.8 8.2 8.6 4.3 0 0
228.8R 15-Jul-09 18:13 22-Jul-09 17:31 167.3 8.2 8.6 2.6 0 0
228.9R 15-Jul-09 18:22 22-Jul-09 17:51 167.5 8.2 8.6 3.1 0 0
229.0R 15-Jul-09 18:33 22-Jul-09 18:14 167.7 8.2 8.6 3.7 0 0
229.1M 16-Jul-09 11:52 22-Jul-09 18:04 150.2 9.9 8.6 4.5 0 0
229.2M 16-Jul-09 12:25 23-Jul-09 16:20 171.9 9.9 8.8 4.9 0 0 lost anchor float
229.3M 16-Jul-09 13:05 23-Jul-09 14:20 169.2 9.9 8.8 4.5 0 0 drifted ~200 m downstream (d/s)
229.9M 16-Jul-09 13:28 23-Jul-09 14:01 168.5 9.9 8.8 4.4 0 0
230.8M 16-Jul-09 14:00 23-Jul-09 16:02 170.0 9.9 8.8 4.5 0 0
229.1R 16-Jul-09 16:33 23-Jul-09 14:39 166.1 9.9 8.8 3.6 0 0
229.2R 16-Jul-09 16:40 23-Jul-09 15:04 166.4 9.9 8.8 4.0 0 0
229.4R 16-Jul-09 16:48 23-Jul-09 15:19 166.5 9.9 8.8 3.4 0 0
229.5R 16-Jul-09 16:56 23-Jul-09 15:30 166.6 9.9 8.8 5.5 0 0
229.7R 16-Jul-09 17:07 23-Jul-09 15:46 166.7 9.9 8.8 4.0 0 0
2500.2 0 0 0.00 Session 1: mat deployment229.0M 22-Jul-09 16:44 lost lost - 8.6 - 4.0 - - drifted 200 m d/s, then lost
228.9M 22-Jul-09 17:23 30-Jul-09 9:17 183.9 8.6 9.5 4.5 0 0
228.8R 22-Jul-09 17:45 29-Jul-09 15:36 165.8 8.6 10.6 2.7 0 0
228.9R 22-Jul-09 18:02 29-Jul-09 15:53 165.9 8.6 10.6 2.8 0 0
229.1M 22-Jul-09 18:05 29-Jul-09 17:27 167.4 8.6 10.6 4.7 0 0 lost mat float - pulled whole anchor system and re-set
229.0R 22-Jul-09 18:34 29-Jul-09 16:08 165.6 8.6 10.6 4.1 0 0
231.4R 23-Jul-09 10:42 30-Jul-09 13:32 170.8 8.8 9.5 7.2 0 0
231.0R 23-Jul-09 10:52 30-Jul-09 12:57 170.1 8.8 9.5 3.1 0 0
231.5L 23-Jul-09 11:05 30-Jul-09 13:47 170.7 8.8 9.5 2.9 0 0
231.2L 23-Jul-09 11:26 30-Jul-09 13:13 169.8 8.8 9.5 1.7 0 0
230.8L 23-Jul-09 12:18 30-Jul-09 12:38 168.3 8.8 9.5 2.8 0 0
229.9M-A 23-Jul-09 14:03 30-Jul-09 10:29 164.4 8.8 9.5 4.7 0 0 drifted d/s to here, moved back upstream (u/s)
229.3M-A 23-Jul-09 14:23 29-Jul-09 17:07 146.7 8.8 10.6 4.2 0 0 added rail plate (~10-15 lbs.) to keep set deeper
229.1R 23-Jul-09 14:56 29-Jul-09 16:24 145.5 8.8 10.6 3.0 0 0
229.2R 23-Jul-09 15:13 29-Jul-09 16:45 145.5 8.8 10.6 4.4 0 0 float line was caught - managed to retrieve
229.4R 23-Jul-09 15:27 30-Jul-09 11:51 164.4 8.8 9.5 4.5 0 0
229.5R 23-Jul-09 15:40 30-Jul-09 12:06 164.4 8.8 9.5 4.1 0 0
229.7R 23-Jul-09 15:59 30-Jul-09 12:22 164.4 8.8 9.5 2.7 0 0
230.8M-A 23-Jul-09 16:04 30-Jul-09 10:51 162.8 8.8 9.5 3.5 0 0 added rail plate; anchor float missing
229.2M 23-Jul-09 16:27 lost lost - 8.8 - - - added rail plate; could not find on 29/30 Jul
2956.4 0 0 0.00228.8R 29-Jul-09 15:49 6-Aug-09 10:55 187.1 10.6 13.6 2.3 0 0
228.9R 29-Jul-09 16:03 6-Aug-09 11:13 187.2 10.6 13.6 2.5 0 0
229.0R 29-Jul-09 16:21 6-Aug-09 11:31 187.2 10.6 13.6 3.4 1 1 0.13
229.1R 29-Jul-09 16:37 6-Aug-09 13:36 189.0 10.6 13.6 2.9 6 6 0.76
229.2R 29-Jul-09 16:57 6-Aug-09 13:56 189.0 10.6 13.6 4.1 0 0
229.3M-A 29-Jul-09 17:13 5-Aug-09 18:31 169.3 10.6 12.1 4.4 14 14 1.98 added 2m cable to mat float line
229.1M 29-Jul-09 18:06 6-Aug-09 13:00 186.9 10.6 13.6 4.6 0 0 added 2m cable to mat float line
229.0M-A 29-Jul-09 18:13 6-Aug-09 9:48 183.6 10.6 13.6 4.4 0 0
229.2M-A 30-Jul-09 9:11 6-Aug-09 13:12 172.0 9.5 13.6 4.7 2 2 0.28 replaced lost station, drifted downstream after set
228.9M 30-Jul-09 10:02 5-Aug-09 14:47 148.7 9.5 12.1 4.2 3 3 0.48
229.9M 30-Jul-09 10:33 5-Aug-09 16:04 149.5 9.5 12.1 5.5 0 0
230.8M-A 30-Jul-09 11:25 5-Aug-09 16:22 148.9 9.5 12.2 3.7 0 0 drifted d/s ~1 km, renamed 230.8M-B
229.4R 30-Jul-09 12:00 6-Aug-09 14:09 170.2 9.5 13.6 2.8 1 1 0.14
229.5R 30-Jul-09 12:19 6-Aug-09 14:35 170.3 9.5 13.6 3.8 3 3 0.42
229.7R 30-Jul-09 12:33 6-Aug-09 14:54 170.3 9.5 13.6 3.2 0 0
230.8L 30-Jul-09 12:48 6-Aug-09 15:13 170.4 9.5 13.6 2.8 0 0 added rail plate
231.0R 30-Jul-09 13:08 6-Aug-09 15:27 170.3 9.5 13.6 2.8 0 0
231.2L 30-Jul-09 13:25 6-Aug-09 15:40 170.3 9.5 13.6 1.4 0 0 added rail plate
231.4R 30-Jul-09 13:43 6-Aug-09 15:55 170.2 9.5 13.6 10.5 0 0
231.5L 30-Jul-09 13:59 6-Aug-09 16:12 170.2 9.5 13.6 2.6 0 0
3460.6 30 30 0.21Continued...
a See Figure 1 for station locations.b WSG = white sturgeon; Pres. = preserved; CPUE = catch-per-unit-effort (no. eggs/24 mat-hours).
Session 3 Total
Session 4 Total
Stationa Set PullWater
Session 2 Total
Mat Depth
(m)
Catch Summaryb
CPUECommentsTemp. (°C)
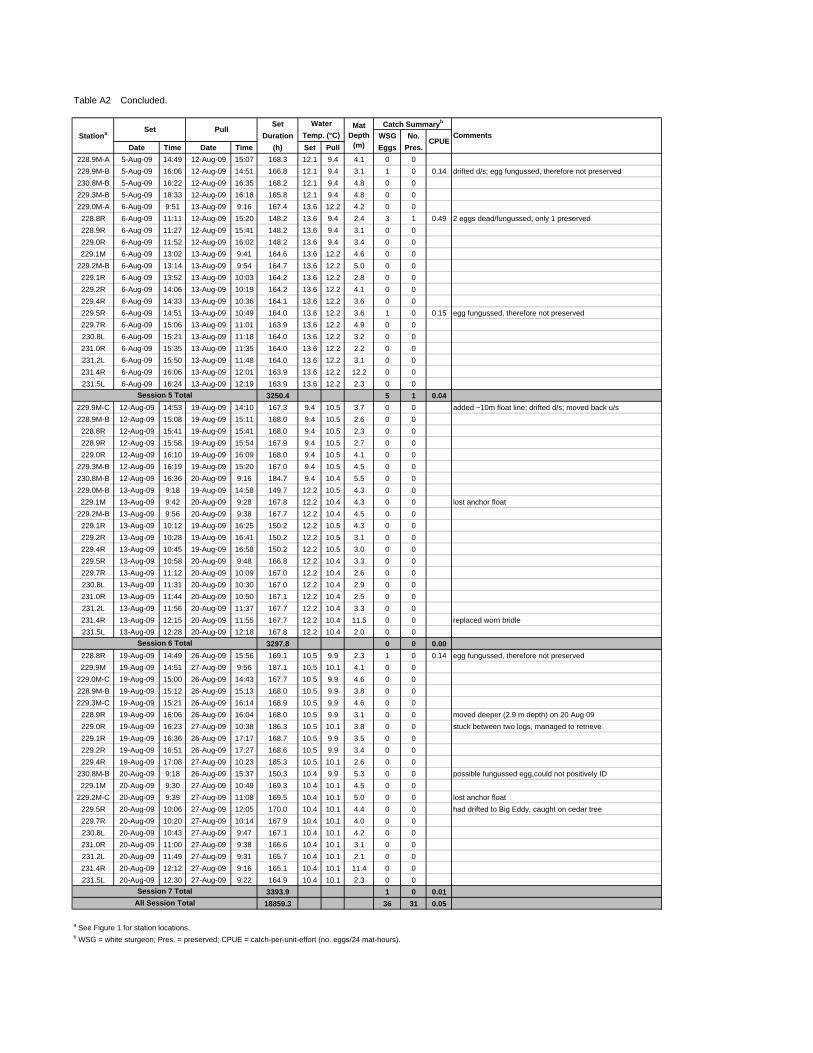
Table A2 Concluded.
SetDuration WSG No.
Date Time Date Time (h) Set Pull Eggs Pres.228.9M-A 5-Aug-09 14:49 12-Aug-09 15:07 168.3 12.1 9.4 4.1 0 0
229.9M-B 5-Aug-09 16:06 12-Aug-09 14:51 166.8 12.1 9.4 3.1 1 0 0.14 drifted d/s; egg fungussed, therefore not preserved
230.8M-B 5-Aug-09 16:22 12-Aug-09 16:35 168.2 12.1 9.4 4.8 0 0
229.3M-B 5-Aug-09 18:33 12-Aug-09 16:18 165.8 12.1 9.4 4.8 0 0
229.0M-A 6-Aug-09 9:51 13-Aug-09 9:16 167.4 13.6 12.2 4.2 0 0
228.8R 6-Aug-09 11:11 12-Aug-09 15:20 148.2 13.6 9.4 2.4 3 1 0.49 2 eggs dead/fungussed; only 1 preserved
228.9R 6-Aug-09 11:27 12-Aug-09 15:41 148.2 13.6 9.4 3.1 0 0
229.0R 6-Aug-09 11:52 12-Aug-09 16:02 148.2 13.6 9.4 3.4 0 0
229.1M 6-Aug-09 13:02 13-Aug-09 9:41 164.6 13.6 12.2 4.6 0 0
229.2M-B 6-Aug-09 13:14 13-Aug-09 9:54 164.7 13.6 12.2 5.0 0 0
229.1R 6-Aug-09 13:52 13-Aug-09 10:03 164.2 13.6 12.2 2.8 0 0
229.2R 6-Aug-09 14:06 13-Aug-09 10:19 164.2 13.6 12.2 4.1 0 0
229.4R 6-Aug-09 14:33 13-Aug-09 10:36 164.1 13.6 12.2 3.6 0 0
229.5R 6-Aug-09 14:51 13-Aug-09 10:49 164.0 13.6 12.2 3.6 1 0 0.15 egg fungussed, therefore not preserved
229.7R 6-Aug-09 15:06 13-Aug-09 11:01 163.9 13.6 12.2 4.9 0 0
230.8L 6-Aug-09 15:21 13-Aug-09 11:18 164.0 13.6 12.2 3.2 0 0
231.0R 6-Aug-09 15:35 13-Aug-09 11:35 164.0 13.6 12.2 2.2 0 0
231.2L 6-Aug-09 15:50 13-Aug-09 11:48 164.0 13.6 12.2 3.1 0 0
231.4R 6-Aug-09 16:06 13-Aug-09 12:01 163.9 13.6 12.2 12.2 0 0
231.5L 6-Aug-09 16:24 13-Aug-09 12:19 163.9 13.6 12.2 2.3 0 0
3250.4 5 1 0.04229.9M-C 12-Aug-09 14:53 19-Aug-09 14:10 167.3 9.4 10.5 3.7 0 0 added ~10m float line; drifted d/s; moved back u/s
228.9M-B 12-Aug-09 15:08 19-Aug-09 15:11 168.0 9.4 10.5 2.6 0 0
228.8R 12-Aug-09 15:41 19-Aug-09 15:41 168.0 9.4 10.5 2.3 0 0
228.9R 12-Aug-09 15:58 19-Aug-09 15:54 167.9 9.4 10.5 2.7 0 0
229.0R 12-Aug-09 16:10 19-Aug-09 16:09 168.0 9.4 10.5 4.1 0 0
229.3M-B 12-Aug-09 16:19 19-Aug-09 15:20 167.0 9.4 10.5 4.5 0 0
230.8M-B 12-Aug-09 16:36 20-Aug-09 9:16 184.7 9.4 10.4 5.5 0 0
229.0M-B 13-Aug-09 9:18 19-Aug-09 14:58 149.7 12.2 10.5 4.3 0 0
229.1M 13-Aug-09 9:42 20-Aug-09 9:28 167.8 12.2 10.4 4.3 0 0 lost anchor float
229.2M-B 13-Aug-09 9:56 20-Aug-09 9:38 167.7 12.2 10.4 4.5 0 0
229.1R 13-Aug-09 10:12 19-Aug-09 16:25 150.2 12.2 10.5 4.3 0 0
229.2R 13-Aug-09 10:28 19-Aug-09 16:41 150.2 12.2 10.5 3.1 0 0
229.4R 13-Aug-09 10:45 19-Aug-09 16:58 150.2 12.2 10.5 3.0 0 0
229.5R 13-Aug-09 10:58 20-Aug-09 9:48 166.8 12.2 10.4 3.3 0 0
229.7R 13-Aug-09 11:12 20-Aug-09 10:09 167.0 12.2 10.4 2.6 0 0
230.8L 13-Aug-09 11:31 20-Aug-09 10:30 167.0 12.2 10.4 2.9 0 0
231.0R 13-Aug-09 11:44 20-Aug-09 10:50 167.1 12.2 10.4 2.5 0 0
231.2L 13-Aug-09 11:56 20-Aug-09 11:37 167.7 12.2 10.4 3.3 0 0
231.4R 13-Aug-09 12:15 20-Aug-09 11:55 167.7 12.2 10.4 11.5 0 0 replaced worn bridle
231.5L 13-Aug-09 12:28 20-Aug-09 12:18 167.8 12.2 10.4 2.0 0 0
3297.8 0 0 0.00228.8R 19-Aug-09 14:49 26-Aug-09 15:56 169.1 10.5 9.9 2.3 1 0 0.14 egg fungussed, therefore not preserved
229.9M 19-Aug-09 14:51 27-Aug-09 9:56 187.1 10.5 10.1 4.1 0 0
229.0M-C 19-Aug-09 15:00 26-Aug-09 14:43 167.7 10.5 9.9 4.6 0 0
228.9M-B 19-Aug-09 15:12 26-Aug-09 15:13 168.0 10.5 9.9 3.8 0 0
229.3M-C 19-Aug-09 15:21 26-Aug-09 16:14 168.9 10.5 9.9 4.6 0 0
228.9R 19-Aug-09 16:06 26-Aug-09 16:04 168.0 10.5 9.9 3.1 0 0 moved deeper (2.9 m depth) on 20 Aug 09
229.0R 19-Aug-09 16:23 27-Aug-09 10:38 186.3 10.5 10.1 3.8 0 0 stuck between two logs, managed to retrieve
229.1R 19-Aug-09 16:36 26-Aug-09 17:17 168.7 10.5 9.9 3.5 0 0
229.2R 19-Aug-09 16:51 26-Aug-09 17:27 168.6 10.5 9.9 3.4 0 0
229.4R 19-Aug-09 17:08 27-Aug-09 10:23 185.3 10.5 10.1 2.6 0 0
230.8M-B 20-Aug-09 9:18 26-Aug-09 15:37 150.3 10.4 9.9 5.3 0 0 possible fungussed egg,could not positively ID
229.1M 20-Aug-09 9:30 27-Aug-09 10:49 169.3 10.4 10.1 4.5 0 0
229.2M-C 20-Aug-09 9:39 27-Aug-09 11:08 169.5 10.4 10.1 5.0 0 0 lost anchor float
229.5R 20-Aug-09 10:06 27-Aug-09 12:05 170.0 10.4 10.1 4.4 0 0 had drifted to Big Eddy, caught on cedar tree
229.7R 20-Aug-09 10:20 27-Aug-09 10:14 167.9 10.4 10.1 4.0 0 0
230.8L 20-Aug-09 10:43 27-Aug-09 9:47 167.1 10.4 10.1 4.2 0 0
231.0R 20-Aug-09 11:00 27-Aug-09 9:38 166.6 10.4 10.1 3.1 0 0
231.2L 20-Aug-09 11:49 27-Aug-09 9:31 165.7 10.4 10.1 2.1 0 0
231.4R 20-Aug-09 12:12 27-Aug-09 9:16 165.1 10.4 10.1 11.4 0 0
231.5L 20-Aug-09 12:30 27-Aug-09 9:22 164.9 10.4 10.1 2.3 0 0
3393.9 1 0 0.0118859.3 36 31 0.05
a See Figure 1 for station locations.b WSG = white sturgeon; Pres. = preserved; CPUE = catch-per-unit-effort (no. eggs/24 mat-hours).
Session 7 TotalAll Session Total
Session 5 Total
Session 6 Total
Water Mat Depth
(m)
Catch Summaryb
CommentsTemp. (°C)CPUE
Stationa Set Pull
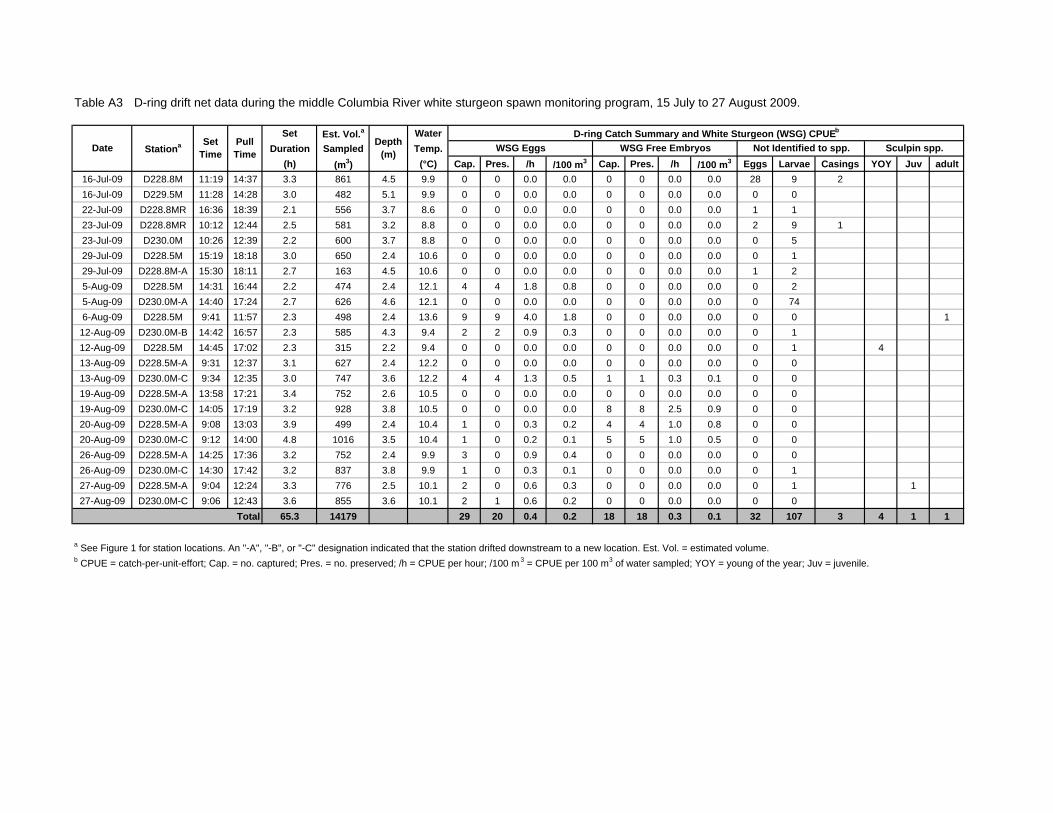
Table A3 D-ring drift net data during the middle Columbia River white sturgeon spawn monitoring program, 15 July to 27 August 2009.
Set Est. Vol.a WaterDuration Sampled Temp.
(h) (m3) (°C) Cap. Pres. /h /100 m3 Cap. Pres. /h /100 m3 Eggs Larvae Casings YOY Juv adult16-Jul-09 D228.8M 11:19 14:37 3.3 861 4.5 9.9 0 0 0.0 0.0 0 0 0.0 0.0 28 9 2
16-Jul-09 D229.5M 11:28 14:28 3.0 482 5.1 9.9 0 0 0.0 0.0 0 0 0.0 0.0 0 0
22-Jul-09 D228.8MR 16:36 18:39 2.1 556 3.7 8.6 0 0 0.0 0.0 0 0 0.0 0.0 1 1
23-Jul-09 D228.8MR 10:12 12:44 2.5 581 3.2 8.8 0 0 0.0 0.0 0 0 0.0 0.0 2 9 1
23-Jul-09 D230.0M 10:26 12:39 2.2 600 3.7 8.8 0 0 0.0 0.0 0 0 0.0 0.0 0 5
29-Jul-09 D228.5M 15:19 18:18 3.0 650 2.4 10.6 0 0 0.0 0.0 0 0 0.0 0.0 0 1
29-Jul-09 D228.8M-A 15:30 18:11 2.7 163 4.5 10.6 0 0 0.0 0.0 0 0 0.0 0.0 1 2
5-Aug-09 D228.5M 14:31 16:44 2.2 474 2.4 12.1 4 4 1.8 0.8 0 0 0.0 0.0 0 2
5-Aug-09 D230.0M-A 14:40 17:24 2.7 626 4.6 12.1 0 0 0.0 0.0 0 0 0.0 0.0 0 74
6-Aug-09 D228.5M 9:41 11:57 2.3 498 2.4 13.6 9 9 4.0 1.8 0 0 0.0 0.0 0 0 1
12-Aug-09 D230.0M-B 14:42 16:57 2.3 585 4.3 9.4 2 2 0.9 0.3 0 0 0.0 0.0 0 1
12-Aug-09 D228.5M 14:45 17:02 2.3 315 2.2 9.4 0 0 0.0 0.0 0 0 0.0 0.0 0 1 4
13-Aug-09 D228.5M-A 9:31 12:37 3.1 627 2.4 12.2 0 0 0.0 0.0 0 0 0.0 0.0 0 0
13-Aug-09 D230.0M-C 9:34 12:35 3.0 747 3.6 12.2 4 4 1.3 0.5 1 1 0.3 0.1 0 0
19-Aug-09 D228.5M-A 13:58 17:21 3.4 752 2.6 10.5 0 0 0.0 0.0 0 0 0.0 0.0 0 0
19-Aug-09 D230.0M-C 14:05 17:19 3.2 928 3.8 10.5 0 0 0.0 0.0 8 8 2.5 0.9 0 0
20-Aug-09 D228.5M-A 9:08 13:03 3.9 499 2.4 10.4 1 0 0.3 0.2 4 4 1.0 0.8 0 0
20-Aug-09 D230.0M-C 9:12 14:00 4.8 1016 3.5 10.4 1 0 0.2 0.1 5 5 1.0 0.5 0 0
26-Aug-09 D228.5M-A 14:25 17:36 3.2 752 2.4 9.9 3 0 0.9 0.4 0 0 0.0 0.0 0 0
26-Aug-09 D230.0M-C 14:30 17:42 3.2 837 3.8 9.9 1 0 0.3 0.1 0 0 0.0 0.0 0 1
27-Aug-09 D228.5M-A 9:04 12:24 3.3 776 2.5 10.1 2 0 0.6 0.3 0 0 0.0 0.0 0 1 1
27-Aug-09 D230.0M-C 9:06 12:43 3.6 855 3.6 10.1 2 1 0.6 0.2 0 0 0.0 0.0 0 0
Total 65.3 14179 29 20 0.4 0.2 18 18 0.3 0.1 32 107 3 4 1 1
a See Figure 1 for station locations. An "-A", "-B", or "-C" designation indicated that the station drifted downstream to a new location. Est. Vol. = estimated volume.b CPUE = catch-per-unit-effort; Cap. = no. captured; Pres. = no. preserved; /h = CPUE per hour; /100 m 3 = CPUE per 100 m3 of water sampled; YOY = young of the year; Juv = juvenile.
Set Time
Pull TimeStationaDate Not Identified to spp.Depth
(m)
D-ring Catch Summary and White Sturgeon (WSG) CPUEb
Sculpin spp.WSG Eggs WSG Free Embryos
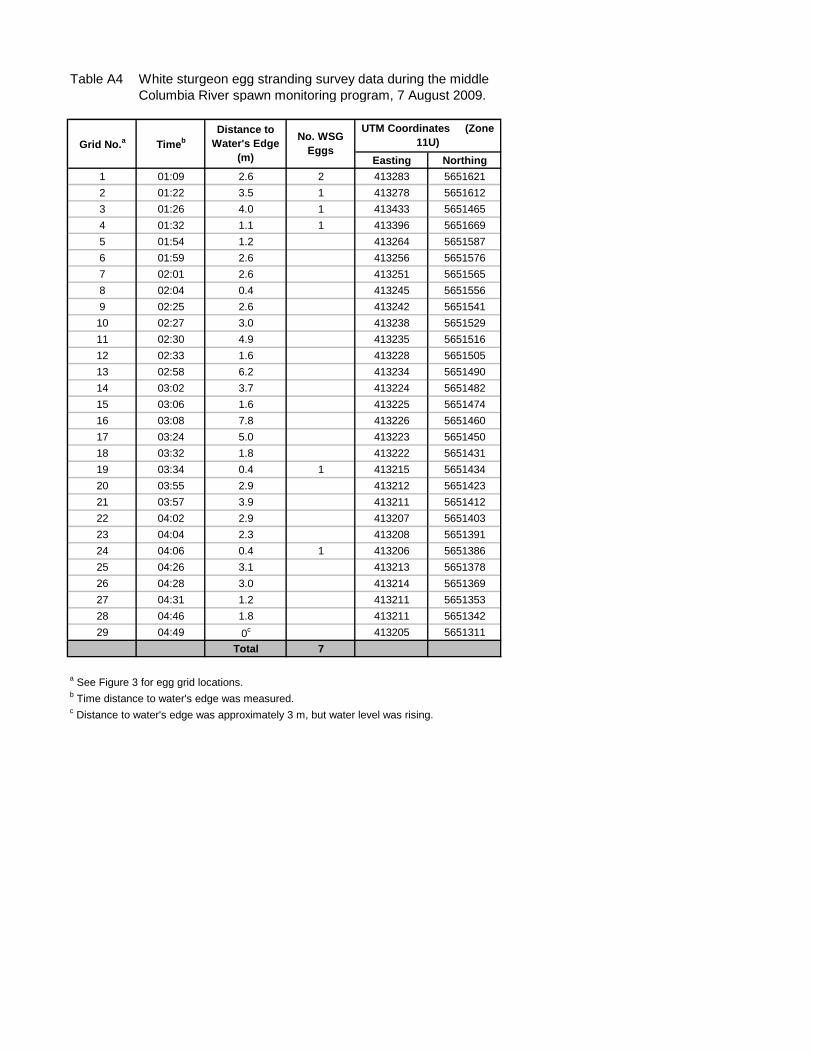
Table A4 White sturgeon egg stranding survey data during the middleColumbia River spawn monitoring program, 7 August 2009.
Easting Northing1 01:09 2.6 2 413283 56516212 01:22 3.5 1 413278 56516123 01:26 4.0 1 413433 56514654 01:32 1.1 1 413396 56516695 01:54 1.2 413264 56515876 01:59 2.6 413256 56515767 02:01 2.6 413251 56515658 02:04 0.4 413245 56515569 02:25 2.6 413242 565154110 02:27 3.0 413238 565152911 02:30 4.9 413235 565151612 02:33 1.6 413228 565150513 02:58 6.2 413234 565149014 03:02 3.7 413224 565148215 03:06 1.6 413225 565147416 03:08 7.8 413226 565146017 03:24 5.0 413223 565145018 03:32 1.8 413222 565143119 03:34 0.4 1 413215 565143420 03:55 2.9 413212 565142321 03:57 3.9 413211 565141222 04:02 2.9 413207 565140323 04:04 2.3 413208 565139124 04:06 0.4 1 413206 565138625 04:26 3.1 413213 565137826 04:28 3.0 413214 565136927 04:31 1.2 413211 565135328 04:46 1.8 413211 565134229 04:49 0c 413205 5651311
Total 7
a See Figure 3 for egg grid locations.b Time distance to water's edge was measured.c Distance to water's edge was approximately 3 m, but water level was rising.
Grid No.a TimebDistance to
Water's Edge (m)
No. WSG Eggs
UTM Coordinates (Zone 11U)
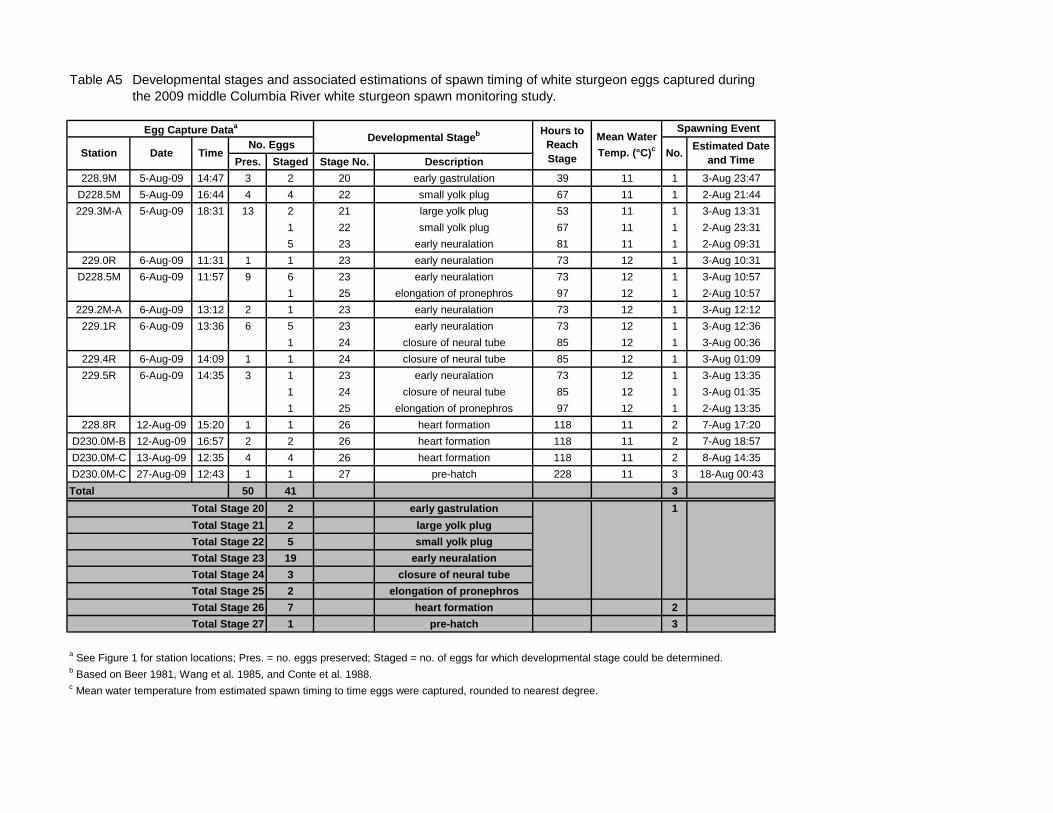
Table A5
Pres. Staged Stage No. Description228.9M 5-Aug-09 14:47 3 2 20 early gastrulation 39 11 1 3-Aug 23:47
D228.5M 5-Aug-09 16:44 4 4 22 small yolk plug 67 11 1 2-Aug 21:44229.3M-A 5-Aug-09 18:31 13 2 21 large yolk plug 53 11 1 3-Aug 13:31
1 22 small yolk plug 67 11 1 2-Aug 23:315 23 early neuralation 81 11 1 2-Aug 09:31
229.0R 6-Aug-09 11:31 1 1 23 early neuralation 73 12 1 3-Aug 10:31D228.5M 6-Aug-09 11:57 9 6 23 early neuralation 73 12 1 3-Aug 10:57
1 25 elongation of pronephros 97 12 1 2-Aug 10:57229.2M-A 6-Aug-09 13:12 2 1 23 early neuralation 73 12 1 3-Aug 12:12229.1R 6-Aug-09 13:36 6 5 23 early neuralation 73 12 1 3-Aug 12:36
1 24 closure of neural tube 85 12 1 3-Aug 00:36229.4R 6-Aug-09 14:09 1 1 24 closure of neural tube 85 12 1 3-Aug 01:09229.5R 6-Aug-09 14:35 3 1 23 early neuralation 73 12 1 3-Aug 13:35
1 24 closure of neural tube 85 12 1 3-Aug 01:351 25 elongation of pronephros 97 12 1 2-Aug 13:35
228.8R 12-Aug-09 15:20 1 1 26 heart formation 118 11 2 7-Aug 17:20D230.0M-B 12-Aug-09 16:57 2 2 26 heart formation 118 11 2 7-Aug 18:57D230.0M-C 13-Aug-09 12:35 4 4 26 heart formation 118 11 2 8-Aug 14:35D230.0M-C 27-Aug-09 12:43 1 1 27 pre-hatch 228 11 3 18-Aug 00:43Total 50 41 3
Total Stage 20 2 early gastrulation 1Total Stage 21 2 large yolk plugTotal Stage 22 5 small yolk plugTotal Stage 23 19 early neuralationTotal Stage 24 3 closure of neural tubeTotal Stage 25 2 elongation of pronephrosTotal Stage 26 7 heart formation 2Total Stage 27 1 pre-hatch 3
a See Figure 1 for station locations; Pres. = no. eggs preserved; Staged = no. of eggs for which developmental stage could be determined.b Based on Beer 1981, Wang et al. 1985, and Conte et al. 1988.c Mean water temperature from estimated spawn timing to time eggs were captured, rounded to nearest degree.
Developmental stages and associated estimations of spawn timing of white sturgeon eggs captured during the 2009 middle Columbia River white sturgeon spawn monitoring study.
Mean Water Temp. (°C)c
Spawning Event
No. Estimated Date and Time
Egg Capture Dataa
Station Date TimeNo. Eggs Developmental Stageb Hours to
Reach Stage
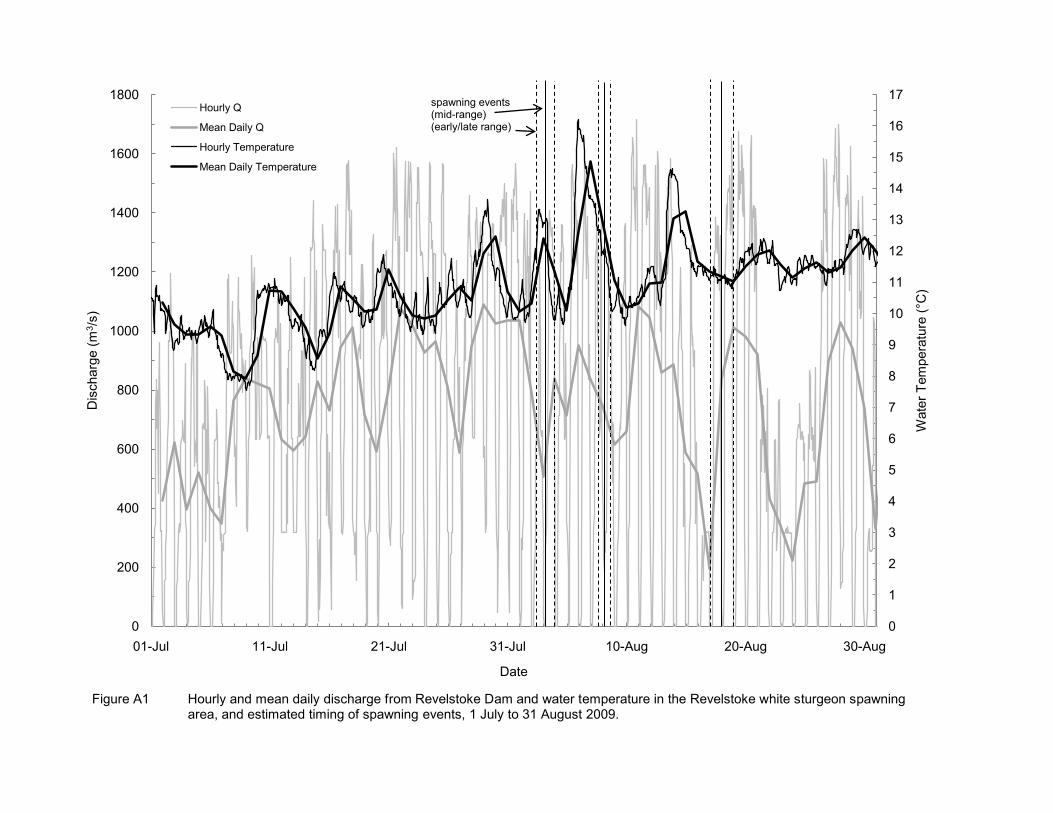
0
1
2
3
4
5
6
7
8
9
10
11
12
13
14
15
16
17
0
200
400
600
800
1000
1200
1400
1600
1800
01-Jul 11-Jul 21-Jul 31-Jul 10-Aug 20-Aug 30-Aug
Wat
er T
empe
ratu
re (°
C)
Dis
char
ge (m
3 /s)
Date
Hourly Q
Mean Daily Q
Hourly Temperature
Mean Daily Temperature
spawning events(mid-range)(early/late range)
Figure A1 Hourly and mean daily discharge from Revelstoke Dam and water temperature in the Revelstoke white sturgeon spawningarea, and estimated timing of spawning events, 1 July to 31 August 2009.

MIDDLE COLUMBIA RIVER WHITE STURGEON SPAWN MONITORING: 2009 INVESTIGATIONS DATA REPORT
April 2010 Report No. 09-1480-0044F
APPENDIX B Photographic Plates
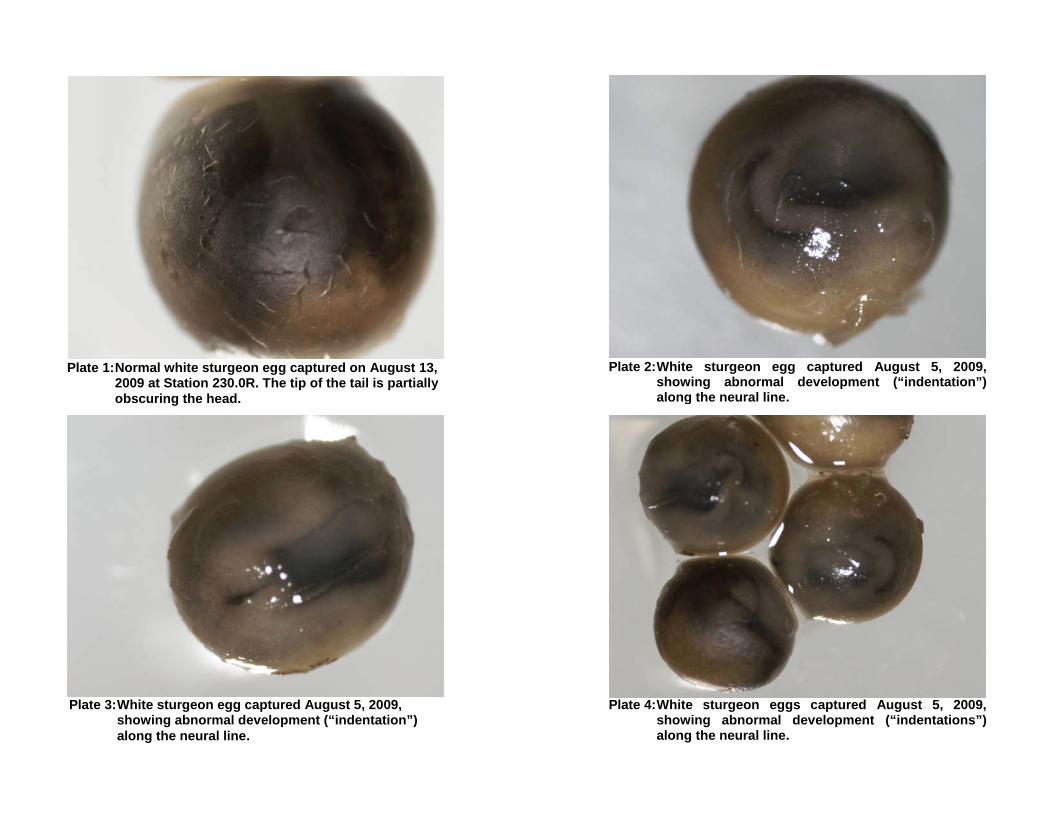
Plate 1: Normal white sturgeon egg captured on August 13, 2009 at Station 230.0R. The tip of the tail is partially obscuring the head.
Plate 2: White sturgeon egg captured August 5, 2009, showing abnormal development (“indentation”) along the neural line.
Plate 3: White sturgeon egg captured August 5, 2009, showing abnormal development (“indentation”) along the neural line.
Plate 4: White sturgeon eggs captured August 5, 2009, showing abnormal development (“indentations”) along the neural line.
Golder Associates Ltd. 201 Columbia Avenue Castlegar, British Columbia, V1N 1A8 Canada T: +1 (250) 365 0344
Caption Text