Embed Size (px)
Citation preview
Journal of Research in Reading, ISSN 0141-0423Volume 24, Issue 1, 2001, pp 41±64
Coloured overlays and their benefitfor readingArnold J. Wilkins
Visual Perception Unit, University of Essex, Colchester, UK
Elizabeth Lewis
Norfolk County Sensory Support Service, Norwich, UK
Fiona Smith
Visual Perception Unit, University of Essex, Colchester, UK
Elizabeth Rowland
Norfolk County Sensory Support Service, Norwich, UK
Wendy Tweedie
MRC Applied Psychology Unit, Cambridge
ABSTRACT
Children in mainstream schools compared text on white paper with identical textcovered in turn by each of ten differently-coloured plastic overlays. More than 50%reported improved perception with one or more colours, and were given the bestcolour to use. About half used the overlays for more than three months and theirreading speed increased when the overlays were used. In Study I children wereexamined twice using different methods and examiners. 47% chose the same colouron both occasions, and showed the greatest improvement in reading fluency, reliableat retest. In Study II children were issued with a random colour, and the greatestimprovements in reading speed occurred when the random colour was the same asthat previously chosen. Phonological reading strategies were not related to visualsymptoms, or the benefit from overlays. Across individuals, reading speed varied bya factor of more than three, for good and poor readers. Study III provided estimatesof the prevalence of improvements based on a sample of 426 children from 12schools: 5% of children read more than 25% faster with a coloured overlay.
# United Kingdom Reading Association 2001. Published by Blackwell Publishers, 108 Cowley Road,Oxford OX4 1JF, UK and 350 Main Street, Malden, MA 02148, USA
INTRODUCTION
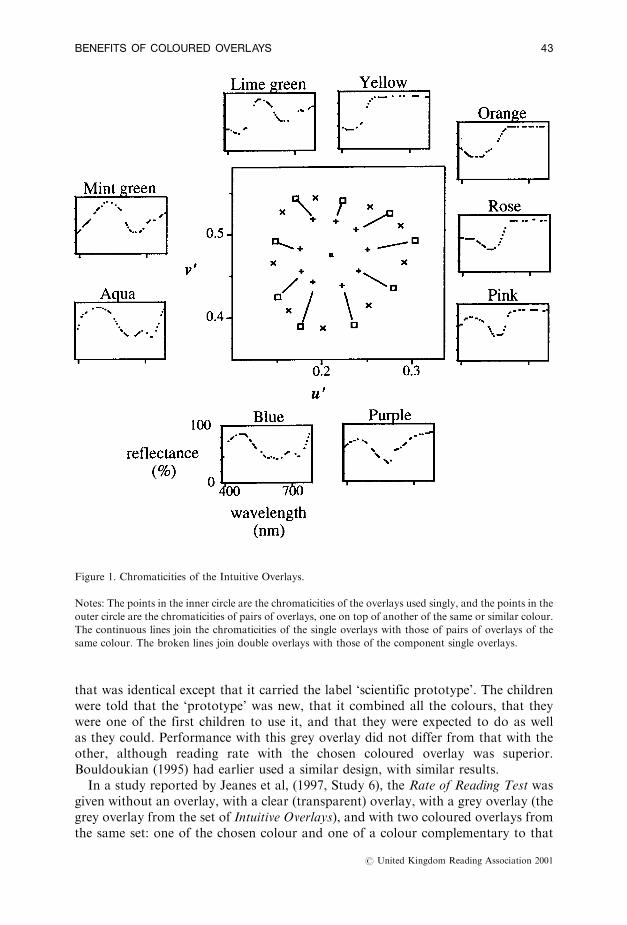
When reading, children sometimes report fewer symptoms of visual fatigue if the textis coloured by covering the page with a sheet of coloured plastic (an overlay). Tyrrellet al (1995) examined 46 children aged 8±16 in a mainstream school, showing themtext coloured by each overlay in a set of seven. Children who reported benefit froman overlay were relatively poor at reading. After ten minutes continuous reading theyshowed a deterioration in reading fluency not shown by other children, accompaniedby symptoms of visual fatigue. The deterioration and fatigue did not appear whenthe overlay was used. A set of coloured overlays that samples hues systematically andcomprehensively was subsequently developed by Wilkins (1994). The rationale forthe design of these so-called `Intuitive Overlays' is that if, indeed, there is a particularcolour that can help with reading, the overlays can be combined to find a closeapproximation to this colour: the set of overlays samples chromaticity systematicallyand efficiently, as shown in Figure 1.Jeanes et al (1997) used the Intuitive Overlays in several small-scale studies in
county primary schools. They presented each of the colours in turn and allowedchildren to choose the one that best improved the clarity of text. About 50% of childrenreported beneficial perceptual effects with the chosen overlay. These children were allgiven the selected overlay to use if they wished to do so, and three months later abouthalf the children who were given overlays were still using them; that is, about 20%of the entire sample of normal school children. Again, these children were relativelypoor at reading.Although in the research by Tyrrel et al the effects of overlays on reading fluency
were observable only after ten minutes continuous reading when the child had begunto tire, it has subsequently proved possible to demonstrate the benefits of overlays ina one-minute test, the Rate of Reading Test. The test consists of a passage of textwhich is read aloud as quickly as possible for one minute. The score is the number ofwords correctly read. The passage consists of ten lines each comprising the same 15common words in a different random order. The words are familiar to poor readers,who are therefore prepared to undertake the challenge of reading. The random orderensures that no word can be guessed from the context; each word must be seen to beread. The absence of any meaning has the advantage that children are often unawareof their errors of omission and transposition of words. The text is printed in a smalltypeface, closely spaced, in order to increase the visual difficulty.The Rate of Reading Test would appear to provide a sensitive measure of the visual
skills involved in reading. The average rate of reading with an overlay compared tothat without is greater in the children who will subsequently use an overlayvoluntarily in the long term (Wilkins et al, 1996; Jeanes et al, 1997).
Placebo effects
Children will often seek to please, and are good at picking up cues as to how they areexpected to respond, and these can in turn affect motivation, and potentially at least,reading speed. Nevertheless, the increase in reading speed with a coloured overlay isunlikely to be due simply to motivation or other placebo effects. Wilkins and Lewis(1999) used the Rate of Reading Test and included a placebo control. Reading ratewas compared with no overlay, the chosen overlay, a grey overlay, and a grey overlay
# United Kingdom Reading Association 2001
42 WILKINS ET AL
that was identical except that it carried the label `scientific prototype'. The childrenwere told that the `prototype' was new, that it combined all the colours, that theywere one of the first children to use it, and that they were expected to do as wellas they could. Performance with this grey overlay did not differ from that with theother, although reading rate with the chosen coloured overlay was superior.Bouldoukian (1995) had earlier used a similar design, with similar results.In a study reported by Jeanes et al, (1997, Study 6), the Rate of Reading Test was
given without an overlay, with a clear (transparent) overlay, with a grey overlay (thegrey overlay from the set of Intuitive Overlays), and with two coloured overlays fromthe same set: one of the chosen colour and one of a colour complementary to that
Figure 1. Chromaticities of the Intuitive Overlays.
Notes: The points in the inner circle are the chromaticities of the overlays used singly, and the points in the
outer circle are the chromaticities of pairs of overlays, one on top of another of the same or similar colour.
The continuous lines join the chromaticities of the single overlays with those of pairs of overlays of the
same colour. The broken lines join double overlays with those of the component single overlays.
# United Kingdom Reading Association 2001
BENEFITS OF COLOURED OVERLAYS 43
chosen. The five conditions were presented in random order. With the overlay of thechosen colour the reading rate was superior to the no-overlay, clear-overlay and thegrey-overlay conditions. The reading rate with the overlay of complementary colourdid not differ significantly from the rate in the other conditions.In a further study by Wilkins and Lewis (1999), children undertook the Rate of
Reading Test with no overlay, an overlay that was reported as having least benefit,a grey overlay and the chosen overlay. The four conditions were presented in randomorder. The reading rate increased in the order in which the conditions are listedabove, although the only statistical difference was in the performance with thechosen overlay vis aÁ vis the other conditions.The above studies are consistent in finding (1) that coloured overlays are superior
to clear overlays (a placebo control) and to grey overlays that reduce the contrast andluminance by a similar amount; (2) that quite different colours can be beneficial,although (3) the chosen colour appears to give the greatest benefit; (4) a comple-mentary or aversive overlay colour gives relatively little benefit; (5) the rate ofreading is unaffected by motivational instructions.The present series of studies were designed:
(1) to investigate the reliability of the choice of overlay colour and the reliability ofthe increase in reading speed with which it was associated;
(2) to study the relationship between visual difficulties with reading, and scholasticattainment in reading, including phonological and non-phonological readingstrategies;
(3) to replicate the above findings with a larger sample, so that the prevalence ofperceptual difficulties could be gauged and the number of children likely tobenefit from overlays could be estimated reliably.
STUDY 1: METHOD
Participants
All the 47 boys and 42 girls in years 4±6 of a middle school in Norwich, Norfolk UKtook part, excluding those for whom parental permission was withheld (about 1%).The mean age was 9 years 4 months, range 8 years 6 months ±10 years 6 months.
Test materials
The overlays used have been described by Wilkins (1994).1 When placed over a pageof white paper, the overlays had a reflectance that varied little with the angles ofincident and reflected light (Wilkins, 1994; Figure 3), provided specular reflectionwas avoided. They had chromaticities disposed evenly around the circumference of acircle in the CIE 1976 UCS diagram, centred on white; in other words the saturation(suv) was similar for all colours, averaging 0.52 with a standard deviation of 0.19. Thedifference in hue angle, huv, between neighbouring colours averaged 40 degrees witha standard deviation of 7.7 degrees. The chromaticities are shown in Figure 1. Whenthe overlay was placed upon a halon standard the photopic reflectance with lightincident at 45 degrees and reflected normally averaged 65% (sd=13%). The over-lays provided 9 colours (and a grey, reflectance 47%) when used singly. They were
# United Kingdom Reading Association 2001
44 WILKINS ET AL
also used in pairs, one on top of another. The pairs were either of the same colour orof neighbouring chromaticity and provided a further 19 colours having greatersaturation (suv m=1.1, sd=0.13) with difference in hue angle between neighboursaveraging 20 degrees (sd=4.8 degrees). The overlays therefore sampled colourssystematically and comprehensively (see Figure 1). The overlays had a matte coatingand this reduced the contrast of the text beneath (defined as the difference inluminance of background and letters, divided by the background luminance). Withdirectional lighting normal to the surface and 45 degree oblique viewing, the reduc-tion in contrast was similar for all colours and about 2%. With diffuse illuminationfrom overhead fluorescent luminaires the reduction in contrast was generally lessthan 5%, unless there was clearly evident specular reflection of the light source inwhich case the reduction in contrast could be as much as 80%. Specular reflection ofthe light source was avoided.
Procedure
The testing was undertaken in three sessions: in the first session the children weretested in seven class groups and in the second and third they were tested individually.
Group testing
The examiner led a brief discussion of what was meant by research and why theywere asking questions. The children were then asked to put their glasses on if theyhad any. They were told that there were no right or wrong answers to the questionsthat they would be asked, that no one would mind what they said, and they wereasked to tell the truth when answering and to keep the answers to themselves. Theexaminer then led a discussion as to what the word `blurred' (fuzzy or difficult to see)meant.The pupils were issued with a questionnaire on which they were invited to place
their name and class number, and a page on which was printed a passage of randomly-ordered common words. The passage comprised 20 lines, each with the followingfifteen words in a different random order: come, see, the, play, look, up, is, dog, cat,not, my, for, and, you, to. The words were printed in nominal 12 point Arial sansserif font, single-spaced on a 300 dpi laser printer using Microsoft Word 6.0 on a PC.The examiner then took the class through each of the items in the questionnaire in
turn, asking them to circle `yes' or `no' as appropriate. The first two questionsconcerned the use of glasses: `Do you wear glasses for reading?', `Do you wear glassesfor watching the television or for looking at the blackboard?'. The children were thenasked to read the passage aloud as fast as possible for one minute, the purpose beingto tire the eyes. They were asked to look at the passage and answer the followingquestions by circling the appropriate response: `Do the letters stay still or do theymove?', `Are the letters clear or are they blurred?', `Is the page too bright, not brightenough or just about right?', `Does it hurt your eyes to look at the writing or is it ok?'They were then asked to find the middle line of the passage (the 10th line down) andwere asked: `Are the words too close together or far enough apart?'.Finally they were asked the following general questions: `Is it easy to see the
writing on the board or is it difficult?', `Is it easy to find your place when copyingfrom the board or is it difficult?', `Is it easy to see the writing in the book which you
# United Kingdom Reading Association 2001
BENEFITS OF COLOURED OVERLAYS 45
use for literacy or is it difficult?', `Do you have a headache everyday, most days orless often?'.
Individual testing
After the group tests, the children were tested individually. The interval between thegroup tests and the first of the individual tests ranged from 3 hours to 2 days. Duringthe individual tests the children were examined in pairs, class by class, in registerorder, one child in each pair being tested by Examiner EL and one by Examiner ER,both female. First, the child was asked to read aloud the passage of randomly-ordered common words for one minute. Next, each child was asked the same set ofquestions that had previously been asked of the class, excluding the general questionsat the end. The child was then asked to select the overlay that provided for themaximum clarity and comfort of the text. The two examiners used a different methodof assessment.Examiner EL used the method of selection outlined in the Intuitive Overlays
Instruction Book (IOO Marketing, London) and described in previous studies (Jeaneset al, 1997). In brief, each overlay was placed in turn upon the left or right half ofa passage of randomly ordered letters resembling text (Stimulus Material B) and thechild asked to choose which side was the clearer. Any overlays that improved theclarity were then compared side by side.Examiner ER used a booklet of overlays in which two stacks of A5-size overlays
were available side by side, a passage of text beneath each overlay. Each `page' in astack comprised a coloured overlay with a sheet of white paper beneath on which wasprinted the passage of randomly- ordered common words. Both stacks had the sameten pages, one for each of the ten differently coloured intuitive overlays, in the followingorder: rose, purple, aqua, lime green, orange, grey, yellow, mint green, blue, pink. Atthe outset, a white page appeared on one stack and the pages of the other stack wereturned so that each coloured page could be compared in turn with the white page. Ifany colour was reported as clearer than white, that colour was used for subsequentcomparison, and the pages of the other stack turned until another colour was re-ported as clearer or until all the pages in one or other stack had been turned.The child was then asked to read the passage of text on two further occasions, one
with no overlay and one with the overlay just chosen. The order in which these twotests were undertaken was alternated from one child to the next.At least one and no more than two days later the child was seen again, this time by
the other examiner using the alternative overlays-selection procedure. Other aspectsof the examination remained the same as those of the earlier examination, except thatthe examiner told the child to consider the appearance of the text on this occasionand to ignore the results of their previous assessment.
RESULTS
Reliability
The same number of children, 78 (87%), chose a coloured overlay on both individualtest sessions. The rate of reading without the overlay on Session 1 was strongly
# United Kingdom Reading Association 2001
46 WILKINS ET AL
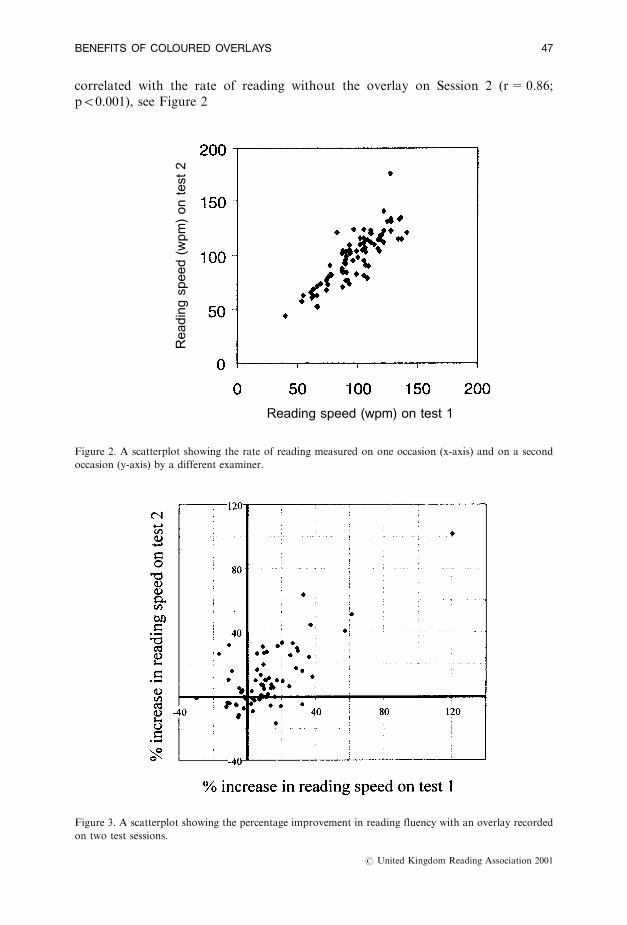
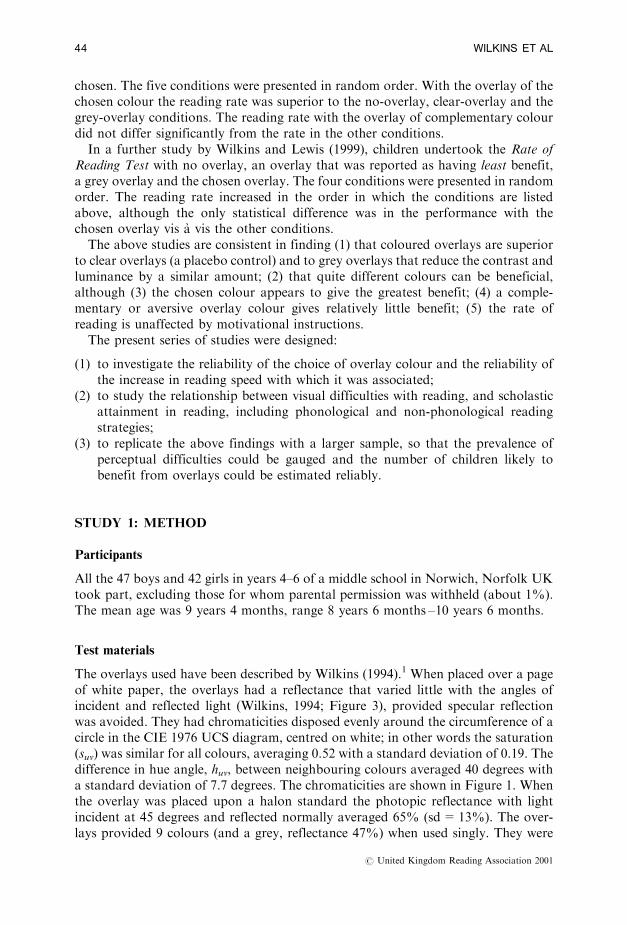
correlated with the rate of reading without the overlay on Session 2 (r=0.86;p50.001), see Figure 2
Re
ad
ing
sp
ee
d(w
pm
)o
nte
st
2
Reading speed (wpm) on test 1
Figure 2. A scatterplot showing the rate of reading measured on one occasion (x-axis) and on a second
occasion (y-axis) by a different examiner.
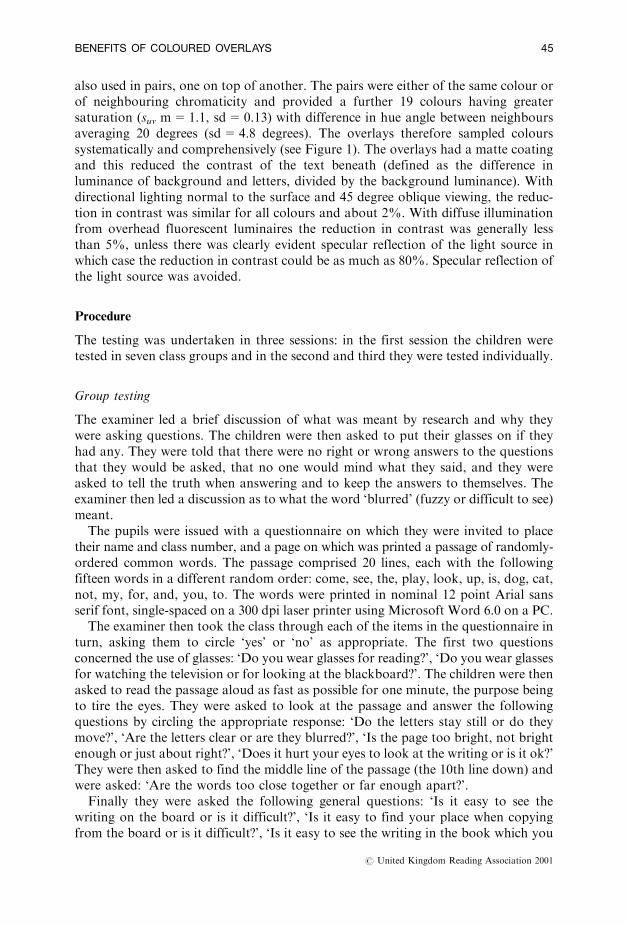
Figure 3. A scatterplot showing the percentage improvement in reading fluency with an overlay recorded
on two test sessions.
# United Kingdom Reading Association 2001
BENEFITS OF COLOURED OVERLAYS 47
The improvement in reading fluency due to the overlay was measured as the ratio ofreading speed with the overlay, divided by that without. Overall there was an 11%improvement in reading fluency with the chosen overlay (t(75)=2.8; p50.0001).The ratio obtained in Session 1 was strongly correlated with that obtained in Session 2,notwithstanding the different overlays chosen (r=0.72; p50.001), see Figure 3. Thecorrelation was also high when the ratio for the method used by Examiner EL (usedon half the trials in Session 1 and half in Session 2) was compared with the ratio forthe method used by Examiner ER (r=0.72; p50.001).
Consistency
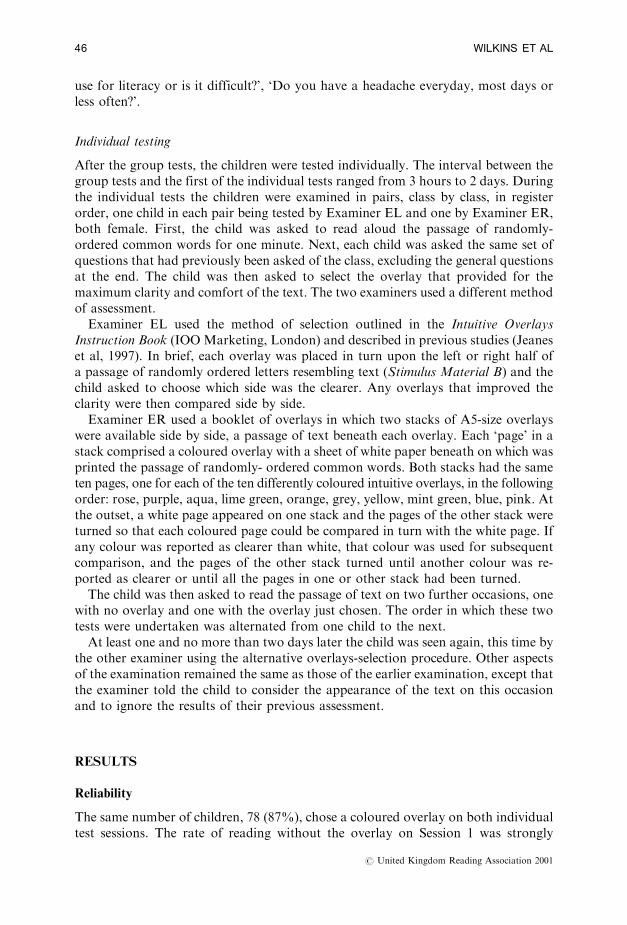
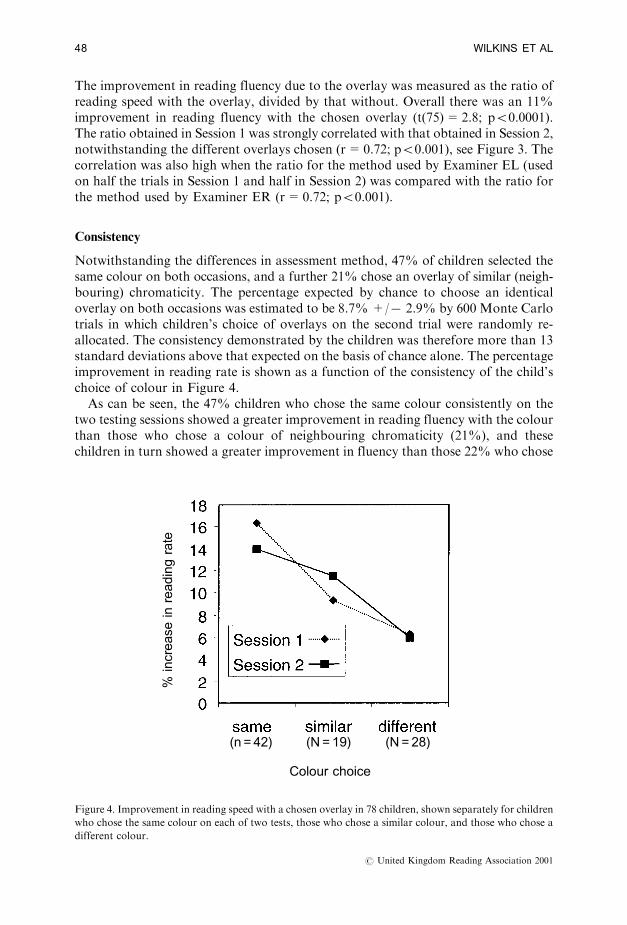
Notwithstanding the differences in assessment method, 47% of children selected thesame colour on both occasions, and a further 21% chose an overlay of similar (neigh-bouring) chromaticity. The percentage expected by chance to choose an identicaloverlay on both occasions was estimated to be 8.7% +/7 2.9% by 600 Monte Carlotrials in which children's choice of overlays on the second trial were randomly re-allocated. The consistency demonstrated by the children was therefore more than 13standard deviations above that expected on the basis of chance alone. The percentageimprovement in reading rate is shown as a function of the consistency of the child'schoice of colour in Figure 4.As can be seen, the 47% children who chose the same colour consistently on the
two testing sessions showed a greater improvement in reading fluency with the colourthan those who chose a colour of neighbouring chromaticity (21%), and thesechildren in turn showed a greater improvement in fluency than those 22% who chose
%in
cre
ase
inre
ad
ing
rate
(n = 42) (N = 19) (N = 28)
Colour choice
Figure 4. Improvement in reading speed with a chosen overlay in 78 children, shown separately for children
who chose the same colour on each of two tests, those who chose a similar colour, and those who chose a
different colour.
# United Kingdom Reading Association 2001
48 WILKINS ET AL
a different colour on each occasion (N=28). The average increase in reading speedfor the children who chose the same or similar colour on Sessions 1 and 2 was greaterthan that for the children who chose a different colour (t(77)=1.74; p50.05, one-tailed).
Symptoms: group testing versus individual testing
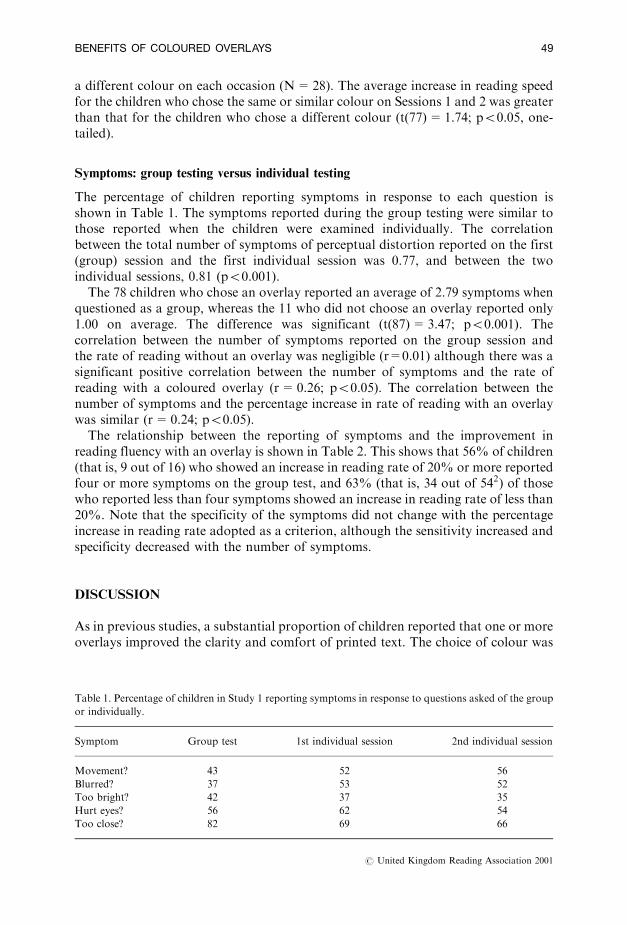
The percentage of children reporting symptoms in response to each question isshown in Table 1. The symptoms reported during the group testing were similar tothose reported when the children were examined individually. The correlationbetween the total number of symptoms of perceptual distortion reported on the first(group) session and the first individual session was 0.77, and between the twoindividual sessions, 0.81 (p50.001).The 78 children who chose an overlay reported an average of 2.79 symptoms when
questioned as a group, whereas the 11 who did not choose an overlay reported only1.00 on average. The difference was significant (t(87)=3.47; p50.001). Thecorrelation between the number of symptoms reported on the group session andthe rate of reading without an overlay was negligible (r=0.01) although there was asignificant positive correlation between the number of symptoms and the rate ofreading with a coloured overlay (r=0.26; p50.05). The correlation between thenumber of symptoms and the percentage increase in rate of reading with an overlaywas similar (r=0.24; p50.05).The relationship between the reporting of symptoms and the improvement in
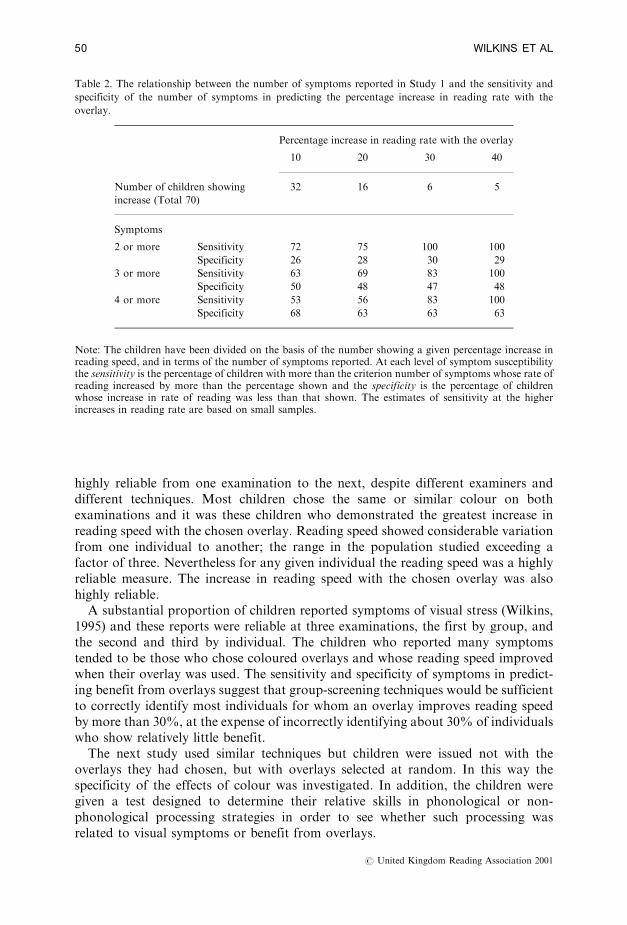
reading fluency with an overlay is shown in Table 2. This shows that 56% of children(that is, 9 out of 16) who showed an increase in reading rate of 20% or more reportedfour or more symptoms on the group test, and 63% (that is, 34 out of 542) of thosewho reported less than four symptoms showed an increase in reading rate of less than20%. Note that the specificity of the symptoms did not change with the percentageincrease in reading rate adopted as a criterion, although the sensitivity increased andspecificity decreased with the number of symptoms.
DISCUSSION
As in previous studies, a substantial proportion of children reported that one or moreoverlays improved the clarity and comfort of printed text. The choice of colour was
Table 1. Percentage of children in Study 1 reporting symptoms in response to questions asked of the group
or individually.
Symptom Group test 1st individual session 2nd individual session
Movement? 43 52 56
Blurred? 37 53 52
Too bright? 42 37 35
Hurt eyes? 56 62 54
Too close? 82 69 66
# United Kingdom Reading Association 2001
BENEFITS OF COLOURED OVERLAYS 49
highly reliable from one examination to the next, despite different examiners anddifferent techniques. Most children chose the same or similar colour on bothexaminations and it was these children who demonstrated the greatest increase inreading speed with the chosen overlay. Reading speed showed considerable variationfrom one individual to another; the range in the population studied exceeding afactor of three. Nevertheless for any given individual the reading speed was a highlyreliable measure. The increase in reading speed with the chosen overlay was alsohighly reliable.A substantial proportion of children reported symptoms of visual stress (Wilkins,
1995) and these reports were reliable at three examinations, the first by group, andthe second and third by individual. The children who reported many symptomstended to be those who chose coloured overlays and whose reading speed improvedwhen their overlay was used. The sensitivity and specificity of symptoms in predict-ing benefit from overlays suggest that group-screening techniques would be sufficientto correctly identify most individuals for whom an overlay improves reading speedby more than 30%, at the expense of incorrectly identifying about 30% of individualswho show relatively little benefit.The next study used similar techniques but children were issued not with the
overlays they had chosen, but with overlays selected at random. In this way thespecificity of the effects of colour was investigated. In addition, the children weregiven a test designed to determine their relative skills in phonological or non-phonological processing strategies in order to see whether such processing wasrelated to visual symptoms or benefit from overlays.
Table 2. The relationship between the number of symptoms reported in Study 1 and the sensitivity and
specificity of the number of symptoms in predicting the percentage increase in reading rate with the
overlay.
Percentage increase in reading rate with the overlay
10 20 30 40
Number of children showing
increase (Total 70)
32 16 6 5
Symptoms
2 or more Sensitivity 72 75 100 100
Specificity 26 28 30 29
3 or more Sensitivity 63 69 83 100
Specificity 50 48 47 48
4 or more Sensitivity 53 56 83 100
Specificity 68 63 63 63
Note: The children have been divided on the basis of the number showing a given percentage increase inreading speed, and in terms of the number of symptoms reported. At each level of symptom susceptibilitythe sensitivity is the percentage of children with more than the criterion number of symptoms whose rate ofreading increased by more than the percentage shown and the specificity is the percentage of childrenwhose increase in rate of reading was less than that shown. The estimates of sensitivity at the higherincreases in reading rate are based on small samples.
# United Kingdom Reading Association 2001
50 WILKINS ET AL
STUDY 2: METHOD
Participants
All the 378 children in a middle school in Norwich, Norfolk UK, took part. Therewere 185 boys and 193 girls aged between 8 years 2 months and 12 years 1 month.
Test materials
Two stacks of overlays similar to those used in Study 1 were arranged side by side,with a white page of text in a central position below the lower margin of the stacks.As in Study 1 the text was printed in sans serif 10 point Arial Font. Both stacks againhad the same ten pages, one for each of the ten differently coloured Intuitive Overlays,but the pages were presented in one of 18 different random orders.A list of 40 phonologically-regular words and a second list of 40 phonologically-
irregular words, such as yacht, and meringue were prepared. The words were writtenindividually in a column, in a sans serif typeface (Arial) with an x-height of 3mm, andan interlinear spacing of 14.5mm. The lists were those used by Funnell and Pitchford(personal communication).
Procedure
All the children were tested individually by one of three examiners. The testing beganby asking the child general questions about symptoms when reading. The childrenwere asked `Do you get headaches when you read?'; `Do you get sore eyes when youread?'; `Do you find you lose your place when you read?'; `Does it make it easier tosee words if you look away from the page and look back?'.Without an overlay the child was then required to read aloud for one minute the
passage of randomly ordered common words from the Rate of Reading Test. Theywere then asked to look at the page and answer the following specific questions: `Dothe letters stay still or do they move?'; `Are the letters clear or are they blurred?'; `Isthe page too bright, not bright enough, or just about right?'. They were then asked tolook at the central line of print, and were asked: `Are the words too close together, orfar enough apart?'.The booklets were placed flat on the table in front of the child, and the top page of
the rightmost booklet was turned over to reveal two differently-coloured pages, sideby side, with the central white page between these and the child. The child was askedto say which of the three pages (two coloured and one white) was the clearest andmost comfortable, and which was the least. This enabled the three pages to be rankedin order of preference.The least preferred of the two coloured pages was turned to reveal the differently-
coloured page beneath. The rank of preference was again obtained for the threepages (one white, and two coloured: one newly revealed, and one shown on theprevious occasion). The process continued until all the pages in one or other stackhad been turned.Finally, the child was again asked to read aloud the passage from the Rate of
Reading Test as quickly and accurately as possible. The passage was read three times:once with a white page, once with a page having the colour of that of the lastpreferred page, and once with a page of a colour chosen at random. The above three
# United Kingdom Reading Association 2001
BENEFITS OF COLOURED OVERLAYS 51
conditions were presented in random order. At the end of the examination eachchild was asked to read aloud without an overlay two lists of words graded indifficulty. The first list was the phonologically-regular words and the second theirregular words. All but 25 of the children expressed some perceptual benefit withone or other overlays, and were issued with an overlay. A grey overlay was given to150 children, and the remaining 100 received a coloured overlay, the colour chosenat random. The children were re-assessed five months later and a note was made ofthose still using their overlay.
RESULTS
83% of children chose a coloured page. There was a clear tendency to choose thelater overlays in the stack, suggesting that many children found little differencebetween the colours.For the children who chose a coloured page the mean rate of reading (words per
minute) was as follows ± no overlay: 112.7; chosen overlay: 116.8; random overlay:115.25. The chosen overlay was associated with a significantly greater rate of readingthan no overlay (t(372)=5.67, p50.00001 one-tailed). There was only a small,though significant, advantage for the chosen overlay compared with the randomoverlay (t(372)=2.06, p50.05 one-tailed). If the children read faster with onecoloured overlay but not with the other, they were more likely to do so with thechosen overlay than with the random one (X2(1)=4.3; p50.05). Twenty-sevenchildren chose a grey overlay at their first test. The mean reading speed with the greyoverlay was 122.2 words per minute, compared with 121.7 words per minute withoutan overlay, a difference that did not approach significance. Although grey was thechosen colour, it did not benefit reading speed.The effects of test order were small, after the initial practice. The mean rate of
reading on Test 1 was 106.9 words per minute. This test was without an overlay. Theremaining three tests were in one of the experimental conditions (no overlay, chosenoverlay, random overlay) in random order. The means for these tests were: Test 2:113.9; Test 3: 116.9; Test 4: 115.8. A single factor repeated measures analysis ofvariance was used to compare the three means. The effect of test order was notsignificant (F(2,1116)=0.781, p=0.458).The children who reported movement of the letters showed a significantly
(t(161)=2.32, one-tailed p50.05) larger increase in reading speed with the chosenoverlay than those who did not report movement. A similar difference in reading speedwas obtained for the children who experienced blurring of the page (t(118)=1.70,one-tailed p50.05), who reported glare from the page (t(121)=2.52, one-tailedp50.05), and who said the page hurt their eyes (t(142)=2.14, one-tailed p50.05).(The above were comparisons planned on the basis of the results of Study 1.) Othercomparisons were non-significant: there was no significant difference in theimprovement in reading speed with the overlay for the children who reportedheadache when reading, who experienced sore eyes when reading, who thought theword spacing was inadequate, and who reported looking away from text to improveclarity.The random overlays were divided into those that were grey, those that were of
a colour similar to that chosen (neighbouring chromaticity), and those of dissimilar
# United Kingdom Reading Association 2001
52 WILKINS ET AL
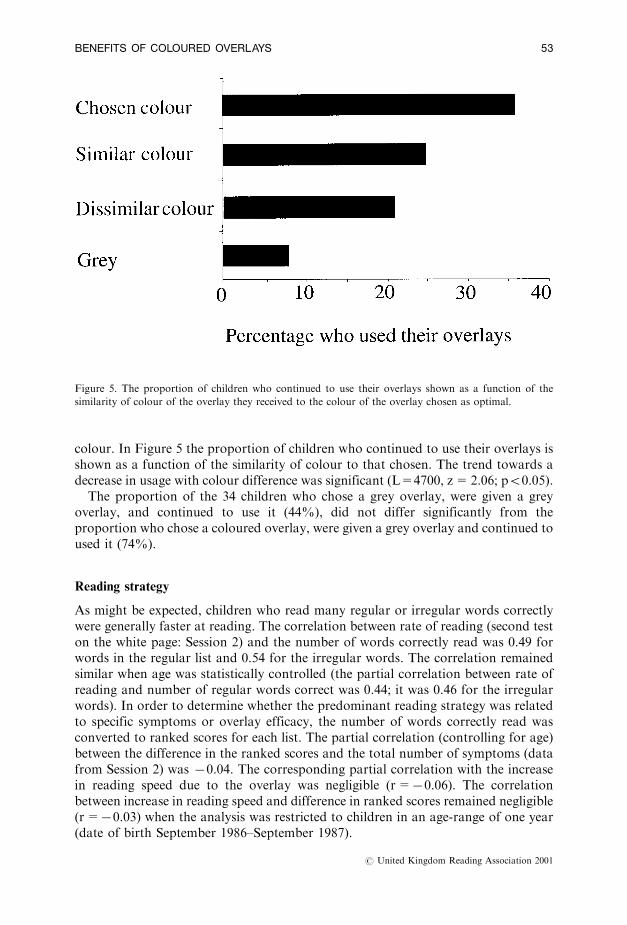
colour. In Figure 5 the proportion of children who continued to use their overlays isshown as a function of the similarity of colour to that chosen. The trend towards adecrease in usage with colour difference was significant (L=4700, z=2.06; p50.05).The proportion of the 34 children who chose a grey overlay, were given a grey
overlay, and continued to use it (44%), did not differ significantly from theproportion who chose a coloured overlay, were given a grey overlay and continued toused it (74%).
Reading strategy
As might be expected, children who read many regular or irregular words correctlywere generally faster at reading. The correlation between rate of reading (second teston the white page: Session 2) and the number of words correctly read was 0.49 forwords in the regular list and 0.54 for the irregular words. The correlation remainedsimilar when age was statistically controlled (the partial correlation between rate ofreading and number of regular words correct was 0.44; it was 0.46 for the irregularwords). In order to determine whether the predominant reading strategy was relatedto specific symptoms or overlay efficacy, the number of words correctly read wasconverted to ranked scores for each list. The partial correlation (controlling for age)between the difference in the ranked scores and the total number of symptoms (datafrom Session 2) was 70.04. The corresponding partial correlation with the increasein reading speed due to the overlay was negligible (r=70.06). The correlationbetween increase in reading speed and difference in ranked scores remained negligible(r=70.03) when the analysis was restricted to children in an age-range of one year(date of birth September 1986±September 1987).
Figure 5. The proportion of children who continued to use their overlays shown as a function of the
similarity of colour of the overlay they received to the colour of the overlay chosen as optimal.
# United Kingdom Reading Association 2001
BENEFITS OF COLOURED OVERLAYS 53
DISCUSSION
The children read most quickly with their chosen overlay, as in previous studies. Theuse of the randomly chosen overlays was associated with an increase in reading speedthat was almost as great as for the colour the children chose for themselves, but wasnevertheless significantly smaller. Those few children who chose a grey overlaydiffered from the remainder in that they did not show an improvement in readingspeed with the chosen overlayThe improvement in reading rate with the overlay was related to symptoms that
the children reported when looking at a page of text, as in Study 1, but not withsymptoms that were reported in response to the initial questions about reading ingeneral. Evidently asking questions about the here and now elicited symptoms morereliably. Once children were familiar with the reading task, (i.e. after the first attemptat reading the Rate of Reading Test), the effects of test order (practice/fatigue) weresmall and non-significant. The children who benefited from an overlay did not differfrom the others with respect to their use of a phonological reading strategy.Studies 1 and 2 have shown that a large number of normal school children read
more quickly when the page they were reading was covered by a coloured overlay,particularly if the overlay was of a colour chosen by the individual. The prevalence ofvisual stress in the school population appears to be high, although the sample size isinsufficient for a reliable estimate. In Study 3 the sample size was greatly increased.
STUDY 3: METHOD
Participants
Following a lecture to schoolteachers in Norwich, United Kingdom, members ofstaff in twenty Norfolk schools volunteered to participate in the study. Twelveschools completed the study. The schools included those in urban and rural areas. Allthe children in each school in Year 3 (aged 6 years 10 months ± 8 years 6 months,mean 7 years 6 months) took part in the study, except those whose parents refusedpermission (51%). The numbers of children tested in each school averaged 35.5,with a standard deviation of 20.6 between schools.
Testing Materials
The Intuitive Overlays were supplied to classroom teachers in a Teacher's AssessmentPack (IOO Marketing, London). The pack included two of each of ten colours, A5size, together with textual stimulus material and instructions for use.The Rate of Reading Test (IOO Marketing, London) was administered. In this
case, the published version of the test was used, as described by Wilkins et al, (1996).3
The typeface was 9pt Times set solid with 4pt inter-word spacing.The Young's Group Reading Test Third Edition (Hodder and Stoughton, 1989)
was also administered, but as part of the routine assessment of children by NorfolkEducation Department that all children underwent. The test requires children tocomprehend short sentences and identify a missing word from among fouralternatives.
# United Kingdom Reading Association 2001
54 WILKINS ET AL
Procedure
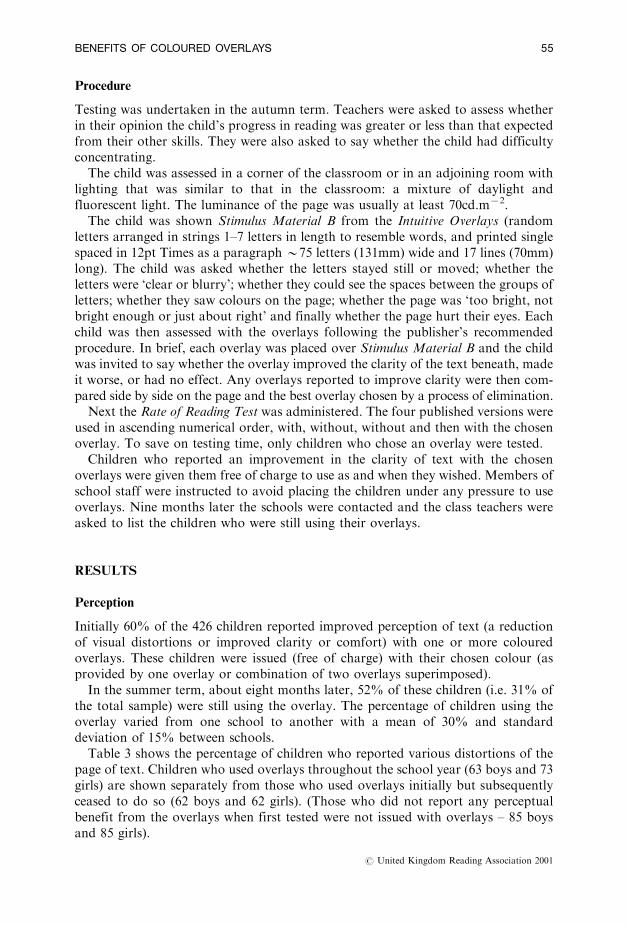
Testing was undertaken in the autumn term. Teachers were asked to assess whetherin their opinion the child's progress in reading was greater or less than that expectedfrom their other skills. They were also asked to say whether the child had difficultyconcentrating.The child was assessed in a corner of the classroom or in an adjoining room with
lighting that was similar to that in the classroom: a mixture of daylight andfluorescent light. The luminance of the page was usually at least 70cd.m72.The child was shown Stimulus Material B from the Intuitive Overlays (random
letters arranged in strings 1±7 letters in length to resemble words, and printed singlespaced in 12pt Times as a paragraph *75 letters (131mm) wide and 17 lines (70mm)long). The child was asked whether the letters stayed still or moved; whether theletters were `clear or blurry'; whether they could see the spaces between the groups ofletters; whether they saw colours on the page; whether the page was `too bright, notbright enough or just about right' and finally whether the page hurt their eyes. Eachchild was then assessed with the overlays following the publisher's recommendedprocedure. In brief, each overlay was placed over Stimulus Material B and the childwas invited to say whether the overlay improved the clarity of the text beneath, madeit worse, or had no effect. Any overlays reported to improve clarity were then com-pared side by side on the page and the best overlay chosen by a process of elimination.Next the Rate of Reading Test was administered. The four published versions were
used in ascending numerical order, with, without, without and then with the chosenoverlay. To save on testing time, only children who chose an overlay were tested.Children who reported an improvement in the clarity of text with the chosen
overlays were given them free of charge to use as and when they wished. Members ofschool staff were instructed to avoid placing the children under any pressure to useoverlays. Nine months later the schools were contacted and the class teachers wereasked to list the children who were still using their overlays.
RESULTS
Perception
Initially 60% of the 426 children reported improved perception of text (a reductionof visual distortions or improved clarity or comfort) with one or more colouredoverlays. These children were issued (free of charge) with their chosen colour (asprovided by one overlay or combination of two overlays superimposed).In the summer term, about eight months later, 52% of these children (i.e. 31% of
the total sample) were still using the overlay. The percentage of children using theoverlay varied from one school to another with a mean of 30% and standarddeviation of 15% between schools.Table 3 shows the percentage of children who reported various distortions of the
page of text. Children who used overlays throughout the school year (63 boys and 73girls) are shown separately from those who used overlays initially but subsequentlyceased to do so (62 boys and 62 girls). (Those who did not report any perceptualbenefit from the overlays when first tested were not issued with overlays ± 85 boysand 85 girls).
# United Kingdom Reading Association 2001
BENEFITS OF COLOURED OVERLAYS 55
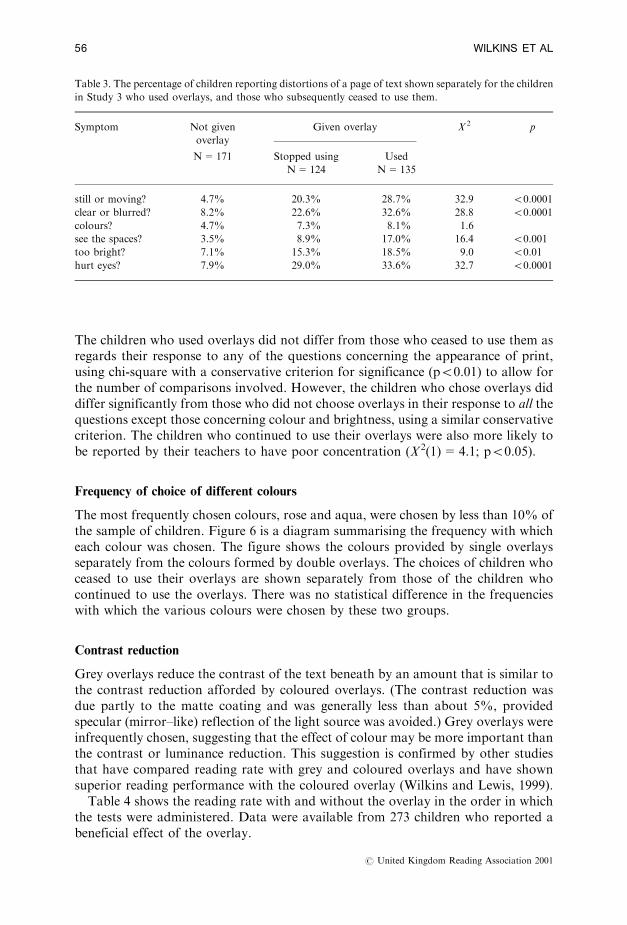
The children who used overlays did not differ from those who ceased to use them asregards their response to any of the questions concerning the appearance of print,using chi-square with a conservative criterion for significance (p50.01) to allow forthe number of comparisons involved. However, the children who chose overlays diddiffer significantly from those who did not choose overlays in their response to all thequestions except those concerning colour and brightness, using a similar conservativecriterion. The children who continued to use their overlays were also more likely tobe reported by their teachers to have poor concentration (X2(1)=4.1; p50.05).
Frequency of choice of different colours
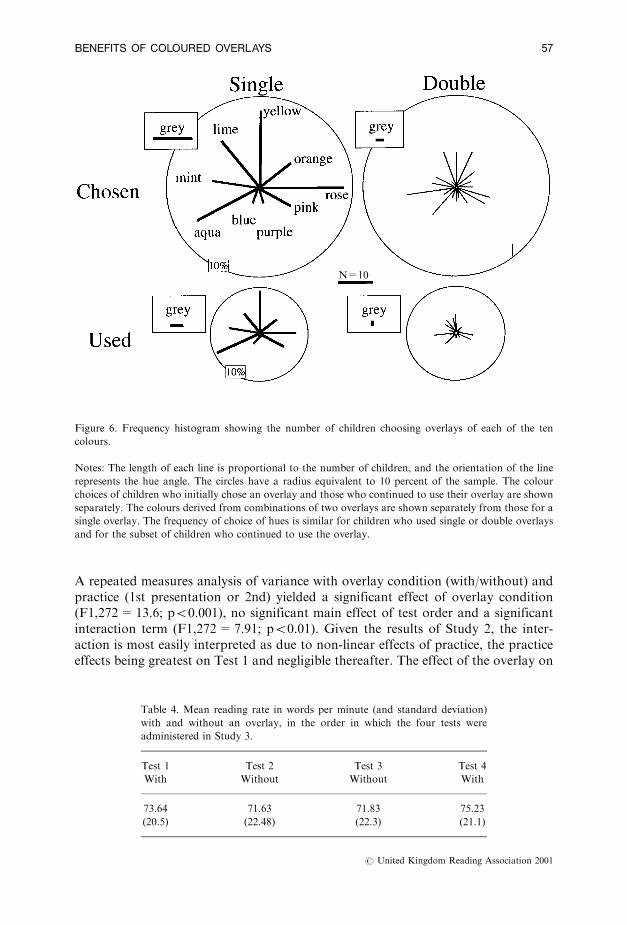
The most frequently chosen colours, rose and aqua, were chosen by less than 10% ofthe sample of children. Figure 6 is a diagram summarising the frequency with whicheach colour was chosen. The figure shows the colours provided by single overlaysseparately from the colours formed by double overlays. The choices of children whoceased to use their overlays are shown separately from those of the children whocontinued to use the overlays. There was no statistical difference in the frequencieswith which the various colours were chosen by these two groups.
Contrast reduction
Grey overlays reduce the contrast of the text beneath by an amount that is similar tothe contrast reduction afforded by coloured overlays. (The contrast reduction wasdue partly to the matte coating and was generally less than about 5%, providedspecular (mirror±like) reflection of the light source was avoided.) Grey overlays wereinfrequently chosen, suggesting that the effect of colour may be more important thanthe contrast or luminance reduction. This suggestion is confirmed by other studiesthat have compared reading rate with grey and coloured overlays and have shownsuperior reading performance with the coloured overlay (Wilkins and Lewis, 1999).Table 4 shows the reading rate with and without the overlay in the order in which
the tests were administered. Data were available from 273 children who reported abeneficial effect of the overlay.
Table 3. The percentage of children reporting distortions of a page of text shown separately for the children
in Study 3 who used overlays, and those who subsequently ceased to use them.
Symptom Not given
overlay
Given overlay X 2 p
N=171 Stopped using
N=124
Used
N=135
still or moving? 4.7% 20.3% 28.7% 32.9 50.0001
clear or blurred? 8.2% 22.6% 32.6% 28.8 50.0001
colours? 4.7% 7.3% 8.1% 1.6
see the spaces? 3.5% 8.9% 17.0% 16.4 50.001
too bright? 7.1% 15.3% 18.5% 9.0 50.01
hurt eyes? 7.9% 29.0% 33.6% 32.7 50.0001
# United Kingdom Reading Association 2001
56 WILKINS ET AL
A repeated measures analysis of variance with overlay condition (with/without) andpractice (1st presentation or 2nd) yielded a significant effect of overlay condition(F1,272=13.6; p50.001), no significant main effect of test order and a significantinteraction term (F1,272=7.91; p50.01). Given the results of Study 2, the inter-action is most easily interpreted as due to non-linear effects of practice, the practiceeffects being greatest on Test 1 and negligible thereafter. The effect of the overlay on
N=10
Figure 6. Frequency histogram showing the number of children choosing overlays of each of the ten
colours.
Notes: The length of each line is proportional to the number of children, and the orientation of the line
represents the hue angle. The circles have a radius equivalent to 10 percent of the sample. The colour
choices of children who initially chose an overlay and those who continued to use their overlay are shown
separately. The colours derived from combinations of two overlays are shown separately from those for a
single overlay. The frequency of choice of hues is similar for children who used single or double overlays
and for the subset of children who continued to use the overlay.
Table 4. Mean reading rate in words per minute (and standard deviation)
with and without an overlay, in the order in which the four tests were
administered in Study 3.
Test 1 Test 2 Test 3 Test 4
With Without Without With
73.64 71.63 71.83 75.23
(20.5) (22.48) (22.3) (21.1)
# United Kingdom Reading Association 2001
BENEFITS OF COLOURED OVERLAYS 57
reading speed, as judged by the difference between the average reading rate with theoverlay (Trials 1 and 4) and without (Trials 2 and 3) is therefore conservativelyassessed.The children who were still using their overlays in the summer term were more
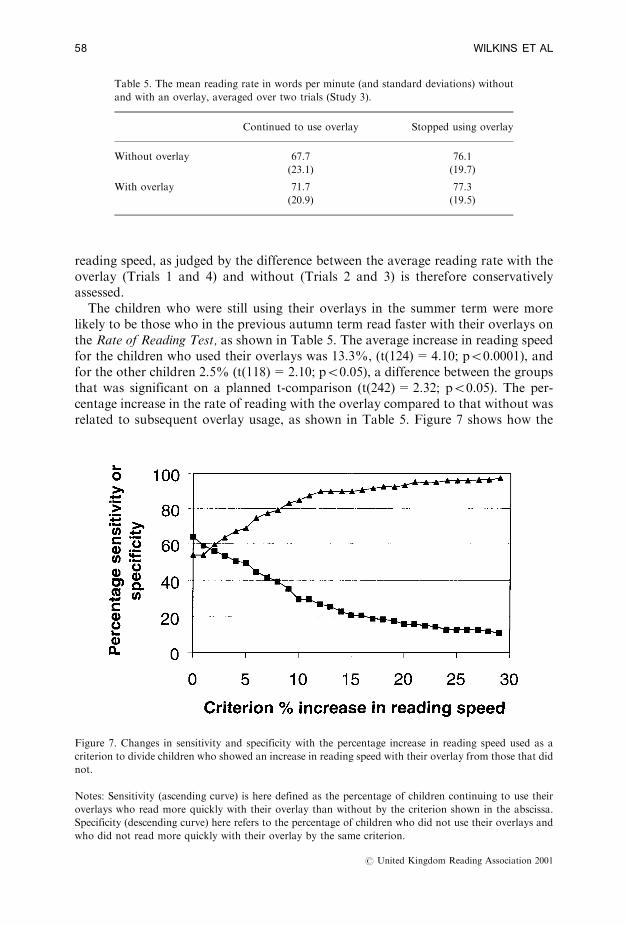
likely to be those who in the previous autumn term read faster with their overlays onthe Rate of Reading Test, as shown in Table 5. The average increase in reading speedfor the children who used their overlays was 13.3%, (t(124)=4.10; p50.0001), andfor the other children 2.5% (t(118)=2.10; p50.05), a difference between the groupsthat was significant on a planned t-comparison (t(242)=2.32; p50.05). The per-centage increase in the rate of reading with the overlay compared to that without wasrelated to subsequent overlay usage, as shown in Table 5. Figure 7 shows how the
Table 5. The mean reading rate in words per minute (and standard deviations) without
and with an overlay, averaged over two trials (Study 3).
Continued to use overlay Stopped using overlay
Without overlay 67.7 76.1
(23.1) (19.7)
With overlay 71.7 77.3
(20.9) (19.5)
Figure 7. Changes in sensitivity and specificity with the percentage increase in reading speed used as a
criterion to divide children who showed an increase in reading speed with their overlay from those that did
not.
Notes: Sensitivity (ascending curve) is here defined as the percentage of children continuing to use their
overlays who read more quickly with their overlay than without by the criterion shown in the abscissa.
Specificity (descending curve) here refers to the percentage of children who did not use their overlays and
who did not read more quickly with their overlay by the same criterion.
# United Kingdom Reading Association 2001
58 WILKINS ET AL
sensitivity and specificity of the prediction changed with the percentage increase inreading rate chosen as the criterion.
Placebo effects?
Thirty-three children chose a grey overlay. As in Study 2, these children did not showa significant increase in reading rate with the overlay, suggesting that motivationis not a sufficient explanation for the improvement in reading speed with colouredoverlays, as also indicated by the studies reviewed in the introduction.
Reading ability and use of overlays
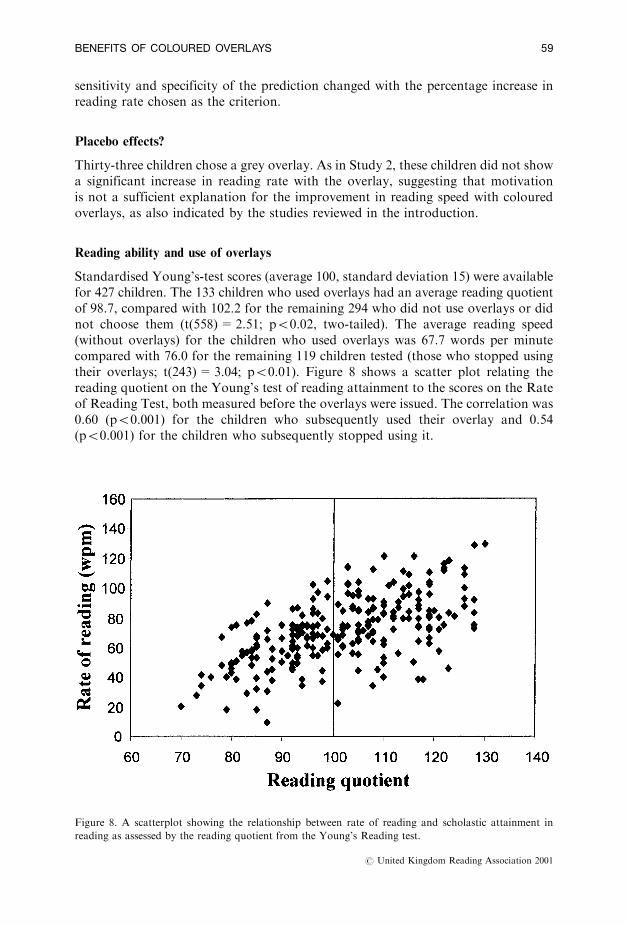
Standardised Young's-test scores (average 100, standard deviation 15) were availablefor 427 children. The 133 children who used overlays had an average reading quotientof 98.7, compared with 102.2 for the remaining 294 who did not use overlays or didnot choose them (t(558)=2.51; p50.02, two-tailed). The average reading speed(without overlays) for the children who used overlays was 67.7 words per minutecompared with 76.0 for the remaining 119 children tested (those who stopped usingtheir overlays; t(243)=3.04; p50.01). Figure 8 shows a scatter plot relating thereading quotient on the Young's test of reading attainment to the scores on the Rateof Reading Test, both measured before the overlays were issued. The correlation was0.60 (p50.001) for the children who subsequently used their overlay and 0.54(p50.001) for the children who subsequently stopped using it.
Figure 8. A scatterplot showing the relationship between rate of reading and scholastic attainment in
reading as assessed by the reading quotient from the Young's Reading test.
# United Kingdom Reading Association 2001
BENEFITS OF COLOURED OVERLAYS 59
DISCUSSION
Study 3 showed that about 50% of mainstream school children (boys and girls insimilar proportion) report that one or more coloured overlays improve the clarity oftext. About half of these children used the overlay and half stopped using it over theensuing eight months; there were no gender differences in this respect. The childrenwho continued to use their overlay differed from the others in showing an improve-ment in reading speed with the overlay when first tested. In the above respects thefindings replicate those of Jeanes et al (1997) and Wilkins et al (1996) with a largersample.
Reading attainment and reading fluency
The range of reading speeds shown in Figure 8 is remarkable. Note that there aregood readers (reading quotient4120) who are reading only 40 words per minute andothers with similar reading attainment who are reading more than three times as fast.This range is not due to variability in the rate at which a person can read from onetime to the next because the Rate of Reading Test has a very high test-retest reli-ability. With immediate retest the correlation between first and second tests is high(see Study 1) and remains high even when tests are separated by three months (Jeaneset al, 1997). Clearly the Rate of Reading Test scores reflect large and stable individualdifferences. Some of these differences may be attributable to visual skills given that(1) reading rate can show improvements with coloured overlays within participantsand (2) it is difficult to attribute the individual differences to linguistic skill becausethe differences exist when reading attainment is controlled. The immediate increasein reading rate when overlays are used is consistent with such a viewpoint. Further,the improvements in reading speed have predictive utility with respect to the usage ofoverlays.
GENERAL DISCUSSION
The above studies show consistency with regard to the proportion of children inmainstream education who report beneficial perceptual effects with colouredoverlays, who persist in using overlays and who demonstrate improvements inreading fluency both before and after using them. The choice of colour is individual,yet reliable at re-test in so far as more than half the children choose the same orsimilar colour. No one colour clearly predominates. The chosen overlay gives greaterimprovements in reading fluency than others of similar colour. If the choice ofoverlay colour is consistent at re-test, greater benefits in fluency are demonstrable. Asimple questionnaire about symptoms experienced when viewing text can beadministered to a class of children and will correctly identify about 80% of thosewho will demonstrate an improvement in reading fluency of 30% or more with anoverlay, but at the cost of a false positive rate of more than 40%.The present findings and those reviewed above are consistent in pointing to a
visual or visuo-perceptual benefit from colour. Indeed, Scheiman et al (1991) haveargued that Meares±Irlen Syndrome (the benefit from colour and symptoms ofperceptual distortion) is a reflection of binocular dysfunction. Evans et al (1996a,
# United Kingdom Reading Association 2001
60 WILKINS ET AL
1996b) have investigated binocular vision of individuals who benefit from usingcoloured lenses. In general the findings are within normal limits in most individuals.There is a tendency for slightly poorer (but not necessary abnormal) performance oncertain clinical tests of vision (near point of accommodation and prism vergences).Direct measurements of accommodation using a modified optometer have failed toshow any steady-state accommodative deficits (Simmers, Grey and Wilkins, 1999). Itis an open question as to how far the relatively poor performance is due to perceptualeffort rather than optometric difficulties, given that both tasks (near point ofaccommodation and prism vergences) require the report of maintained clear vision oftargets that are difficult to focus on (near point of accommodation) or to fusebinocularly (prism vergences). Benefits are common in children whose binocularvision is quite normal.There remains the possibility that colour may be affecting accommodation. Evans
et al (1996a, 1996b) studied children who benefited from coloured glasses and notedthat the beneficial colour was not such as to reduce any residual refractive error.Simmers, Grey and Wilkins, (1999) measured the accommodative dynamics andfound them normal; i.e. the power of the lens was altered appropriately in order tofocus the image on the retina. However, in the steady-state response they found anabnormally high power of accommodative fluctuations at low frequencies: the powerof the lenses was fluctuating more than it usually does. These fluctuations werereduced by the prescribed coloured lenses, but also by spectrally neutral lensesabsorbing an equivalent amount of light (i.e. of similar photopic absorbance). Thesefindings are preliminary, but important in that they reliably demonstrate for the firsttime a physiological abnormality in these children. The abnormality may be acorrelate of visual stress, rather than a component of a causal mechanism for thebenefits of coloured glasses. Lightstone, Lightstone and Wilkins, (1999) noted thatthe optimal colour for use in lenses was not the same as that optimal in overlays,which suggests that any accommodative mechanism is unlikely to be a sufficientexplanation.As yet, no retinal deficit has been demonstrated in individuals with Meares±Irlen
Syndrome. Deficits of colour vision on clinical tests are no more prevalent than wouldbe expected on the basis of age and gender (Evans et al, 1996a). There are no obviousoptometric or orthoptic deficits on clinical testing (manuscript in preparation).Livingstone et al (1991) and Lovegrove, Martin and Slaghuis (1986) have demon-
strated that, in individuals with dyslexia, transient visual function can be impaired.Transient visual function refers to those aspects of vision that provide informationabout rapid changes in the visual scene, and it is thought to be subserved by themagnocellular division of the visual pathways. In the parvocellular division the cellshave different characteristics and are thought to support the detection of stabledetail. The impairment has been widely proposed as providing a basis for the benefitsfrom colour, partly on the basis of the suppression of transient cell activity in thepresence of red light, first noted by Wiesel and Hubel in 1968 and subsequentlyconfirmed (see Wilkins, 1995). For example, Lehmkuhle (1993) asserts that `a blueoverlay would be most effective in reducing the relative contribution of the (parvo-cellular) pathway' and that `the balance of the magno- and parvocellular pathways isthereby restored'. Notwithstanding this assertion, there is no way of explaining thelarge individual differences in optimal therapeutic colours (demonstrated in thesestudies and under double-masked conditions by Wilkins et al in 1994.)
# United Kingdom Reading Association 2001
BENEFITS OF COLOURED OVERLAYS 61
Wilkins (1995) has proposed an alternative explanation which draws togetheraspects of visual stress in epilepsy, migraine and discomfort when reading. Thechildren who benefit from coloured filters are twice as likely to have migraine in thefamily as those who show no benefit (Maclachlan, Yale and Wilkins 1993). Indi-viduals with migraine are thought to have a hyperexcitable visual cortex (Aurora andWelch, 1998) and this may explain their susceptibility to photophobia, given that thevisual stimuli that provoke photophobia are very similar to those that trigger seizuresin patients with photosensitive epilepsy (Wilkins, 1995). Patterns of stripes thatprovoke photosensitive seizures interfere with normal vision (Chronicle and Wilkins,1996), provoking perceptual distortions (Wilkins et al, 1984) to which individualswith migraine are particularly susceptible (Marcus and Soso, 1989), the more so withcertain colours (Chronicle and Wilkins, 1991). Depending upon its layout, text canresemble a pattern of stripes with epileptogenic characteristics, and when it does itcan provoke distortions similar to those provoked by such stripes (Wilkins andNimmo-Smith, 1987; Wilkins, 1995).Changing the colour of a visual stimulus must inevitably alter the distribution of
normal neuronal activity within the visual cortex. Zeki (1983a, 1983b) has measuredthe spectral sensitivity functions of neurons in visual areas V3 and V5, areas thatcode for space and movement. The functions show large differences betweenneurons, particularly in the short-wavelength end of the visible spectrum. Similardifferences are likely to exist for neurons in other visual areas. Perhaps comfortablecolours reduce strong excitation in hyperexcitable regions, reducing an inappropriatespread of excitation and with it the illusory percepts. Such an explanation wouldpredict that coloured filters will have benefit not only in reading but also in reducingheadaches and seizures, and there are initial indications that this is indeed the case(Wilkins et al, 1994; Wilkins et al, 1999). Whatever basis for the benefits in symptomrelief and improvements in reading fluency, the present studies join those ofRobinson (e.g. Robinson and Foreman, 1999) in providing additional support forthe anecdotal but insightful reports of Meares (1980) and Irlen (1991).
ACKNOWLEDGEMENTS
The authors thank David G. Pointon and staff and pupils at the following primaryand middle schools, Avenue, Bacton, Brooke, Caister, Cavell, Coltishall, EastHarling, Heckingham, John of Gaunt, Lakenham, Little Plumstead, Millview, Mul-barton, Northfield, Thorpe Hamlet, Toftwood, Watton. The work was supportedby the Medical Research Council and the Department for Education and Employ-ment.
NOTES
1. Available as the Intuitive Overlays from IOO Marketing Ltd., 56±62 Newington Causeway, London
SE1 6DS, UK.
2. 70±16
3. Available as the Wilkins Rate of Reading Test from IOOMarketing Ltd, 56±62 Newington Causeway,
London SE1 6DS, UK.
# United Kingdom Reading Association 2001
62 WILKINS ET AL
REFERENCES
AURORA, S. K. and WELCH, K. M. (1998) Brain excitability in migraine: evidence from transcranial magnetic
stimulation studies. Current Opinion in Neurology, 11, 205±209.
BOULDOUKIAN, J. (1995) Evaluation de l'effet de filtre coloureÂs sur la performance aÁ la lecture d'enfants
supecteÂs d'avoir le syndrome d'Irlen. Thesis supervised by BJW Evans and presented to Universite de
Paris-Sud, 134 Route de Chartres 91440 Bures-sur-Yvette, France.
CHRONICLE, E. P. and WILKINS, A. J. (1991) Colour and visual discomfort in migraineurs. Lancet, 338, 890.
CHRONICLE, E. P. and WILKINS, A. J. (1996) Gratings that induce distortions mask superimposed targets.
Perception, 25, 661±668.
EVANS, B. J. W., WILKINS, A. J., BROWN, J., BUSBY, A., WINGFIELD, A., JEANES R. and BALD, J. (1996a) A preliminary
investigation into the aetiology of Meares-Irlen syndrome. Ophthalmic and Physiological Optics, 16, 286±296.
EVANS, B. J. W., WILKINS, A. J., BUSBY, A. and JEANES, R., (1996b) Optometric characteristics of children with
reading difficulties who report a benefit from coloured filters. In: C. M. Dickinson, I. J. Murray, and
D. Garden (eds.), John Dalton's Colour Vision Legacy. London; Taylor and Francis, 709±715.
IRLEN, H. (1991) Reading by the colors: Overcoming dyslexia and other reading disabilities through the Irlen
method. New York: Avery Publishing Group.
JEANES, R., BUSBY, A., MARTIN, J., LEWIS, E., STEVENSON, N., POINTON, D. and WILKINS, A. J. (1997) Prolonged use
of coloured overlays for classroom reading. British Journal of Psychology, 88, 531±548.
LEHMKUHLE, S. (1993) Neurological basis of visual processes in reading. In D. Willows, R. Kruk and
E. Corcos (eds.), Visual Processes in Reading and Reading Disabilities, New Jersey: Erlbaum Associates.
LIGHTSTONE, A., LIGHTSTONE, T. and WILKINS, A. J. (1999) Both coloured overlays and coloured lenses can
improve reading fluency, but their optimal chromaticities differ. Ophthalmic and Physiological Optics,
91, 279±285.
LIVINGSTONE, M. S., ROSEN, G. D., DRISLANE, F. W. and GALABURDA, A. M. (1991) Physiological and anatomical
evidence for a magnocellular defect in developmental dyslexia. Proceedings of the National Academy of
Sciences, 88, 7943±7947.
LOVEGROVE, W., MARTIN, F. and SLAGHUIS, W. (1986) A theoretical and experimental case for a residual
deficit in specific reading disability. Cognitive Neuropsychology, 3, 225±267.
MACLACHLAN, A., YALE, S. and WILKINS, A. J. (1993) Open trials of precision ophthalmic tinting: 1-year
follow-up of 55 patients. Ophthalmic and Physiological Optics, 13, 175±178.
MARCUS, D. A. and SOSO, M. J. (1989) Migraine and stripe-induced visual discomfort. Archives of Neurology,
46, 1129±1132.
MEARES, O. (1980) Figure/ground brightness contrast, and reading disabilities. Visible Language 14, 13±29.
ROBINSON, G. L. and FOREMAN, P. J. (1999) Scotopic Sensitivity/Irlen Syndrome and the use of coloured
filters: A long term placebo controlled and masked study of reading achievement and perception of
ability. Perceptual and Motor Skills, 89, 83±113.
SCHEIMAN, M., BLASKEY, P., CINER, E. B., GALLAWAY, M., PARISI, M., POLLACK, K. and SELZNICK, R. (1991) Vision
characteristics of individuals identified as Irlen filter candidates. Journal of the American Optometric
Association, 61, 600±605.
SIMMERS, A. J., GREY, L. S. and WILKINS, A. J. (1999) The influence of Precision Tinted lenses upon ocular
accommodation. Investigative Ophthalmology and Vision Science ( SUPPL.) 40, 361.
TYRRELL, R., HOLLAND, K., DENNIS, D. and WILKINS, A. J. (1995) Coloured overlays, visual discomfort, visual
search and classroom reading. Journal of Research in Reading, 18, 10±23.
WILKINS, A. J. (1994) Overlays for classroom and optometric use. Ophthalmic and Physiological Optics, 14,
97±99.
WILKINS, A. J. (1995) Visual Stress. Oxford: Oxford University Press.
WILKINS, A. J., BAKER, A., AMIN, D. SMITH, S., BRADFORD, J. BONIFACE, S., ZAIWALLA, Z., BESAG, F. M. C., BINNIE,
C. D. and FISH, D. (1999) Treatment of photosensitive epilepsy using coloured filters. Seizure, 8, 444±449.
WILKINS, A. J., EVANS, B. J. W., BROWN, J. A., BUSBY, A. E., WINGFIELD, A. E., JEANES, R. J. and BALD, J. (1994)
Double-masked placebo-controlled trial of precision spectral filters in children who use coloured over-
lays. Ophthalmic and Physiological Optics, 14, 365±370.
WILKINS, A. J. , JEANES, R. J., PUMFREY, P. D. and LASKIER, M. (1996) Rate of Reading Test: its reliability, and
its validity in the assessment of the effects of coloured overlays. Ophthalmic and Physiological Optics, 16,
491±497.
WILKINS, A. J. and LEWIS, E. (1999) Coloured overlays, text and texture. Perception, 28, 641±650.
WILKINS, A. J. and NIMMO-SMITH,M. I. (1987) The clarity and comfort of printed text. Ergonomics, 30, 1705±1720.
# United Kingdom Reading Association 2001
BENEFITS OF COLOURED OVERLAYS 63
WILKINS, A. J., NIMMO-SMITH, M. I., TAIT, A., MCMANUS, C., DELLA SALA, S., TILLEY, A., ARNOLD, K., BARRIE, M. and
SCOTT, S. (1984) A neurological basis for visual discomfort. Brain, 107, 989±1017.
ZEKI, S. (1983a) Colour coding in the cerebral cortex: the responses of wavelength-selective and colour-
coded cells in monkey visual cortex to changes in wavelength composition, Neuroscience, 9, 767±781.
ZEKI, S. (1983b) Colour coding in the cerebral cortex: the reaction of cells in monkey visual cortex to
wavelengths and colours. Neuroscience, 9, 741±765.
Address for correspondence: PROFESSOR ARNOLD WILKINS, Visual Perception Unit,Department of Psychology, University of Essex, Colchester CO4 3SQ, UK.E-mail: [email protected]
# United Kingdom Reading Association 2001
64 WILKINS ET AL