Embed Size (px)
Citation preview
Colombia
Humanitarian
Situation
Synopsis
I Sem 2014
Explosive Devices
Natural Disasters
Internal Displacement
Homicides and Disappearence
HSRI
Internal
Displacement2013OCHA | UN | ColombiaSource: Unidad Para la Atención y Reparación Integral a Víctimas (UARIV) and CODHES
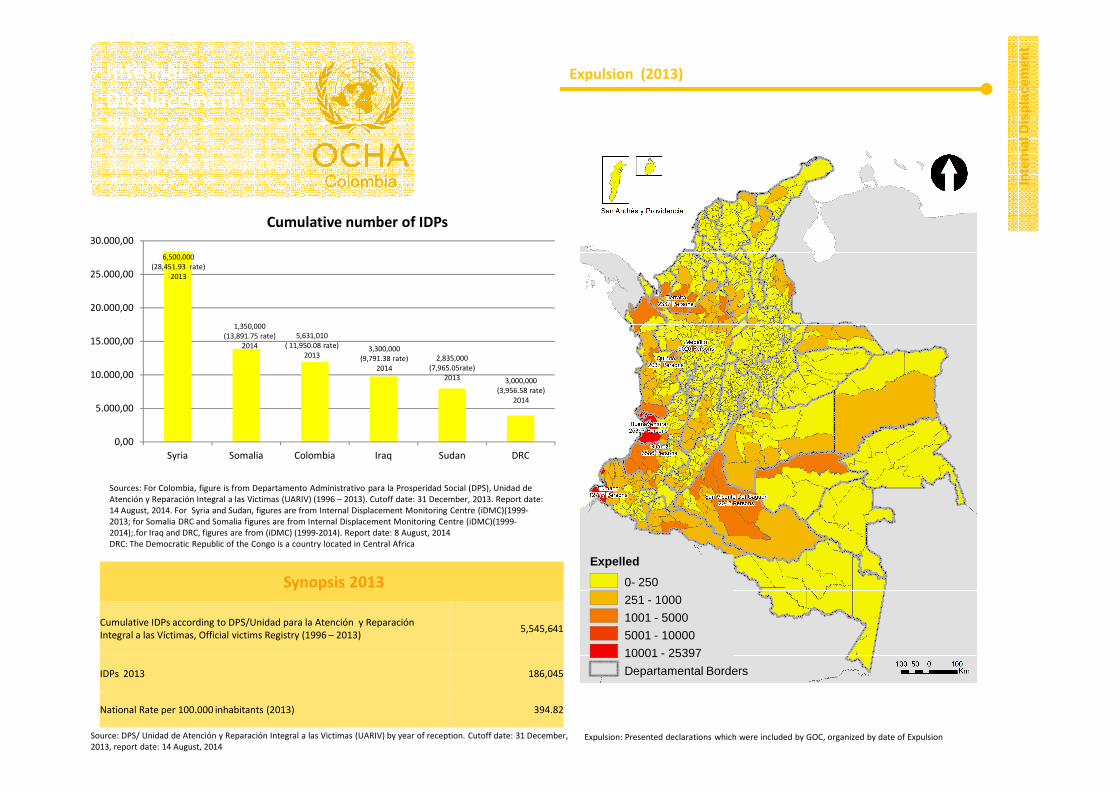
Cumulative number of IDPs
Expulsion (2013)
Inte
rnal
Dis
plac
emen
t
6,500,000(28,451.93 rate)
2013
1,350,000
(13,891.75 rate)
2014
2,835,000
(7,965.05rate)
2013
3,300,000
(9,791.38 rate)
2014
3,000,000
(3,956.58 rate)2014
5,631,010( 11,950.08 rate)
2013
10.000,00
15.000,00
20.000,00
25.000,00
30.000,00
Source: DPS/ Unidad de Atención y Reparación Integral a las Victimas (UARIV) by year of reception. Cutoff date: 31 December, 2013, report date: 14 August, 2014
Sources: For Colombia, figure is from Departamento Administrativo para la Prosperidad Social (DPS), Unidad de Atención y Reparación Integral a las Victimas (UARIV) (1996 – 2013). Cutoff date: 31 December, 2013. Report date: 14 August, 2014. For Syria and Sudan, figures are from Internal Displacement Monitoring Centre (iDMC)(1999-2013; for Somalia DRC and Somalia figures are from Internal Displacement Monitoring Centre (iDMC)(1999-2014);.for Iraq and DRC, figures are from (iDMC) (1999-2014). Report date: 8 August, 2014DRC: The Democratic Republic of the Congo is a country located in Central Africa
Expulsion: Presented declarations which were included by GOC, organized by date of Expulsion
Synopsis 2013
Cumulative IDPs according to DPS/Unidad para la Atención y Reparación Integral a las Víctimas, Official victims Registry (1996 – 2013)
5,545,641
IDPs 2013 186,045
National Rate per 100.000 inhabitants (2013) 394.82
Expelled
0- 250
251 - 1000
1001 - 5000
5001 - 10000
10001 - 25397
Departamental Borders
2014
0,00
5.000,00
Syria Somalia Colombia Iraq Sudan DRC
Internal
Displacement2013OCHA | UN | ColombiaSource: Unidad Para la Atención y Reparación Integral a Víctimas (UARIV)
Expulsion (2013)
Inte
rnal
Dis
plac
emen
t
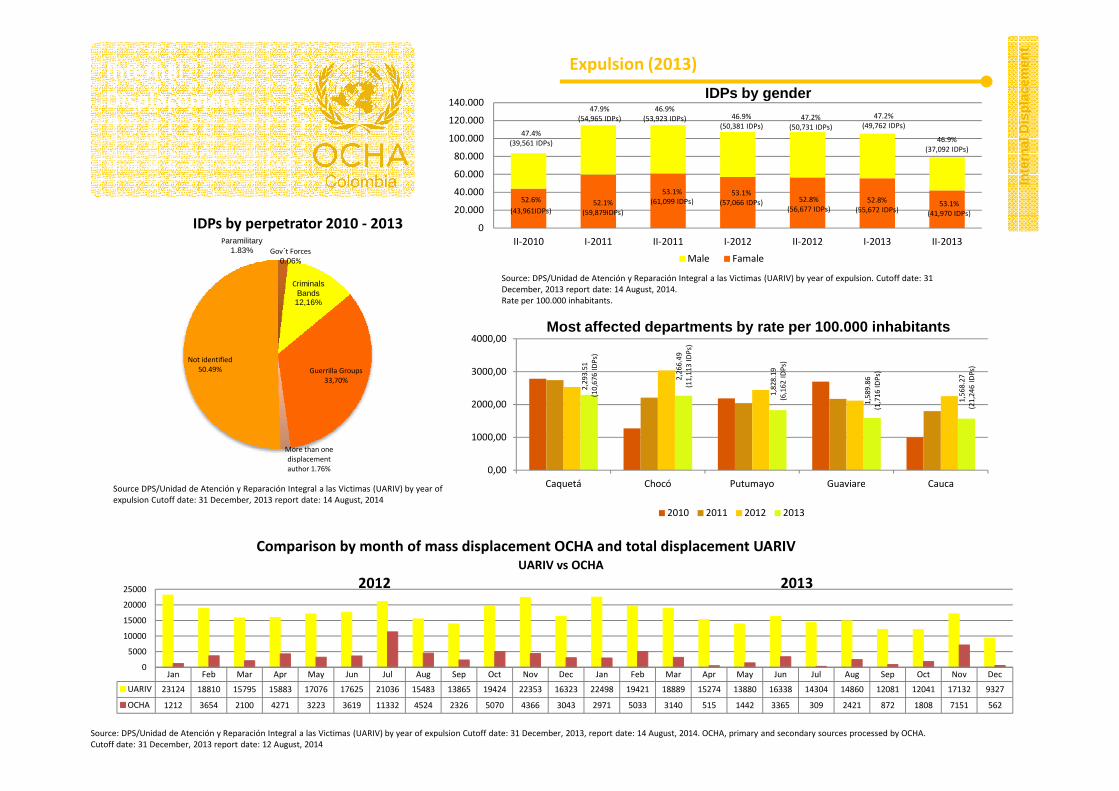
IDPs by perpetrator 2010 - 2013
IDPs by gender
Source: DPS/Unidad de Atención y Reparación Integral a las Victimas (UARIV) by year of expulsion. Cutoff date: 31 December, 2013 report date: 14 August, 2014.Rate per 100.000 inhabitants.
Paramilitary1.83%
Criminals Bands
12,16%
Gov´t Forces
0.06%
Guerrilla Groups
33,70%
Not identified
50.49%
46.9%
(37,092 IDPs)
47.4%(39,561 IDPs)
47.9%
(54,965 IDPs)
53.1%
(61,099 IDPs)53.1%
(57,066 IDPs) 52.8%
(56,677 IDPs)52.8%
(55,672 IDPs)53.1%
(41,970 IDPs)
52.6%
(43,961IDPs)52.1%
(59,879IDPs)
46.9%
(53,923 IDPs) 46.9%
(50,381 IDPs)47.2%
(50,731 IDPs)
47.2%
(49,762 IDPs)
0
20.000
40.000
60.000
80.000
100.000
120.000
140.000
II-2010 I-2011 II-2011 I-2012 II-2012 I-2013 II-2013
Male Famale
Most affected departments by rate per 100.000 inhab itants
2,2
93
.51
(10
,67
6 I
DP
s)
2,2
66
.49
(11
,11
3 I
DP
s)
1,8
28
.19
(6,1
62
ID
Ps)
1,5
89
.86
(1
,71
6 I
DP
s)
1,5
68
.27
(21
,24
6 I
DP
s)3000,00
4000,00
Source DPS/Unidad de Atención y Reparación Integral a las Victimas (UARIV) by year of expulsion Cutoff date: 31 December, 2013 report date: 14 August, 2014
Source: DPS/Unidad de Atención y Reparación Integral a las Victimas (UARIV) by year of expulsion Cutoff date: 31 December, 2013, report date: 14 August, 2014. OCHA, primary and secondary sources processed by OCHA. Cutoff date: 31 December, 2013 report date: 12 August, 2014
Comparison by month of mass displacement OCHA and total displacement UARIV
More than one
displacement
author 1.76%
Jan Feb Mar Apr May Jun Jul Aug Sep Oct Nov Dec Jan Feb Mar Apr May Jun Jul Aug Sep Oct Nov Dec
UARIV 23124 18810 15795 15883 17076 17625 21036 15483 13865 19424 22353 16323 22498 19421 18889 15274 13880 16338 14304 14860 12081 12041 17132 9327
OCHA 1212 3654 2100 4271 3223 3619 11332 4524 2326 5070 4366 3043 2971 5033 3140 515 1442 3365 309 2421 872 1808 7151 562
0
5000
10000
15000
20000
25000
UARIV vs OCHA
2012 2013(1
0,6
76
ID
Ps)
1,8
28
.19
(6,1
62
ID
Ps)
1,5
89
.86
(1
,71
6 I
DP
s)
1,5
68
.27
(21
,24
6 I
DP
s)
0,00
1000,00
2000,00
Caquetá Chocó Putumayo Guaviare Cauca
2010 2011 2012 2013
Internal
Displacement2013OCHA | UN | ColombiaSource: Unidad Para la Atención y Reparación Integral a Víctimas (UARIV)
Expulsion (2013)
Inte
rnal
Dis
plac
emen
t
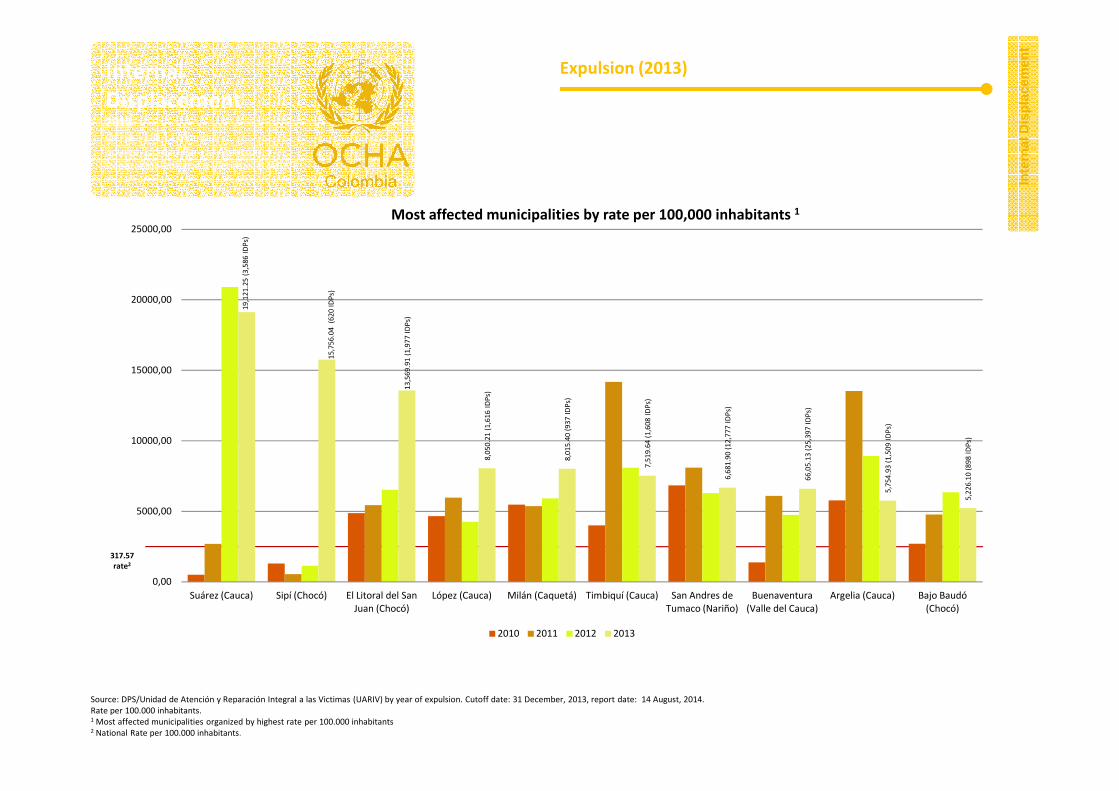
Most affected municipalities by rate per 100,000 inhabitants 1
19
,12
1.2
5 (
3,5
86
ID
Ps)
15
,75
6.0
4 (
62
0 I
DP
s)
13
,56
9.9
1 (
1,9
77
ID
Ps)
8,0
50
.21
(1
,61
6 I
DP
s)
15000,00
20000,00
25000,00
Source: DPS/Unidad de Atención y Reparación Integral a las Victimas (UARIV) by year of expulsion. Cutoff date: 31 December, 2013, report date: 14 August, 2014.Rate per 100.000 inhabitants.1 Most affected municipalities organized by highest rate per 100.000 inhabitants2 National Rate per 100.000 inhabitants.
317.57
rate2
8,0
50
.21
(1
,61
6 I
DP
s)
8,0
15
.40
(9
37
ID
Ps)
7,5
19
.64
(1
,60
8 I
DP
s)
6,6
81
.90
(1
2,7
77
ID
Ps)
66
,05
.13
(2
5,3
97
ID
Ps)
5,7
54
.93
(1
,50
9 I
DP
s)
5,2
26
.10
(8
98
ID
Ps)
0,00
5000,00
10000,00
Suárez (Cauca) Sipí (Chocó) El Litoral del San
Juan (Chocó)
López (Cauca) Milán (Caquetá) Timbiquí (Cauca) San Andres de
Tumaco (Nariño)
Buenaventura
(Valle del Cauca)
Argelia (Cauca) Bajo Baudó
(Chocó)
2010 2011 2012 2013
Internal
Displacement 2013
OCHA | UN | Colombia
Source: : Unidad Para la Atención y Reparación Integral a Víctimas (UARIV)
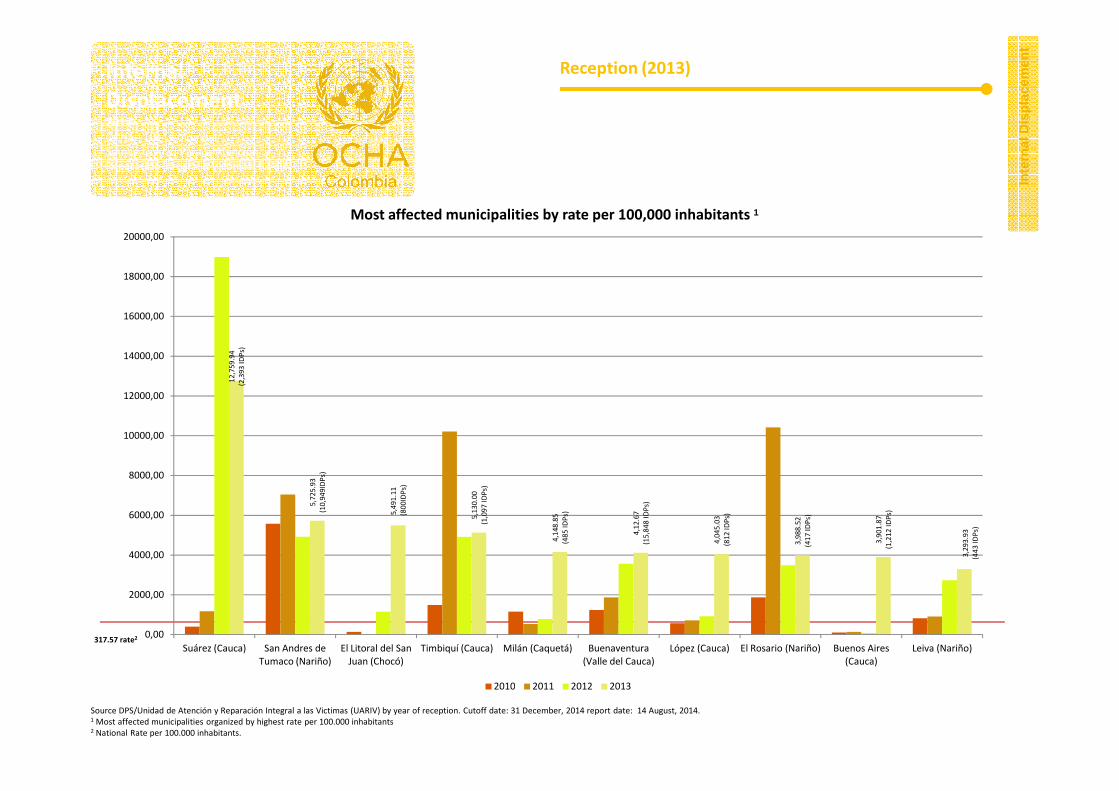
Reception (2013)
Inte
rnal
Dis
plac
emen
t
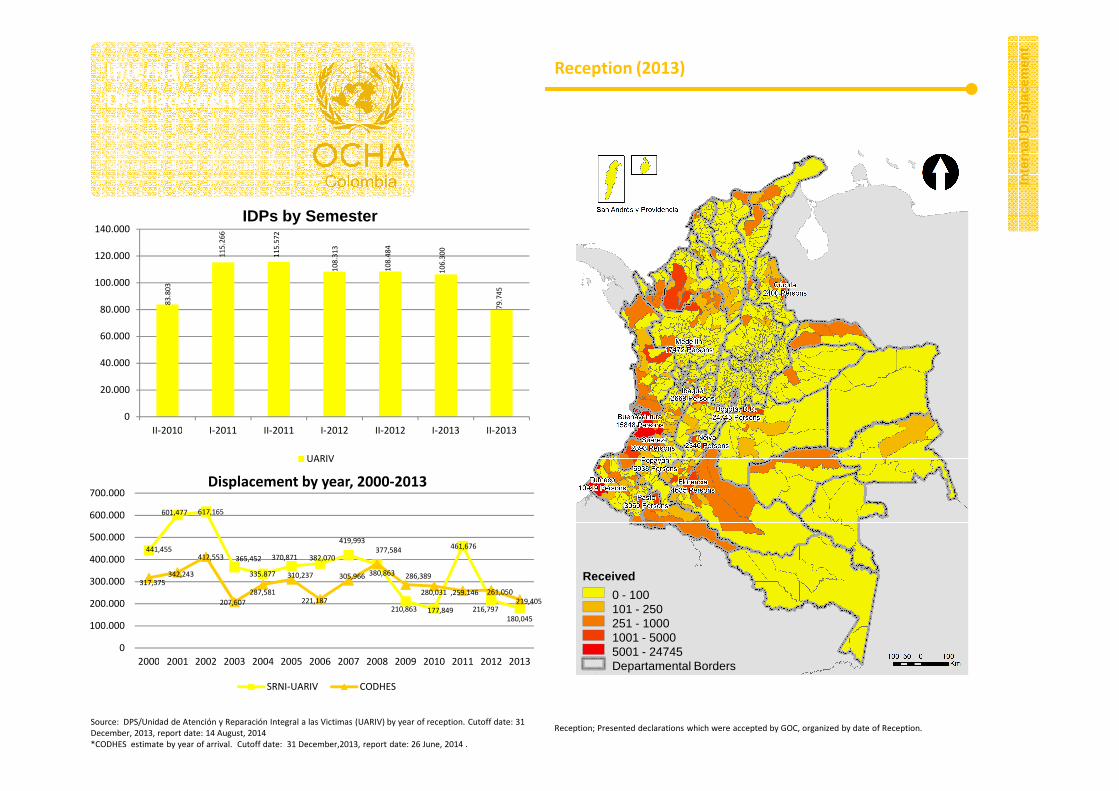
IDPs by Semester
83
.80
3
11
5.2
66
11
5.5
72
10
8.3
13
10
8.4
84
10
6.3
00
79
.74
5
20.000
40.000
60.000
80.000
100.000
120.000
140.000
Displacement by year, 2000-2013
Reception; Presented declarations which were accepted by GOC, organized by date of Reception.Source: DPS/Unidad de Atención y Reparación Integral a las Victimas (UARIV) by year of reception. Cutoff date: 31 December, 2013, report date: 14 August, 2014*CODHES estimate by year of arrival. Cutoff date: 31 December,2013, report date: 26 June, 2014 .
0
20.000
II-2010 I-2011 II-2011 I-2012 II-2012 I-2013 II-2013
UARIV
441,455
601,477 617,165
365,452
335.877
370,871 382,070
419,993377,584
210,863 177,849
461,676
216,797180,045
317,375342,243
412,553
207,607
287,581
310,237
221,187
305,966 380,863 286,389
280,031 ,259.146 261,050219,405
0
100.000
200.000
300.000
400.000
500.000
600.000
700.000
2000 2001 2002 2003 2004 2005 2006 2007 2008 2009 2010 2011 2012 2013
SRNI-UARIV CODHES
Received
0 - 100101 - 250251 - 10001001 - 50005001 - 24745Departamental Borders
Internal
Displacement2013OCHA | UN | ColombiaSource:Unidad Para la Atención y Reparación Integral a Víctimas (UARIV)
Reception (2013)
Inte
rnal
Dis
plac
emen
t
Most affected municipalities by rate per 100,000 inhabitants 1
12
,75
9.9
4
(2,3
93
ID
Ps)
12000,00
14000,00
16000,00
18000,00
20000,00
Source DPS/Unidad de Atención y Reparación Integral a las Victimas (UARIV) by year of reception. Cutoff date: 31 December, 2014 report date: 14 August, 2014.1 Most affected municipalities organized by highest rate per 100.000 inhabitants2 National Rate per 100.000 inhabitants.
317.57 rate2
5,7
25
.93
(10
,94
9ID
Ps)
5,4
91
.11
(80
0ID
Ps)
5,1
30
.00
(1,0
97
ID
Ps)
4,1
48
.85
(48
5 ID
Ps)
4,1
2.6
7
(15
,84
8 I
DP
s)
4,0
45
.03
(81
2 ID
Ps)
3,9
88
.52
(41
7 ID
Ps)
3,9
01
.87
(1,2
12
ID
Ps)
3,2
93
.93
(44
3 ID
Ps)
0,00
2000,00
4000,00
6000,00
8000,00
10000,00
12000,00
Suárez (Cauca) San Andres de
Tumaco (Nariño)
El Litoral del San
Juan (Chocó)
Timbiquí (Cauca) Milán (Caquetá) Buenaventura
(Valle del Cauca)
López (Cauca) El Rosario (Nariño) Buenos Aires
(Cauca)
Leiva (Nariño)
2010 2011 2012 2013
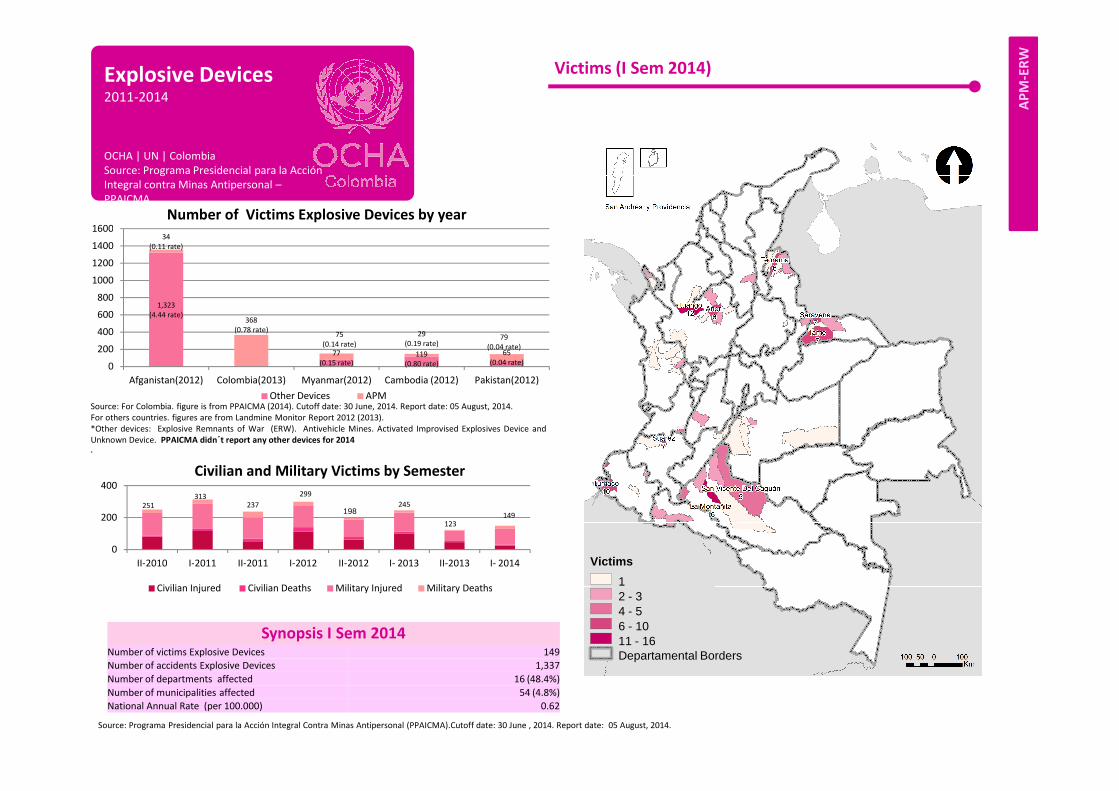
Explosive Devices2011-2014
OCHA | UN | ColombiaSource: Programa Presidencial para la Acción Integral contra Minas Antipersonal –PPAICMA
Number of Victims Explosive Devices by year
Victims (I Sem 2014)
AP
M-E
RW
1,323(4.44 rate)
77
(0.15 rate)119
(0.80 rate)
65
(0.04 rate)
34
(0.11 rate)
368
(0.78 rate)75
(0.14 rate)
29(0.19 rate)
79(0.04 rate)
0
200
400
600
800
1000
1200
1400
1600
Afganistan(2012) Colombia(2013) Myanmar(2012) Cambodia (2012) Pakistan(2012)
Other Devices APMSource: For Colombia. figure is from PPAICMA (2014). Cutoff date: 30 June, 2014. Report date: 05 August, 2014.For others countries. figures are from Landmine Monitor Report 2012 (2013).*Other devices: Explosive Remnants of War (ERW). Antivehicle Mines. Activated Improvised Explosives Device andUnknown Device. PPAICMA didn´t report any other devices for 2014.
Source: Programa Presidencial para la Acción Integral Contra Minas Antipersonal (PPAICMA).Cutoff date: 30 June , 2014. Report date: 05 August, 2014.
Civilian and Military Victims by Semester
245251313
123
237
299
149
0
200
400
II-2010 I-2011 II-2011 I-2012 II-2012 I- 2013 II-2013 I- 2014
Civilian Injured Civilian Deaths Military Injured Military Deaths
198
Synopsis I Sem 2014 Number of victims Explosive Devices 149
Number of accidents Explosive Devices 1,337
Number of departments affected 16 (48.4%)
Number of municipalities affected 54 (4.8%)
National Annual Rate (per 100.000) 0.62
Victims
12 - 34 - 56 - 1011 - 16Departamental Borders
Other Devices APM
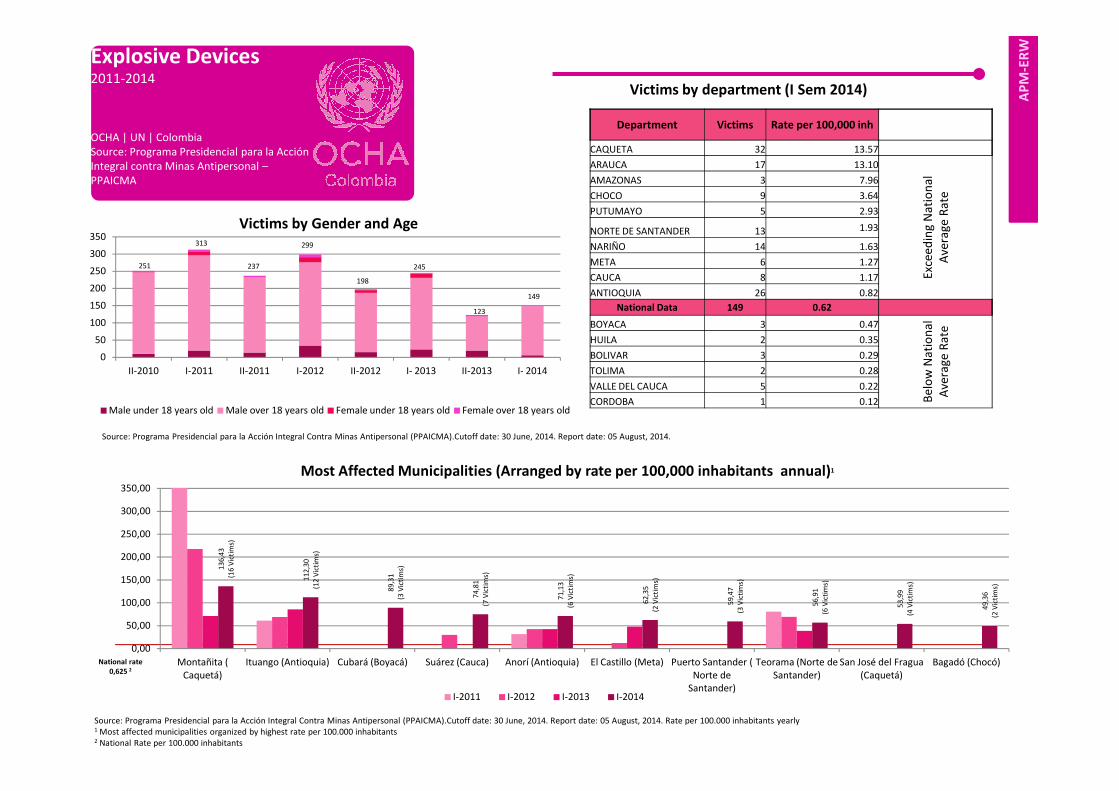
Explosive Devices2011-2014
OCHA | UN | ColombiaSource: Programa Presidencial para la Acción Integral contra Minas Antipersonal –PPAICMA
AP
M-E
RW
Victims by department (I Sem 2014)
Victims by Gender and Age
245
123
251
149
237
299
198
313
0
50
100
150
200
250
300
350
II-2010 I-2011 II-2011 I-2012 II-2012 I- 2013 II-2013 I- 2014
Department Victims Rate per 100,000 inh
CAQUETA 32 13.57
ARAUCA 17 13.10
Exc
ee
din
gN
atio
nal
Ave
rage
Rat
e
AMAZONAS 3 7.96
CHOCO 9 3.64
PUTUMAYO 5 2.93
NORTE DE SANTANDER 13 1.93
NARIÑO 14 1.63
META 6 1.27
CAUCA 8 1.17
ANTIOQUIA 26 0.82
National Data 149 0.62
BOYACA 3 0.47
Be
low
Nat
ion
alA
vera
geR
ate
HUILA 2 0.35
BOLIVAR 3 0.29
TOLIMA 2 0.28
VALLE DEL CAUCA 5 0.22
CORDOBA 1 0.12
Source: Programa Presidencial para la Acción Integral Contra Minas Antipersonal (PPAICMA).Cutoff date: 30 June, 2014. Report date: 05 August, 2014.
Source: Programa Presidencial para la Acción Integral Contra Minas Antipersonal (PPAICMA).Cutoff date: 30 June, 2014. Report date: 05 August, 2014. Rate per 100.000 inhabitants yearly1 Most affected municipalities organized by highest rate per 100.000 inhabitants2 National Rate per 100.000 inhabitants
National rate
0,625 2
Most Affected Municipalities (Arranged by rate per 100,000 inhabitants annual)1
Male under 18 years old Male over 18 years old Female under 18 years old Female over 18 years old
Be
low
Ave
rage
CORDOBA 1 0.12
13
6,4
3(1
6 V
icti
ms)
11
2,3
0
(12
Vic
tim
s)
89
,31
(3 V
icti
ms)
74
,81
(7 V
icti
ms)
71
,13
(6 V
icti
ms)
62
,35
(2 V
icti
ms)
59
,47
(3 V
icti
ms)
56
,91
(6 V
icti
ms)
53
,99
(4 V
icti
ms)
49
,36
(2 V
icti
ms)
0,00
50,00
100,00
150,00
200,00
250,00
300,00
350,00
Montañita (
Caquetá)
Ituango (Antioquia) Cubará (Boyacá) Suárez (Cauca) Anorí (Antioquia) El Castillo (Meta) Puerto Santander (
Norte de Santander)
Teorama (Norte de
Santander)
San José del Fragua
(Caquetá)
Bagadó (Chocó)
I-2011 I-2012 I-2013 I-2014
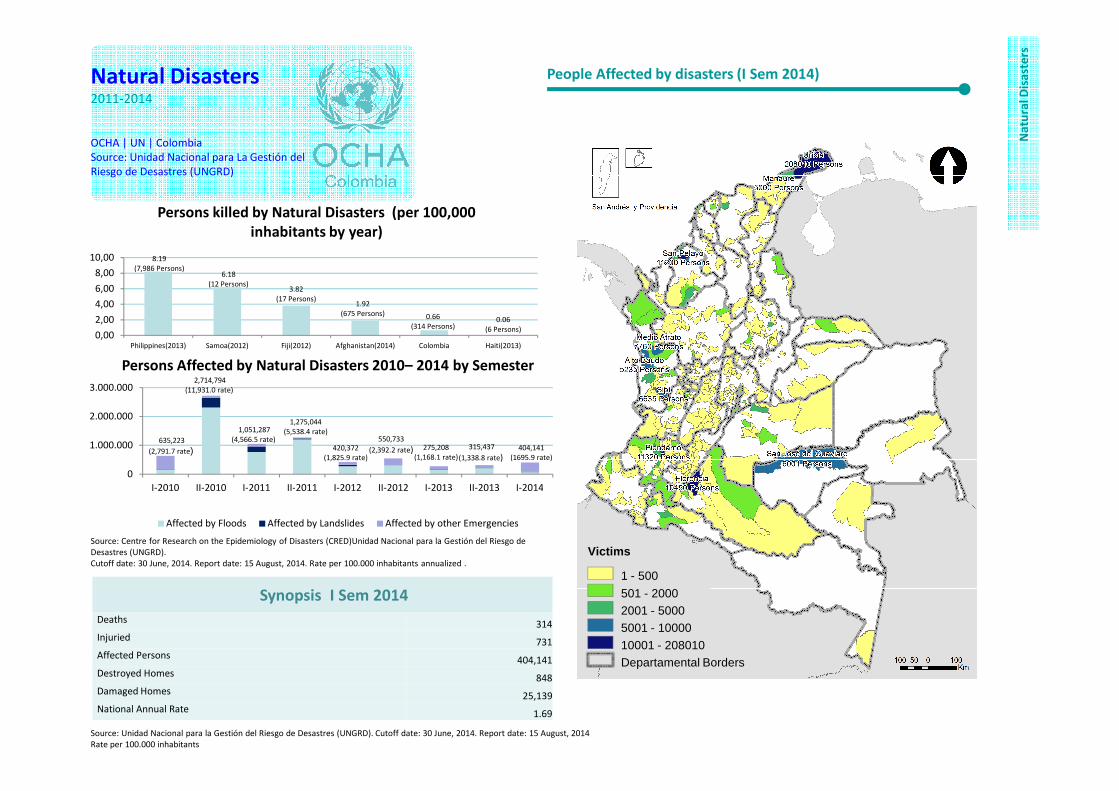
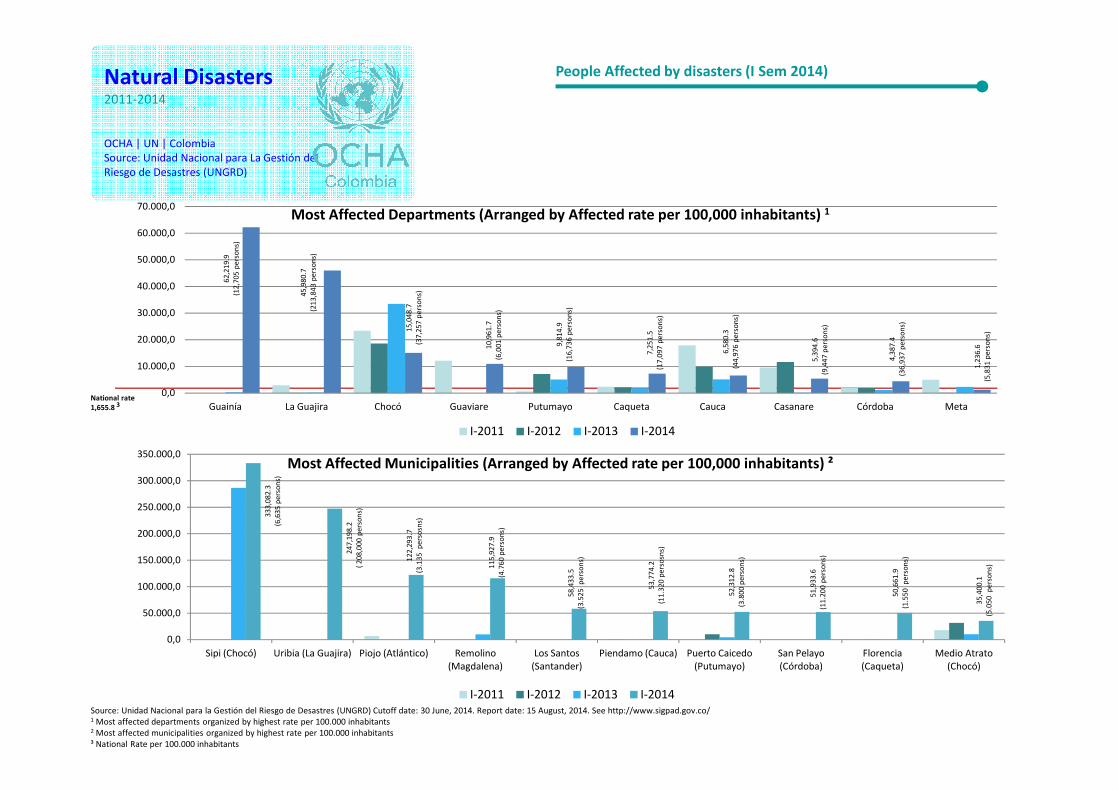
Natural Disasters 2011-2014
OCHA | UN | ColombiaSource: Unidad Nacional para La Gestión del Riesgo de Desastres (UNGRD)
Persons Affected by Natural Disasters 2010– 2014 by Semester
People Affected by disasters (I Sem 2014)
Na
tura
l Dis
ast
ers
8.19(7,986 Persons)
6.18
(12 Persons)3.82
(17 Persons)1.92
(675 Persons) 0.66
(314 Persons)0.06
(6 Persons)0,00
2,00
4,00
6,00
8,00
10,00
Philippines(2013) Samoa(2012) Fiji(2012) Afghanistan(2014) Colombia Haiti(2013)
Persons killed by Natural Disasters (per 100,000
inhabitants by year)
2,714,794
(11,931.0 rate) 3.000.000
Source: Unidad Nacional para la Gestión del Riesgo de Desastres (UNGRD). Cutoff date: 30 June, 2014. Report date: 15 August, 2014Rate per 100.000 inhabitants
Source: Centre for Research on the Epidemiology of Disasters (CRED)Unidad Nacional para la Gestión del Riesgo de Desastres (UNGRD).Cutoff date: 30 June, 2014. Report date: 15 August, 2014. Rate per 100.000 inhabitants annualized .
Synopsis I Sem 2014
Deaths 314
Injuried 731
Affected Persons 404,141
Destroyed Homes 848
Damaged Homes 25,139
National Annual Rate 1.69
550,733
(2,392.2 rate) 315,437
(1,338.8 rate)
635,223
(2,791.7 rate)
1,051,287(4,566.5 rate)
1,275,044
(5,538.4 rate)
420,372
(1,825.9 rate)
275,208
(1,168.1 rate)404,141
(1695.9 rate)
0
1.000.000
2.000.000
I-2010 II-2010 I-2011 II-2011 I-2012 II-2012 I-2013 II-2013 I-2014
Affected by Floods Affected by Landslides Affected by other Emergencies
Victims
1 - 500
501 - 20002001 - 50005001 - 10000
10001 - 208010Departamental Borders
Natural Disasters 2011-2014
OCHA | UN | ColombiaSource: Unidad Nacional para La Gestión del Riesgo de Desastres (UNGRD)
Most Affected Departments (Arranged by Affected rate per 100,000 inhabitants) 1
National rate
People Affected by disasters (I Sem 2014)
62
,21
9.9
(12
,70
5 p
ers
on
s)
45
,98
0.7
(21
3,8
43
pe
rso
ns)
15
,04
8.7
(37
,25
7 p
ers
on
s)
10
,96
1.7
(6,0
01
pe
rso
ns)
9,8
14
.9
(16
,73
6 p
ers
on
s)
7,2
51
.5
(17
,09
7 p
ers
on
s)
6,5
80
.3
(44
,97
6 p
ers
on
s)
5,3
94
.6
(9,4
47
pe
rso
ns)
4,3
87
.4
(36
,93
7 p
ers
on
s)
1,2
36
.6
(5,8
31
pe
rso
ns)
0,0
10.000,0
20.000,0
30.000,0
40.000,0
50.000,0
60.000,0
70.000,0
Most Affected Municipalities (Arranged by Affected rate per 100,000 inhabitants) ²
Source: Unidad Nacional para la Gestión del Riesgo de Desastres (UNGRD) Cutoff date: 30 June, 2014. Report date: 15 August, 2014. See http://www.sigpad.gov.co/1 Most affected departments organized by highest rate per 100.000 inhabitants2 Most affected municipalities organized by highest rate per 100.000 inhabitants³ National Rate per 100.000 inhabitants
National rate
1,655.8 3
33
3,0
82
.3
(6,6
35
pe
rso
ns)
24
7,1
98
.2
( 2
08
,00
0 p
ers
on
s)
12
2,2
93
.7
(3.1
35
pe
rso
sns)
11
5,9
27
.9
(4.7
60
pe
rso
ns)
58
,43
3.5
(3.5
25
pe
rso
ns)
53
,77
4.2
(11
.32
0 p
ers
osn
s)
52
,31
2.8
(3.8
00
pe
rso
ns)
51
,93
3.6
(11
.20
0 p
ers
on
s)
50
,66
1.9
(1.5
50
pe
rso
ns)
35
,40
0.1
(5.0
50
pe
rso
ns)
0,0
50.000,0
100.000,0
150.000,0
200.000,0
250.000,0
300.000,0
350.000,0
Sipi (Chocó) Uribia (La Guajira) Piojo (Atlántico) Remolino
(Magdalena)
Los Santos
(Santander)
Piendamo (Cauca) Puerto Caicedo
(Putumayo)
San Pelayo
(Córdoba)
Florencia
(Caqueta)
Medio Atrato
(Chocó)
I-2011 I-2012 I-2013 I-2014
0,0
Guainía La Guajira Chocó Guaviare Putumayo Caqueta Cauca Casanare Córdoba Meta
I-2011 I-2012 I-2013 I-2014
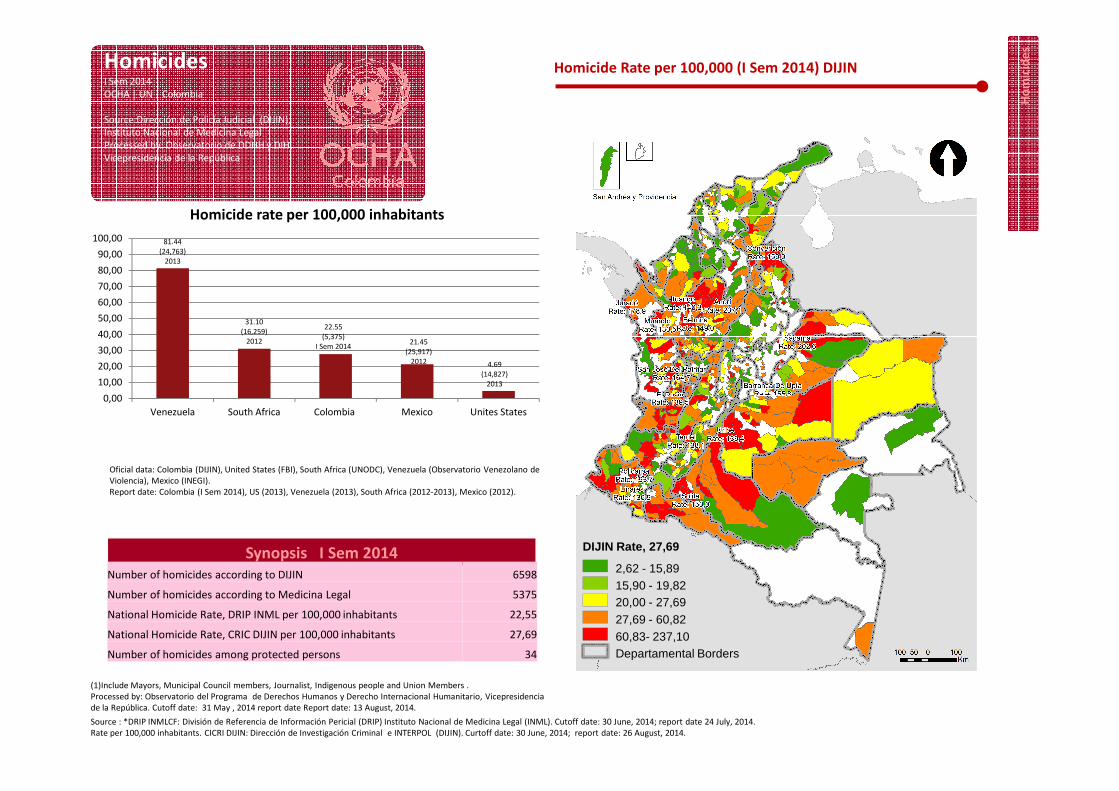
HomicidesI Sem 2014OCHA | UN | Colombia
Source:Dirección de Policía Judicial (DIJIN), Instituto Nacional de Medicina LegalProcessed by: Observatorio de DDHH y DIH, Vicepresidencia de la República
Homicide rate per 100,000 inhabitants
Homicide Rate per 100,000 (I Sem 2014) DIJIN
Ho
mic
ide
s
81.44
(24,763)
2013
31.10
(16,259)
2012
22.55
(5,375)I Sem 2014
21.45
(25,917)
2012 4.69
(14,827)
2013
0,00
10,00
20,00
30,00
40,00
50,00
60,00
70,00
80,00
90,00
100,00
Oficial data: Colombia (DIJIN), United States (FBI), South Africa (UNODC), Venezuela (Observatorio Venezolano de Violencia), Mexico (INEGI).Report date: Colombia (I Sem 2014), US (2013), Venezuela (2013), South Africa (2012-2013), Mexico (2012).
Synopsis I Sem 2014
Source : *DRIP INMLCF: División de Referencia de Información Pericial (DRIP) Instituto Nacional de Medicina Legal (INML). Cutoff date: 30 June, 2014; report date 24 July, 2014.Rate per 100,000 inhabitants. CICRI DIJIN: Dirección de Investigación Criminal e INTERPOL (DIJIN). Curtoff date: 30 June, 2014; report date: 26 August, 2014.
(1)Include Mayors, Municipal Council members, Journalist, Indigenous people and Union Members .Processed by: Observatorio del Programa de Derechos Humanos y Derecho Internacional Humanitario, Vicepresidencia de la República. Cutoff date: 31 May , 2014 report date Report date: 13 August, 2014.
Number of homicides according to DIJIN 6598
Number of homicides according to Medicina Legal 5375
National Homicide Rate, DRIP INML per 100,000 inhabitants 22,55
National Homicide Rate, CRIC DIJIN per 100,000 inhabitants 27,69
Number of homicides among protected persons 34
DIJIN Rate, 27,69
2,62 - 15,8915,90 - 19,8220,00 - 27,6927,69 - 60,8260,83- 237,10Departamental Borders
0,00
Venezuela South Africa Colombia Mexico Unites States
Ho
mic
ide
s
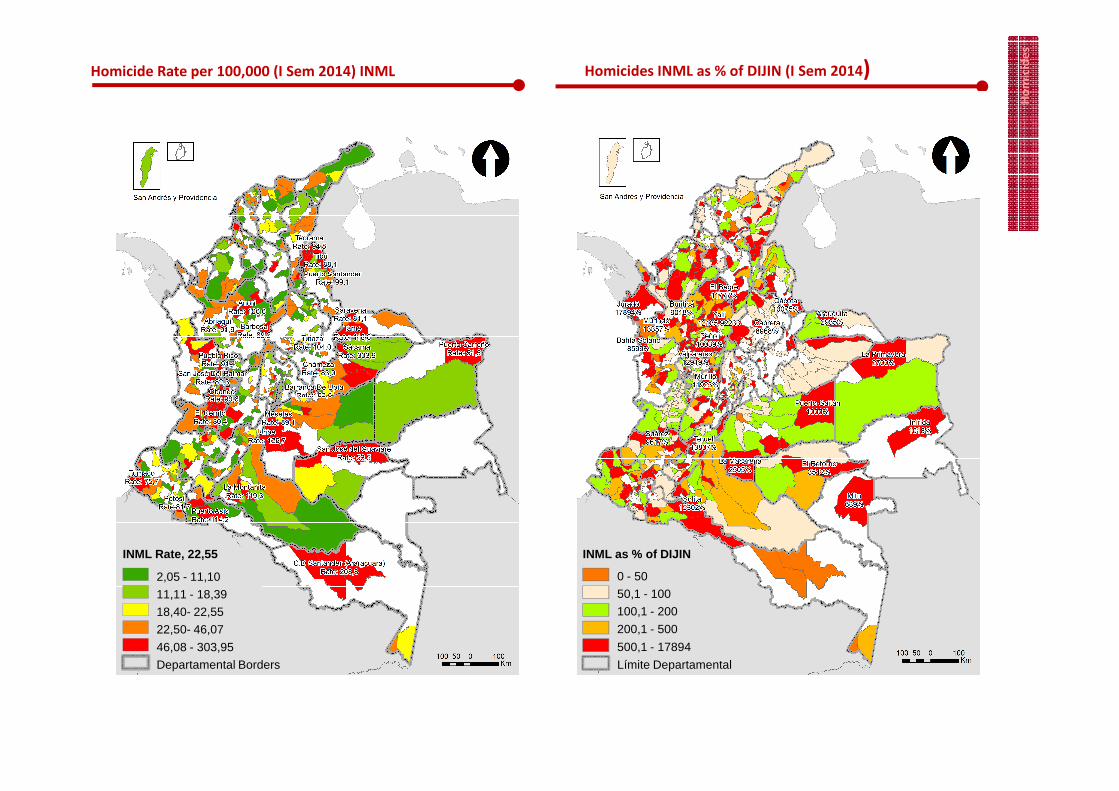
Homicide Rate per 100,000 (I Sem 2014) INML Homicides INML as % of DIJIN (I Sem 2014)
INML Rate, 22,55
2,05 - 11,10
11,11 - 18,39
18,40- 22,55
22,50- 46,07
46,08 - 303,95
Departamental Borders
INML as % of DIJIN
0 - 50
50,1 - 100
100,1 - 200
200,1 - 500
500,1 - 17894
Límite Departamental
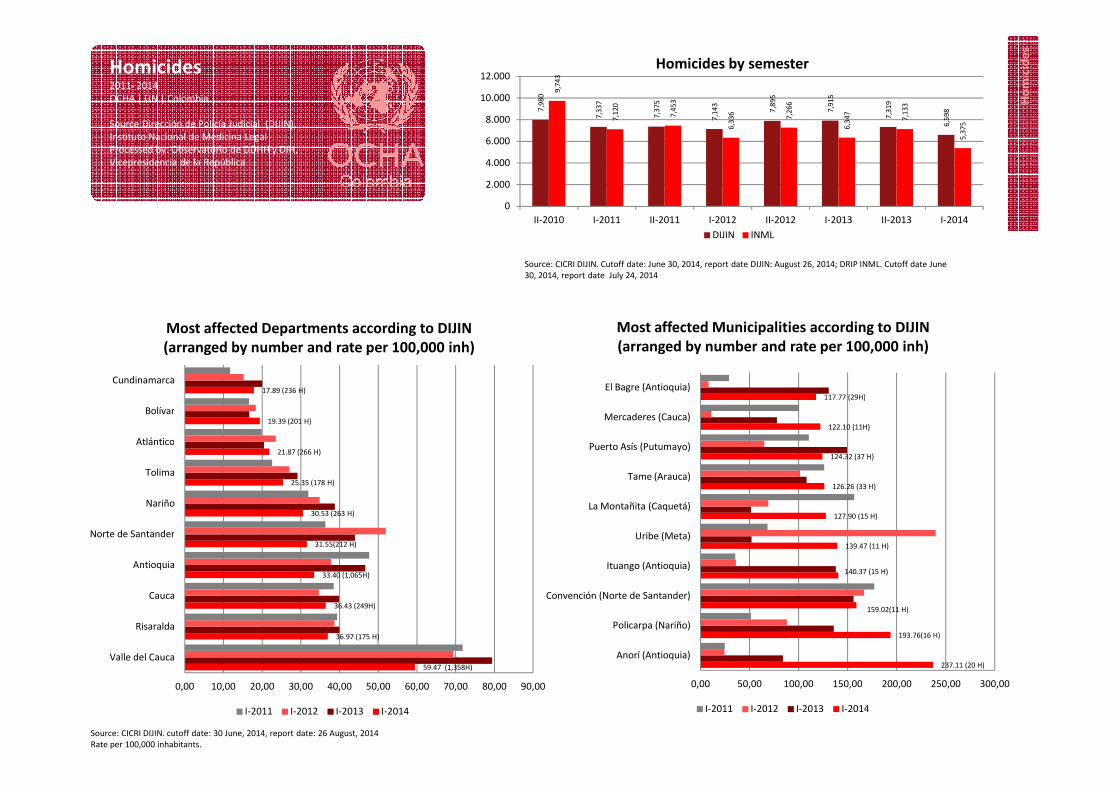
Homicides2011- 2014OCHA | UN | Colombia
Source:Dirección de Policía Judicial (DIJIN), Instituto Nacional de Medicina LegalProcessed by: Observatorio de DDHH y DIH, Vicepresidencia de la República
Ho
mic
ide
s
Homicides by semester
Most affected Departments according to DIJIN
(arranged by number and rate per 100,000 inh)
Most affected Municipalities according to DIJIN
(arranged by number and rate per 100,000 inh)
Source: CICRI DIJIN. Cutoff date: June 30, 2014, report date DIJIN: August 26, 2014; DRIP INML. Cutoff date June 30, 2014, report date July 24, 2014
7,9
80
7,3
37
7,3
75
7,1
43
7,8
95
7,9
15
7,3
19
6,5
98
9,7
43
7,1
20
7,4
53
6,3
36 7,2
66
6,3
47
7,1
33
5,3
75
0
2.000
4.000
6.000
8.000
10.000
12.000
II-2010 I-2011 II-2011 I-2012 II-2012 I-2013 II-2013 I-2014
DIJIN INML
17.89 (236 H)Cundinamarca
117.77 (29H)El Bagre (Antioquia)
Source: CICRI DIJIN. cutoff date: 30 June, 2014, report date: 26 August, 2014Rate per 100,000 inhabitants.
59.47 (1,358H)
36.97 (175 H)
36.43 (249H)
33.40 (1,065H)
31.55(212 H)
30.53 (263 H)
25.35 (178 H)
21.87 (266 H)
19.39 (201 H)
0,00 10,00 20,00 30,00 40,00 50,00 60,00 70,00 80,00 90,00
Valle del Cauca
Risaralda
Cauca
Antioquia
Norte de Santander
Nariño
Tolima
Atlántico
Bolívar
I-2011 I-2012 I-2013 I-2014
237.11 (20 H)
193.76(16 H)
140.37 (15 H)
159.02(11 H)
139.47 (11 H)
127.90 (15 H)
126.26 (33 H)
124.32 (37 H)
122.10 (11H)
117.77 (29H)
0,00 50,00 100,00 150,00 200,00 250,00 300,00
Anorí (Antioquia)
Policarpa (Nariño)
Convención (Norte de Santander)
Ituango (Antioquia)
Uribe (Meta)
La Montañita (Caquetá)
Tame (Arauca)
Puerto Asís (Putumayo)
Mercaderes (Cauca)
I-2011 I-2012 I-2013 I-2014
Homicides2011-2014OCHA | UN | Colombia
Source:Dirección de Policía Judicial (DIJIN), Instituto Nacional de Medicina LegalProcessed by: Observatorio de DDHH y DIH, Vicepresidencia de la República
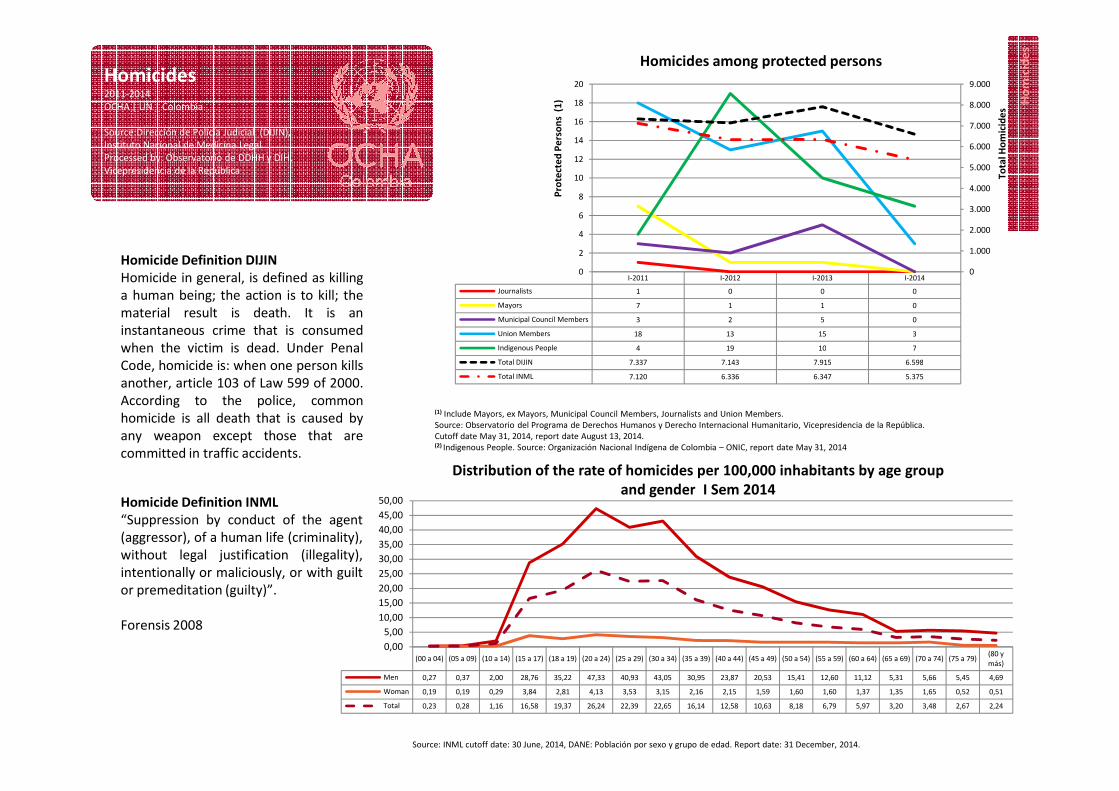
Homicide Definition DIJIN
Homicide in general, is defined as killinga human being; the action is to kill; thematerial result is death. It is aninstantaneous crime that is consumedwhen the victim is dead. Under PenalCode, homicide is: when one person killsanother, article 103 of Law 599 of 2000.According to the police, common
Ho
mic
ide
s
I-2011 I-2012 I-2013 I-2014
Journalists 1 0 0 0
Mayors 7 1 1 0
Municipal Council Members 3 2 5 0
Union Members 18 13 15 3
Indigenous People 4 19 10 7
Total DIJIN 7.337 7.143 7.915 6.598
Total INML 7.120 6.336 6.347 5.375
0
1.000
2.000
3.000
4.000
5.000
6.000
7.000
8.000
9.000
0
2
4
6
8
10
12
14
16
18
20
To
tal H
om
icid
es
Pro
tect
ed
Pe
rso
ns
(1)
Homicides among protected persons
According to the police, commonhomicide is all death that is caused byany weapon except those that arecommitted in traffic accidents.
Homicide Definition INML
“Suppression by conduct of the agent(aggressor), of a human life (criminality),without legal justification (illegality),intentionally or maliciously, or with guiltor premeditation (guilty)”.
Forensis 2008
Distribution of the rate of homicides per 100,000 inhabitants by age group
and gender I Sem 2014
Source: INML cutoff date: 30 June, 2014, DANE: Población por sexo y grupo de edad. Report date: 31 December, 2014.
(1) Include Mayors, ex Mayors, Municipal Council Members, Journalists and Union Members. Source: Observatorio del Programa de Derechos Humanos y Derecho Internacional Humanitario, Vicepresidencia de la República. Cutoff date May 31, 2014, report date August 13, 2014.(2) Indigenous People. Source: Organización Nacional Indígena de Colombia – ONIC, report date May 31, 2014
(00 a 04) (05 a 09) (10 a 14) (15 a 17) (18 a 19) (20 a 24) (25 a 29) (30 a 34) (35 a 39) (40 a 44) (45 a 49) (50 a 54) (55 a 59) (60 a 64) (65 a 69) (70 a 74) (75 a 79)(80 y
más)
Men 0,27 0,37 2,00 28,76 35,22 47,33 40,93 43,05 30,95 23,87 20,53 15,41 12,60 11,12 5,31 5,66 5,45 4,69
Woman 0,19 0,19 0,29 3,84 2,81 4,13 3,53 3,15 2,16 2,15 1,59 1,60 1,60 1,37 1,35 1,65 0,52 0,51
Total 0,23 0,28 1,16 16,58 19,37 26,24 22,39 22,65 16,14 12,58 10,63 8,18 6,79 5,97 3,20 3,48 2,67 2,24
0,00
5,00
10,00
15,00
20,00
25,00
30,00
35,00
40,00
45,00
50,00
Disappearence2010-2013OCHA | UN | Colombia
Source: Instituo Nacional de Medicina Legal y Ciencias Forenses.Processed by: Observatorio de DDHH y DIH, Vicepresidencia de la República
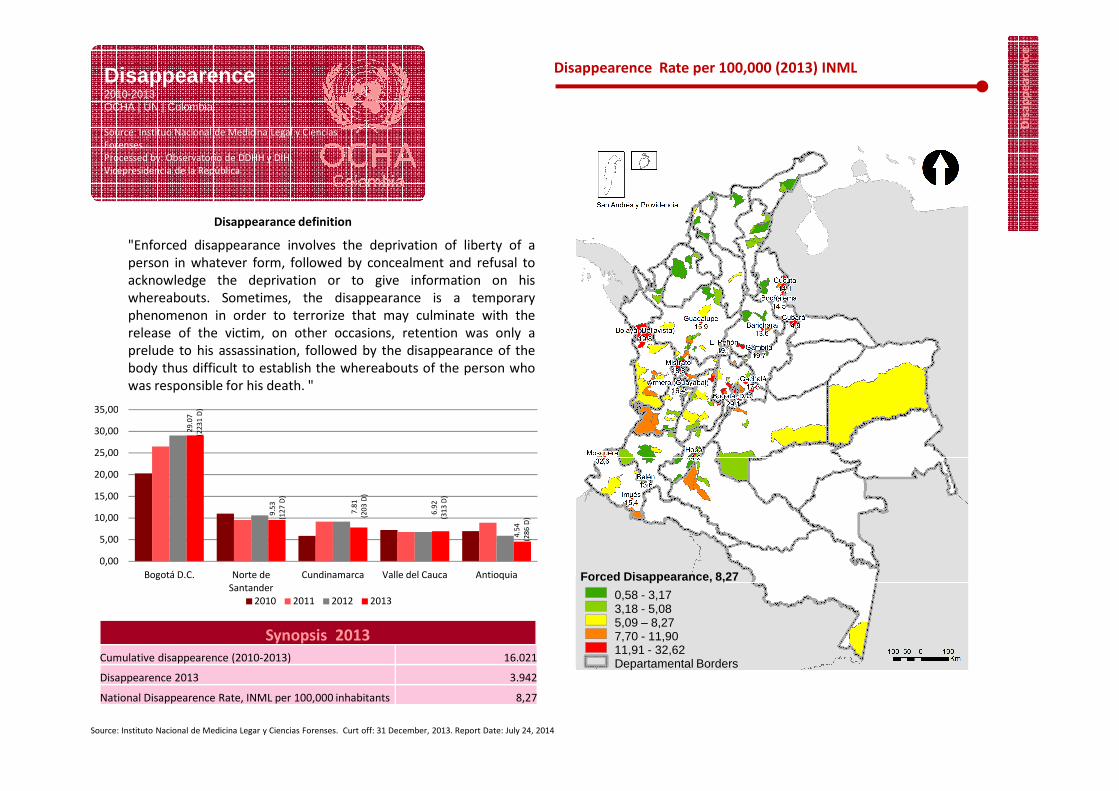
Disappearance definition
Disappearence Rate per 100,000 (2013) INML
Dis
ap
pe
are
nce
"Enforced disappearance involves the deprivation of liberty of aperson in whatever form, followed by concealment and refusal toacknowledge the deprivation or to give information on hiswhereabouts. Sometimes, the disappearance is a temporaryphenomenon in order to terrorize that may culminate with therelease of the victim, on other occasions, retention was only aprelude to his assassination, followed by the disappearance of thebody thus difficult to establish the whereabouts of the person whowas responsible for his death. "
Synopsis 2013
Source: Instituto Nacional de Medicina Legar y Ciencias Forenses. Curt off: 31 December, 2013. Report Date: July 24, 2014
Cumulative disappearence (2010-2013) 16.021
Disappearence 2013 3.942
National Disappearence Rate, INML per 100,000 inhabitants 8,27
29
.07
(22
31
D)
9.5
3
(12
7 D
)
7.8
1(2
03
D)
6.9
2
(31
3 D
)
4.5
4
(28
6 D
)
0,00
5,00
10,00
15,00
20,00
25,00
30,00
35,00
Bogotá D.C. Norte de
Santander
Cundinamarca Valle del Cauca Antioquia
2010 2011 2012 2013
Forced Disappearance, 8,27
0,58 - 3,173,18 - 5,085,09 – 8,277,70 - 11,9011,91 - 32,62Departamental Borders
Disappearence2010-2013OCHA | UN | Colombia
Processed by: Observatorio de DDHH y DIH, Vicepresidencia de la República
Dis
ap
pe
are
nce
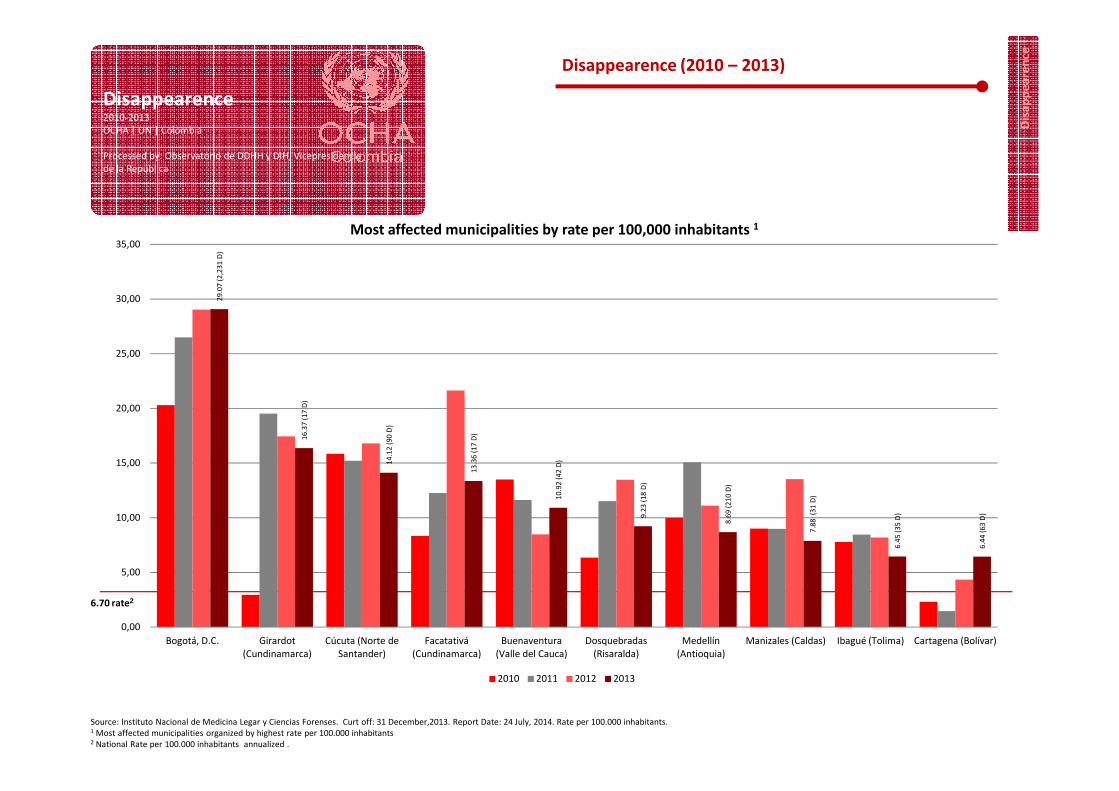
Disappearence (2010 – 2013)
Most affected municipalities by rate per 100,000 inhabitants 12
9.0
7 (
2,2
31
D)
25,00
30,00
35,00
6.70 rate2
Source: Instituto Nacional de Medicina Legar y Ciencias Forenses. Curt off: 31 December,2013. Report Date: 24 July, 2014. Rate per 100.000 inhabitants.1 Most affected municipalities organized by highest rate per 100.000 inhabitants2 National Rate per 100.000 inhabitants annualized .
16
.37
(1
7 D
)
14
.12
(9
0 D
)
13
.36
(1
7 D
)
10
.92
(4
2 D
)
9.2
3 (
18
D)
8.6
9 (
21
0 D
)
7.8
8 (
31
D)
6.4
5 (
35
D)
6.4
4 (
63
D)
0,00
5,00
10,00
15,00
20,00
Bogotá, D.C. Girardot
(Cundinamarca)
Cúcuta (Norte de
Santander)
Facatativá
(Cundinamarca)
Buenaventura
(Valle del Cauca)
Dosquebradas
(Risaralda)
Medellín
(Antioquia)
Manizales (Caldas) Ibagué (Tolima) Cartagena (Bolívar)
2010 2011 2012 2013
HS
RI
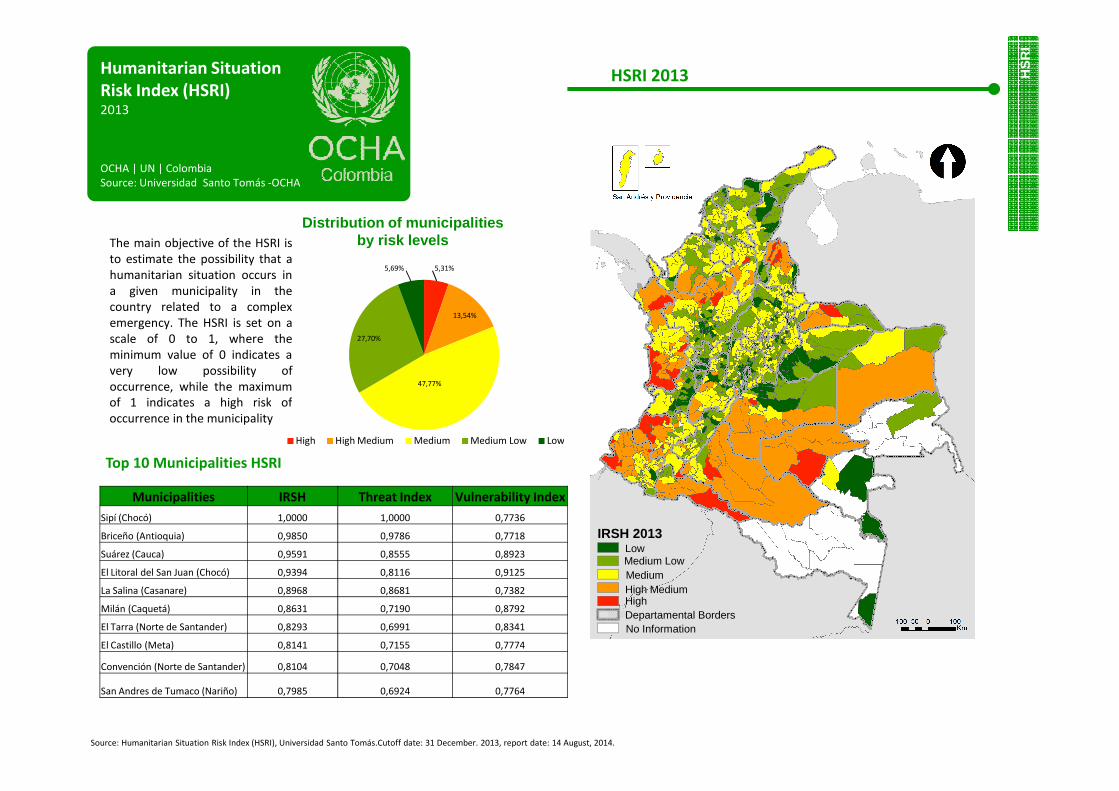
Humanitarian Situation
Risk Index (HSRI)2013
OCHA | UN | ColombiaSource: Universidad Santo Tomás -OCHA
The main objective of the HSRI isto estimate the possibility that ahumanitarian situation occurs ina given municipality in thecountry related to a complexemergency. The HSRI is set on ascale of 0 to 1, where theminimum value of 0 indicates avery low possibility ofoccurrence, while the maximumof 1 indicates a high risk of
Distribution of municipalities by risk levels
HSRI 2013
5,31%
13,54%
47,77%
27,70%
5,69%
Top 10 Municipalities HSRI
of 1 indicates a high risk ofoccurrence in the municipality
Source: Humanitarian Situation Risk Index (HSRI), Universidad Santo Tomás.Cutoff date: 31 December. 2013, report date: 14 August, 2014.
Municipalities IRSH Threat Index Vulnerability Index
Sipí (Chocó) 1,0000 1,0000 0,7736
Briceño (Antioquia) 0,9850 0,9786 0,7718
Suárez (Cauca) 0,9591 0,8555 0,8923
El Litoral del San Juan (Chocó) 0,9394 0,8116 0,9125
La Salina (Casanare) 0,8968 0,8681 0,7382
Milán (Caquetá) 0,8631 0,7190 0,8792
El Tarra (Norte de Santander) 0,8293 0,6991 0,8341
El Castillo (Meta) 0,8141 0,7155 0,7774
Convención (Norte de Santander) 0,8104 0,7048 0,7847
San Andres de Tumaco (Nariño) 0,7985 0,6924 0,7764
High High Medium Medium Medium Low Low
IRSH 2013LowMedium LowMediumHigh MediumHighDepartamental Borders No Information
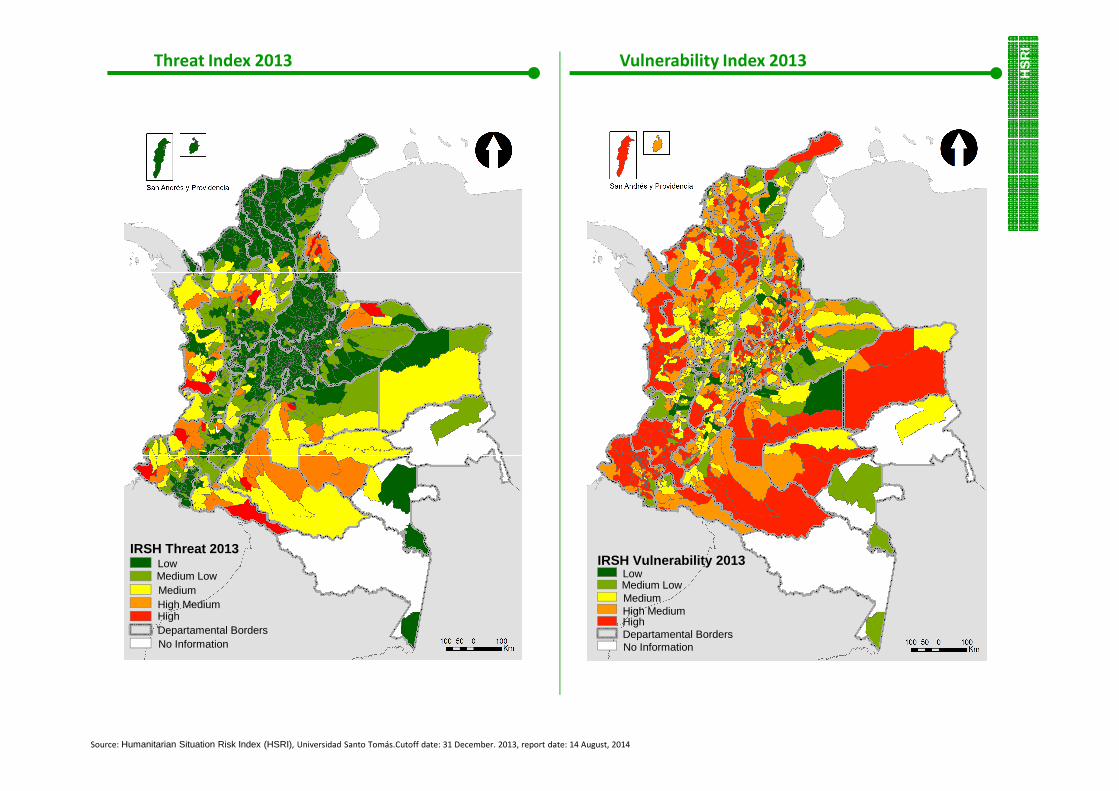
Threat Index 2013 Vulnerability Index 2013
HS
RI
Source: Humanitarian Situation Risk Index (HSRI), Universidad Santo Tomás.Cutoff date: 31 December. 2013, report date: 14 August, 2014
IRSH Vulnerability 2013LowMedium LowMediumHigh MediumHighDepartamental Borders No Information
IRSH Threat 2013LowMedium LowMediumHigh MediumHighDepartamental Borders No Information


![Universidad del Cauca. Siler Amador Donado [Relis] samador](https://img.pdfslide.us/doc/110x75/618d03ad98d5b4372b738e84/universidad-del-cauca-siler-amador-donado-relis-samador-.jpg)