Embed Size (px)
Citation preview
COLLIERVILLE 2016 Development Report
April 7, 2017
Town of Collierville
Planning Division
2016 Development Report Collierville Board of Mayor and Aldermen (2016)
Mayor Stan Joyner Alderman Tom Allen
Alderman Maureen Fraser, Vice-Mayor Alderman Billy Patton
Alderman John E. Stamps Alderman John Worley
Collierville Planning Commission (2016)
Gregory Cotton, Chair
Town Administrator James Lewellen
Director of Development Jay Cravens, AICP
Town Planner Jaime Groce, AICP
Planning Division Staff
David Bradford, Secretary Bradley Rice
Jewel Jordan Scott Rozanski, Vice-Chair Cheri Kilmurray (December) Mike Tebbe
Debora Murdock (January-November) Alderman John Worley Timothy Netherton
Kevin Bingham, GIS Manager Sean Isham, AICP, Project Manager
Nancy Boatwright, AICP, Asst. Town Planner Shari Michael, Sr. Admin. Specialist
Diana DuBois, Planner Sandi Robbins, Admin. Specialist
Scott Henninger, AICP, RLA, Planner Brant Sollis, GIS Technician
Matthew Wilkinson, Planner
April 7, 2017
Town of Collierville
Planning Division
Summary
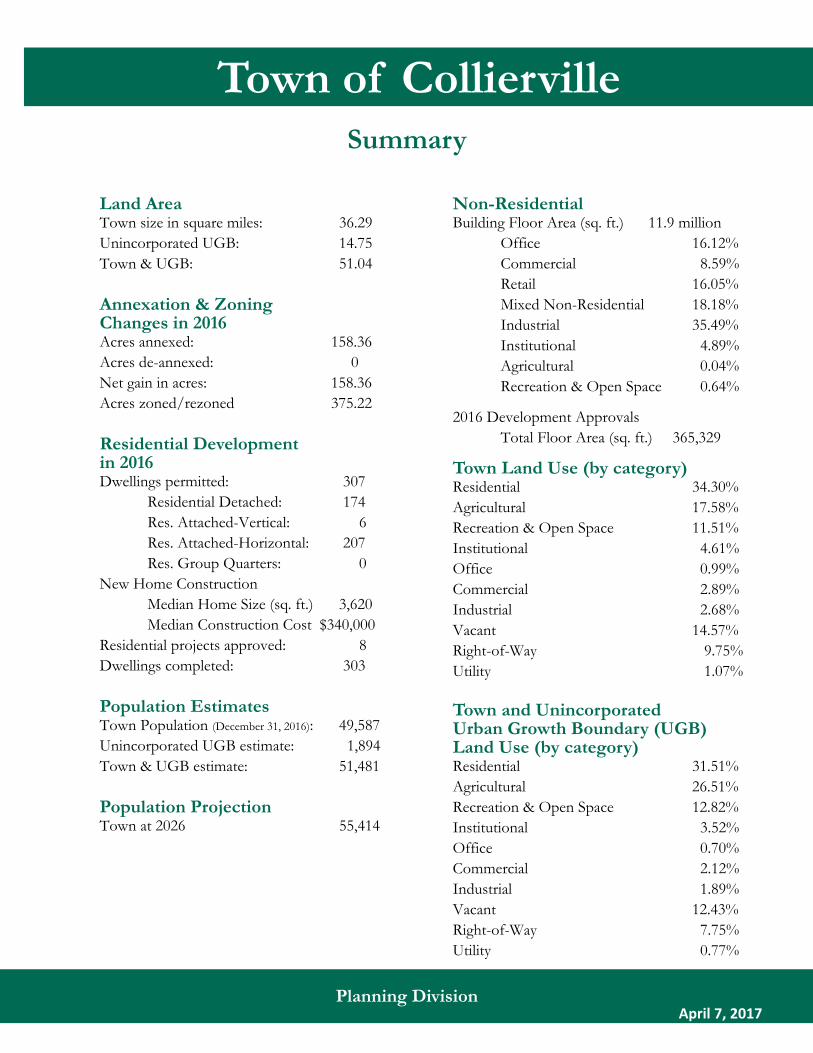
Land Area Town size in square miles: 36.29 Unincorporated UGB: 14.75 Town & UGB: 51.04 Annexation & Zoning Changes in 2016 Acres annexed: 158.36 Acres de-annexed: 0 Net gain in acres: 158.36 Acres zoned/rezoned 375.22 Residential Development in 2016 Dwellings permitted: 307 Residential Detached: 174 Res. Attached-Vertical: 6 Res. Attached-Horizontal: 207 Res. Group Quarters: 0 New Home Construction Median Home Size (sq. ft.) 3,620 Median Construction Cost $340,000 Residential projects approved: 8 Dwellings completed: 303 Population Estimates Town Population (December 31, 2016): 49,587 Unincorporated UGB estimate: 1,894 Town & UGB estimate: 51,481 Population Projection Town at 2026 55,414
Non-Residential Building Floor Area (sq. ft.) 11.9 million Office 16.12% Commercial 8.59% Retail 16.05% Mixed Non-Residential 18.18% Industrial 35.49% Institutional 4.89% Agricultural 0.04% Recreation & Open Space 0.64%
2016 Development Approvals Total Floor Area (sq. ft.) 365,329
Town Land Use (by category) Residential 34.30% Agricultural 17.58% Recreation & Open Space 11.51% Institutional 4.61% Office 0.99% Commercial 2.89% Industrial 2.68% Vacant 14.57% Right-of-Way 9.75% Utility 1.07% Town and Unincorporated Urban Growth Boundary (UGB) Land Use (by category) Residential 31.51% Agricultural 26.51% Recreation & Open Space 12.82% Institutional 3.52% Office 0.70% Commercial 2.12% Industrial 1.89% Vacant 12.43% Right-of-Way 7.75% Utility 0.77%
April 7, 2017
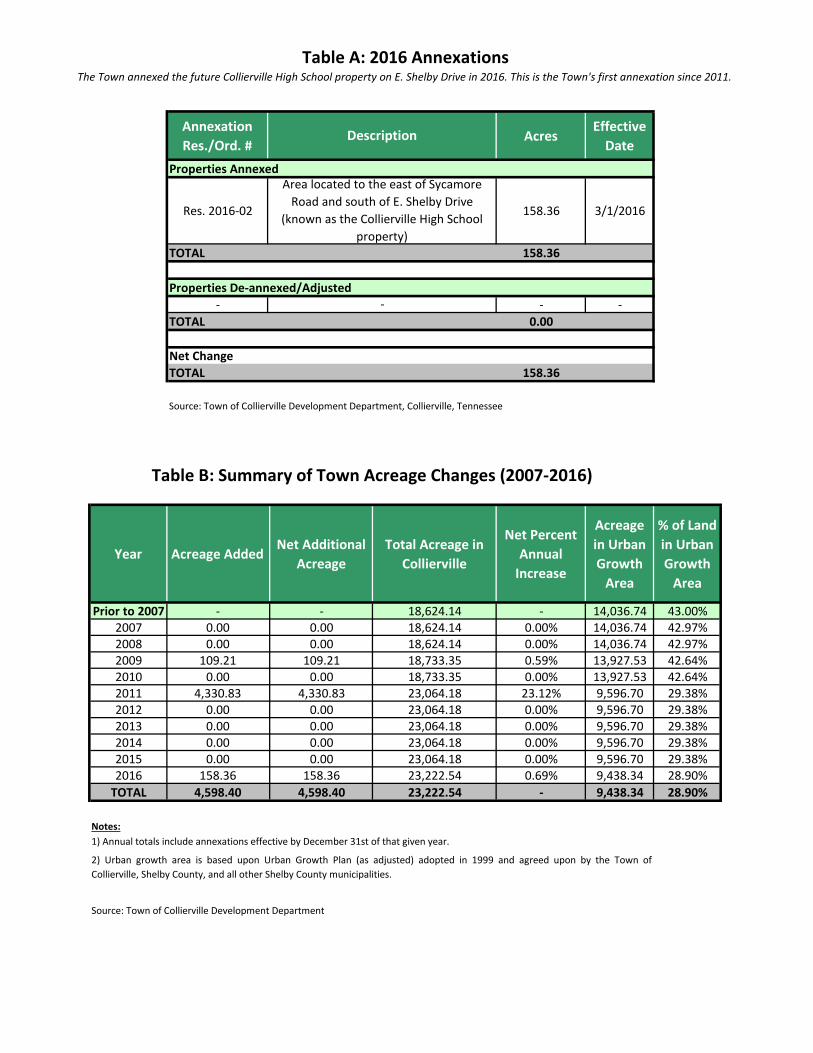
Table A: 2016 AnnexationsThe Town annexed the future Collierville High School property on E. Shelby Drive in 2016. This is the Town's first annexation since 2011.
Annexation Res./Ord. #
AcresEffective
DateProperties Annexed
Res. 2016-02 158.36 3/1/2016
TOTAL 158.36
Properties De-annexed/Adjusted- - -
TOTAL 0.00
Net ChangeTOTAL 158.36
Source: Town of Collierville Development Department, Collierville, Tennessee
Year Acreage AddedNet Additional
AcreageTotal Acreage in
Collierville
Net Percent Annual
Increase
Acreage in Urban Growth
Area
% of Land in Urban Growth
Area
Prior to 2007 - - 18,624.14 - 14,036.74 43.00%2007 0.00 0.00 18,624.14 0.00% 14,036.74 42.97%2008 0.00 0.00 18,624.14 0.00% 14,036.74 42.97%2009 109.21 109.21 18,733.35 0.59% 13,927.53 42.64%2010 0.00 0.00 18,733.35 0.00% 13,927.53 42.64%2011 4,330.83 4,330.83 23,064.18 23.12% 9,596.70 29.38%2012 0.00 0.00 23,064.18 0.00% 9,596.70 29.38%2013 0.00 0.00 23,064.18 0.00% 9,596.70 29.38%2014 0.00 0.00 23,064.18 0.00% 9,596.70 29.38%2015 0.00 0.00 23,064.18 0.00% 9,596.70 29.38%2016 158.36 158.36 23,222.54 0.69% 9,438.34 28.90%
TOTAL 4,598.40 4,598.40 23,222.54 - 9,438.34 28.90%
Notes:
Source: Town of Collierville Development Department
Table B: Summary of Town Acreage Changes (2007-2016)
1) Annual totals include annexations effective by December 31st of that given year.
2) Urban growth area is based upon Urban Growth Plan (as adjusted) adopted in 1999 and agreed upon by the Town ofCollierville, Shelby County, and all other Shelby County municipalities.
Description
Area located to the east of Sycamore Road and south of E. Shelby Drive
(known as the Collierville High School property)
-
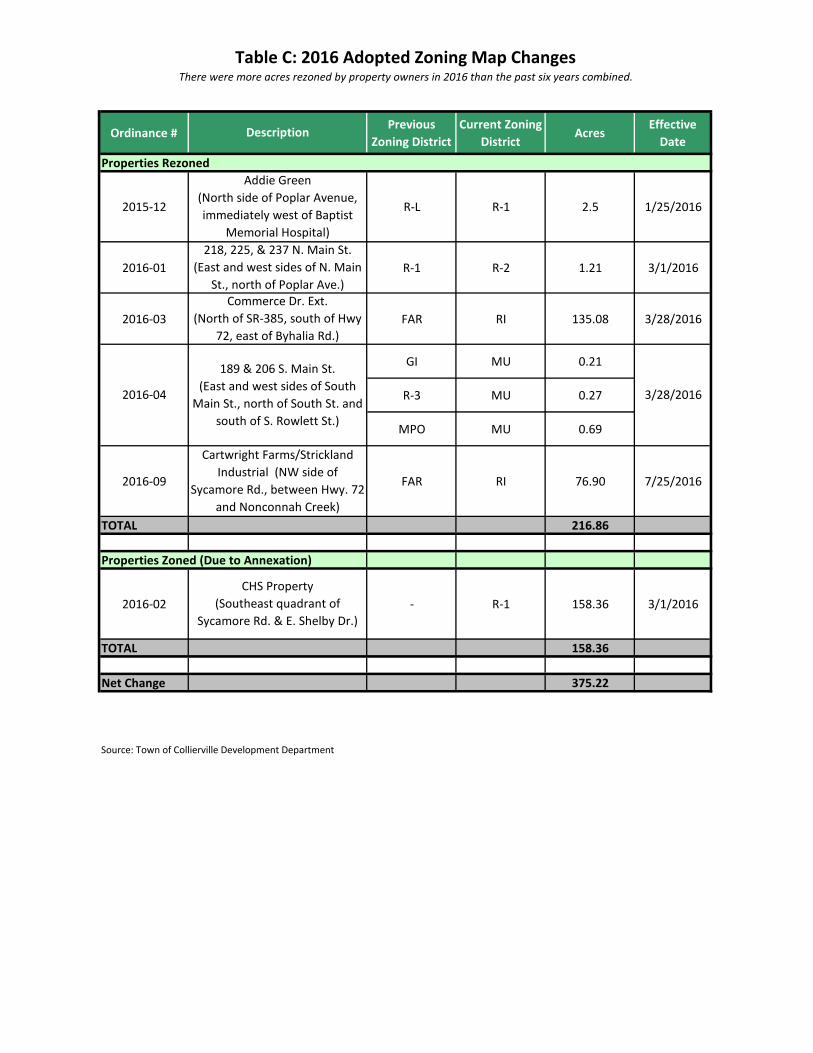
Table C: 2016 Adopted Zoning Map Changes There were more acres rezoned by property owners in 2016 than the past six years combined.
Ordinance #Previous
Zoning DistrictCurrent Zoning
DistrictAcres
Effective Date
Properties Rezoned
2015-12 R-L R-1 2.5 1/25/2016
2016-01 R-1 R-2 1.21 3/1/2016
2016-03 FAR RI 135.08 3/28/2016
GI MU 0.21
R-3 MU 0.27
MPO MU 0.69
2016-09 FAR RI 76.90 7/25/2016
TOTAL 216.86
Properties Zoned (Due to Annexation)
2016-02 - R-1 158.36 3/1/2016
TOTAL 158.36
Net Change 375.22
Description
218, 225, & 237 N. Main St. (East and west sides of N. Main
St., north of Poplar Ave.)Commerce Dr. Ext.
(North of SR-385, south of Hwy 72, east of Byhalia Rd.)
Cartwright Farms/Strickland Industrial (NW side of
Sycamore Rd., between Hwy. 72 and Nonconnah Creek)
189 & 206 S. Main St. (East and west sides of South
Main St., north of South St. and south of S. Rowlett St.)
3/28/2016
Addie Green (North side of Poplar Avenue, immediately west of Baptist
Memorial Hospital)
CHS Property (Southeast quadrant of
Sycamore Rd. & E. Shelby Dr.)
Source: Town of Collierville Development Department
2016-04
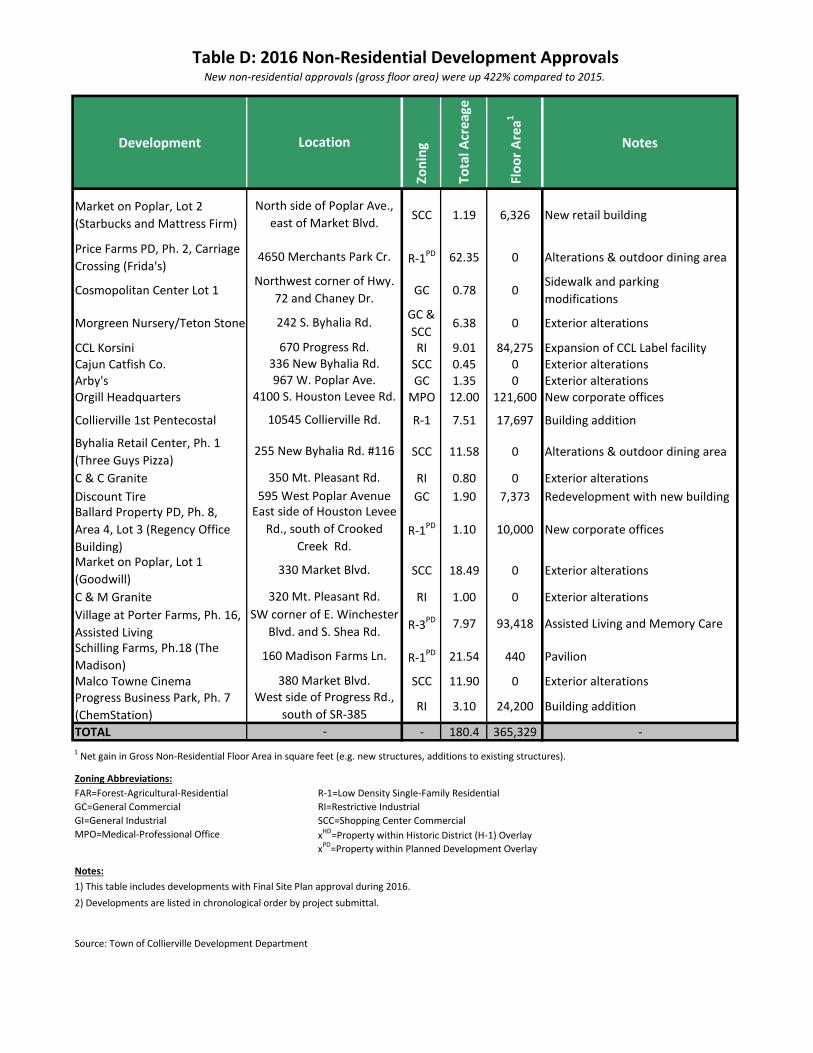
Table D: 2016 Non-Residential Development ApprovalsNew non-residential approvals (gross floor area) were up 422% compared to 2015.
Development
Zon
ing
Tot
al A
crea
ge
Flo
or A
rea1
Notes
Market on Poplar, Lot 2 (Starbucks and Mattress Firm)
SCC 1.19 6,326 New retail building
Price Farms PD, Ph. 2, Carriage Crossing (Frida's) R-1PD 62.35 0 Alterations & outdoor dining area
Cosmopolitan Center Lot 1 GC 0.78 0Sidewalk and parking modifications
Morgreen Nursery/Teton StoneGC & SCC
6.38 0 Exterior alterations
CCL Korsini RI 9.01 84,275 Expansion of CCL Label facilityCajun Catfish Co. SCC 0.45 0 Exterior alterationsArby's GC 1.35 0 Exterior alterationsOrgill Headquarters MPO 12.00 121,600 New corporate offices
Collierville 1st Pentecostal R-1 7.51 17,697 Building addition
Byhalia Retail Center, Ph. 1 (Three Guys Pizza)
SCC 11.58 0 Alterations & outdoor dining area
C & C Granite RI 0.80 0 Exterior alterationsDiscount Tire GC 1.90 7,373 Redevelopment with new buildingBallard Property PD, Ph. 8, Area 4, Lot 3 (Regency Office Building)
R-1PD 1.10 10,000 New corporate offices
Market on Poplar, Lot 1 (Goodwill)
SCC 18.49 0 Exterior alterations
C & M Granite RI 1.00 0 Exterior alterationsVillage at Porter Farms, Ph. 16, Assisted Living R-3PD 7.97 93,418 Assisted Living and Memory Care
Schilling Farms, Ph.18 (The Madison) R-1PD 21.54 440 Pavilion
Malco Towne Cinema SCC 11.90 0 Exterior alterationsProgress Business Park, Ph. 7 (ChemStation)
RI 3.10 24,200 Building addition
TOTAL - 180.4 365,329 -
Zoning Abbreviations:
Notes:
Source: Town of Collierville Development Department
10545 Collierville Rd.
MPO=Medical-Professional OfficexPD=Property within Planned Development OverlayxHD=Property within Historic District (H-1) Overlay
2) Developments are listed in chronological order by project submittal. 1) This table includes developments with Final Site Plan approval during 2016.
SCC=Shopping Center Commercial
-
R-1=Low Density Single-Family Residential
Location
4650 Merchants Park Cr.
Northwest corner of Hwy. 72 and Chaney Dr.
670 Progress Rd.
North side of Poplar Ave., east of Market Blvd.
4100 S. Houston Levee Rd.967 W. Poplar Ave.
336 New Byhalia Rd.
242 S. Byhalia Rd.
GC=General CommercialGI=General Industrial
RI=Restrictive Industrial
1 Net gain in Gross Non-Residential Floor Area in square feet (e.g. new structures, additions to existing structures).
FAR=Forest-Agricultural-Residential
SW corner of E. Winchester Blvd. and S. Shea Rd.
160 Madison Farms Ln.
West side of Progress Rd., south of SR-385
380 Market Blvd.
255 New Byhalia Rd. #116
350 Mt. Pleasant Rd.595 West Poplar Avenue
East side of Houston Levee Rd., south of Crooked
Creek Rd.
330 Market Blvd.
320 Mt. Pleasant Rd.
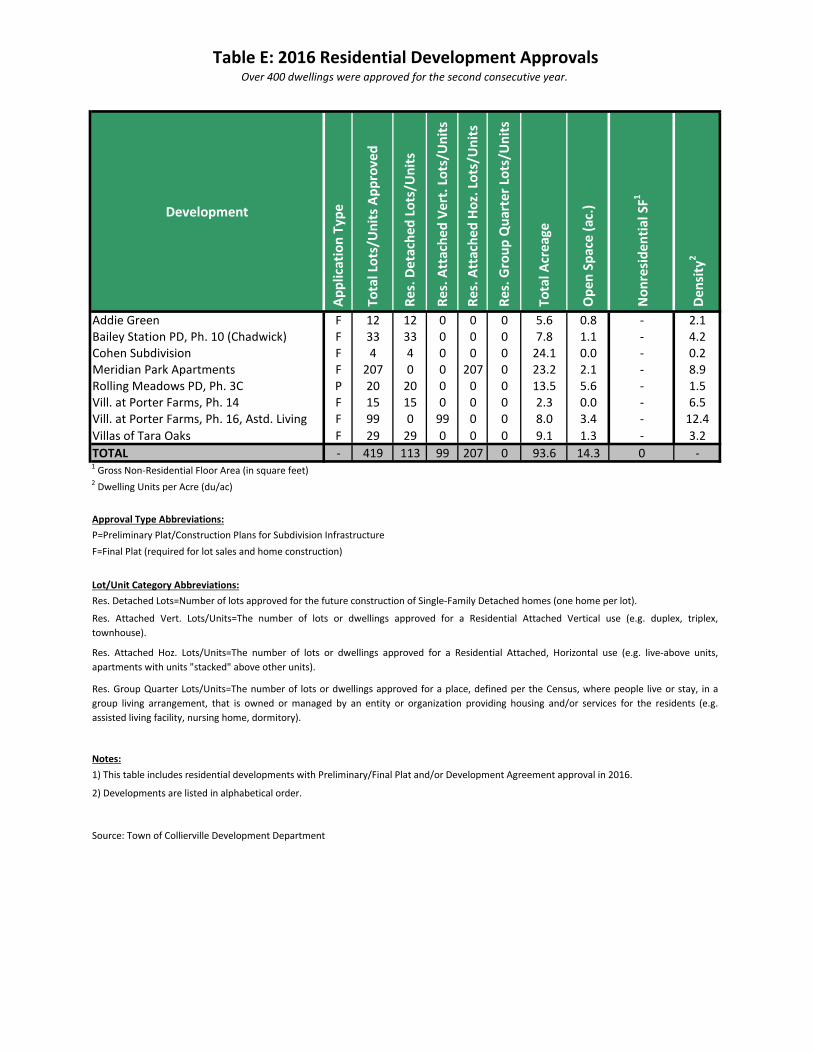
Table E: 2016 Residential Development ApprovalsOver 400 dwellings were approved for the second consecutive year.
Development
App
licat
ion
Type
Tot
al L
ots/
Uni
ts A
ppro
ved
Res
. Det
ache
d Lo
ts/U
nits
Res
. Att
ache
d Ve
rt. L
ots/
Uni
ts
Res
. Att
ache
d Ho
z. L
ots/
Uni
ts
Res
. Gro
up Q
uart
er L
ots/
Uni
ts
Tot
al A
crea
ge
Ope
n Sp
ace
(ac.
)
Non
resi
dent
ial S
F1
Den
sity
2
Addie Green F 12 12 0 0 0 5.6 0.8 - 2.1Bailey Station PD, Ph. 10 (Chadwick) F 33 33 0 0 0 7.8 1.1 - 4.2Cohen Subdivision F 4 4 0 0 0 24.1 0.0 - 0.2Meridian Park Apartments F 207 0 0 207 0 23.2 2.1 - 8.9Rolling Meadows PD, Ph. 3C P 20 20 0 0 0 13.5 5.6 - 1.5Vill. at Porter Farms, Ph. 14 F 15 15 0 0 0 2.3 0.0 - 6.5Vill. at Porter Farms, Ph. 16, Astd. Living F 99 0 99 0 0 8.0 3.4 - 12.4Villas of Tara Oaks F 29 29 0 0 0 9.1 1.3 - 3.2TOTAL - 419 113 99 207 0 93.6 14.3 0 -
Approval Type Abbreviations:
Lot/Unit Category Abbreviations:
Notes:
1 Gross Non-Residential Floor Area (in square feet)2 Dwelling Units per Acre (du/ac)
Res. Attached Hoz. Lots/Units=The number of lots or dwellings approved for a Residential Attached, Horizontal use (e.g. live-above units,apartments with units "stacked" above other units).
Res. Group Quarter Lots/Units=The number of lots or dwellings approved for a place, defined per the Census, where people live or stay, in agroup living arrangement, that is owned or managed by an entity or organization providing housing and/or services for the residents (e.g.assisted living facility, nursing home, dormitory).
P=Preliminary Plat/Construction Plans for Subdivision Infrastructure
Source: Town of Collierville Development Department
F=Final Plat (required for lot sales and home construction)
Res. Attached Vert. Lots/Units=The number of lots or dwellings approved for a Residential Attached Vertical use (e.g. duplex, triplex,townhouse).
Res. Detached Lots=Number of lots approved for the future construction of Single-Family Detached homes (one home per lot).
1) This table includes residential developments with Preliminary/Final Plat and/or Development Agreement approval in 2016.
2) Developments are listed in alphabetical order.
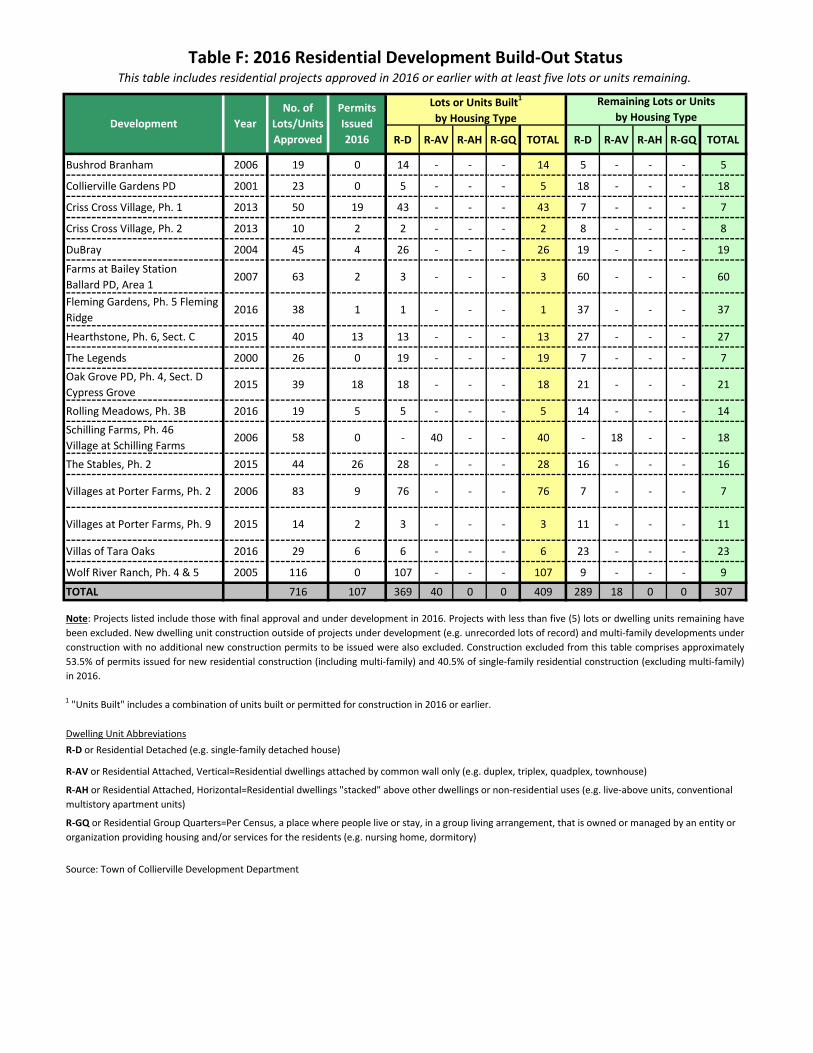
Table F: 2016 Residential Development Build-Out StatusThis table includes residential projects approved in 2016 or earlier with at least five lots or units remaining.
R-D R-AV R-AH R-GQ TOTAL R-D R-AV R-AH R-GQ TOTAL
Bushrod Branham 2006 19 0 14 - - - 14 5 - - - 5
Collierville Gardens PD 2001 23 0 5 - - - 5 18 - - - 18
Criss Cross Village, Ph. 1 2013 50 19 43 - - - 43 7 - - - 7
Criss Cross Village, Ph. 2 2013 10 2 2 - - - 2 8 - - - 8
DuBray 2004 45 4 26 - - - 26 19 - - - 19
Farms at Bailey Station Ballard PD, Area 1
2007 63 2 3 - - - 3 60 - - - 60
Fleming Gardens, Ph. 5 Fleming Ridge
2016 38 1 1 - - - 1 37 - - - 37
Hearthstone, Ph. 6, Sect. C 2015 40 13 13 - - - 13 27 - - - 27
The Legends 2000 26 0 19 - - - 19 7 - - - 7Oak Grove PD, Ph. 4, Sect. D Cypress Grove
2015 39 18 18 - - - 18 21 - - - 21
Rolling Meadows, Ph. 3B 2016 19 5 5 - - - 5 14 - - - 14Schilling Farms, Ph. 46 Village at Schilling Farms
2006 58 0 - 40 - - 40 - 18 - - 18
The Stables, Ph. 2 2015 44 26 28 - - - 28 16 - - - 16
Villages at Porter Farms, Ph. 2 2006 83 9 76 - - - 76 7 - - - 7
Villages at Porter Farms, Ph. 9 2015 14 2 3 - - - 3 11 - - - 11
Villas of Tara Oaks 2016 29 6 6 - - - 6 23 - - - 23
Wolf River Ranch, Ph. 4 & 5 2005 116 0 107 - - - 107 9 - - - 9
TOTAL 716 107 369 40 0 0 409 289 18 0 0 307
1 "Units Built" includes a combination of units built or permitted for construction in 2016 or earlier.
Dwelling Unit AbbreviationsR-D or Residential Detached (e.g. single-family detached house)
Source: Town of Collierville Development Department
Note: Projects listed include those with final approval and under development in 2016. Projects with less than five (5) lots or dwelling units remaining havebeen excluded. New dwelling unit construction outside of projects under development (e.g. unrecorded lots of record) and multi-family developments underconstruction with no additional new construction permits to be issued were also excluded. Construction excluded from this table comprises approximately53.5% of permits issued for new residential construction (including multi-family) and 40.5% of single-family residential construction (excluding multi-family)in 2016.
R-AH or Residential Attached, Horizontal=Residential dwellings "stacked" above other dwellings or non-residential uses (e.g. live-above units, conventional multistory apartment units)
R-GQ or Residential Group Quarters=Per Census, a place where people live or stay, in a group living arrangement, that is owned or managed by an entity or organization providing housing and/or services for the residents (e.g. nursing home, dormitory)
R-AV or Residential Attached, Vertical=Residential dwellings attached by common wall only (e.g. duplex, triplex, quadplex, townhouse)
Remaining Lots or Units by Housing Type
No. of Lots/Units Approved
Development YearPermits Issued 2016
Lots or Units Built1
by Housing Type
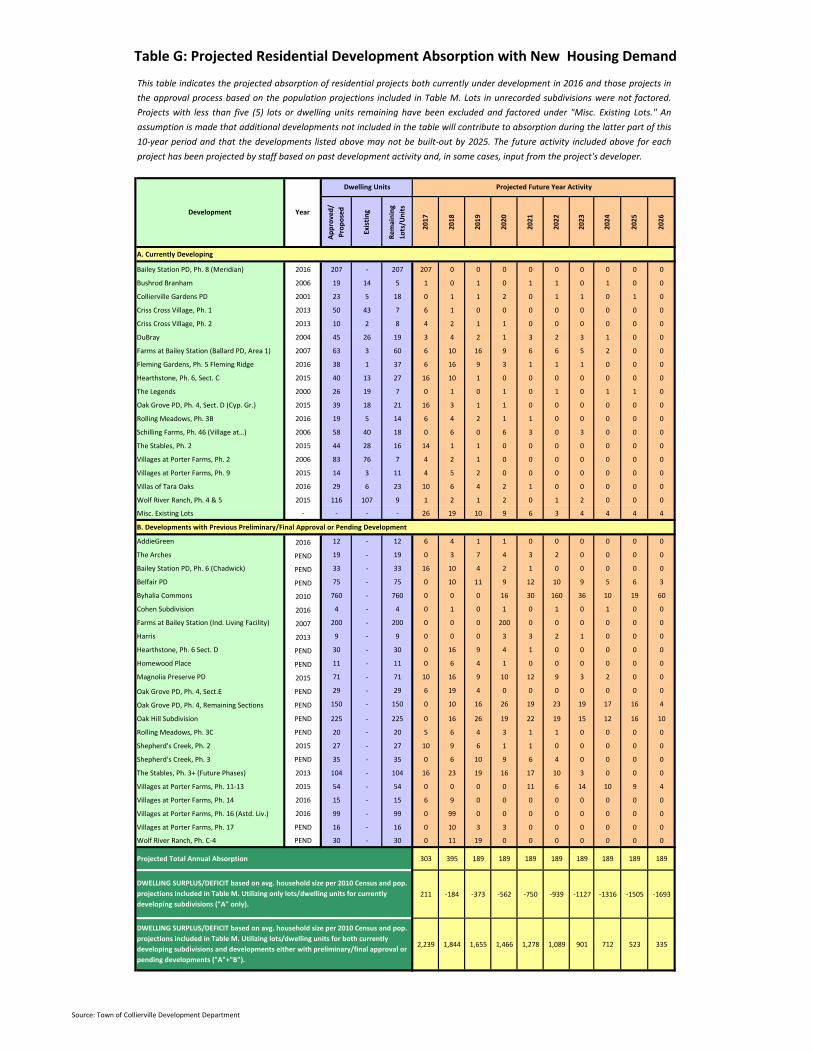
Table G: Projected Residential Development Absorption with New Housing Demand
Source: Town of Collierville Development Department
Appr
oved
/ Pr
opos
ed
Exis
ting
Rem
aini
ng
Lots
/Uni
ts
2017
2018
2019
2020
2021
2022
2023
2024
2025
2026
A. Currently Developing
Bailey Station PD, Ph. 8 (Meridian) 2016 207 - 207 207 0 0 0 0 0 0 0 0 0
Bushrod Branham 2006 19 14 5 1 0 1 0 1 1 0 1 0 0
Collierville Gardens PD 2001 23 5 18 0 1 1 2 0 1 1 0 1 0
Criss Cross Village, Ph. 1 2013 50 43 7 6 1 0 0 0 0 0 0 0 0
Criss Cross Village, Ph. 2 2013 10 2 8 4 2 1 1 0 0 0 0 0 0
DuBray 2004 45 26 19 3 4 2 1 3 2 3 1 0 0
Farms at Bailey Station (Ballard PD, Area 1) 2007 63 3 60 6 10 16 9 6 6 5 2 0 0
Fleming Gardens, Ph. 5 Fleming Ridge 2016 38 1 37 6 16 9 3 1 1 1 0 0 0
Hearthstone, Ph. 6, Sect. C 2015 40 13 27 16 10 1 0 0 0 0 0 0 0
The Legends 2000 26 19 7 0 1 0 1 0 1 0 1 1 0
Oak Grove PD, Ph. 4, Sect. D (Cyp. Gr.) 2015 39 18 21 16 3 1 1 0 0 0 0 0 0
Rolling Meadows, Ph. 3B 2016 19 5 14 6 4 2 1 1 0 0 0 0 0
Schilling Farms, Ph. 46 (Village at…) 2006 58 40 18 0 6 0 6 3 0 3 0 0 0
The Stables, Ph. 2 2015 44 28 16 14 1 1 0 0 0 0 0 0 0
Villages at Porter Farms, Ph. 2 2006 83 76 7 4 2 1 0 0 0 0 0 0 0
Villages at Porter Farms, Ph. 9 2015 14 3 11 4 5 2 0 0 0 0 0 0 0
Villas of Tara Oaks 2016 29 6 23 10 6 4 2 1 0 0 0 0 0
Wolf River Ranch, Ph. 4 & 5 2015 116 107 9 1 2 1 2 0 1 2 0 0 0
Misc. Existing Lots - - - - 26 19 10 9 6 3 4 4 4 4
B. Developments with Previous Preliminary/Final Approval or Pending Development
AddieGreen 2016 12 - 12 6 4 1 1 0 0 0 0 0 0
The Arches PEND 19 - 19 0 3 7 4 3 2 0 0 0 0
Bailey Station PD, Ph. 6 (Chadwick) PEND 33 - 33 16 10 4 2 1 0 0 0 0 0
Belfair PD PEND 75 - 75 0 10 11 9 12 10 9 5 6 3
Byhalia Commons 2010 760 - 760 0 0 0 16 30 160 36 10 19 60
Cohen Subdivision 2016 4 - 4 0 1 0 1 0 1 0 1 0 0
Farms at Bailey Station (Ind. Living Facility) 2007 200 - 200 0 0 0 200 0 0 0 0 0 0
Harris 2013 9 - 9 0 0 0 3 3 2 1 0 0 0
Hearthstone, Ph. 6 Sect. D PEND 30 - 30 0 16 9 4 1 0 0 0 0 0
Homewood Place PEND 11 - 11 0 6 4 1 0 0 0 0 0 0
Magnolia Preserve PD 2015 71 - 71 10 16 9 10 12 9 3 2 0 0
Oak Grove PD, Ph. 4, Sect.E PEND 29 - 29 6 19 4 0 0 0 0 0 0 0
Oak Grove PD, Ph. 4, Remaining Sections PEND 150 - 150 0 10 16 26 19 23 19 17 16 4
Oak Hill Subdivision PEND 225 - 225 0 16 26 19 22 19 15 12 16 10
Rolling Meadows, Ph. 3C PEND 20 - 20 5 6 4 3 1 1 0 0 0 0
Shepherd's Creek, Ph. 2 2015 27 - 27 10 9 6 1 1 0 0 0 0 0
Shepherd's Creek, Ph. 3 PEND 35 - 35 0 6 10 9 6 4 0 0 0 0
The Stables, Ph. 3+ (Future Phases) 2013 104 - 104 16 23 19 16 17 10 3 0 0 0
Villages at Porter Farms, Ph. 11-13 2015 54 - 54 0 0 0 0 11 6 14 10 9 4
Villages at Porter Farms, Ph. 14 2016 15 - 15 6 9 0 0 0 0 0 0 0 0
Villages at Porter Farms, Ph. 16 (Astd. Liv.) 2016 99 - 99 0 99 0 0 0 0 0 0 0 0
Villages at Porter Farms, Ph. 17 PEND 16 - 16 0 10 3 3 0 0 0 0 0 0
Wolf River Ranch, Ph. C-4 PEND 30 - 30 0 11 19 0 0 0 0 0 0 0
Projected Total Annual Absorption 303 395 189 189 189 189 189 189 189 189
211 -184 -373 -562 -750 -939 -1127 -1316 -1505 -1693
2,239 1,844 1,655 1,466 1,278 1,089 901 712 523 335
This table indicates the projected absorption of residential projects both currently under development in 2016 and those projects inthe approval process based on the population projections included in Table M. Lots in unrecorded subdivisions were not factored.Projects with less than five (5) lots or dwelling units remaining have been excluded and factored under "Misc. Existing Lots." Anassumption is made that additional developments not included in the table will contribute to absorption during the latter part of this10-year period and that the developments listed above may not be built-out by 2025. The future activity included above for eachproject has been projected by staff based on past development activity and, in some cases, input from the project's developer.
DWELLING SURPLUS/DEFICIT based on avg. household size per 2010 Census and pop. projections included in Table M. Utilizing lots/dwelling units for both currently developing subdivisions and developments either with preliminary/final approval or pending developments ("A"+"B").
Development Year
Dwelling Units Projected Future Year Activity
DWELLING SURPLUS/DEFICIT based on avg. household size per 2010 Census and pop. projections included in Table M. Utilizing only lots/dwelling units for currently developing subdivisions ("A" only).
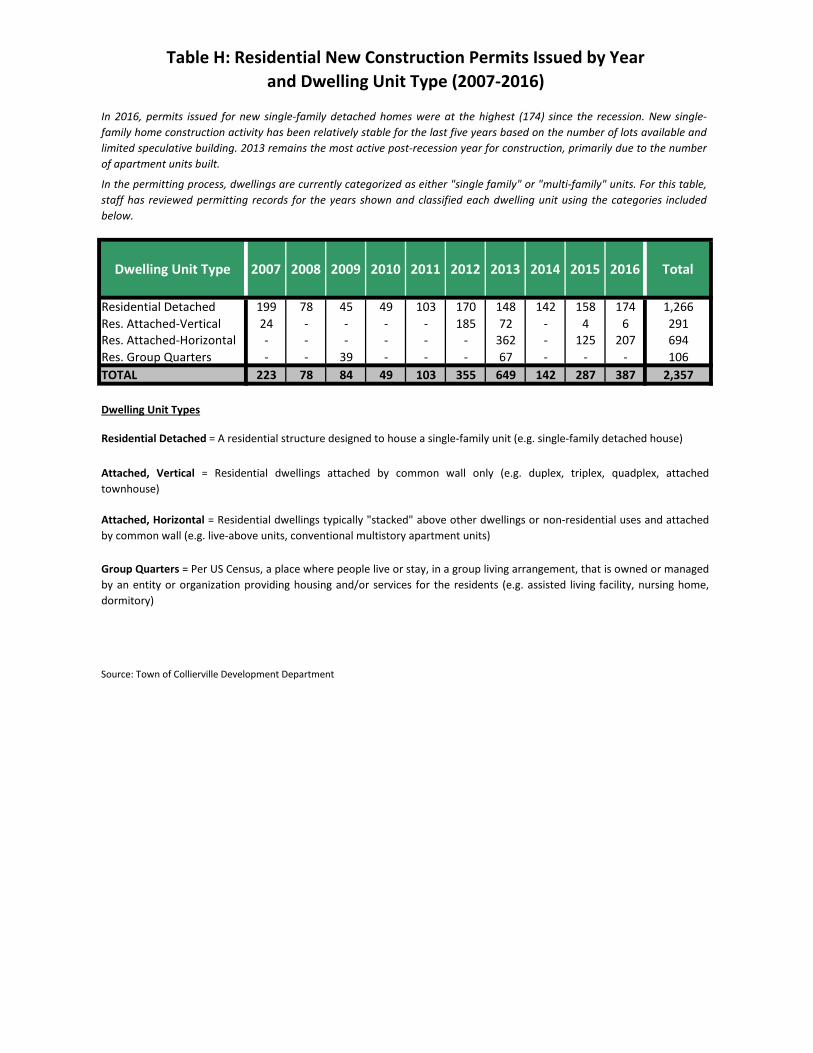
Table H: Residential New Construction Permits Issued by Year and Dwelling Unit Type (2007-2016)
Dwelling Unit Type 2007 2008 2009 2010 2011 2012 2013 2014 2015 2016 Total
Residential Detached 199 78 45 49 103 170 148 142 158 174 1,266Res. Attached-Vertical 24 - - - - 185 72 - 4 6 291Res. Attached-Horizontal - - - - - - 362 - 125 207 694Res. Group Quarters - - 39 - - - 67 - - - 106TOTAL 223 78 84 49 103 355 649 142 287 387 2,357
Dwelling Unit Types
Source: Town of Collierville Development Department
Residential Detached = A residential structure designed to house a single-family unit (e.g. single-family detached house)
Attached, Vertical = Residential dwellings attached by common wall only (e.g. duplex, triplex, quadplex, attachedtownhouse)
Attached, Horizontal = Residential dwellings typically "stacked" above other dwellings or non-residential uses and attachedby common wall (e.g. live-above units, conventional multistory apartment units)
Group Quarters = Per US Census, a place where people live or stay, in a group living arrangement, that is owned or managedby an entity or organization providing housing and/or services for the residents (e.g. assisted living facility, nursing home,dormitory)
In 2016, permits issued for new single-family detached homes were at the highest (174) since the recession. New single-family home construction activity has been relatively stable for the last five years based on the number of lots available andlimited speculative building. 2013 remains the most active post-recession year for construction, primarily due to the numberof apartment units built.
In the permitting process, dwellings are currently categorized as either "single family" or "multi-family" units. For this table,staff has reviewed permitting records for the years shown and classified each dwelling unit using the categories includedbelow.
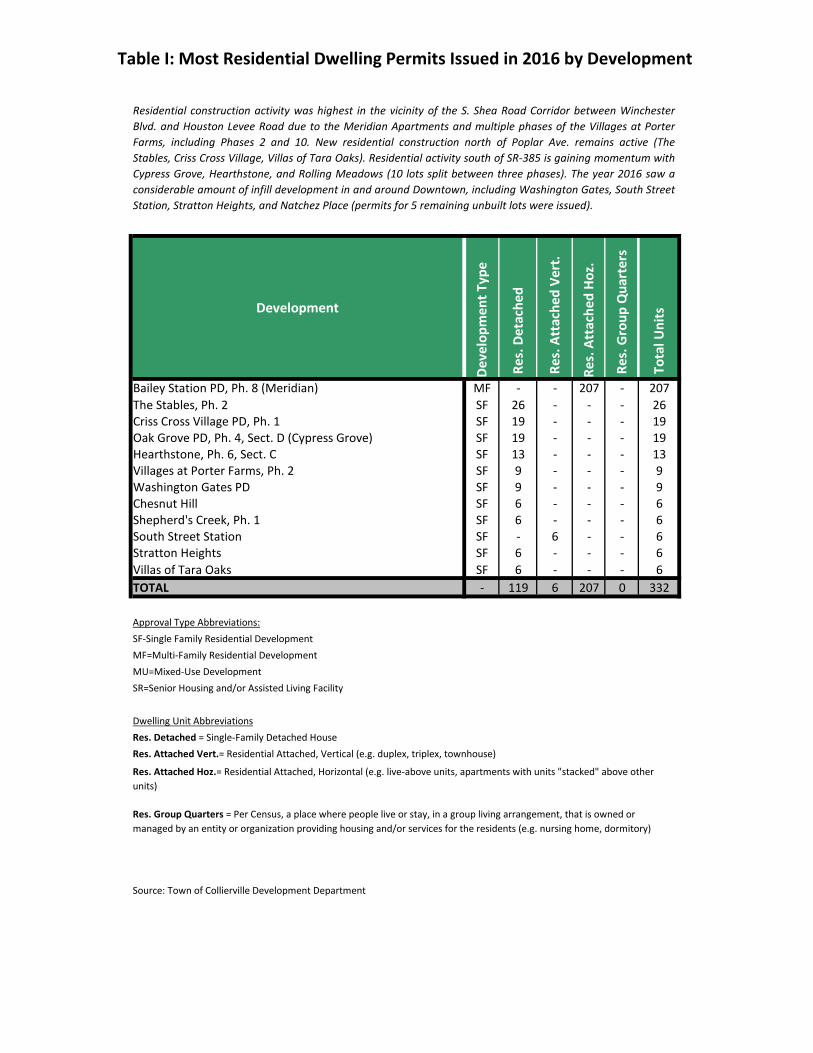
Table I: Most Residential Dwelling Permits Issued in 2016 by Development
Development
Deve
lopm
ent T
ype
Res
. Det
ache
d
Res
. Att
ache
d Ve
rt.
Res.
Att
ache
d Ho
z.
Res
. Gro
up Q
uart
ers
Tot
al U
nits
Bailey Station PD, Ph. 8 (Meridian) MF - - 207 - 207The Stables, Ph. 2 SF 26 - - - 26Criss Cross Village PD, Ph. 1 SF 19 - - - 19Oak Grove PD, Ph. 4, Sect. D (Cypress Grove) SF 19 - - - 19Hearthstone, Ph. 6, Sect. C SF 13 - - - 13Villages at Porter Farms, Ph. 2 SF 9 - - - 9Washington Gates PD SF 9 - - - 9Chesnut Hill SF 6 - - - 6Shepherd's Creek, Ph. 1 SF 6 - - - 6South Street Station SF - 6 - - 6Stratton Heights SF 6 - - - 6Villas of Tara Oaks SF 6 - - - 6TOTAL - 119 6 207 0 332
Approval Type Abbreviations:SF-Single Family Residential Development MF=Multi-Family Residential DevelopmentMU=Mixed-Use DevelopmentSR=Senior Housing and/or Assisted Living Facility
Dwelling Unit AbbreviationsRes. Detached = Single-Family Detached House Res. Attached Vert.= Residential Attached, Vertical (e.g. duplex, triplex, townhouse)
Res. Attached Hoz.= Residential Attached, Horizontal (e.g. live-above units, apartments with units "stacked" above other units)
Res. Group Quarters = Per Census, a place where people live or stay, in a group living arrangement, that is owned or managed by an entity or organization providing housing and/or services for the residents (e.g. nursing home, dormitory)
Source: Town of Collierville Development Department
Residential construction activity was highest in the vicinity of the S. Shea Road Corridor between WinchesterBlvd. and Houston Levee Road due to the Meridian Apartments and multiple phases of the Villages at PorterFarms, including Phases 2 and 10. New residential construction north of Poplar Ave. remains active (TheStables, Criss Cross Village, Villas of Tara Oaks). Residential activity south of SR-385 is gaining momentum withCypress Grove, Hearthstone, and Rolling Meadows (10 lots split between three phases). The year 2016 saw aconsiderable amount of infill development in and around Downtown, including Washington Gates, South StreetStation, Stratton Heights, and Natchez Place (permits for 5 remaining unbuilt lots were issued).
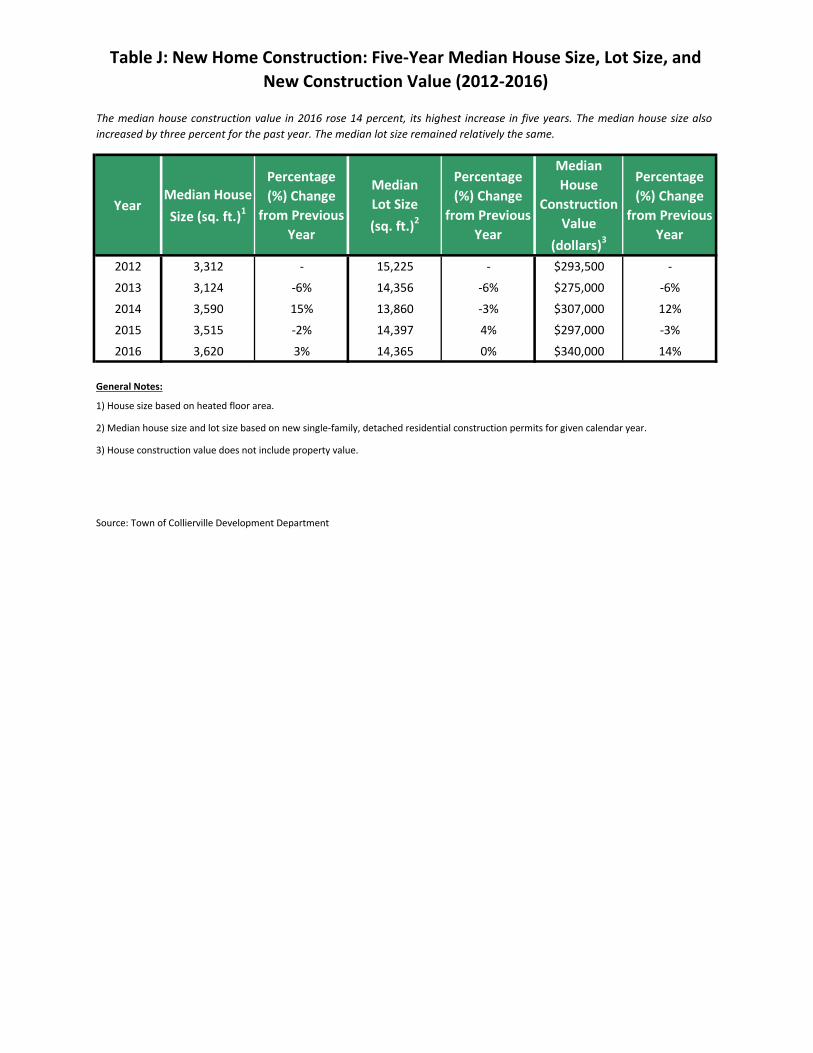
Table J: New Home Construction: Five-Year Median House Size, Lot Size, and New Construction Value (2012-2016)
YearMedian House Size (sq. ft.)1
Percentage (%) Change
from Previous Year
Median Lot Size (sq. ft.)2
Percentage (%) Change
from Previous Year
Median House
Construction Value
(dollars)3
Percentage (%) Change
from Previous Year
2012 3,312 - 15,225 - $293,500 -
2013 3,124 -6% 14,356 -6% $275,000 -6%
2014 3,590 15% 13,860 -3% $307,000 12%
2015 3,515 -2% 14,397 4% $297,000 -3%
2016 3,620 3% 14,365 0% $340,000 14%
General Notes:
1) House size based on heated floor area.
2) Median house size and lot size based on new single-family, detached residential construction permits for given calendar year.
3) House construction value does not include property value.
Source: Town of Collierville Development Department
The median house construction value in 2016 rose 14 percent, its highest increase in five years. The median house size alsoincreased by three percent for the past year. The median lot size remained relatively the same.
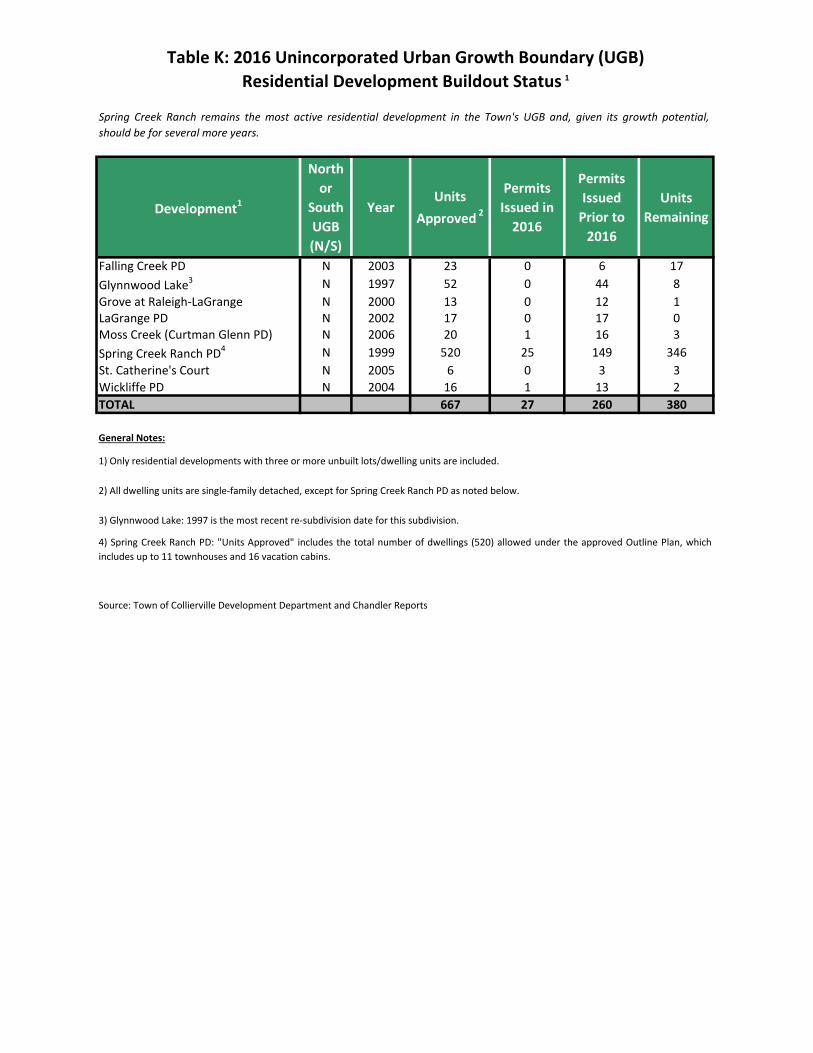
Table K: 2016 Unincorporated Urban Growth Boundary (UGB) Residential Development Buildout Status 1
Development1
North or
South UGB (N/S)
YearUnits
Approved 2
Permits Issued in
2016
Permits Issued
Prior to 2016
Units Remaining
Falling Creek PD N 2003 23 0 6 17Glynnwood Lake3 N 1997 52 0 44 8Grove at Raleigh-LaGrange N 2000 13 0 12 1LaGrange PD N 2002 17 0 17 0Moss Creek (Curtman Glenn PD) N 2006 20 1 16 3Spring Creek Ranch PD4 N 1999 520 25 149 346St. Catherine's Court N 2005 6 0 3 3Wickliffe PD N 2004 16 1 13 2TOTAL 667 27 260 380
General Notes:
1) Only residential developments with three or more unbuilt lots/dwelling units are included.
2) All dwelling units are single-family detached, except for Spring Creek Ranch PD as noted below.
3) Glynnwood Lake: 1997 is the most recent re-subdivision date for this subdivision.
Source: Town of Collierville Development Department and Chandler Reports
4) Spring Creek Ranch PD: "Units Approved" includes the total number of dwellings (520) allowed under the approved Outline Plan, whichincludes up to 11 townhouses and 16 vacation cabins.
Spring Creek Ranch remains the most active residential development in the Town's UGB and, given its growth potential,should be for several more years.
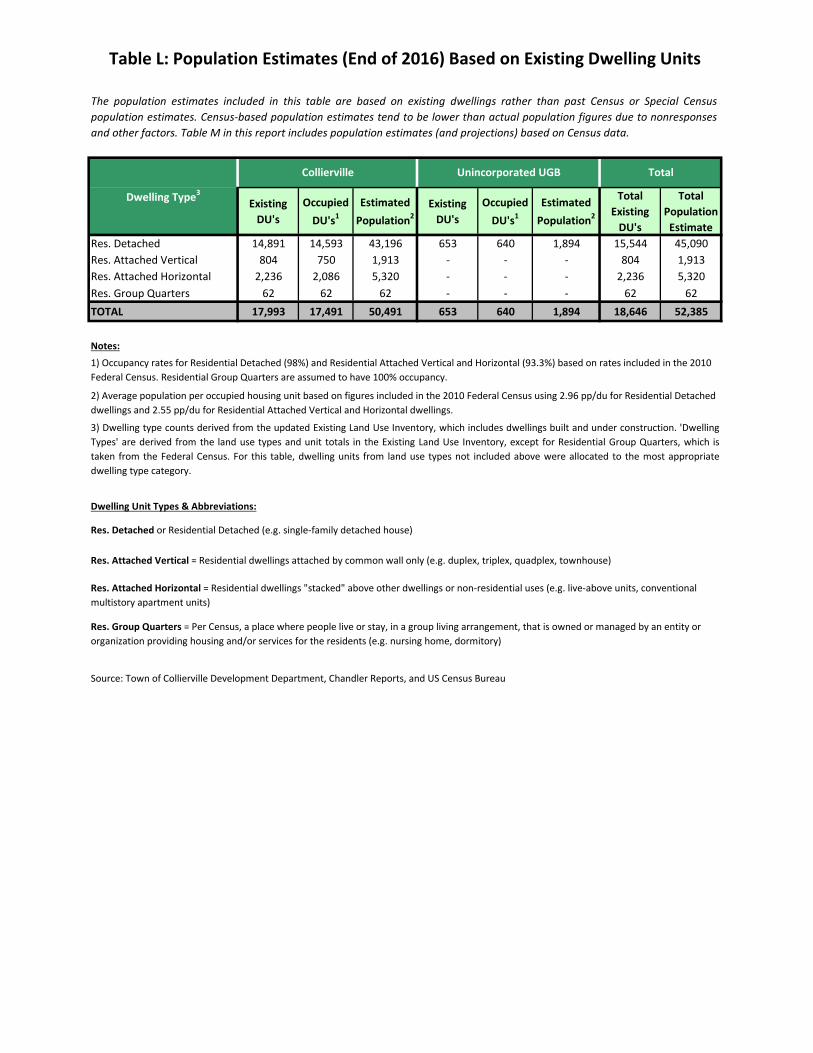
Table L: Population Estimates (End of 2016) Based on Existing Dwelling Units
Existing DU's
Occupied DU's1
Estimated Population2
Existing DU's
Occupied DU's1
Estimated Population2
Total Existing
DU's
Total Population Estimate
Res. Detached 14,891 14,593 43,196 653 640 1,894 15,544 45,090Res. Attached Vertical 804 750 1,913 - - - 804 1,913Res. Attached Horizontal 2,236 2,086 5,320 - - - 2,236 5,320Res. Group Quarters 62 62 62 - - - 62 62TOTAL 17,993 17,491 50,491 653 640 1,894 18,646 52,385
Notes:
Dwelling Unit Types & Abbreviations:
Res. Detached or Residential Detached (e.g. single-family detached house)
Source: Town of Collierville Development Department, Chandler Reports, and US Census Bureau
Res. Attached Horizontal = Residential dwellings "stacked" above other dwellings or non-residential uses (e.g. live-above units, conventional multistory apartment units)
Res. Group Quarters = Per Census, a place where people live or stay, in a group living arrangement, that is owned or managed by an entity or organization providing housing and/or services for the residents (e.g. nursing home, dormitory)
Dwelling Type3
Unincorporated UGB
Res. Attached Vertical = Residential dwellings attached by common wall only (e.g. duplex, triplex, quadplex, townhouse)
Collierville
The population estimates included in this table are based on existing dwellings rather than past Census or Special Censuspopulation estimates. Census-based population estimates tend to be lower than actual population figures due to nonresponsesand other factors. Table M in this report includes population estimates (and projections) based on Census data.
1) Occupancy rates for Residential Detached (98%) and Residential Attached Vertical and Horizontal (93.3%) based on rates included in the 2010 Federal Census. Residential Group Quarters are assumed to have 100% occupancy.
2) Average population per occupied housing unit based on figures included in the 2010 Federal Census using 2.96 pp/du for Residential Detached dwellings and 2.55 pp/du for Residential Attached Vertical and Horizontal dwellings.
3) Dwelling type counts derived from the updated Existing Land Use Inventory, which includes dwellings built and under construction. 'DwellingTypes' are derived from the land use types and unit totals in the Existing Land Use Inventory, except for Residential Group Quarters, which istaken from the Federal Census. For this table, dwelling units from land use types not included above were allocated to the most appropriatedwelling type category.
Total
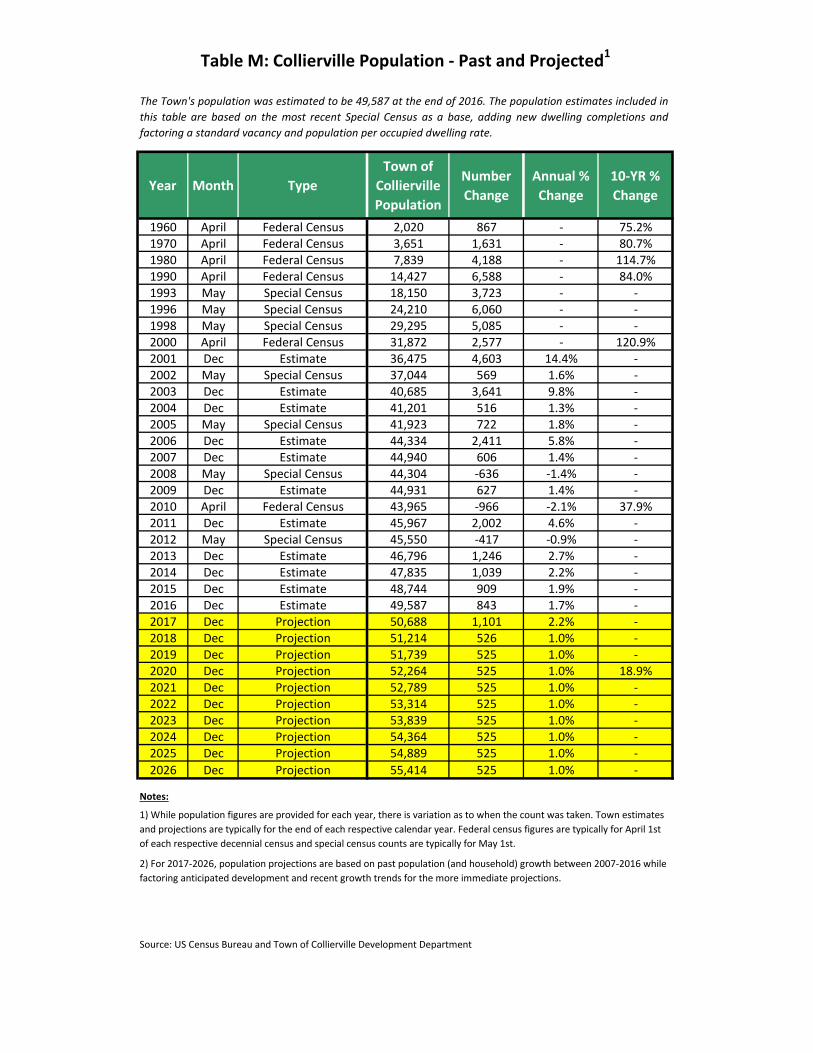
Table M: Collierville Population - Past and Projected1
Year Month TypeTown of
Collierville Population
Number Change
Annual % Change
10-YR % Change
1960 April Federal Census 2,020 867 - 75.2%1970 April Federal Census 3,651 1,631 - 80.7%1980 April Federal Census 7,839 4,188 - 114.7%1990 April Federal Census 14,427 6,588 - 84.0%1993 May Special Census 18,150 3,723 - -1996 May Special Census 24,210 6,060 - -1998 May Special Census 29,295 5,085 - -2000 April Federal Census 31,872 2,577 - 120.9%2001 Dec Estimate 36,475 4,603 14.4% -2002 May Special Census 37,044 569 1.6% -2003 Dec Estimate 40,685 3,641 9.8% -2004 Dec Estimate 41,201 516 1.3% -2005 May Special Census 41,923 722 1.8% -2006 Dec Estimate 44,334 2,411 5.8% -2007 Dec Estimate 44,940 606 1.4% -2008 May Special Census 44,304 -636 -1.4% -2009 Dec Estimate 44,931 627 1.4% -2010 April Federal Census 43,965 -966 -2.1% 37.9%2011 Dec Estimate 45,967 2,002 4.6% -2012 May Special Census 45,550 -417 -0.9% -2013 Dec Estimate 46,796 1,246 2.7% -2014 Dec Estimate 47,835 1,039 2.2% -2015 Dec Estimate 48,744 909 1.9% -2016 Dec Estimate 49,587 843 1.7% -2017 Dec Projection 50,688 1,101 2.2% -2018 Dec Projection 51,214 526 1.0% -2019 Dec Projection 51,739 525 1.0% -2020 Dec Projection 52,264 525 1.0% 18.9%2021 Dec Projection 52,789 525 1.0% -2022 Dec Projection 53,314 525 1.0% -2023 Dec Projection 53,839 525 1.0% -2024 Dec Projection 54,364 525 1.0% -2025 Dec Projection 54,889 525 1.0% -2026 Dec Projection 55,414 525 1.0% -
Notes:
Source: US Census Bureau and Town of Collierville Development Department
1) While population figures are provided for each year, there is variation as to when the count was taken. Town estimates and projections are typically for the end of each respective calendar year. Federal census figures are typically for April 1st of each respective decennial census and special census counts are typically for May 1st.
2) For 2017-2026, population projections are based on past population (and household) growth between 2007-2016 while factoring anticipated development and recent growth trends for the more immediate projections.
The Town's population was estimated to be 49,587 at the end of 2016. The population estimates included inthis table are based on the most recent Special Census as a base, adding new dwelling completions andfactoring a standard vacancy and population per occupied dwelling rate.
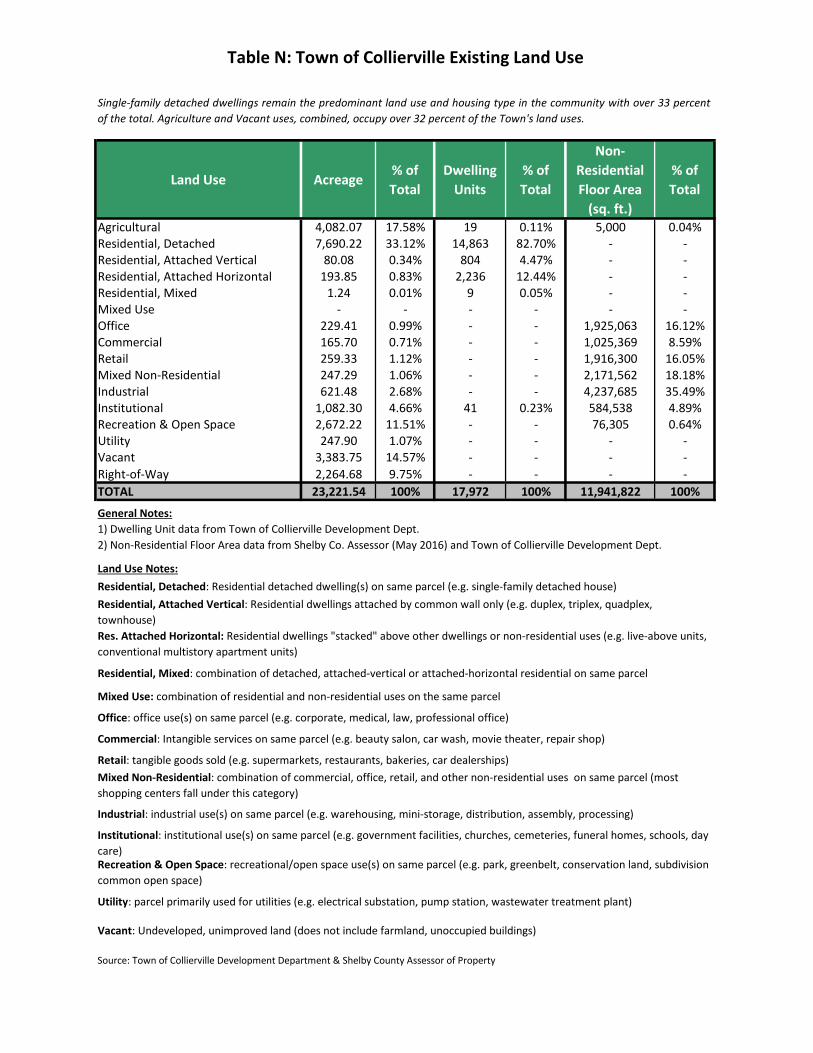
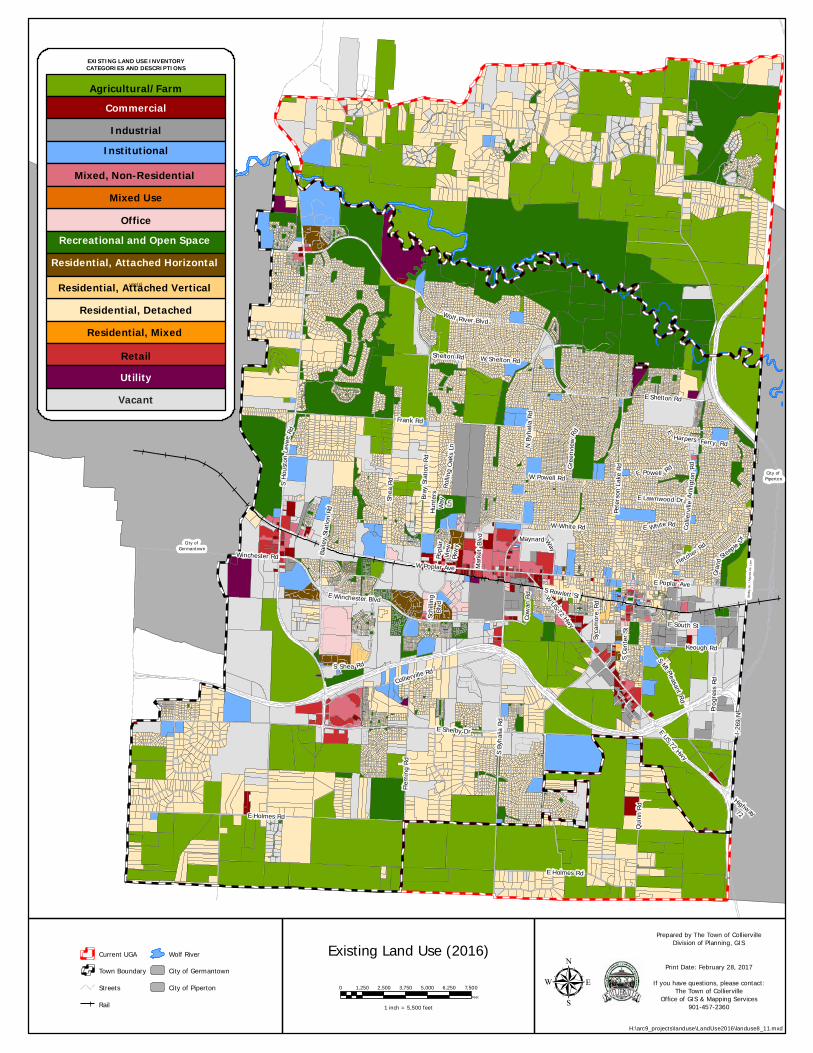
Table N: Town of Collierville Existing Land Use
Land Use Acreage% of Total
Dwelling Units
% of Total
Non-Residential Floor Area
(sq. ft.)
% of Total
Agricultural 4,082.07 17.58% 19 0.11% 5,000 0.04%Residential, Detached 7,690.22 33.12% 14,863 82.70% - -Residential, Attached Vertical 80.08 0.34% 804 4.47% - -Residential, Attached Horizontal 193.85 0.83% 2,236 12.44% - -Residential, Mixed 1.24 0.01% 9 0.05% - -Mixed Use - - - - - -Office 229.41 0.99% - - 1,925,063 16.12%Commercial 165.70 0.71% - - 1,025,369 8.59%Retail 259.33 1.12% - - 1,916,300 16.05%Mixed Non-Residential 247.29 1.06% - - 2,171,562 18.18%Industrial 621.48 2.68% - - 4,237,685 35.49%Institutional 1,082.30 4.66% 41 0.23% 584,538 4.89%Recreation & Open Space 2,672.22 11.51% - - 76,305 0.64%Utility 247.90 1.07% - - - -Vacant 3,383.75 14.57% - - - -Right-of-Way 2,264.68 9.75% - - - -TOTAL 23,221.54 100% 17,972 100% 11,941,822 100%
General Notes:
Source: Town of Collierville Development Department & Shelby County Assessor of Property
Commercial: Intangible services on same parcel (e.g. beauty salon, car wash, movie theater, repair shop)
Retail: tangible goods sold (e.g. supermarkets, restaurants, bakeries, car dealerships)
Utility: parcel primarily used for utilities (e.g. electrical substation, pump station, wastewater treatment plant)
Vacant: Undeveloped, unimproved land (does not include farmland, unoccupied buildings)
Mixed Non-Residential: combination of commercial, office, retail, and other non-residential uses on same parcel (most shopping centers fall under this category)
Industrial: industrial use(s) on same parcel (e.g. warehousing, mini-storage, distribution, assembly, processing)
Institutional: institutional use(s) on same parcel (e.g. government facilities, churches, cemeteries, funeral homes, schools, day care)Recreation & Open Space: recreational/open space use(s) on same parcel (e.g. park, greenbelt, conservation land, subdivision common open space)
Single-family detached dwellings remain the predominant land use and housing type in the community with over 33 percentof the total. Agriculture and Vacant uses, combined, occupy over 32 percent of the Town's land uses.
2) Non-Residential Floor Area data from Shelby Co. Assessor (May 2016) and Town of Collierville Development Dept.
Mixed Use: combination of residential and non-residential uses on the same parcel
Office: office use(s) on same parcel (e.g. corporate, medical, law, professional office)
Res. Attached Horizontal: Residential dwellings "stacked" above other dwellings or non-residential uses (e.g. live-above units, conventional multistory apartment units)
Residential, Mixed: combination of detached, attached-vertical or attached-horizontal residential on same parcel
Residential, Detached: Residential detached dwelling(s) on same parcel (e.g. single-family detached house) Land Use Notes:
Residential, Attached Vertical: Residential dwellings attached by common wall only (e.g. duplex, triplex, quadplex, townhouse)
1) Dwelling Unit data from Town of Collierville Development Dept.
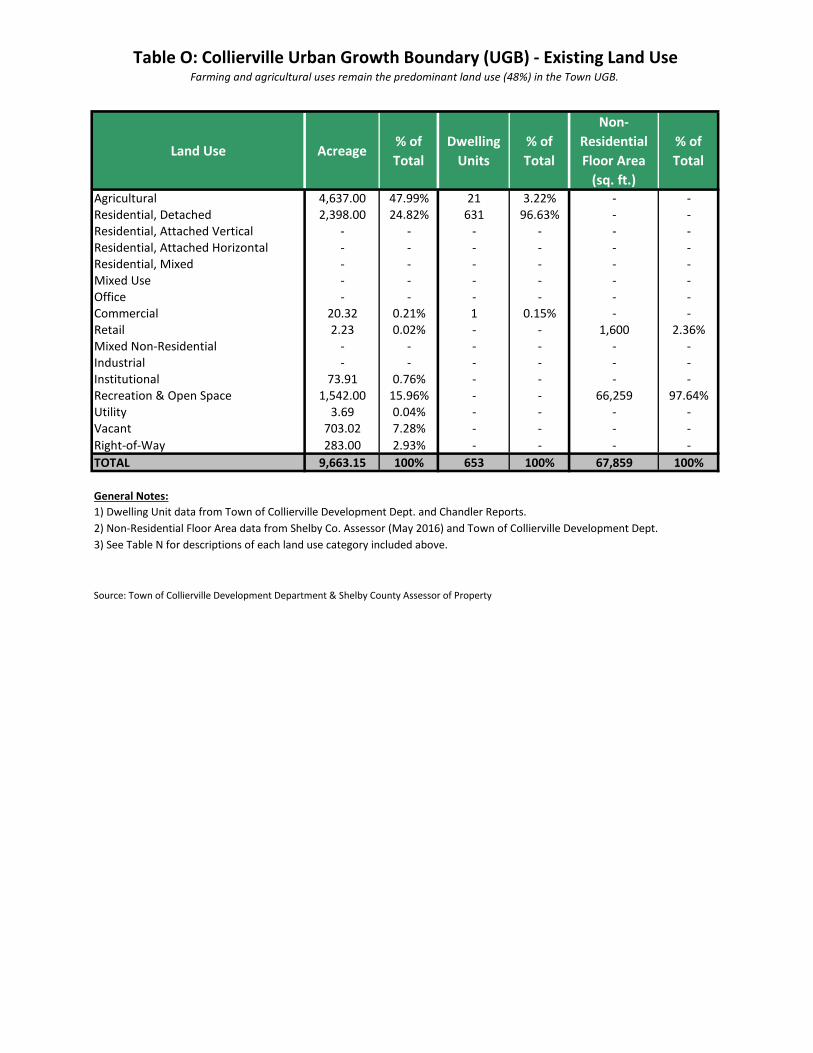
Table O: Collierville Urban Growth Boundary (UGB) - Existing Land UseFarming and agricultural uses remain the predominant land use (48%) in the Town UGB.
Land Use Acreage% of Total
Dwelling Units
% of Total
Non-Residential Floor Area
(sq. ft.)
% of Total
Agricultural 4,637.00 47.99% 21 3.22% - -Residential, Detached 2,398.00 24.82% 631 96.63% - -Residential, Attached Vertical - - - - - -Residential, Attached Horizontal - - - - - -Residential, Mixed - - - - - -Mixed Use - - - - - -Office - - - - - -Commercial 20.32 0.21% 1 0.15% - -Retail 2.23 0.02% - - 1,600 2.36%Mixed Non-Residential - - - - - -Industrial - - - - - -Institutional 73.91 0.76% - - - -Recreation & Open Space 1,542.00 15.96% - - 66,259 97.64%Utility 3.69 0.04% - - - -Vacant 703.02 7.28% - - - -Right-of-Way 283.00 2.93% - - - -TOTAL 9,663.15 100% 653 100% 67,859 100%
General Notes:
Source: Town of Collierville Development Department & Shelby County Assessor of Property
1) Dwelling Unit data from Town of Collierville Development Dept. and Chandler Reports.
3) See Table N for descriptions of each land use category included above.2) Non-Residential Floor Area data from Shelby Co. Assessor (May 2016) and Town of Collierville Development Dept.
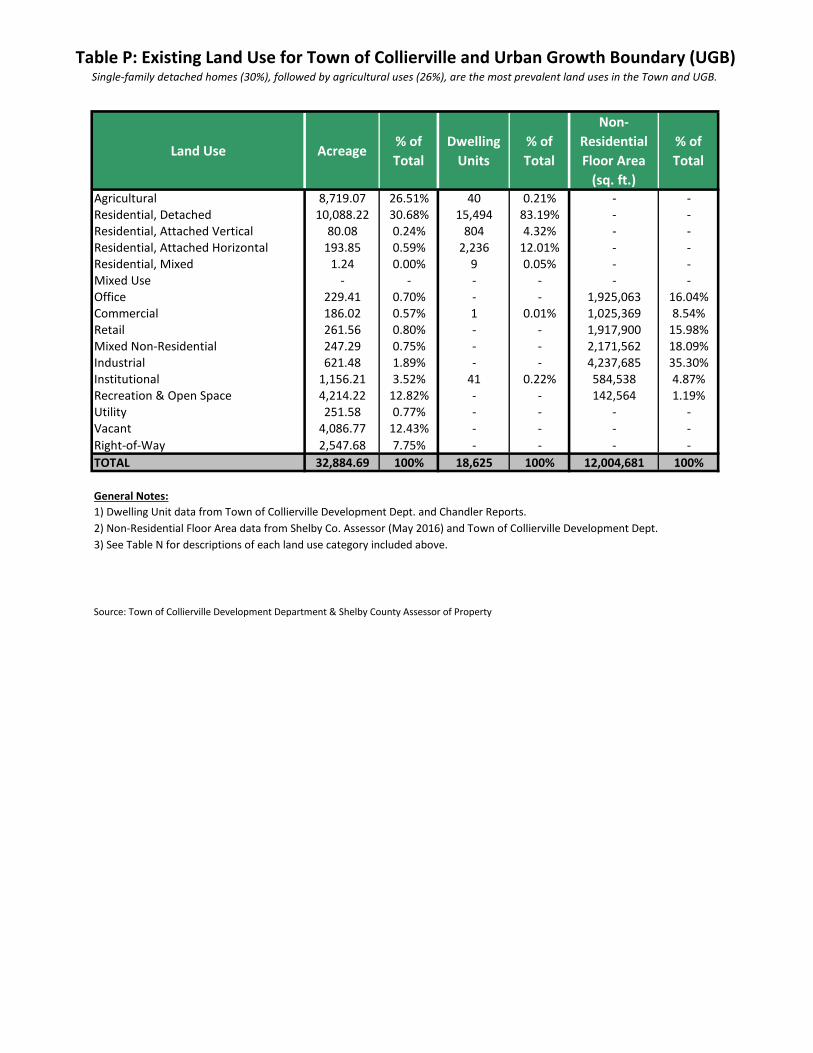
Table P: Existing Land Use for Town of Collierville and Urban Growth Boundary (UGB)Single-family detached homes (30%), followed by agricultural uses (26%), are the most prevalent land uses in the Town and UGB.
Land Use Acreage% of Total
Dwelling Units
% of Total
Non-Residential Floor Area
(sq. ft.)
% of Total
Agricultural 8,719.07 26.51% 40 0.21% - -Residential, Detached 10,088.22 30.68% 15,494 83.19% - -Residential, Attached Vertical 80.08 0.24% 804 4.32% - -Residential, Attached Horizontal 193.85 0.59% 2,236 12.01% - -Residential, Mixed 1.24 0.00% 9 0.05% - -Mixed Use - - - - - -Office 229.41 0.70% - - 1,925,063 16.04%Commercial 186.02 0.57% 1 0.01% 1,025,369 8.54%Retail 261.56 0.80% - - 1,917,900 15.98%Mixed Non-Residential 247.29 0.75% - - 2,171,562 18.09%Industrial 621.48 1.89% - - 4,237,685 35.30%Institutional 1,156.21 3.52% 41 0.22% 584,538 4.87%Recreation & Open Space 4,214.22 12.82% - - 142,564 1.19%Utility 251.58 0.77% - - - -Vacant 4,086.77 12.43% - - - -Right-of-Way 2,547.68 7.75% - - - -TOTAL 32,884.69 100% 18,625 100% 12,004,681 100%
General Notes:
Source: Town of Collierville Development Department & Shelby County Assessor of Property
1) Dwelling Unit data from Town of Collierville Development Dept. and Chandler Reports.
3) See Table N for descriptions of each land use category included above.2) Non-Residential Floor Area data from Shelby Co. Assessor (May 2016) and Town of Collierville Development Dept.
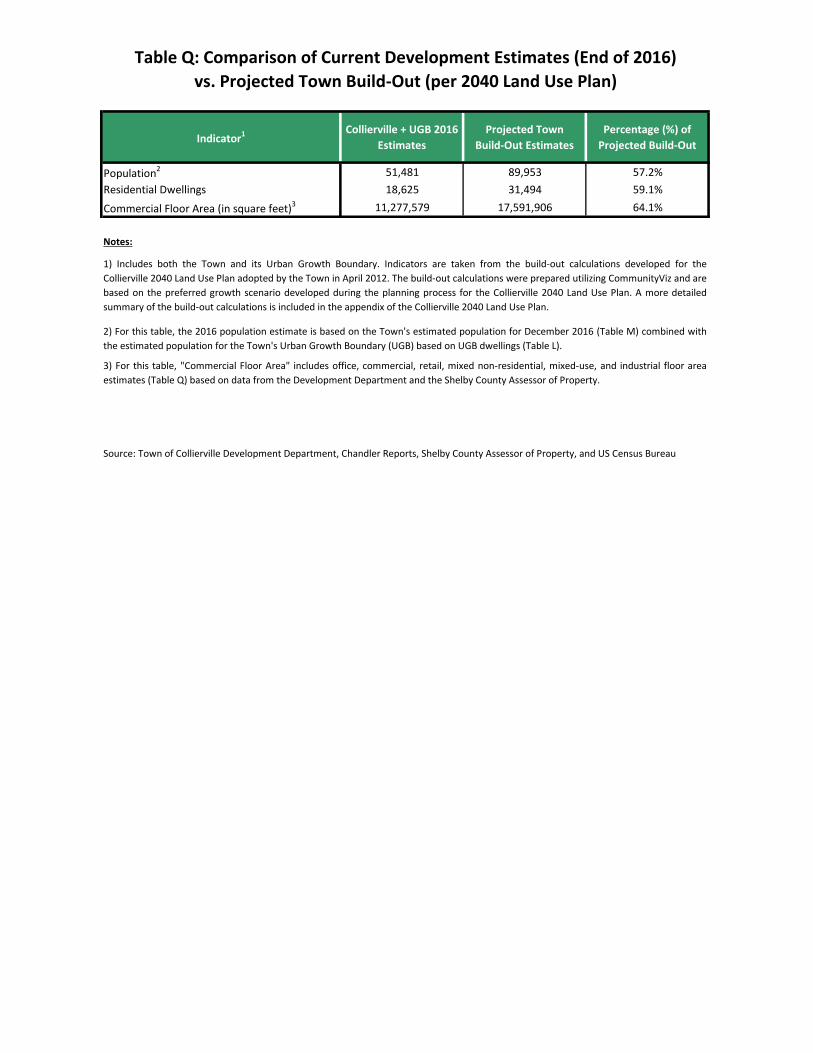
Table Q: Comparison of Current Development Estimates (End of 2016) vs. Projected Town Build-Out (per 2040 Land Use Plan)
Indicator1 Collierville + UGB 2016 Estimates
Projected Town Build-Out Estimates
Percentage (%) of Projected Build-Out
Population2 51,481 89,953 57.2%Residential Dwellings 18,625 31,494 59.1%
Commercial Floor Area (in square feet)3 11,277,579 17,591,906 64.1%
Notes:
1) Includes both the Town and its Urban Growth Boundary. Indicators are taken from the build-out calculations developed for theCollierville 2040 Land Use Plan adopted by the Town in April 2012. The build-out calculations were prepared utilizing CommunityViz and arebased on the preferred growth scenario developed during the planning process for the Collierville 2040 Land Use Plan. A more detailedsummary of the build-out calculations is included in the appendix of the Collierville 2040 Land Use Plan.
2) For this table, the 2016 population estimate is based on the Town's estimated population for December 2016 (Table M) combined withthe estimated population for the Town's Urban Growth Boundary (UGB) based on UGB dwellings (Table L).
3) For this table, "Commercial Floor Area" includes office, commercial, retail, mixed non-residential, mixed-use, and industrial floor areaestimates (Table Q) based on data from the Development Department and the Shelby County Assessor of Property.
Source: Town of Collierville Development Department, Chandler Reports, Shelby County Assessor of Property, and US Census Bureau
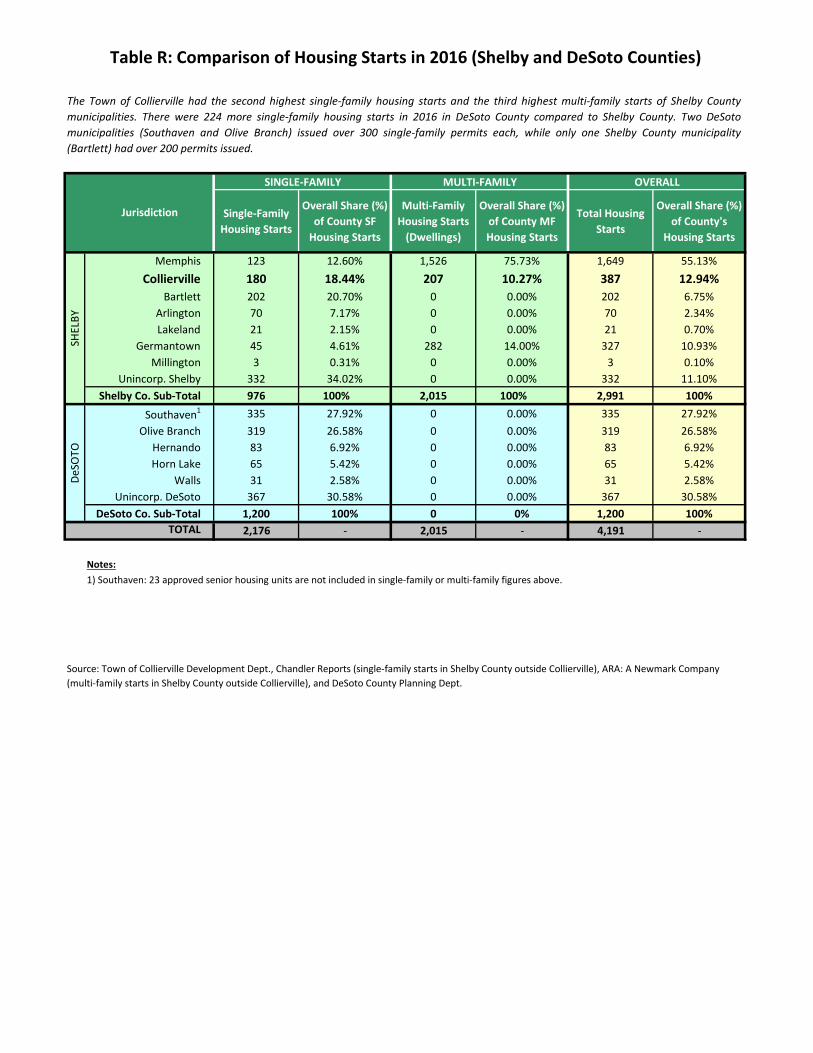
Table R: Comparison of Housing Starts in 2016 (Shelby and DeSoto Counties)
Single-Family Housing Starts
Overall Share (%) of County SF
Housing Starts
Multi-Family Housing Starts
(Dwellings)
Overall Share (%) of County MF Housing Starts
Total Housing Starts
Overall Share (%) of County's
Housing Starts
Memphis 123 12.60% 1,526 75.73% 1,649 55.13%Collierville 180 18.44% 207 10.27% 387 12.94%
Bartlett 202 20.70% 0 0.00% 202 6.75%Arlington 70 7.17% 0 0.00% 70 2.34%Lakeland 21 2.15% 0 0.00% 21 0.70%
Germantown 45 4.61% 282 14.00% 327 10.93%Millington 3 0.31% 0 0.00% 3 0.10%
Unincorp. Shelby 332 34.02% 0 0.00% 332 11.10%Shelby Co. Sub-Total 976 100% 2,015 100% 2,991 100%
Southaven1 335 27.92% 0 0.00% 335 27.92%Olive Branch 319 26.58% 0 0.00% 319 26.58%
Hernando 83 6.92% 0 0.00% 83 6.92%Horn Lake 65 5.42% 0 0.00% 65 5.42%
Walls 31 2.58% 0 0.00% 31 2.58%Unincorp. DeSoto 367 30.58% 0 0.00% 367 30.58%
DeSoto Co. Sub-Total 1,200 100% 0 0% 1,200 100%TOTAL 2,176 - 2,015 - 4,191 -
Notes:
The Town of Collierville had the second highest single-family housing starts and the third highest multi-family starts of Shelby Countymunicipalities. There were 224 more single-family housing starts in 2016 in DeSoto County compared to Shelby County. Two DeSotomunicipalities (Southaven and Olive Branch) issued over 300 single-family permits each, while only one Shelby County municipality(Bartlett) had over 200 permits issued.
OVERALL
Jurisdiction
Source: Town of Collierville Development Dept., Chandler Reports (single-family starts in Shelby County outside Collierville), ARA: A Newmark Company (multi-family starts in Shelby County outside Collierville), and DeSoto County Planning Dept.
DeSO
TOSH
ELBY
SINGLE-FAMILY MULTI-FAMILY
1) Southaven: 23 approved senior housing units are not included in single-family or multi-family figures above.
Schil
ling
Blvd
S Cen
t erS t
Highway72
E Shelby Dr
E Poplar Ave
Hunte
rsWa
yLn
C oll i e
rvil l e
A rli n
g ton
Rd
SHo
u st on
L ev e
e Rd
W Powell Rd
Fletcher Rd
Peter
son L
ake R
d
Frank Rd
Shelton Rd
Syca
more
Rd
E
Harpers Ferry Rd
E White Rd
Gra n
d Steep
le Dr
S Byh
alia R
d
S Rowlett St
S Shea Rd
E Powell Rd
N By
halia
Rd
W White Rd
Shea
Rd
E Lawnwood Dr
E US 72 Hwy
W Poplar Ave
E Winchester Blvd
Marke
t Blvd
Bray S
tation
Rd
E South St
E Holmes Rd
Wolf River Blvd
Collierville Rd
Keough Rd
W US 72 Hwy
E Shelton Rd
Baile
y Stat
ionRd
W Shelton Rd
E Holmes Rd
Cowa
n Rd
Winchester Rd
S Mt Pleasant Rd
Popla
rVie
wPk
wy
Flemi
ng R
d
Gre e
n vie w
Rd
Rollin
g Oak
sLn
Progre
ss Rd
Quinn
Rd
I-269
N
MaynardWay
Current UGATown Boundary
Streets
Rail
Wolf RiverCity of Germantown
City of Piperton
Existing Land Use (2016)0 1,250 2,500 3,750 5,000 6,250 7,500
Feet
1 inch = 5,500 feet
Prepared by The Town of ColliervilleDivision of Planning, GIS
Print Date: February 28, 2017
If you have questions, please contact:The Town of Collierville
Office of GIS & Mapping Services901-457-2360
City of Germantown
City of Piperton
Shelb
y Co.
/ Fay
ette C
o. Lin
e
µ H:\arc9_projects\landuse\LandUse2016\landuse8_11.mxd
EXISTING LAND USE INVENTORYCATEGORIES AND DESCRIPTIONS
VacantUtilityRetail
Agricultural/Farm
Mixed, Non-Residential Mixed Use
Residential, Attached Horizontal Recreational and Open Space
IndustrialInstitutional
Office
Residential, DetachedResidential, Mixed
Commercial
use(s)Residential, Attached Vertical