Embed Size (px)
Citation preview

College Students with ChildrenNational and Regional Profiles
Informing policy. Inspiring change. Improving lives.

ii
College Students with Children:
National and Regional Profiles
January 2017
Elizabeth Noll, Ph.D., Lindsey Reichlin, M.A., and Barbara Gault, Ph.D.
iii
About this Report This report provides a national and regional profile of
undergraduate college students who are raising
dependent children. Drawing on original analysis of
national postsecondary education data, it quantifies the
growth in the student parent population over time, both
nationally and regionally, and describes trends in student
parents’ economic status, their declining access to on-
campus child care across regions, and the demands on
their time while enrolled, in the context of their low
rates of college attainment. This report is part of a
broader project on independent student success funded
by the Lumina Foundation.
About the Institute for
Women’s Policy Research IWPR conducts rigorous research and disseminates its
findings to address the needs of women, promote public
dialogue, and strengthen families, communities, and
societies. IWPR works with policymakers, scholars, and
public interest groups to design, execute, and
disseminate research that illuminates economic and
social policy issues affecting women and their families,
and to build a network of individuals and organizations
that conduct and use women-oriented policy research.
The Institute’s work is supported by foundation grants,
government grants and contracts, donations from
individuals, and contributions from organizations and
corporations. IWPR is a 501(c)(3) tax-exempt
organization that also works in affiliation with the
women’s studies and public policy and public
administration programs at The George Washington
University.
Acknowledgements The authors are grateful to David Croom, Strategy
Officer, and Julie Peller, Strategy Director, from the
Lumina Foundation for their support for and input on
this project. The authors would also like to express their
appreciation for research assistance provided by Melanie
Kruvelis, Mariam K. Chamberlain Fellow, and Mary
Sykes, Research Program Associate.
Board of Directors Holly Fechner, Chair
Covington & Burling LLP
Lorretta Johnson, Vice Chair
American Federation of Teachers, AFL-CIO
William Baer, Secretary
Bloomingdale's (former)
Sylphiel Yip, Treasurer
INTL FCStone Financial Inc.
Martha Darling
Boeing (retired)
Cindy Estrada
United Automobile, Aerospace, and
Agriculture Implement Workers of America,
AFL-CIO
Ellen Karp
Anerca International Inc.
Katherine Kimpel
Shattering the Ceiling
Kai-yan Lee
Vanke
Esmeralda O. Lyn
Worldwide Capital Advisory Partners LLC
William Rodgers
Rutgers University
Elizabeth Shuler
AFL-CIO
Marci Sternheim
Sternheim Consulting
Sheila Wellington
NYU/Stern School of Business, emerita
Marcia Worthing
New York, NY
Cathy Zoi
SunEdison Frontier Power
Leslie Platt Zolov
Pfizer
Heidi Hartmann, President
Institute for Women’s Policy Research
Barbara Gault, Vice President
Institute for Women’s Policy Research
Institute for Women’s Policy Research
IWPR #C451, January 2017
© Copyright 2017 by the Institute for
Women's Policy Research
Institute for Women’s Policy Research
1200 18th Street NW, Suite 301 Washington, DC 20036
Tel: 202/785.5100 Fax: 202/833.4362 www.iwpr.org

iv
Contents
Introduction .............................................................................................................................. 1
The Number of Parents in College is Growing in All Regions and Institution Types ............ 1
The Southwest and Plains Regions have the Highest Shares and Growth of Student
Parents ........................................................................................................................................ 2
Numbers of Student Parents Increased across Institution Types ........................................ 3
Women College Students are Much More Likely to be Raising Children than Men, and a
Large Share are Single Mothers .............................................................................................. 4
Student Parents have Especially Low Rates of Degree Attainment ..................................... 6
Student Parents have Especially Limited Financial Resources to Devote to College ........ 7
Student Parents are Much More Likely than Those without Children to Have an
Expected Family Contribution of Zero ................................................................................... 7
Student Parents have High Levels of Unmet Financial Need ............................................. 9
Student Parents Face Substantial Time Demands ............................................................... 10
Parents Work a Significant Number of Hours while Pursuing College .............................. 11
Student Parents Spend Significant Time Caring for Young Children ............................... 12
Availability of On-Campus Child Care Declining while Student Parent Population Grows
................................................................................................................................................ 12
Conclusion and Recommendations .................................................................................... 14
List of Figures and Tables
Figures
Figure 1. Increase in the Number of Student Parents by Institution Type, 2004-2012. ......... 4
Figure 2. Share of Women Students that are Parents by Race/Ethnicity and Region,
2011-12. .......................................................................................................................................... 6
Figure 3. Share of Students who Enrolled in 2003-04 and Attained a Degree or Certificate
by 2008-09 at All Institutions, by Dependency, Parent, and Marital Status. ......................... 7
Figure 4. Trends in the Share of Students with $0 Expected Family Contribution (EFC) by
Parent and Dependency Status, 2004-12. ................................................................................ 9
Figure 5. Average Unmet Need among Students by Dependency and Parent Status,
2011-12, in 2012 Dollars. ............................................................................................................. 10
Figure 6. Trend in the Share of Students Working 30 or More Hours per Week by
Dependency and Parent Status, 2004-12. .............................................................................. 11

v
Tables
Table 1. Number and Share of Students Who Are Parents by Region, 2011-12, and
Increase in Number of Students who are Parents, 2004-12. ................................................... 2
Table 2. Gender Distribution and Family Status of Student Parents by Region, 2011-12. ... 5
Table 3. Share of Students with an Expected Family Contribution (EFC) of $0 by Student
Parent Status and Region, 2011-12. ........................................................................................... 8
Table 4. Percent Change in Number of Student Parents and Number of Institutions with
On-Campus Child Care by Region, 2004-12. ......................................................................... 13
Appendix
Table A.1. Regional Classifications from the National Center for Education Statistics. .... 15
Table B.1. Share of Students who are Parents by Region, 2004-12. ..................................... 16
Table C.1. Share of Students who are Parents by Institution Type and Region, 2011-12. . 17
Table D.1. Share of Students who are Parents by Gender, Race/Ethnicity and Region,
2011-12. ........................................................................................................................................ 18
Table E.1. Share of Students with $0 EFC by Dependency and Parent Status, 2004-12. .. 19
Table E.2. Percent Change in Share of Students with a $0 EFC by Dependency Status,
Parent Status, and Region, 2004-12. ........................................................................................ 20
Table F.1. Average Amount of Unmet Need, and Increase in Unmet Need by Parent
and Dependency Status, 2004-12, in 2012 Dollars. ................................................................ 21
Table F.2. Average Amount of Unmet Need by Dependency Status, Parent Status, and
Region, 2011-12, in 2012 Dollars. ............................................................................................... 22
Table G.1. Share of Students who Work 30 or More Hours per Week by Dependency
Status, Parent Status and Region, 2011-12. ............................................................................. 23
Figure H.1. Share of Two- and Public Four-Year Institutions with Campus Child Care
Centers, 2002-2015 ..................................................................................................................... 24

Introduction
The profile of the typical college student has changed from the 18-21 year old, recent high school
graduate, to include a greater proportion of older, financially independent students with diverse racial and
ethnic backgrounds and economic needs (CLASP 2015; Gault, Reichlin, and Román 2014; U.S.
Department of Education 2015a; U.S. Department of Education 2015b). Among the growing numbers of
undergraduates who are working, older, independent, enrolled part-time, or living off campus, nearly five
million undergraduate students, comprising 26 percent of the total college population, are also parents of
dependent children (CLASP 2015; Gault et al. 2014; U.S. Department of Education 2015a). Parenting has
significant implications for students’ ability to attain degrees and credentials.
Educational achievement for students with children benefits the students themselves and the families they
are raising. Increasing parents’ educational attainment yields positive short and long-term gains, including
higher earnings (Baum, Ma, and Payea 2013; Hartmann and Hayes 2013), greater access to resources,
greater involvement in their children’s education, and greater likelihood of their child pursuing college
(Attewell et al. 2007; Magnuson 2007).
As the world of higher education works to increase rates of degree attainment among U.S. adults, it is
important to acknowledge and address the unique time-related, financial, and logistical challenges facing
students with caregiving responsibilities. This report analyzes trends in regional demographic
characteristics, financial need, work rates, completion rates, and child care access among the student
parent population compared with other groups of students.1 It finds that, while all student parents face
significant challenges in their pursuit of a higher education, the extent of those challenges vary depending
on multiple factors, including the geographic location of institutions, and students’ racial/ethnic
backgrounds and marital status. The report recommends that colleges and universities, as well as policy
makers, design policies and programs to help student parents manage their significant family, financial,
and time demands while in college.
The Number of Parents in College is Growing in All
Regions and Institution Types
The number of student parents in the United States climbed by 1.1 million, or 30 percent—from 3.7
million in 2004 to 4.8 million in 2012 (the most recent eight-year period for which national data are
available; Figure 1). Nationally, student parents make up 26 percent of the total undergraduate student
body, and the regional shares of students that are parents vary widely from 18 percent in New England to
35 percent in the Southwest (Table 1).
1 This report analyzes data from three U.S. Department of Education postsecondary datasets: the Integrated
Postsecondary Education Data System (IPEDS), the National Postsecondary Student Aid Study (NPSAS), and the
Beginning Postsecondary Student Survey (BPS). Analysis is conducted on a regional level (rather than on a state
level) because regions are the smallest unit of analysis deemed representative by NPSAS sampling methodology;
NPSAS does not provide data on institution state (i.e. the state in which students are enrolled). Regional definitions
can be found in Appendix Table A.1.
2
The Southwest and Plains Regions have the Highest Shares
and Growth of Student Parents
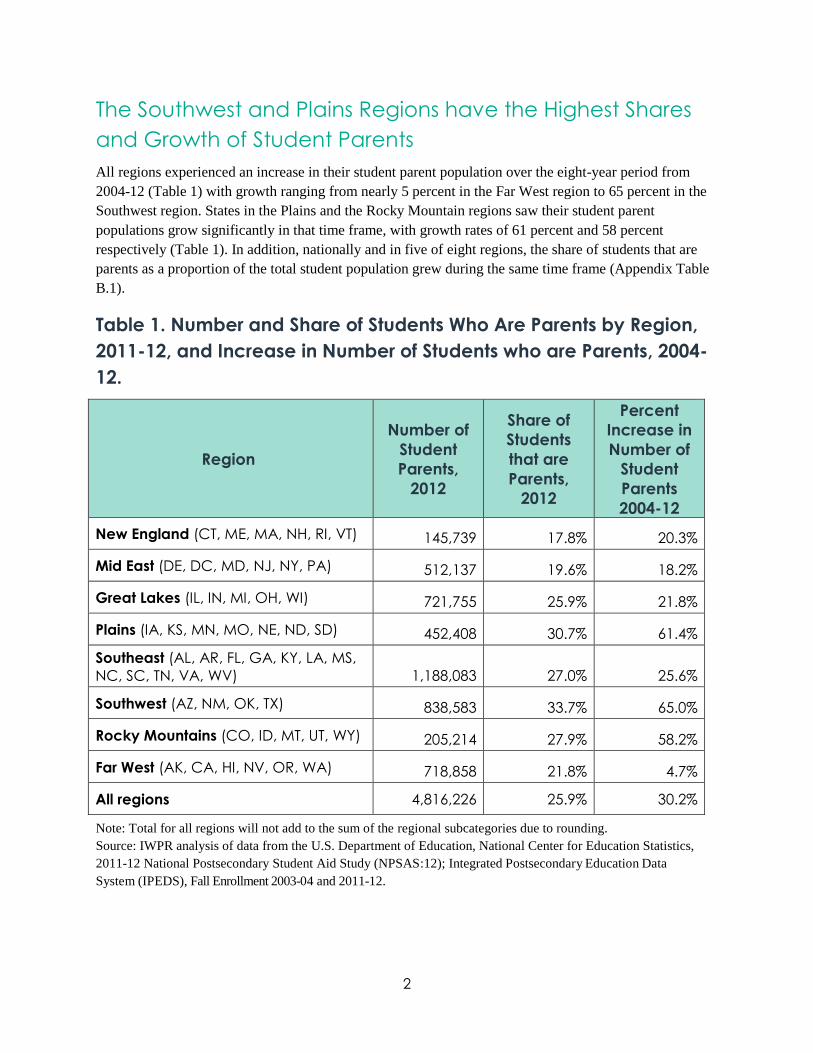
All regions experienced an increase in their student parent population over the eight-year period from
2004-12 (Table 1) with growth ranging from nearly 5 percent in the Far West region to 65 percent in the
Southwest region. States in the Plains and the Rocky Mountain regions saw their student parent
populations grow significantly in that time frame, with growth rates of 61 percent and 58 percent
respectively (Table 1). In addition, nationally and in five of eight regions, the share of students that are
parents as a proportion of the total student population grew during the same time frame (Appendix Table
B.1).
Table 1. Number and Share of Students Who Are Parents by Region,
2011-12, and Increase in Number of Students who are Parents, 2004-
12.
Region
Number of
Student
Parents,
2012
Share of
Students
that are
Parents,
2012
Percent
Increase in
Number of
Student
Parents
2004-12
New England (CT, ME, MA, NH, RI, VT) 145,739 17.8% 20.3%
Mid East (DE, DC, MD, NJ, NY, PA) 512,137 19.6% 18.2%
Great Lakes (IL, IN, MI, OH, WI) 721,755 25.9% 21.8%
Plains (IA, KS, MN, MO, NE, ND, SD) 452,408 30.7% 61.4%
Southeast (AL, AR, FL, GA, KY, LA, MS,
NC, SC, TN, VA, WV) 1,188,083 27.0% 25.6%
Southwest (AZ, NM, OK, TX) 838,583 33.7% 65.0%
Rocky Mountains (CO, ID, MT, UT, WY) 205,214 27.9% 58.2%
Far West (AK, CA, HI, NV, OR, WA) 718,858 21.8% 4.7%
All regions 4,816,226 25.9% 30.2%
Note: Total for all regions will not add to the sum of the regional subcategories due to rounding.
Source: IWPR analysis of data from the U.S. Department of Education, National Center for Education Statistics,
2011-12 National Postsecondary Student Aid Study (NPSAS:12); Integrated Postsecondary Education Data
System (IPEDS), Fall Enrollment 2003-04 and 2011-12.

3
Numbers of Student Parents Increased across Institution
Types
The concentration of student parents differs by institution type, both nationally and regionally. Public
two-year student parent enrollment grew by 9 percent from 2004-12, and community colleges enroll the
largest share of student parents: nearly half of all
student parents (45 percent), or approximately 2.1
million students, attend public two-year institutions,
representing 30 percent of the total community college
student body (Figure 1; IWPR 2016a). Four-year
institutions saw an increase of 18 percent in student
parent enrollment over the same period; the 1.1 million
student parents enrolled at four-year institutions in
2012 comprise 23 percent of the total student parent
population (including public and private not-for-profit
institutions; Figure 1; IWPR 2016a). For-profit
colleges, which enroll a similar number of student parents to four-year institutions (roughly 1.2 million;
Figure 1), saw the most dramatic increase in student parent enrollment from 2004-12, with a growth of
138 percent (Figure 1; IWPR 2016a). As of 2012, half of the total for-profit student body was made up of
students who were also parents (Gault et al. 2014).
Community colleges enroll the
largest share of student parents:
nearly half of all student parents
(45 percent), or approximately 2.1
million students, attend public
two-year institutions, representing
30 percent of the total
community college student body.

4
Figure 1. Increase in the Number of Student Parents by Institution
Type, 2004-2012.
Notes: Community colleges include all public two-year institutions. Four-year institutions include all public and
private nonprofit undergraduate institutions. For-profit institutions include all for-profit colleges, less than two years
and above. Other includes public less than two-year institutions, private nonprofit less than four-year institutions,
and students who attended more than one institution. All institutions include all public and private institutions, and
students attending more than one school. Total for all institutions will not add to the sum of the institutional
subcategories due to rounding.
Source: IWPR analysis of data from the U.S. Department of Education, National Center for Education Statistics,
National Postsecondary Student Aid Study 2003-04 (NPSAS:04); 2007-08 (NPSAS:08); 2011-12 (NPSAS:12), and
Integrated Postsecondary Education Data System (IPEDS) Institutional Characteristics and Fall Enrollment 2003-04,
2007-08, 2011-12.
Regionally, the share of student parents enrolled at community colleges ranges from one-quarter student
body in the Far West, to over one-third of two-year students (35 percent) in the Southeast. Among public
and private four-year institutions, the New England region enrolls the lowest share of students who are
parents (8 percent), compared with a high of 23 percent in the Rocky Mountain states (Appendix Table
C.1).
Women College Students are Much More Likely to be
Raising Children than Men, and a Large Share are
Single Mothers
Nearly a third of all undergraduate women are mothers, and the majority of those are single mothers
(roughly 2 million women, or 60 percent of all student mothers, are single mothers; Gault et al. 2014;
3,700,0753,896,140
4,816,226
1,965,4181,916,467 2,143,506
942,311903,377
1,110,188501,761 774,811
1,191,831
290,585 301,479 370,6890
1,000,000
2,000,000
3,000,000
4,000,000
5,000,000
2004 2008 2012
All institutions Community colleges Four-year institutions
For-profit institutions Other
5
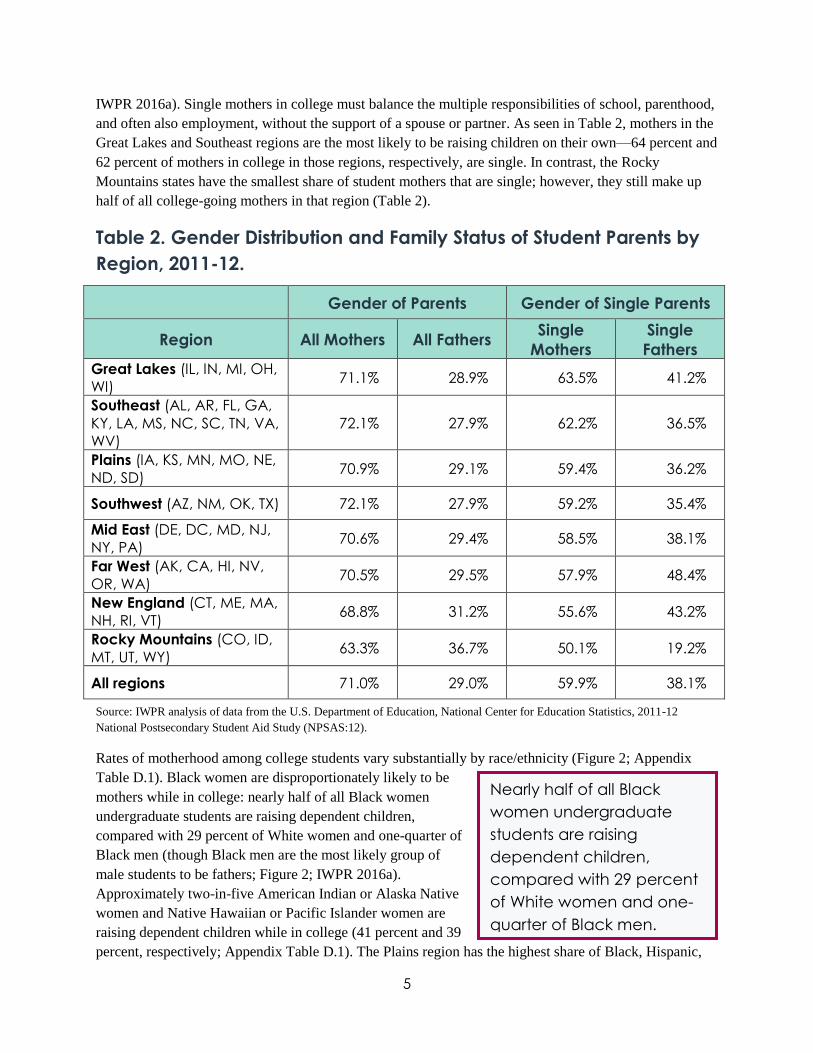
IWPR 2016a). Single mothers in college must balance the multiple responsibilities of school, parenthood,
and often also employment, without the support of a spouse or partner. As seen in Table 2, mothers in the
Great Lakes and Southeast regions are the most likely to be raising children on their own—64 percent and
62 percent of mothers in college in those regions, respectively, are single. In contrast, the Rocky
Mountains states have the smallest share of student mothers that are single; however, they still make up
half of all college-going mothers in that region (Table 2).
Table 2. Gender Distribution and Family Status of Student Parents by
Region, 2011-12.
Gender of Parents Gender of Single Parents
Region All Mothers All Fathers Single
Mothers
Single
Fathers Great Lakes (IL, IN, MI, OH,
WI) 71.1% 28.9% 63.5% 41.2%
Southeast (AL, AR, FL, GA,
KY, LA, MS, NC, SC, TN, VA,
WV)
72.1% 27.9% 62.2% 36.5%
Plains (IA, KS, MN, MO, NE,
ND, SD) 70.9% 29.1% 59.4% 36.2%
Southwest (AZ, NM, OK, TX) 72.1% 27.9% 59.2% 35.4%
Mid East (DE, DC, MD, NJ,
NY, PA) 70.6% 29.4% 58.5% 38.1%
Far West (AK, CA, HI, NV,
OR, WA) 70.5% 29.5% 57.9% 48.4%
New England (CT, ME, MA,
NH, RI, VT) 68.8% 31.2% 55.6% 43.2%
Rocky Mountains (CO, ID,
MT, UT, WY) 63.3% 36.7% 50.1% 19.2%
All regions 71.0% 29.0% 59.9% 38.1%
Source: IWPR analysis of data from the U.S. Department of Education, National Center for Education Statistics, 2011-12
National Postsecondary Student Aid Study (NPSAS:12).
Rates of motherhood among college students vary substantially by race/ethnicity (Figure 2; Appendix
Table D.1). Black women are disproportionately likely to be
mothers while in college: nearly half of all Black women
undergraduate students are raising dependent children,
compared with 29 percent of White women and one-quarter of
Black men (though Black men are the most likely group of
male students to be fathers; Figure 2; IWPR 2016a).
Approximately two-in-five American Indian or Alaska Native
women and Native Hawaiian or Pacific Islander women are
raising dependent children while in college (41 percent and 39
percent, respectively; Appendix Table D.1). The Plains region has the highest share of Black, Hispanic,
Nearly half of all Black
women undergraduate
students are raising
dependent children,
compared with 29 percent
of White women and one-
quarter of Black men.

6
and American Indian or Alaska Native women who are mothers (57 percent, 48 percent, and 58 percent,
respectively; Figure 2; Appendix Table D.1).2
Figure 2. Share of Women Students that are Parents by Race/Ethnicity
and Region, 2011-12.
Source: IWPR analysis of data from the U.S. Department of Education, National Center for Education Statistics,
2011-12 National Postsecondary Student Aid Study (NPSAS:12).
Student Parents have Especially Low Rates of Degree
Attainment
Student parents—especially those who are single—have low rates of college completion when compared
with non-parenting students. Only 27 percent of single student parents to attain a degree or certificate
within 6 years of enrollment, compared with 56 percent of dependent students (Figure 3).
2 Small sample sizes limit our ability to report the shares of women by every race/ethnicity in each region that are
parents.
29.1%
33.8%
40.7%
30.0%
30.2%
27.8%
25.6%
21.7%
19.0%
47.0%
57.1%
53.1%
50.1%
50.0%
46.8%
44.5%
36.7%
35.5%
31.6%
48.3%
36.8%
33.7%
37.7%
29.3%
28.6%
26.1%
28.8%
All Regions
Plains
Southwest
Great Lakes
Rocky
Mountains
Southeast
Far West
Mid East
New England
Hispanic Women Black Women White Women

7
Figure 3. Share of Students who Enrolled in 2003-04 and Attained a
Degree or Certificate by 2008-09 at All Institutions, by Dependency,
Parent, and Marital Status.
Source: IWPR analysis of data from the U.S. Department of Education, National Center for Education Statistics,
2003-04 Beginning Postsecondary Students Longitudinal Study, Second Follow-up (BPS:04/09).
Attaining a college degree or certificate in a high-demand occupation is critical to finding quality
employment with family-sustaining wages. This is especially true for student parents who need to support
their family and pay off their often-significant student debt (Gault, Reichlin, and Román 2014).
Student Parents have Especially Limited Financial
Resources to Devote to College
Student parents are more likely than other students to face intense economic challenges, in large part due
to the significant costs of raising young children (Duke-Benfield 2015; Gault, Reichlin, and Román 2014;
Green 2013). Student parents work full-time and enroll in school part-time more often than their
nonparent counterparts, intensifying their need for reliable—and often costly—child care (Gault,
Reichlin, and Román 2014; Huelsman and Engle 2013). They are also more likely than other college
students to live below the poverty level, to have an Expected Family Contribution (EFC) to education of
$0, and to have high levels of unmet financial need (Gault, Reichlin, and Román 2014; IWPR 2016a).3
Student Parents are Much More Likely than Those without
Children to Have an Expected Family Contribution of Zero
Student parents are nearly 50 percent more likely than independent nonparents to have an EFC of $0: 61
percent compared with 41 percent, respectively (Table 3). The disparity in EFC can be seen across the
United States: in every region of the country, more than half of undergraduate students with dependent
3 Expected Family Contribution, or EFC, is calculated using information from the Free Application for Federal
Student Aid (FAFSA) and used to determine a student’s eligibility for federal financial aid (such as Pell Grants;
Federal Student Aid 2016).
49.5%
56.1%
34.1% 32.6%
39.3%
26.7%
0%
10%
20%
30%
40%
50%
60%
All students Dependent
students
Independent
nonparents
Student
parents
Married
parents
Single
parents

8
In every region of the
country, more than half of
undergraduate students
with dependent children
have no money to
contribute to college
expenses.
children have no money to contribute to college. The Southeast region stands out with nearly two-thirds
(65 percent) of parents with a $0 EFC (Table 3).
Table 3. Share of Students with an Expected Family Contribution (EFC)
of $0 by Student Parent Status and Region, 2011-12.
Region All students Student
parents
Indepen-
dent
nonparents
Depen-
dent
students
Southeast (AL, AR, FL, GA, KY, LA,
MS, NC, SC, TN, VA, WV) 41.6% 64.7% 45.3% 27.2%
Far West (AK, CA, HI, NV, OR, WA) 40.1% 62.4% 43.5% 28.0%
Great Lakes (IL, IN, MI, OH, WI) 36.3% 62.3% 40.6% 20.4%
Plains (IA, KS, MN, MO, NE, ND,
SD) 34.9% 61.9% 37.8% 15.7%
Southwest (AZ, NM, OK, TX) 41.5% 61.0% 39.1% 26.1%
Mid East (DE, DC, MD, NJ, NY, PA) 32.0% 55.9% 38.4% 21.7%
Rocky Mountains (CO, ID, MT, UT,
WY) 32.5% 53.3% 34.7% 17.2%
New England (CT, ME, MA, NH, RI,
VT) 29.3% 52.2% 36.7% 19.8%
All regions 37.8% 61.2% 41.1% 23.7%
Source: IWPR analysis of data from the U.S. Department of Education, National Center for Education Statistics,
2011-12 National Postsecondary Student Aid Study (NPSAS:12).
The share of students with no financial resources for college
grew significantly from 2004-12. The economic downturn in
2008 was followed by an uptick in college enrollment in the
years following (Long 2014).
The share of all students with a $0 EFC increased by nearly 50
percent from 2008-12 (from 25 percent to 38 percent; Figure 4).
Students with dependent children experienced an even greater
decline in their ability to finance college: the share of student
parents reporting a $0 EFC increased from 40 percent in 2008 to
61 percent in 2012 (an increase of 54 percent; Figure 4).

9
Single parents, despite seeing
the smallest percent change
in unmet need from 2004-12,
have consistently had the
highest dollar amount of
unmet need—a fact that
holds particularly true for
single mothers.
Figure 4. Trends in the Share of Students with $0 Expected Family
Contribution (EFC) by Parent and Dependency Status, 2004-12.
Source: IWPR analysis of data from the U.S. Department of Education, National Center for Education Statistics,
National Postsecondary Student Aid Study 2003-04 (NPSAS:04); 2007-08 (NPSAS:08); 2011-12 (NPSAS:12).
All regions experienced an increase in the share of student parents with an EFC of $0 during 2008-12,
ranging from a 21 percent increase in the Rocky Mountains to a 42 percent increase in the Far West
(Appendix Table E.2). More dramatic changes in the shares of student parents with a $0 EFC at the
regional level occurred between the years of 2004-12. The Plains and Far West regions saw the greatest
increase over this eight-year period—111 percent and 104 percent respectively—followed by a 91 percent
increase in the Great Lakes and an 81 percent increase in New England (Appendix Table E.2).
Student Parents have High Levels of Unmet Financial Need
Many student parents experience significant unmet need, or expenses that students must pay out of pocket
to cover the cost of college attendance.4 While independent
students that were not parents saw substantial growth in
unmet need from 2004-12 (63 percent), unmet need among
student parents is and has remained the highest when
compared with all undergraduates and with their non-parent
counterparts (Appendix Table F.1). From 2004-12, student
parents’ unmet need—which increased by nearly $1,800 in
that time frame—has been, on average, roughly $700 more
than need among dependent and independent nonparents,
and over $500 more than that of all students (Appendix
Table F.1).
4 Unmet need is defined as a student’s budget minus EFC and all financial aid received, but excluding private loans.
20.7%25.3%
37.8%34.9%
39.8%
61.2%
21.1%
31.0%
41.1%
13.5% 15.8%
23.7%
0%
10%
20%
30%
40%
50%
60%
70%
2004 2008 2012
All students Student parents
Independent nonparents Dependent students

10
Unmet need varies significantly according to student parents’ marital status and gender. Single parents,
despite seeing a relatively small percent change in unmet need from 2004-12 (29 percent), have
consistently had the highest dollar amount of unmet need (Appendix Table F.1). In 2012, single parents
had nearly $6,500 in unmet need, and single mothers’ need, at just over $6,600, was more than $2,000
higher than that of married parents (Figure 4; Appendix Table F.1). While married parents saw a 67
percent increase in unmet need from 2004-12, they have remained the group with the lowest level of
unmet need, even when compared with dependent students, indicating that the marital status of student
parents plays a critical role in their financial security when pursuing college (Appendix Table F.1).
Figure 5. Average Unmet Need among Students by Dependency and
Parent Status, 2011-12, in 2012 Dollars.
Source: IWPR analysis of data from the U.S. Department of Education, National Center for Education Statistics,
2003-04 (NPSAS:04); 2007-08 (NPSAS:08); 2011-12 National Postsecondary Student Aid Study (NPSAS:12).
Regionally, while all students attending college in New England have the highest levels of unmet need
(nearly $6,900 for all undergraduate students), the region ranks third in need among student parents,
following the Southwest and the Far West (Appendix Table F.2). In three regions, single student parents
have unmet need that exceeds $7,000 (the Southwest, New England, and the Mid East), with single
student mothers having more than $7,000 in unmet need in a fourth region of Far West (Appendix Table
F.2; IWPR 2016a). Unmet need is highest for single student fathers in the region of the Mid East, the only
place in which their unmet need exceeds $7,000 (IWPR 2016a).
Student Parents Face Substantial Time Demands
Compounding their financial challenges, students with children grapple with significant demands on their
time. In addition to time spent in class and studying, most student parents juggle paid work and
substantial time caring for children. With these pressures, college affordability for students with children
becomes an issue of time as well as money, and support strategies must consider how to help student
parents devote the time for academics that it takes to succeed in school.
$4,985 $4,650
$5,011 $5,571
$6,478
$4,518
$0
$1,000
$2,000
$3,000
$4,000
$5,000
$6,000
$7,000
All students Dependent
students
Independent
nonparents
All
student
parents
Single
student
parents
Married
student
parents

11
Parents Work a Significant Number of Hours while Pursuing
College
Student parents often work while in school to make ends meet. Coupled with time needed to meet family
obligations, the demands of working while in college can further limit the time student parents have to
focus on course work, spend time with their children, sleep, or have time to themselves (Gault, Noll, and
Reichlin forthcoming). Student parents are more likely to work while in college than dependent students
(66 percent compared with 58 percent, respectively) and more likely to work long hours: 66 percent of
student parents worked more than 20 hours per week in 2011-12, compared with 39 percent of their
dependent counterparts (IWPR 2016a). Higher rates of employment and higher numbers of hours worked
can endanger student parents’ ability to complete school on time or at all (Kuh et al. 2007; Orozco and
Cauthen 2009). When holding a job leads student parents to enroll less than full-time, it can also threaten
their eligibility for financial aid that is tied to school credit hours (Huelsman and Engle 2013).
Employment rates and the number of hours worked per week declined among all college students after
2008, possibly due to the job losses during the Great Recession. Student parents and independent
nonparents, however, remained more than twice as likely as dependent students to work 30 or more hours
per week (Figure 6). In 2012, 46 percent of student parents and 45 percent of their nonparent counterparts
worked this much compared with just 21 percent of dependent students (Figure 6; Appendix Table G.1).
Figure 6. Trend in the Share of Students Working 30 or More Hours per
Week by Dependency and Parent Status, 2004-12.
Source: IWPR analysis of data from the U.S. Department of Education, National Center for Education Statistics,
2003-04 National Postsecondary Student Aid Study (NPSAS:04), 2007-08 National Postsecondary Student Aid
Study (NPSAS:08) and 2011-12 National Postsecondary Student Aid Study (NPSAS:12).
40.7%41.7%
33.6%
24.9%25.1% 20.9%
56.2%58.5%
44.8%
57.3%59.9%
46.4%
0%
10%
20%
30%
40%
50%
60%
70%
2004 2008 2012
All students Dependent students
Independent nonparents Student parents

12
Despite the fact that the
number of students with
children has increased in every
region between 2004 and
2012, the share of campuses
that provide child care has
concurrently declined across
all eight regions.
Among community college
students who have children
living with them, nearly three-
quarters of women (71
percent) and half of men
report spending over 20 hours a
week caring for dependents.
In 2012, the Southwest region had the largest share of all undergraduates (40 percent), independent
nonparents (48 percent), and dependent students (27 percent) who worked 30 or more hours per week,
while student parents in the Plains states were the most likely to work that amount (53 percent; Appendix
Table G.1).
Student Parents Spend Significant Time Caring for Young
Children
In addition to working, students with children have
significant dependent care obligations that can impact
their time and finances. Overall, 50 percent of student
parents have children ages 5 or younger, and another 25
percent have children ages 6-10 (IWPR 2016a). Among
community college students who have children living
with them, nearly three-quarters of women (71 percent)
and half of men report spending over 20 hours a week
caring for dependents (CCSSE 2016). These student
parents often report that caring for their children on top of going to college can be too much to handle: 43
percent of women and 37 percent of men at two-year institutions say they are likely or very likely to
withdraw from college to care for dependents (CCSSE 2016).5
Availability of On-Campus Child Care Declining while
Student Parent Population Grows
Affordable, stable child care can help student parents juggle their school and work responsibilities, yet
campus child care centers have been closing across the country (Table 5). A recent IWPR analysis finds
that, from 2005-15, campus child care declined at community colleges and public four-year institutions in
36 states (Eckerson et al. 2016). The share of community colleges reporting the presence of a campus
child care center declined sharply—from 53 percent in
2004, to 44 percent in 2015—a particularly concerning
trend due to the large share of parents enrolled in
community colleges (Eckerson et al. 2016; IWPR 2016b;
Appendix Figure H.1). At public four-year institutions, the
availability of campus child care declined from a high of
55 percent in 2003-05 to just under half of all institutions
in 2015 (Eckerson et al. 2016; Appendix Figure H.1).
Despite the fact that the number of students with children
has increased in every region between 2004 and 2012, the
share of campuses that provide child care has concurrently declined across all eight regions. In 2012, the
Southwest region had the largest share of student parents (34 percent; Table 1), yet only 12 percent of
postsecondary institutions in the region provided on-campus child care (Table 4). Notably, the two
5 Data used with permission from the Center for Community College Student Engagement, The Community College
Survey of Student Engagement 2016, The University of Texas at Austin.

13
The two regions with the
highest increase in the
number of students with
children (the Southwest
and Plains regions) also
saw the greatest decrease
in on-campus child care.
regions with the highest increase in the number of students with children (the Southwest and Plains
regions) also saw the greatest decrease in on-campus child care (Table 4).
Table 4. Percent Change in Number of Student Parents and Number
of Institutions with On-Campus Child Care by Region, 2004-12.
Region
Share of
Campuses
with Child
Care,
2011-12
Percent
Decrease in
Campuses
with Child
Care,
2004-12
Percent
Increase in
Student
Parent
Population,
2004-12
New England (CT, ME, MA, NH, RI, VT) 14.7% -14.3% 21.3%
Mid East (DE, DC, MD, NJ, NY, PA) 17.2% -12.1% 18.3%
Great Lakes (IL, IN, MI, OH, WI) 16.0% -14.4% 19.0%
Plains (IA, KS, MN, MO, NE, ND, SD) 17.4% -20.0% 61.2%
Southeast (AL, AR, FL, GA, KY, LA, MS,
NC, SC, TN, VA, WV) 10.8% -19.0% 26.2%
Southwest (AZ, NM, OK, TX) 12.2% -19.8% 67.5%
Rocky Mountains (CO, ID, MT, UT, WY) 15.5% -13.2% 60.4%
Far West (AK, CA, HI, NV, OR, WA) 19.9% -4.0% 5.5%
All regions 15.1% -14.2% 29.6%
Source: IWPR analysis of data from the U.S. Department of Education, National Center for Education Statistics,
Integrated Postsecondary Education Data System (IPEDS), 2004 and 2012 Institutional Characteristics Surveys; and
the National Postsecondary Student Aid Study 2003-04 (NPSAS:04); and 2011-12 (NPSAS:12).
Greater access to child care would be likely to increase rates of degree attainment among student parents
(IWPR 2016a). Research has shown that, for many parents who leave school without earning a credential,
better access to child care could have helped them avoid taking
a break or dropping out completely (Johnson et al. 2009; Hess
et al. 2014). One study at a community college in New York
State finds that parents who have access to campus child care
demonstrate better persistence and have a greater likelihood of
completing with a degree or transferring to a four-year college
than other parents who do not (Monroe Community College
2013). The decline in overall and regional availability of
campus child care compounds the time-related and financial
challenges facing student parents, particularly those who are
single, making it more difficult for them to remain enrolled and complete with a higher credential, on
time or at all.

14
Conclusion and Recommendations
Growth in the proportion and numbers of college students who are parents has important implications for
state and national postsecondary attainment goals. To help ensure that students with children succeed in
college, states and institutions across the nation should understand the demographics of their student
parent populations, their degree of financial need, and the supports needed to promote their success.
Federal and state policymakers and institutional and program leaders must work to establish policies to
promote postsecondary attainment among student parents. Preserving and strengthening campus child
care centers and establishing connections with the broader early childhood community can improve
student parents’ access to quality, affordable child care (Boressoff 2012; Boressoff 2013; Schumacher
2015). Making campuses welcoming for student parents through family-friendly events and spaces can
engage student parents in campus life, and help them establish peer support networks (Schumacher 2015).
Institutions should also establish data collection practices to track the presence of student parents on
campus and their outcomes over time. Colleges can take proactive steps to ensure that students with
children receive all available financial aid rather than leaving it to the students’ own initiative to request
special consideration due to high child care expenses or the need to reduce work hours. Policies and
programs intended to improve success among low-income student populations must also take into account
student parents’ complicated schedules and time demands, ensuring that part-time and working students
have access.
Students, states, and the nation as a whole can achieve substantial long-term economic and social gains
from increased college completion among students with children. By investing in improved access to
financial aid, and in child care and other supportive services, institutions can improve retention and
completion outcomes among student parents, which will contribute substantially to increasing higher
education attainment in the population overall.

15
Appendix A. Regional Definitions
Table A.1. Regional Classifications from the National Center for
Education Statistics.
New England Mid East Great Lakes Plains
Connecticut Delaware Illinois Iowa
Maine Washington, DC Indiana Kansas
Massachusetts Maryland Michigan Minnesota
New Hampshire New Jersey Ohio Missouri
Rhode Island New York Wisconsin Nebraska
Vermont Pennsylvania North Dakota
South Dakota
Southeast Southwest Rocky Mountains Far West
Alabama Arizona Colorado Alaska
Arkansas New Mexico Idaho California
Florida Oklahoma Montana Hawaii
Georgia Texas Utah Nevada
Kentucky Wyoming Oregon
Louisiana Washington
Mississippi
North Carolina
South Carolina
Tennessee
Virginia
West Virginia
Notes: Regions indicate geographic region where NPSAS sample institution is located; i.e. where surveyed
students attend college.
Source: U.S. Department of Education, National Center for Education Statistics, National Postsecondary Student
Aid Study (NPSAS).

16
Appendix B. Trends in the Share of Students who are
Parents by Region
Table B.1. Share of Students who are Parents by Region, 2004-12.
Region 2003-04 2007-08 2011-12
Percentage
Point
Difference
2004-12
Percent
Change
2004-12
New England (CT, ME, MA, NH,
RI, VT) 17.2% 15.2% 17.8% 0.6% 3.4%
Mid East (DE, DC, MD, NJ, NY,
PA) 19.8% 18.7% 19.6% -0.1% -0.7%
Great Lakes (IL, IN, MI, OH, WI) 25.4% 26.4% 25.9% 0.6% 2.3%
Plains (IA, KS, MN, MO, NE, ND,
SD) 24.8% 24.2% 30.7% 5.9% 23.6%
Southeast (AL, AR, FL, GA, KY,
LA, MS, NC, SC, TN, VA, WV) 28.2% 25.3% 27.0% -1.2% -4.3%
Southwest (AZ, NM, OK, TX) 28.9% 27.7% 33.7% 4.8% 16.8%
Rocky Mountains (CO, ID, MT,
UT, WY) 22.8% 27.2% 27.9% 5.1% 22.5%
Far West (AK, CA, HI, NV, OR,
WA) 24.4% 24.3% 21.8% -2.6% -10.6%
All regions 24.9% 24.3% 25.9% 1.0% 4.0%
Source: IWPR analysis of data from the U.S. Department of Education, National Center for Education Statistics,
National Postsecondary Student Aid Study 2003-04 (NPSAS:04); 2007-08 (NPSAS:08); 2011-12 (NPSAS:12), and
Integrated Postsecondary Education Data.

17
Appendix C. The Share of Students who are Parents
by Institution Type and Region
Table C.1. Share of Students who are Parents by Institution Type and
Region, 2011-12.
Region Public
Two-Year Four-Year For-Profit
All
Institutions
New England (CT, ME, MA, NH, RI, VT) 26.7% 8.5% 39.6% 17.8%
Mid East (DE, DC, MD, NJ, NY, PA) 25.2% 12.2% 38.1% 19.6%
Great Lakes (IL, IN, MI, OH, WI) 32.3% 17.4% 43.7% 25.9%
Plains (IA, KS, MN, MO, NE, ND, SD) 32.5% 12.5% 61.7% 30.7%
Southeast (AL, AR, FL, GA, KY, LA, MS,
NC, SC, TN, VA, WV) 34.9% 16.0% 52.2% 27.0%
Southwest (AZ, NM, OK, TX) 33.4% 16.7% 59.0% 33.7%
Rocky Mountains (CO, ID, MT, UT, WY) 29.6% 23.3% 41.3% 27.9%
Far West (AK, CA, HI, NV, OR, WA) 24.7% 12.0% 37.4% 21.8%
All Regions 30.2% 14.9% 49.7% 25.9%
Notes: Community colleges include all public two-year institutions. Four-year institutions include all public and
private nonprofit undergraduate institutions. For-profit institutions include all for-profit, less than two years and
above. All institutions include all public and private institutions, including students attending more than one
school.
Source: IWPR analysis of data from the U.S. Department of Education, National Center for Education Statistics,
2011-12 National Postsecondary Student Aid Study (NPSAS:12).

18
Appendix D. Student Parent Demographics by
Region
Table D.1. Share of Students who are Parents by Gender,
Race/Ethnicity and Region, 2011-12.
Ne
w E
ng
lan
d
(CT,
ME,
MA
, N
H,
RI,
VT)
Mid
Ea
st
(DE,
DC
, M
D, N
J, N
Y,
PA
)
Gre
at
Lak
es
(IL,
IN
, M
I, O
H,
WI)
Pla
ins
(IA
, K
S,
MN
, M
O, N
E,
ND
, SD
)
So
uth
ea
st
(AL,
AR
, FL,
GA
, K
Y,
LA,
MS,
NC
, SC
, TN
, V
A,
WV
)
So
uth
we
st
(A
Z, N
M, O
K,
TX)
Ro
ck
y
Mo
un
tain
s (C
O,
ID,
MT,
UT,
WY
)
Fa
r W
est
(AK
, C
A,
HI, N
V, O
R,
WA
)
All R
eg
ion
s
All Undergraduate Students
All 18.1% 19.9% 26.4% 31.2% 27.4% 34.8% 27.9% 22.3% 25.9%
Women 22.1% 25.1% 33.4% 37.8% 33.6% 41.1% 31.9% 26.9% 32.2%
Men 12.5% 12.9% 16.8% 21.1% 17.9% 23.0% 23.0% 15.0% 17.5%
White Students
All 15.4% 16.8% 23.6% 26.9% 22.9% 32.9% 26.9% 20.5% 23.4%
Women 19.0% 21.7% 30.0% 33.8% 27.8% 40.7% 30.2% 25.6% 29.1%
Men 11.1% 11.4% 16.0% 17.6% 16.8% 22.4% 23.2% 14.0% 16.3%
Black Students
All 29.5% 30.8% 40.2% 48.5% 37.7% 46.3% 43.4% 37.2% 38.7%
Women 35.5% 36.7% 50.1% 57.1% 46.8% 53.1% 50.0% 44.5% 47.0%
Men 23.9% 20.8% 23.4% 37.0% 22.1% 32.2% 32.4% 25.4% 24.9%
Hispanic Students
All 23.8% 20.9% 27.9% 41.3% 24.0% 29.6% 32.4% 23.0% 25.7%
Women 28.8% 26.1% 33.7% 48.3% 29.3% 36.8% 37.7% 28.6% 31.6%
Men 15.6% 13.6% 21.3% 31.4% 16.5% 20.2% 23.4% 15.1% 17.6%
Asian Students
All 10.4% 11.4% 6.7% 25.6% 20.0% 22.1% 14.8% 13.5% 14.8%
Women ‡ 15.6% ‡ 28.3% 24.4% 26.0% ‡ 15.3% 18.2%
Men ‡ 7.0% ‡ 21.6% ‡ 16.1% ‡ 11.3% 10.9%
American Indian/Alaska Native Students
All 11.3% 25.7% 23.5% 43.1% 37.7% 42.2% 16.4% 29.9% 34.3%
Women ‡ ‡ ‡ 57.9% 45.5% 47.1% ‡ 37.8% 41.4%
Men ‡ ‡ ‡ ‡ ‡ 33.2% ‡ ‡ 23.5%
Native Hawaiian or Pacific Islander Students
All ‡ 32.4% 32.2% ‡ 27.9% 30.0% ‡ 22.8% 27.5%
Women ‡ ‡ ‡ ‡ 35.4% ‡ ‡ 33.1% 39.4%
Men ‡ ‡ ‡ ‡ ‡ ‡ ‡ ‡ 15.4%
Notes: ‡ Reporting standards not met.
Source: IWPR analysis of data from the U.S. Department of Education, National Center for Education Statistics, 2011-12 National
Postsecondary Student Aid Study (NPSAS:12).

19
Appendix E. Expected Family Contribution
Table E.1. Share of Students with $0 EFC by Dependency and Parent
Status, 2004-12.
Re
gio
n
2004 2008 2012
All
De
pe
nd
en
t
Ind
ep
en
de
nt
no
np
are
nts
Stu
de
nts
pa
ren
ts
All
De
pe
nd
en
t
Ind
ep
en
de
nt
no
np
are
nts
Stu
de
nts
pa
ren
ts
All
De
pe
nd
en
t
Ind
ep
en
de
nt
no
np
are
nts
Stu
de
nts
pa
ren
ts
New
England
(CT, ME,
MA, NH,
RI, VT)
15.3% 10.0% 20.6% 28.8% 18.7% 10.6% 33.9% 34.8% 29.3% 19.8% 36.7% 52.2%
Mid East
(DE, DC,
MD, NJ,
NY, PA)
18.4% 12.6% 21.1% 32.8% 22.9% 15.5% 31.9% 36.5% 32.0% 21.7% 38.4% 55.9%
Great
Lakes
(IL, IN, MI,
OH, WI)
17.5% 8.9% 19.5% 32.7% 22.9% 12.7% 28.6% 37.3% 36.3% 20.4% 40.6% 62.3%
Plains
(IA, KS,
MN, MO,
NE, ND,
SD)
15.1% 7.3% 18.4% 29.3% 22.5% 11.1% 31.6% 39.0% 34.9% 15.7% 37.8% 61.9%
Southeast
(AL, AR, FL,
GA, KY,
LA, MS,
NC, SC,
TN, VA,
WV)
24.6% 15.7% 22.3% 41.6% 26.4% 15.9% 31.1% 43.8% 41.6% 27.2% 45.3% 64.7%
Southwest
(AZ, NM,
OK, TX)
22.5% 13.9% 23.9% 34.1% 26.4% 17.4% 28.9% 38.8% 41.5% 26.1% 39.1% 61.0%
Rocky
Mountains
(CO, ID,
MT, UT,
WY)
17.9% 10.5% 15.8% 36.6% 23.9% 9.3% 29.1% 42.3% 32.5% 17.2% 34.7% 53.3%
Far West
(AK, CA,
HI, NV, OR,
WA)
21.2% 17.1% 19.7% 30.6% 27.0% 19.4% 31.5% 36.3% 40.1% 28.0% 43.5% 62.4%
All
Regions 20.7% 13.5% 21.1% 34.9% 25.3% 15.8% 31.0% 39.8% 37.8% 23.7% 41.1% 61.2%
Source: IWPR analysis of data from the U.S. Department of Education, National Center for Education Statistics, National Postsecondary
Student Aid Study 2003-04 (NPSAS:04); 2007-08 (NPSAS:08); 2011-12 (NPSAS:12).

20
Table E.2. Percent Change in Share of Students with a $0 EFC by
Dependency Status, Parent Status, and Region, 2004-12.
All students Dependent
students
Independent
nonparents
Student
parents
2004-12
New England (CT, ME, MA, NH, RI, VT) 91.9% 97.4% 78.1% 81.2%
Mid East (DE, DC, MD, NJ, NY, PA) 73.9% 71.9% 82.0% 70.4%
Great Lakes (IL, IN, MI, OH, WI) 107.7% 127.8% 107.7% 90.7%
Plains (IA, KS, MN, MO, NE, ND, SD) 132.0% 115.5% 105.3% 111.2%
Southeast (AL, AR, FL, GA, KY, LA, MS,
NC, SC, TN, VA, WV) 69.5% 73.7% 102.9% 55.5%
Southwest (AZ, NM, OK, TX) 84.2% 87.7% 63.6% 79.0%
Rocky Mountains (CO, ID, MT, UT, WY) 81.4% 63.8% 119.3% 45.6%
Far West (AK, CA, HI, NV, OR, WA) 89.7% 63.5% 120.7% 103.6%
All Regions 82.5% 74.8% 94.9% 75.1%
2004-08
New England (CT, ME, MA, NH, RI, VT) 22.4% 5.1% 64.6% 20.6%
Mid East (DE, DC, MD, NJ, NY, PA) 24.6% 23.0% 51.3% 11.4%
Great Lakes (IL, IN, MI, OH, WI) 31.2% 42.0% 46.2% 14.2%
Plains (IA, KS, MN, MO, NE, ND, SD) 49.2% 52.5% 71.9% 33.0%
Southeast (AL, AR, FL, GA, KY, LA, MS,
NC, SC, TN, VA, WV) 7.5% 1.5% 39.2% 5.3%
Southwest (AZ, NM, OK, TX) 17.4% 25.1% 20.8% 13.9%
Rocky Mountains (CO, ID, MT, UT, WY) 33.7% -11.5% 83.8% 15.7%
Far West (AK, CA, HI, NV, OR, WA) 27.6% 13.1% 59.6% 18.6%
All Regions 22.3% 16.6% 47.3% 13.8%
2008-12
New England (CT, ME, MA, NH, RI, VT) 56.7% 87.8% 8.2% 50.2%
Mid East (DE, DC, MD, NJ, NY, PA) 39.6% 39.7% 20.3% 53.0%
Great Lakes (IL, IN, MI, OH, WI) 58.3% 60.4% 42.0% 66.9%
Plains (IA, KS, MN, MO, NE, ND, SD) 55.6% 41.3% 19.4% 58.9%
Southeast (AL, AR, FL, GA, KY, LA, MS,
NC, SC, TN, VA, WV) 57.6% 71.2%
45.8% 47.8%
Southwest (AZ, NM, OK, TX) 56.9% 50.1% 35.5% 57.2%
Rocky Mountains (CO, ID, MT, UT, WY) 35.7% 85.2% 19.3% 25.9%
Far West (AK, CA, HI, NV, OR, WA) 48.7% 44.6% 38.3% 71.7%
All Regions 49.2% 49.9% 32.3% 53.9%
Source: IWPR analysis of data from the U.S. Department of Education, National Center for Education Statistics,
National Postsecondary Student Aid Study 2003-04 (NPSAS:04); 2007-08 (NPSAS:08); 2011-12 (NPSAS:12).

21
Appendix F. Unmet Financial Need
Table F.1. Average Amount of Unmet Need, and Increase in Unmet
Need by Parent and Dependency Status, 2004-12, in 2012 Dollars.
2004 2008 2012
Percent
Increase
2004-12
All students $3,489 $4,082 $4,985 42.9%
Dependent students $3,538 $3,503 $4,650 31.4%
Independent nonparents $3,076 $4,460 $5,011 62.9%
All student parents $3,798 $4,900 $5,571 46.7%
Single student parents $5,034 $6,339 $6,478 28.7%
Single student mothers $5,033 $6,693 $6,638 31.9%
Single student fathers $5,040 $5,095 $5,873 16.5%
Married student parents $2,706 $3,479 $4,518 67.0%
Married student mothers $2,708 $3,509 $4,627 70.9%
Married student fathers $2,702 $3,424 $4,350 61.0%
Source: IWPR analysis of data from the U.S. Department of Education, National Center for Education Statistics,
National Postsecondary Student Aid Study 2003-04 (NPSAS:04); 2007-08 (NPSAS:08); 2011-12 (NPSAS:12).

22
Table F.2. Average Amount of Unmet Need by Dependency Status,
Parent Status, and Region, 2011-12, in 2012 Dollars. Student parents
Re
gio
n
All s
tud
en
ts
De
pe
nd
en
t
stu
de
nts
Ind
ep
en
de
nt
no
np
are
nts
All p
are
nts
Sin
gle
pa
ren
ts
Ma
rrie
d
pa
ren
ts
New England (CT, ME, MA,
NH, RI, VT) $6,868 $7,596 $5,792 $5,743 $7,036 $4,350
Mid East (DE, DC, MD, NJ,
NY, PA) $5,854 $6,014 $5,609 $5,657 $7,133 $4,032
Great Lakes (IL, IN, MI, OH,
WI) $4,509 $4,155 $4,714 $4,960 $5,685 $3,983
Plains (IA, KS, MN, MO, NE,
ND, SD) $4,317 $3,596 $4,377 $5,334 $5,859 $4,764
Southeast (AL, AR, FL, GA,
KY, LA, MS, NC, SC, TN, VA,
WV)
$4,657 $4,009 $5,142 $5,393 $6,157 $4,447
Southwest (AZ, NM, OK, TX) $4,786 $3,654 $4,589 $6,161 $7,131 $5,090
Rocky Mountains (CO, ID,
MT, UT, WY) $4,474 $4,270 $4,754 $4,489 $6,385 $3,262
Far West (AK, CA, HI, NV,
OR, WA) $5,247 $4,864 $5,206 $6,124 $6,884 $5,166
All Regions $4,985 $4,650 $5,012 $5,571 $6,478 $4,518
Source: IWPR analysis of data from the U.S. Department of Education, National Center for Education Statistics,
National Postsecondary Student Aid Study 2003-04 (NPSAS:04); 2007-08 (NPSAS:08); 2011-12 (NPSAS:12).

23
Appendix G. Student Employment
Table G.1. Share of Students who Work 30 or More Hours per Week by
Dependency Status, Parent Status and Region, 2011-12.
Region All
students
Student
parents
Independent
nonparents
Dependent
students
New England (CT, ME, MA,
NH, RI, VT) 29.3% 49.8% 48.2% 16.4%
Mid East (DE, DC, MD, NJ, NY,
PA) 29.2% 45.6% 45.8% 17.6%
Great Lakes (IL, IN, MI, OH, WI) 33.1% 44.5% 43.0% 22.0%
Plains (IA, KS, MN, MO, NE,
ND, SD) 36.0% 52.8% 47.2% 19.3%
Southeast (AL, AR, FL, GA, KY,
LA, MS, NC, SC, TN, VA, WV) 33.3% 45.9% 44.0% 21.2%
Southwest (AZ, NM, OK, TX) 40.2% 49.3% 48.3% 26.5%
Rocky Mountains (CO, ID, MT,
UT, WY) 37.0% 44.7% 47.3% 24.7%
Far West (AK, CA, HI, NV, OR,
WA) 31.1% 41.6% 41.6% 19.8%
All regions 33.6% 46.4% 44.8% 20.9%
Note: Hours worked excludes Federal Work-Study.
Source: IWPR analysis of data from the U.S. Department of Education, National Center for Education Statistics,
National Postsecondary Student Aid Study 2003-04 (NPSAS:04); 2007-08 (NPSAS:08); 2011-12 (NPSAS:12).

24
Appendix H. Trends in the Availability of On-campus
Child Care
Figure H.1. Share of Two- and Public Four-Year Institutions with
Campus Child Care Centers, 2002-2015
Note: Community colleges are defined as publicly-affiliated institutions granting associate's degrees; four-year
public colleges are defined as publicly-affiliated institutions awarding bachelor's degrees. Includes U.S. mainland
states, U.S. service academies and other U.S. jurisdictions.
Source: IWPR analysis of data from the U.S. Department of Education, National Center for Education Statistics,
Integrated Postsecondary Education Data System (IPEDS), 2002-15 Institutional Characteristics Component (2002-
2013 Final Revised Release; 2014 Provisional Release; 2015 Preliminary Release).
2002 2003 2004 2005 2006 2007 2008 2009 2010 2011 2012 2013 2014 2015
Community colleges 52% 53% 53% 52% 52% 52% 51% 50% 49% 49% 48% 46% 45% 44%
Public four-year institutions 54% 55% 55% 55% 54% 55% 54% 53% 53% 53% 52% 51% 50% 49%
44%
49%
40%
42%
44%
46%
48%
50%
52%
54%
56%

25
References
Attewell, Paul, David Lavin, Thurson Domina, and Tania Levey. 2007. Passing the Torch: Does Higher
Education for the Disadvantaged Pay Off Across the Generations? New York, NY: Russell Sage
Publishers. <https://www.russellsage.org/publications/passing-torch> (accessed June 1, 2016).
Baum, Sandy, Jennifer Ma, and Kathleen Payea. 2013. Education Pays: The Benefits of Higher Education
for Individuals and Society. New York, NY: The College Board.
<http://trends.collegeboard.org/sites/default/files/education-pays-2013-full-report.pdf> (accessed
January 30, 2014).
Boressoff, Todd. 2012. Tools for Student Parent Success: Varieties of Campus Child Care. Report, IWPR
#C393. Washington, DC: Institute for Women’s Policy Research.
<http://www.iwpr.org/publications/pubs/tools-for-student-parent-success-varieties-of-campus-
child-care> (accessed January 25, 2017).
———. 2013. Financing Campus Child Care for College Student Success. Report, IWPR #G719.
Washington, DC: Institute for Women’s Policy Research.
<http://www.iwpr.org/publications/pubs/financing-child-care-for-college-student-success>
(accessed January 25, 2017).
Community College Survey of Student Engagement (CCSSE). 2016. “2016 Community College Survey
of Student Engagement.” Austin, TX: Center for Community College Student Engagement, The
University of Texas at Austin.
Center for Law and Social Policy (CLASP). 2015. “Yesterday’s Non-Traditional Student Is Today’s
Traditional Student.” Washington, D.C.: Center for Law and Social Policy (CLASP).
<http://www.clasp.org/resources-and-publications/publication-1/CPES-Nontraditional-students-
pdf.pdf> (accessed December 21, 2016).
Duke-Benfield, Amy Ellen. 2015. Bolstering Non-Traditional Student Success: A Comprehensive Student
Aid System Using Financial Aid, Public Benefits, and Refundable Tax Credits. Washington, D.C.:
Center for Law and Social Policy (CLASP). <http://www.clasp.org/resources-and-
publications/publication-1/Bolstering-NonTraditional-Student-Success.pdf> (accessed February
16, 2016).
Eckerson, Eleanor, Lauren Talbourdet, Lindsey Reichlin, Mary Sykes, Elizabeth Noll, and Barbara Gault.
2016. “Child Care for Parents in College: A State-by-State Assessment.” Briefing Paper, IWPR
#C445. Washington, DC: Institute for Women’s Policy Research.
<http://iwpr.org/publications/pubs/child-care-for-parents-in-college-a-state-by-state-assessment/>
(accessed December 21, 2016).
Federal Student Aid. 2016. The EFC Formula, 2017-2018. Washington, DC: U.S. Department of
Education. <http://ifap.ed.gov/efcformulaguide/attachments/071416EFCFormulaGuide1718.pdf>
(accessed September 6, 2016).
Gault, Barbara, Elizabeth Noll, and Lindsey Reichlin. forthcoming. “The Family-Friendly Campus
Imperative: Supporting Success Among Community College Students with Children.” Paper
prepared for the Association of Community College Trustees. Washington, DC: Institute for
Women’s Policy Research.
Gault, Barbara, Lindsey Reichlin, Elizabeth Reynolds, and Meghan Froehner. 2014. “4.8 Million College
Students Are Raising Children.” Fact Sheet, IWPR #C424. Washington, DC: Institute for
Women’s Policy Research. <http://www.iwpr.org/publications/pubs/4.8-million-college-students-
are-raising-children> (accessed September 8, 2015).

26
Gault, Barbara, Lindsey Reichlin, and Stephanie Román. 2014. College Affordability for Low-Income
Adults: Improving Returns on Investment for Families and Society. Report, IWPR #C412.
Washington, DC: Institute for Women’s Policy Research.
<http://www.iwpr.org/publications/pubs/college-affordability-for-low-income-adults-improving-
returns-on-investment-for-families-and-society/> (accessed February 19, 2016).
Green, Autumn. 2013. “Babies, Books, and Bootstraps: Low-Income Mothers, Material Hardship, Role
Strain and the Quest for Higher Education.” Doctoral Dissertation, Boston, MA: Boston College.
<Available at http://www.proquest.com/products-services/pqdtglobal.html> (accessed August 11,
2014).
Hartmann, Heidi and Jeff Hayes. 2013. How Education Pays Off for Older Americans. Report, IWPR
#C410. Washington, DC: Institute for Women’s Policy Research.
<http://www.iwpr.org/publications/pubs/how-education-pays-off-for-older-americans> (accessed
December 21, 2016).
Hess, Cynthia, Sylvia Krohn, Lindsey Reichlin, Stephanie Roman, and Barbara Gault. 2014. Securing a
Better Future: A Portrait of Female Students in Mississippi’s Community Colleges. Report,
IWPR #C417. Washington, DC: Institute for Women’s Policy Research and the Women’s
Foundation of Mississippi. <http://www.iwpr.org/publications/pubs/securing-a-better-future-a-
portrait-of-female-students-in-mississippi2019s-community-colleges>.
Huelsman, Mark and Jennifer Engle. 2013. Student Parents and Financial Aid. Working Paper.
Washington, D.C.: Institute for Women’s Policy Research.
<http://www.iwpr.org/initiatives/student-parent-success-initiative/student-parents-and-financial-
aid/view>.
Institute for Women’s Policy Research (IWPR). 2016a. Institute for Women’s Policy Research analysis of
data from the U.S. Department of Education, National Center for Education Statistics, 2011–12
National Postsecondary Student Aid Study (NPSAS:12).
———. 2016b. “Student Parents’ Access to Campus Child Care Continued to Decline in 2015.” Quick
Figure, IWPR #Q051. Washington, DC: Institute for Women’s Policy Research. 12/21/16.
<http://www.iwpr.org/publications/pubs/student-parents2019-access-to-campus-child-care-
continued-to-decline-in-2015> (accessed January 23, 2017).
———. 2016c. IWPR analysis of data from the U.S. Department of Education, National Center for
Education Statistics, 2011-12 National Postsecondary Student Aid Study (NPSAS: 12); Integrated
Postsecondary Education Data System (IPEDS), Fall Enrollment 2003-04 and 2011-12.
———. 2016d. IWPR analysis of data from the U.S. Department of Education, National Center for
Education Statistics, National Postsecondary Student Aid Study 2003-04 (NPSAS:04); 2007-08
(NPSAS:08); 2011-12 (NPSAS: 12), and Integrated Postsecondary Education Data System
(IPEDS) Institutional Characteristics and Fall Enrollment 2003-04, 2007-08, 2011-12.
———. 2016e. IWPR analysis of data from the U.S. Department of Education, National Center for
Education Statistics, 2003-04 Beginning Postsecondary Students Longitudinal Study, Second
Follow-up (BPS:04/09).
———. 2016f. IWPR analysis of data from the U.S. Department of Education, National Center for
Education Statistics, 2003-04 (NPSAS:04); 2007-08 (NPSAS:08); 2011-12 (NPSAS: 12).
———. 2016g. IWPR analysis of data from the U.S. Department of Education, National Center for
Education Statistics, Integrated Postsecondary Education Data System (IPEDS), 2002-15

27
Institutional Characteristics Component (2002-2013 Final Revised Release; 2014 Provisional
Release; 2015 Preliminary Release).
Johnson, Jean, Jon Rochkind, Amber N. Ott, and Samantha DuPont. 2009. With Their Whole Lives Ahead
of Them: Myths and Realities About Why So Many Students Fail to Finish College. New York,
NY: Public Agenda. <http://www.publicagenda.org/files/theirwholelivesaheadofthem.pdf>
(accessed December 28, 2015).
Kuh, George D., Jillian Kinzie, Ty Cruce, Rick Shoup, and Robert M. Gonyea. 2007. Connecting the
Dots: Multi-Faceted Analyses of the Relationships between Student Engagement Results from the
NSSE, and the Institutional Practices and Conditions That Foster Student Success. Bloomington,
IN: Center for Postsecondary Research.
<http://nsse.indiana.edu/pdf/Connecting_the_Dots_Report.pdf> (accessed February 2, 2016).
Long, Bridget T. 2014. “The Financial Crisis and College Enrollment: How Have Students and Their
Families Responded?” In How the Financial Crisis and Great Recession Affected Higher
Education, ed. Jeffery R. Brown and Caroline M. Hoxby, 209 – 233. Chicago, IL: University of
Chicago Press. <http://www.nber.org/chapters/c12862.pdf> (accessed December 21, 2016).
Magnuson, Katherine. 2007. “Maternal Education and Children’s Academic Achievement during Middle
Childhood.” Developmental Psychology 43 (6): 1497–1512.
Monroe Community College. 2013. “Campus Child Care Center & Student Outcomes.” Inside IR 4 (2): 3.
<http://www.monroecc.edu/depts/research/documents/Spring2013Newsletterfinal_000.pdf>
(accessed January 23, 2017).
Orozco, Viany and Nancy K. Cauthen. 2009. Work Less, Study More, & Succeed: How Financial
Supports Can Improve Postsecondary Success. New York, NY: Demos.
<http://www.demos.org/sites/default/files/publications/WorkLessStudyMore_Demos.pdf>
(accessed December 22, 2016).
Schumacher, Rachel. 2015. Prepping Colleges for Parents: Strategies for Supporting Student Parent
Success in Postsecondary Education. Working Paper, IWPR #C406. Washington, DC: Institute
for Women’s Policy Research. <http://www.iwpr.org/publications/pubs/prepping-colleges-for-
parents-strategies-for-supporting-student-parent-success-in-postsecondary-education> (accessed
January 25, 2017).
U.S. Department of Education. 2015a. “Demographic and Enrollment Characteristics of Nontraditional
Undergraduates: 2011–12.” Washington, DC: U.S. Department of Education, National Center for
Education Statistics. <http://nces.ed.gov/pubs2015/2015025.pdf> (accessed December 21, 2016).
———. 2015b. “Table 306.20. Total Fall Enrollment in Degree-Granting Postsecondary Institutions, by
Level and Control of Institution and Race/ethnicity of Student: Selected Years, 1976 through
2014.” Washington, DC: U.S. Department of Education, National Center for Education Statistics,
Higher Education General Information Survey (HEGIS).
<https://nces.ed.gov/programs/digest/d15/tables/dt15_306.20.asp?current=yes> (accessed January
24, 2017).