Embed Size (px)
Citation preview
1
Trends in Asset Allocation
February 22, 2012
Dan Farley, CFACIO – Investment Solutions
2
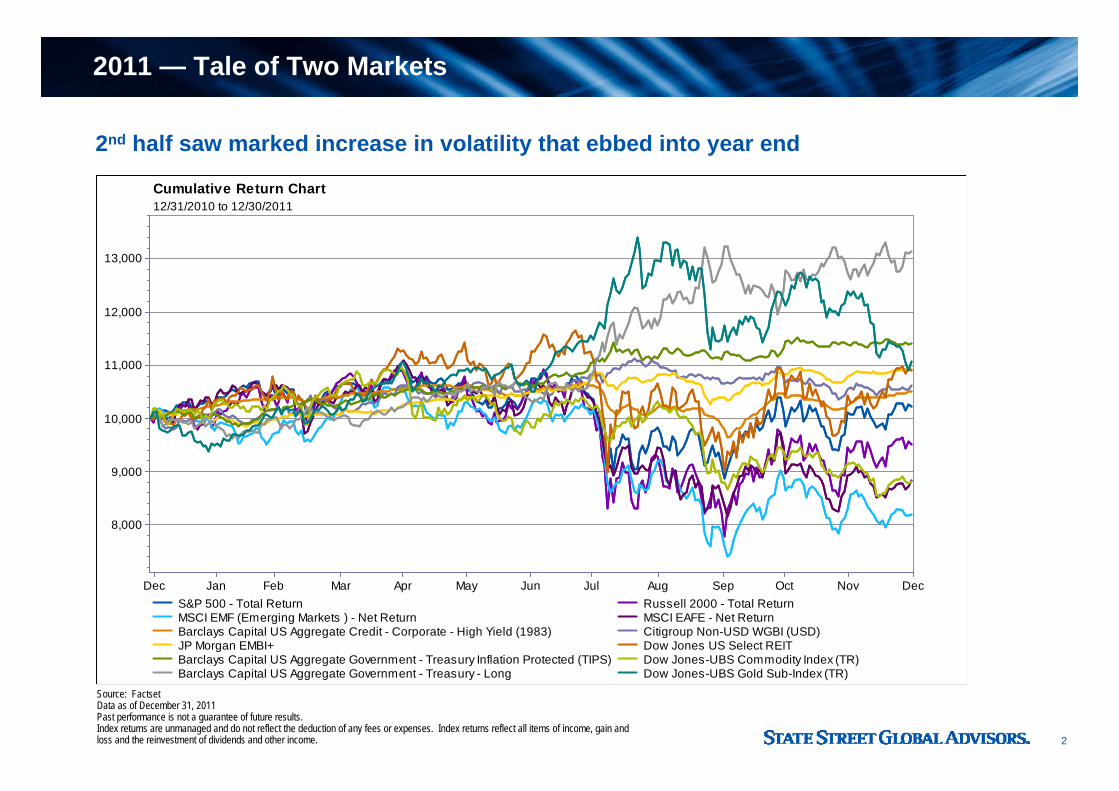
2011 — Tale of Two Markets
Source: Factset Data as of December 31, 2011Past performance is not a guarantee of future results.Index returns are unmanaged and do not reflect the deduction of any fees or expenses. Index returns reflect all items of income, gain and loss and the reinvestment of dividends and other income.
2nd half saw marked increase in volatility that ebbed into year end
Dec Jan Feb Mar Apr May Jun Jul Aug Sep Oct Nov Dec
8,000
9,000
10,000
11,000
12,000
13,000
Cumulative Return Chart12/31/2010 to 12/30/2011
S&P 500 - Total Return Russell 2000 - Total ReturnMSCI EMF (Emerging Markets ) - Net Return MSCI EAFE - Net ReturnBarclays Capital US Aggregate Credit - Corporate - High Yield (1983) Citigroup Non-USD WGBI (USD)JP Morgan EMBI+ Dow Jones US Select REITBarclays Capital US Aggregate Government - Treasury Inflation Protected (TIPS) Dow Jones-UBS Commodity Index (TR)Barclays Capital US Aggregate Government - Treasury - Long Dow Jones-UBS Gold Sub-Index (TR)
3
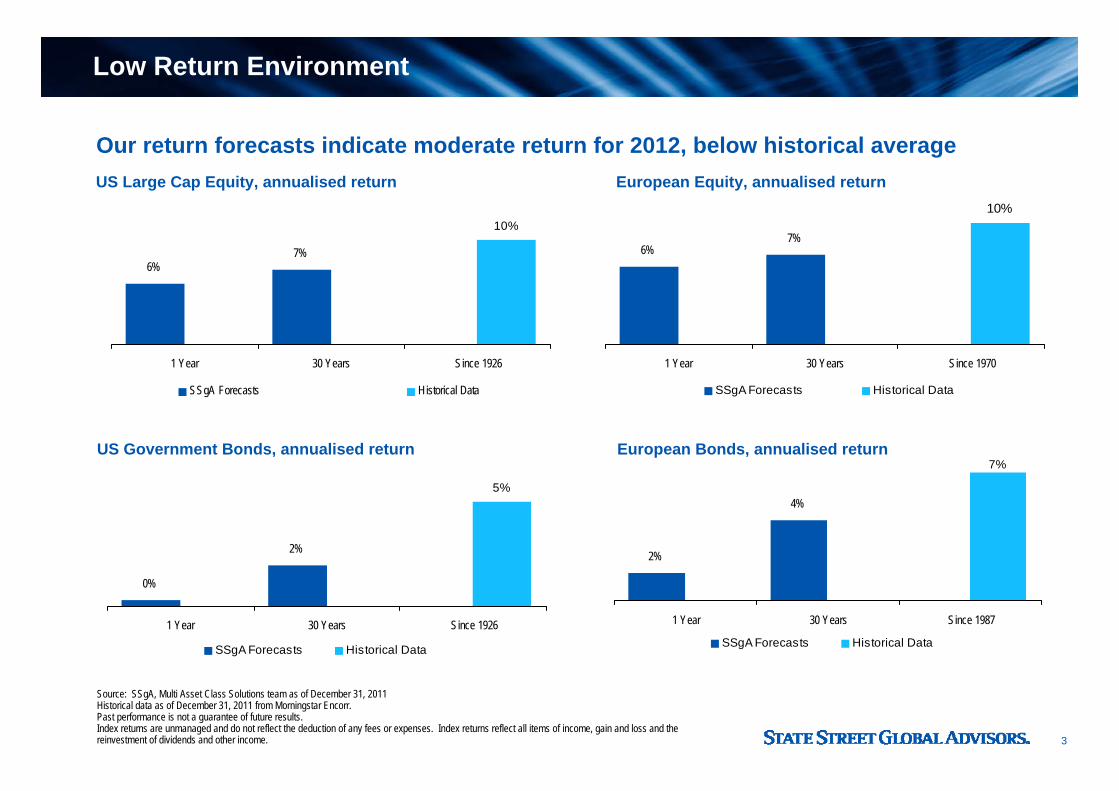
Low Return Environment
Source: SSgA, Multi Asset Class Solutions team as of December 31, 2011Historical data as of December 31, 2011 from Morningstar Encorr.Past performance is not a guarantee of future results.Index returns are unmanaged and do not reflect the deduction of any fees or expenses. Index returns reflect all items of income, gain and loss and the reinvestment of dividends and other income.
Our return forecasts indicate moderate return for 2012, below historical average
6%7%
10%
1 Year 30 Years Since 1926
SSgA Forecasts Historical Data
6%7%
10%
1 Year 30 Years Since 1970
SSgA Forecasts Historical Data
0%
2%
5%
1 Year 30 Years Since 1926
SSgA Forecasts Historical Data
2%
4%
7%
1 Year 30 Years Since 1987
SSgA Forecasts Historical Data
US Government Bonds, annualised return European Bonds, annualised return
US Large Cap Equity, annualised return European Equity, annualised return
4
Trends in Asset Allocation
• Risk Management– How to limit downside and avoid left tail risk– Looking to deliver more consistent return distributions– Regulatory environment– Liability hedging– Can traditional portfolio modelling properly estimate downside risk?
• Living in a lower return world– Impact of de-risking and increased fixed income allocations– Lower overall estimates for capital markets– Can active management bridge the gap?
• Alternative view to portfolio allocation– Move away from asset classes and towards portfolio risks– Aligns goals for diversification to economic risk rather than a volatility estimate– No standard definition of the risks or what assets fit in each category
– OK for more sophisticated plans that can customise– Difficult to apply an “off the shelf” approach for less sophisticated plans
5
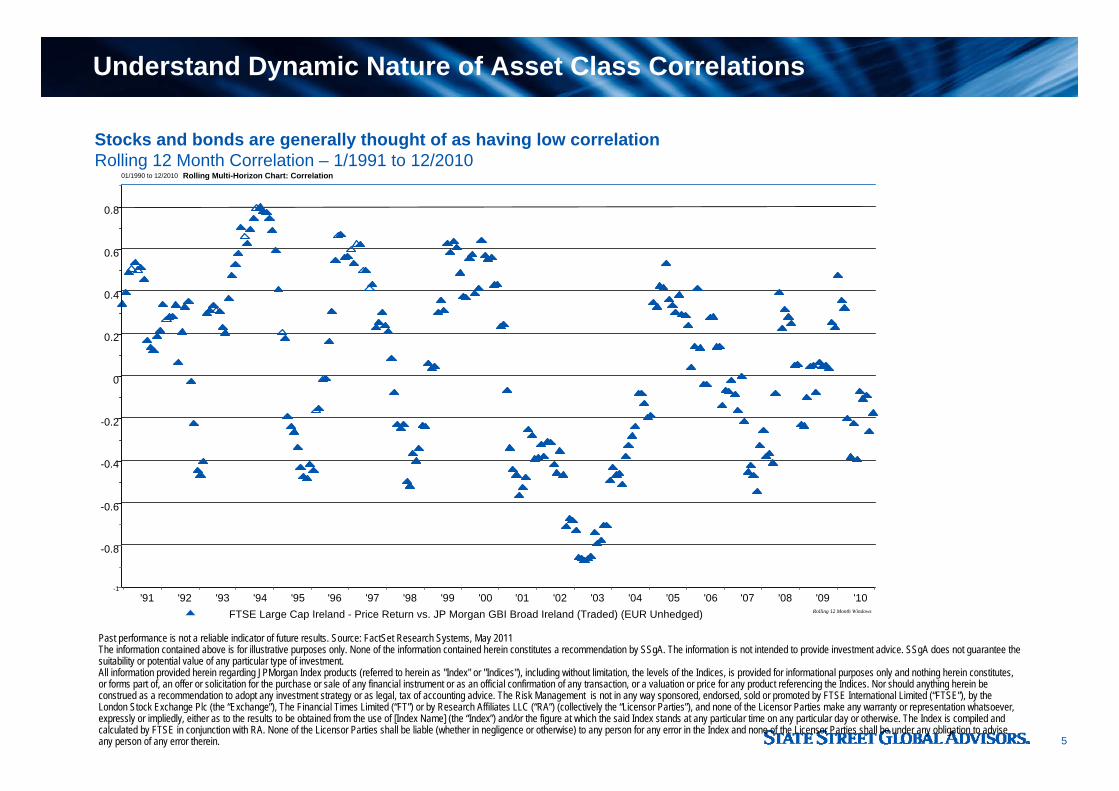
Understand Dynamic Nature of Asset Class Correlations
Stocks and bonds are generally thought of as having low correlationRolling 12 Month Correlation – 1/1991 to 12/2010
Past performance is not a reliable indicator of future results. Source: FactSet Research Systems, May 2011The information contained above is for illustrative purposes only. None of the information contained herein constitutes a recommendation by SSgA. The information is not intended to provide investment advice. SSgA does not guarantee the suitability or potential value of any particular type of investment.All information provided herein regarding JPMorgan Index products (referred to herein as "Index" or "Indices"), including without limitation, the levels of the Indices, is provided for informational purposes only and nothing herein constitutes, or forms part of, an offer or solicitation for the purchase or sale of any financial instrument or as an official confirmation of any transaction, or a valuation or price for any product referencing the Indices. Nor should anything herein be construed as a recommendation to adopt any investment strategy or as legal, tax of accounting advice. The Risk Management is not in any way sponsored, endorsed, sold or promoted by FTSE International Limited (“FTSE”), by the London Stock Exchange Plc (the “Exchange”), The Financial Times Limited (“FT”) or by Research Affiliates LLC (“RA”) (collectively the “Licensor Parties”), and none of the Licensor Parties make any warranty or representation whatsoever, expressly or impliedly, either as to the results to be obtained from the use of [Index Name] (the “Index”) and/or the figure at which the said Index stands at any particular time on any particular day or otherwise. The Index is compiled and calculated by FTSE in conjunction with RA. None of the Licensor Parties shall be liable (whether in negligence or otherwise) to any person for any error in the Index and none of the Licensor Parties shall be under any obligation to advise any person of any error therein.
'91 '92 '93 '94 '95 '96 '97 '98 '99 '00 '01 '02 '03 '04 '05 '06 '07 '08 '09 '10-1
-0.8
-0.6
-0.4
-0.2
0
0.2
0.4
0.6
0.8
Rolling 12 Month Windows
Rolling Multi-Horizon Chart: Correlation01/1990 to 12/2010
FTSE Large Cap Ireland - Price Return vs. JP Morgan GBI Broad Ireland (Traded) (EUR Unhedged)
6
A Fresh Look at Portfolio Allocation
• Reset expectation on the value of diversification– Historical correlations may not be the best guide
• Own assets that provide true diversification benefits– Global Equity– Real Assets– Alternatives
• Portfolios need meaningful allocations to diversifying asset classes
• Review manager style to blend convergent and divergent approaches
• Consider alternative portfolio construction using traditional asset classes– Managed Volatility– Dynamic Asset Allocation
7
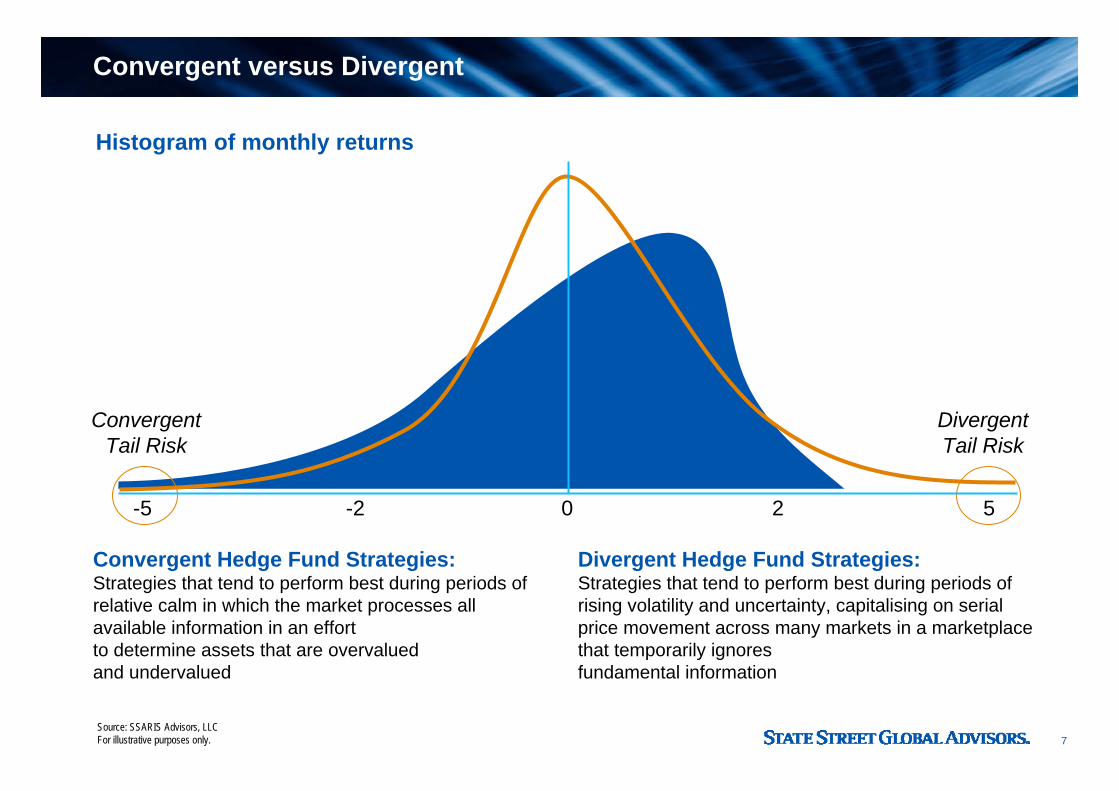
Convergent versus Divergent
Source: SSARIS Advisors, LLCFor illustrative purposes only.
-5 -2 0 2 5
ConvergentTail Risk
DivergentTail Risk
Convergent Hedge Fund Strategies:Strategies that tend to perform best during periods of relative calm in which the market processes all available information in an effort to determine assets that are overvalued and undervalued
Divergent Hedge Fund Strategies:Strategies that tend to perform best during periods of rising volatility and uncertainty, capitalising on serial price movement across many markets in a marketplace that temporarily ignores fundamental information
Histogram of monthly returns
8
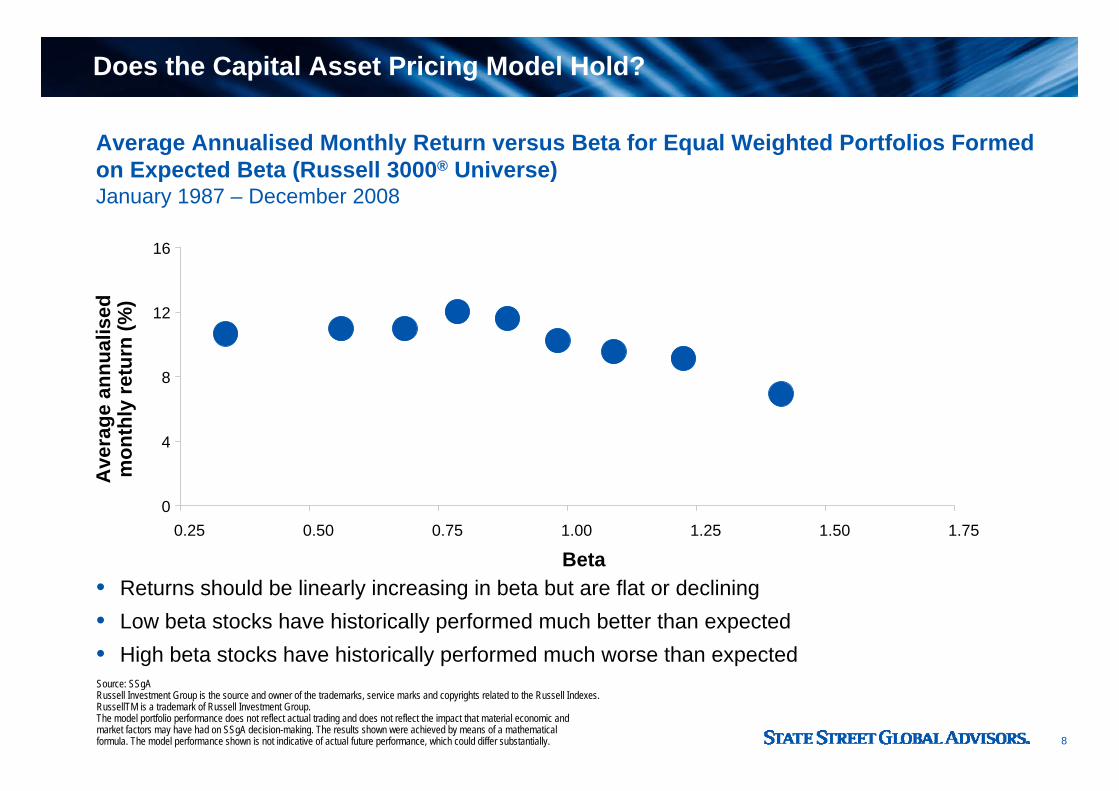
Does the Capital Asset Pricing Model Hold?
Average Annualised Monthly Return versus Beta for Equal Weighted Portfolios Formedon Expected Beta (Russell 3000® Universe) January 1987 – December 2008
Source: SSgARussell Investment Group is the source and owner of the trademarks, service marks and copyrights related to the Russell Indexes.RussellTM is a trademark of Russell Investment Group.The model portfolio performance does not reflect actual trading and does not reflect the impact that material economic and market factors may have had on SSgA decision-making. The results shown were achieved by means of a mathematical formula. The model performance shown is not indicative of actual future performance, which could differ substantially.
• Returns should be linearly increasing in beta but are flat or declining• Low beta stocks have historically performed much better than expected• High beta stocks have historically performed much worse than expected
Ave
rage
ann
ualis
edm
onth
ly re
turn
(%)
Beta
0
4
8
12
16
0.25 0.50 0.75 1.00 1.25 1.50 1.75
9
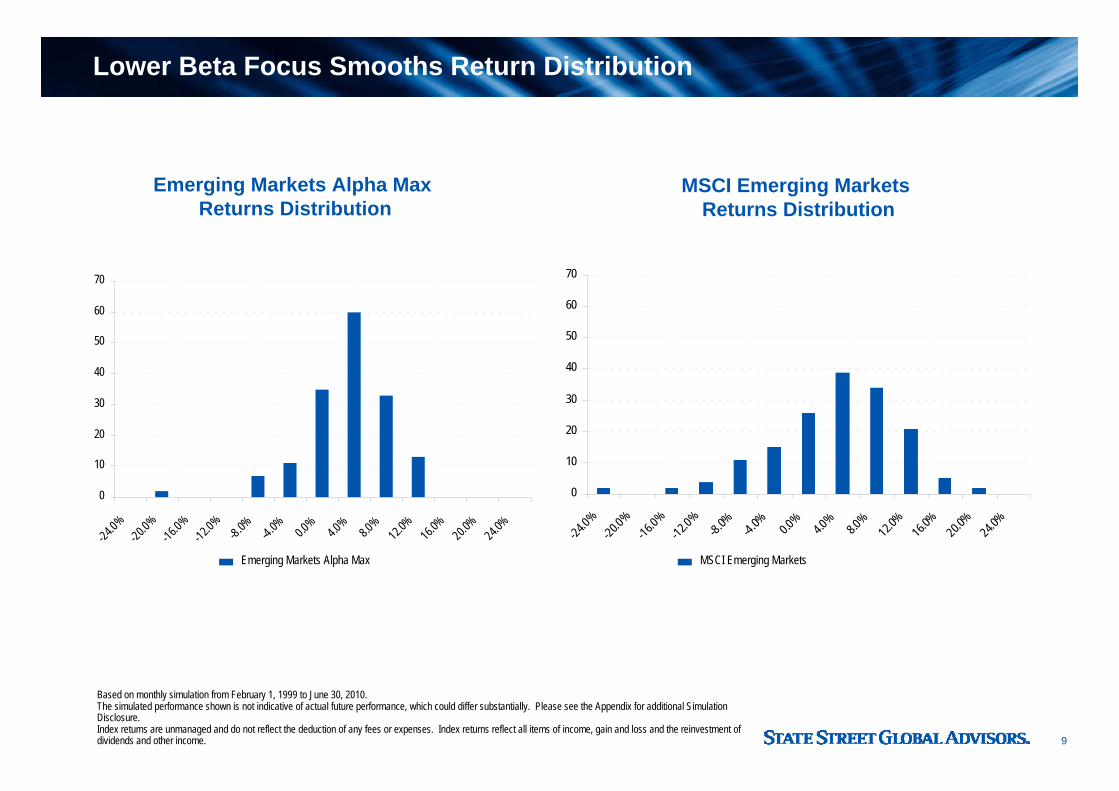
Lower Beta Focus Smooths Return Distribution
MSCI Emerging Markets Returns Distribution
Emerging Markets Alpha Max Returns Distribution
Based on monthly simulation from February 1, 1999 to June 30, 2010.The simulated performance shown is not indicative of actual future performance, which could differ substantially. Please see the Appendix for additional Simulation Disclosure. Index returns are unmanaged and do not reflect the deduction of any fees or expenses. Index returns reflect all items of income, gain and loss and the reinvestment of dividends and other income.
0
10
20
30
40
50
60
70
-24.0%
-20.0%
-16.0%
-12.0% -8.0% -4.0% 0.0%
4.0%
8.0%
12.0%
16.0%
20.0%
24.0%
0
10
20
30
40
50
60
70
-24.0%
-20.0%
-16.0%
-12.0%
-8.0% -4.0% 0.0%
4.0%
8.0%12.0
%16.0
%20.0
%24.0
%
Emerging Markets Alpha Max MSCI Emerging Markets
10
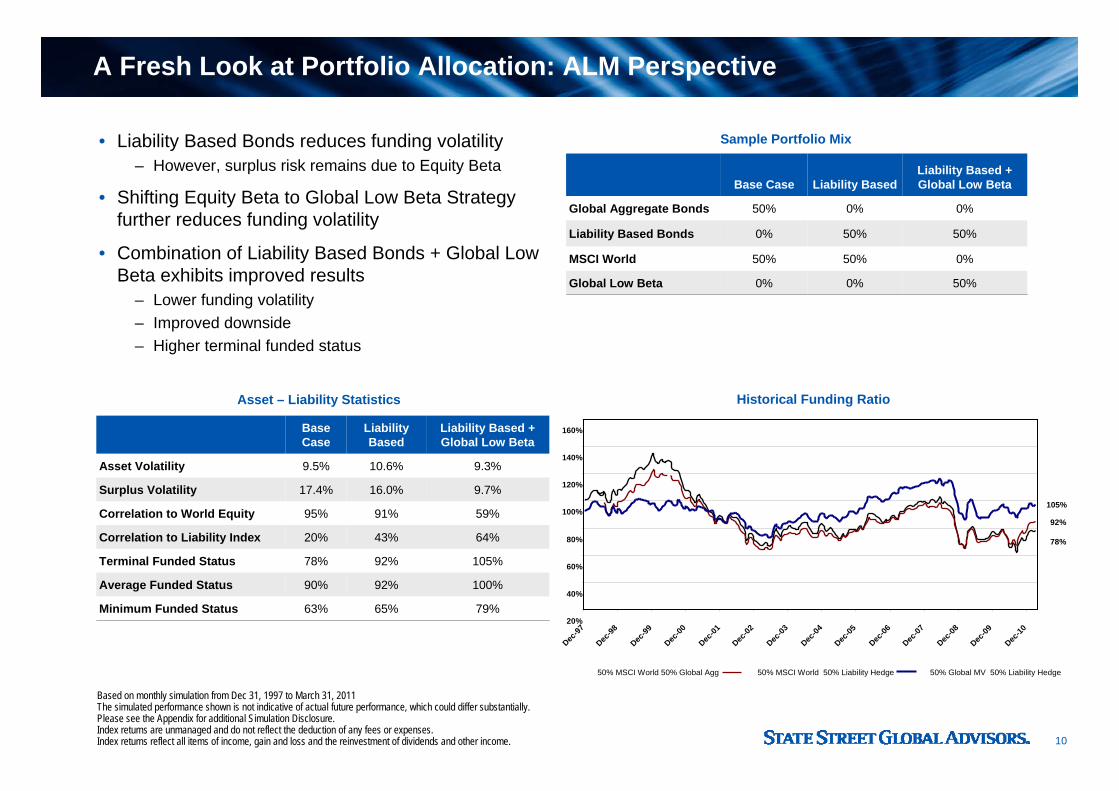
A Fresh Look at Portfolio Allocation: ALM Perspective
• Liability Based Bonds reduces funding volatility– However, surplus risk remains due to Equity Beta
• Shifting Equity Beta to Global Low Beta Strategy further reduces funding volatility
• Combination of Liability Based Bonds + Global Low Beta exhibits improved results
– Lower funding volatility– Improved downside– Higher terminal funded status
0%
50%
50%
0%
Liability Based
50%
0%
50%
0%
Liability Based + Global Low Beta
50%MSCI World
0%Global Low Beta
50%Global Aggregate Bonds
0%Liability Based Bonds
Base Case
Based on monthly simulation from Dec 31, 1997 to March 31, 2011The simulated performance shown is not indicative of actual future performance, which could differ substantially. Please see the Appendix for additional Simulation Disclosure. Index returns are unmanaged and do not reflect the deduction of any fees or expenses. Index returns reflect all items of income, gain and loss and the reinvestment of dividends and other income.
79%65%63%Minimum Funded Status
105%92%78%Terminal Funded Status
100%92%90%Average Funded Status
59%91%95%Correlation to World Equity
64%43%20%Correlation to Liability Index
16.0%
10.6%
Liability Based
9.7%
9.3%
Liability Based + Global Low Beta
9.5%Asset Volatility
17.4%Surplus Volatility
Base Case
Asset – Liability Statistics
Sample Portfolio Mix
Historical Funding Ratio
78%
92%
105%
20%
40%
60%
80%
100%
120%
140%
160%
Dec-97
Dec-98
Dec-99
Dec-00
Dec-01
Dec-02
Dec-03
Dec-04
Dec-05
Dec-06
Dec-07
Dec-08
Dec-09
Dec-10
50% MSCI World 50% Global Agg 50% MSCI World 50% Liability Hedge 50% Global MV 50% Liability Hedge
11
Opportunities Going Forward
• Focus on areas of market with the best potential for returns going forward
• Review for a meaningful allocation to global equity– Emerging Markets (Traditional and Frontier)– Global ex US Small Cap (Developed and Emerging)
– Gain exposure to faster growing companies
• Dynamic Asset Allocation– Driven by changing circumstances of the investor
– Proactive plan to change allocation as investors achieve certain milestones– Driven by changing market environment
– Ability to assess overall asset mix relative to current market conditions– Potential to improve overall returns as well as reduce risk– Often diversified source of alpha relative to other strategies
12
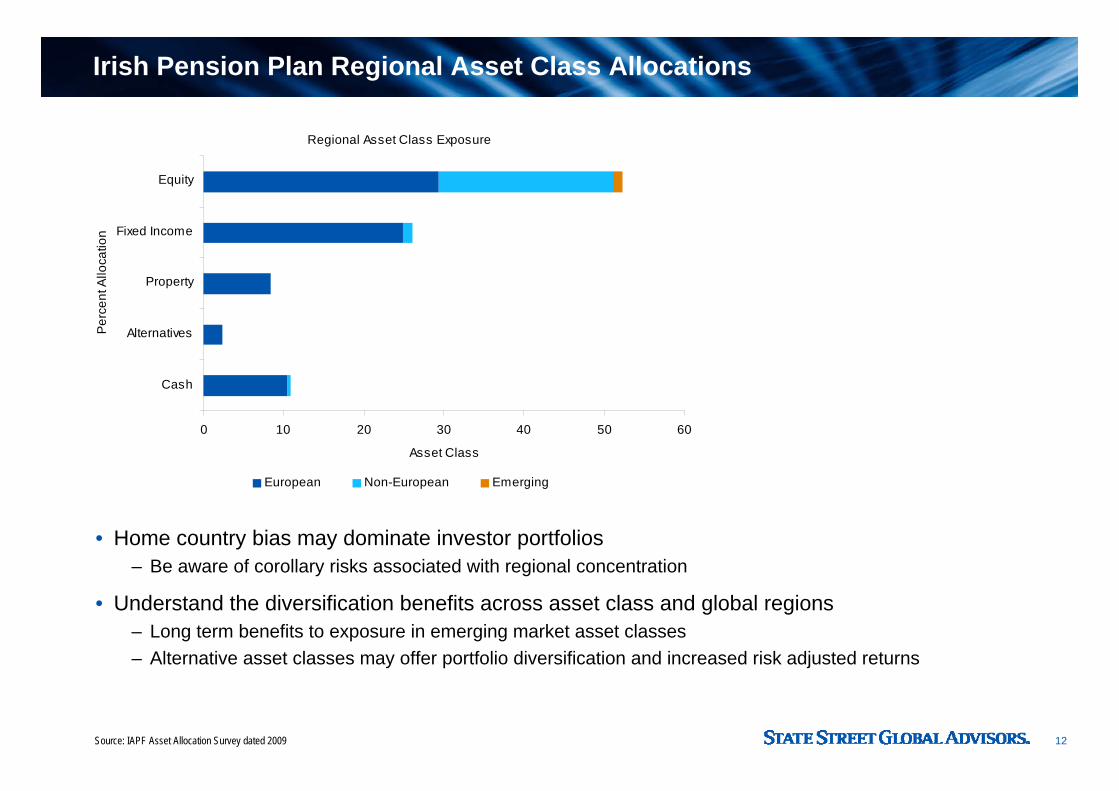
Irish Pension Plan Regional Asset Class Allocations
Regional Asset Class Exposure
0 10 20 30 40 50 60
Cash
Alternatives
Property
Fixed Income
Equity
Per
cent
Allo
catio
n
Asset Class
European Non-European Emerging
• Home country bias may dominate investor portfolios– Be aware of corollary risks associated with regional concentration
• Understand the diversification benefits across asset class and global regions– Long term benefits to exposure in emerging market asset classes– Alternative asset classes may offer portfolio diversification and increased risk adjusted returns
Source: IAPF Asset Allocation Survey dated 2009
13
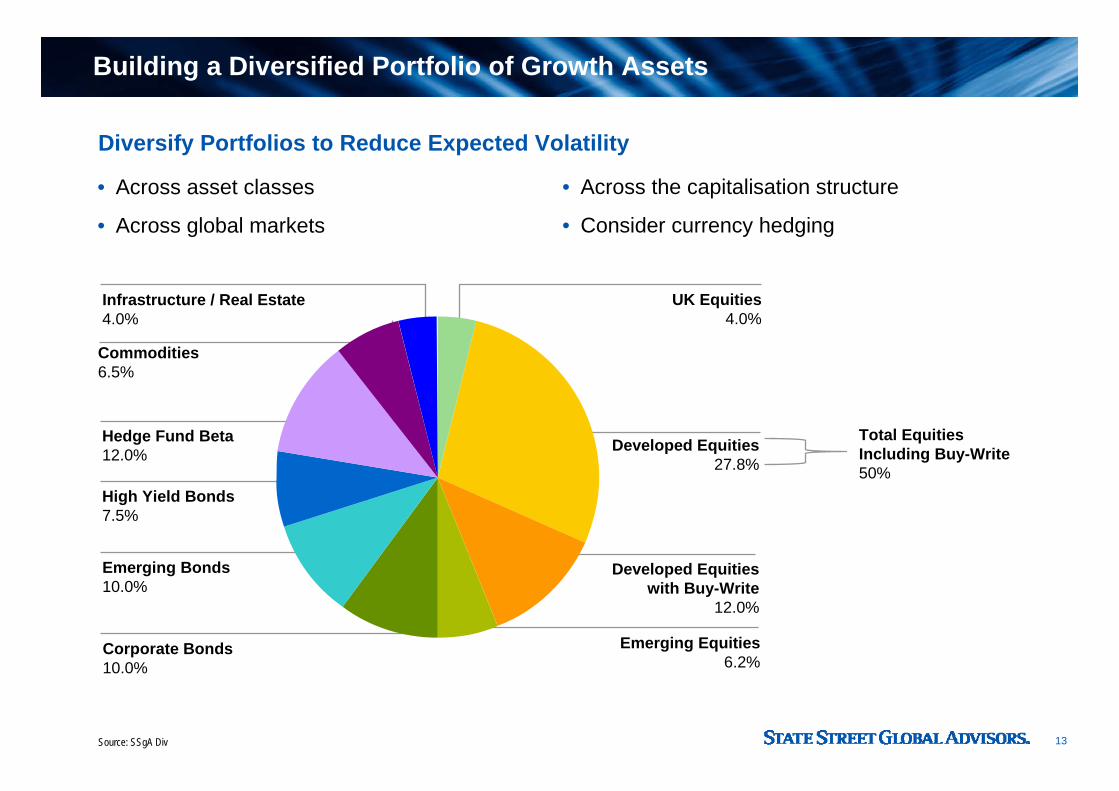
Total Equities Including Buy-Write50%
• Across asset classes
• Across global markets
Building a Diversified Portfolio of Growth Assets
Source: SSgA Div
Diversify Portfolios to Reduce Expected Volatility
• Across the capitalisation structure
• Consider currency hedging
Developed Equities27.8%
Corporate Bonds10.0%
Emerging Bonds10.0%
High Yield Bonds7.5%
Hedge Fund Beta12.0%
Commodities6.5%
Infrastructure / Real Estate4.0%
UK Equities4.0%
Developed Equities with Buy-Write
12.0%
Emerging Equities6.2%
14
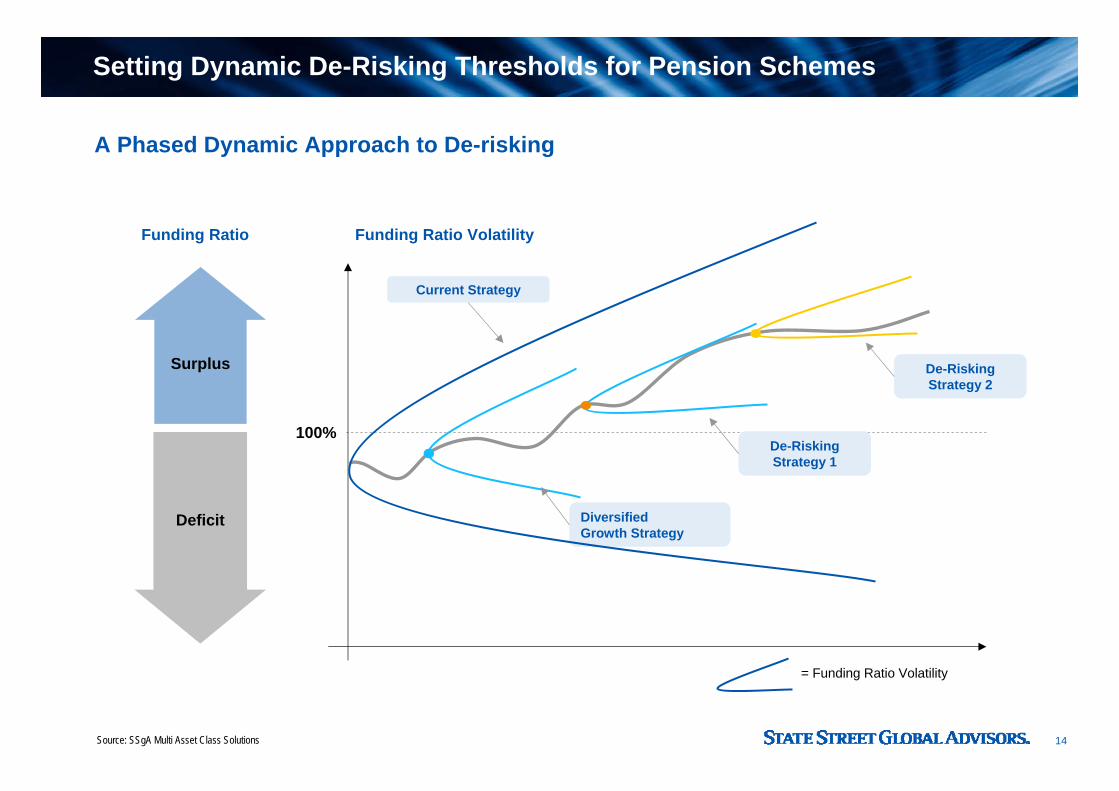
Diversified Growth Strategy
Source: SSgA Multi Asset Class Solutions
Funding Ratio
Surplus
Deficit
Funding Ratio Volatility
Current Strategy
De-Risking Strategy 1
A Phased Dynamic Approach to De-risking
De-Risking Strategy 2
100%
= Funding Ratio Volatility
Setting Dynamic De-Risking Thresholds for Pension Schemes
15
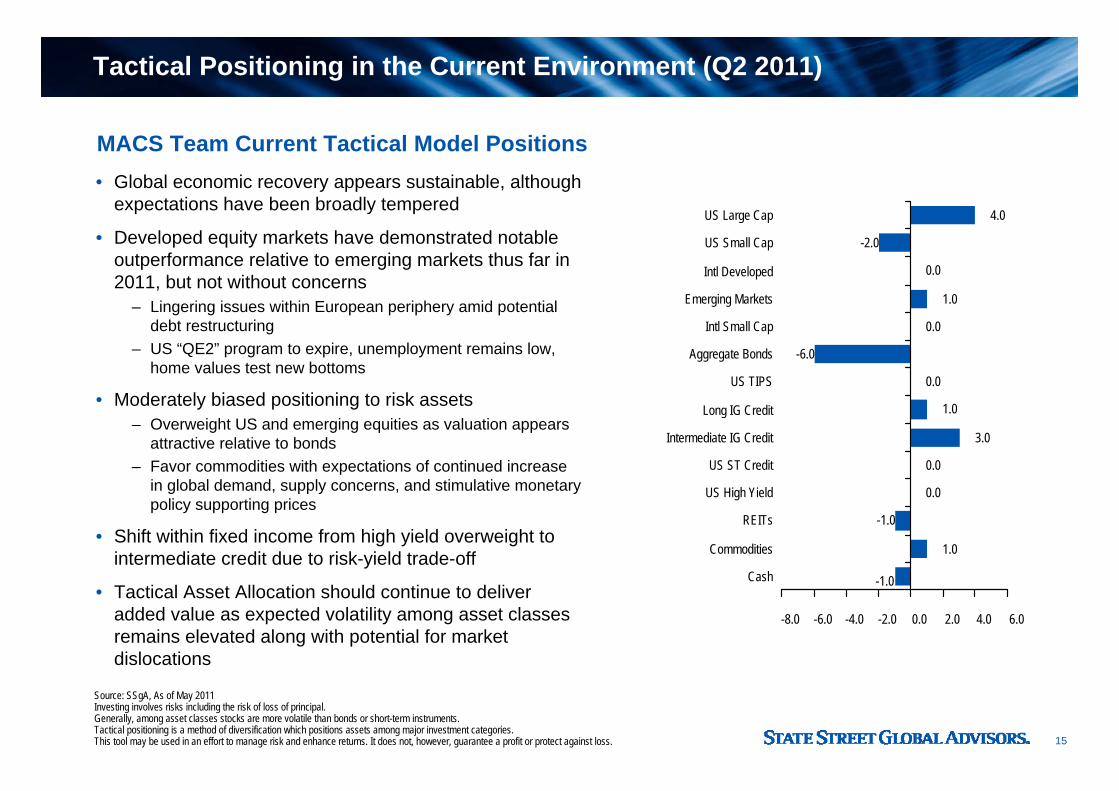
MACS Team Current Tactical Model Positions
Source: SSgA, As of May 2011Investing involves risks including the risk of loss of principal.Generally, among asset classes stocks are more volatile than bonds or short-term instruments.Tactical positioning is a method of diversification which positions assets among major investment categories.This tool may be used in an effort to manage risk and enhance returns. It does not, however, guarantee a profit or protect against loss.
• Global economic recovery appears sustainable, although expectations have been broadly tempered
• Developed equity markets have demonstrated notable outperformance relative to emerging markets thus far in 2011, but not without concerns
– Lingering issues within European periphery amid potential debt restructuring
– US “QE2” program to expire, unemployment remains low, home values test new bottoms
• Moderately biased positioning to risk assets– Overweight US and emerging equities as valuation appears
attractive relative to bonds– Favor commodities with expectations of continued increase
in global demand, supply concerns, and stimulative monetary policy supporting prices
• Shift within fixed income from high yield overweight to intermediate credit due to risk-yield trade-off
• Tactical Asset Allocation should continue to deliver added value as expected volatility among asset classes remains elevated along with potential for market dislocations
1.0
-1.0
0.0
0.0
3.0
1.0
0.0
-6.0
0.0
1.0
0.0
-2.0
4.0
-1.0
-8.0 -6.0 -4.0 -2.0 0.0 2.0 4.0 6.0
Cash
Commodities
REITs
US High Yield
US ST Credit
Intermediate IG Credit
Long IG Credit
US TIPS
Aggregate Bonds
Intl Small Cap
Emerging Markets
Intl Developed
US Small Cap
US Large Cap
Tactical Positioning in the Current Environment (Q2 2011)
16
Managing through Trustee Challenges
• Trustees need to take a different approach to risk– Adopt new approaches to controlling volatility– Diversification works over time, not all the time
• Have a clear objective and plan how to reach it– Consider non-traditional strategies to create optimal solutions to overall goals
• Balance need to control risk with the need to generate returns
Appendix: Important Disclosures
18
Emerging Markets Alpha Max Performance:Returns are simulated from February 1, 1999 to September 30, 2010 and assume 150bp transaction costs each way. Turnover was limited to approximately 60% annually (one-way), with monthly rebalancing.
The results shown do not represent the results of actual trading using client assets but were achieved by means of the retroactive application of a model that was designed with the benefit of hindsight. The simulated performance was compiled after the end of the period depicted and does not represent the actual investment decisions of the advisor. These results do not reflect the effect of material economic and market factors on decision making.
The simulated performance data is reported on a gross of fees basis, but net of administrative costs. Additional fees, such as the advisory fee, would reduce the return. For example, if an annualized gross return of 10% was achieved over a 5-year period and a management fee of 1% per year was charged and deducted annually, then the resulting return would be reduced from 61% to 54%. The performance includes the reinvestment of dividends and other corporate earnings and is calculated in US dollars.
The simulated performance is not necessarily indicative of future performance, which could differ substantially. The benchmark used is the MSCI Emerging Markets Index, net return. Prior to January 2001, the benchmark is calculated on a gross basis, as MSCI did not furnish official net returns before 2001. Prior to January 2004, the index was known as the MSCI EM Free Index. The index returns are unmanaged and do not reflect the deduction of any fees or expenses. The index returns reflect all items of income, gain and loss and the reinvestment of dividends and other income. All trademarks are property of their respective owners.
The strategy described may be executed in a commingled fund managed by SSgA which is not insured by the FDIC or by another governmental agency; it is not an obligation of the FDIC nor is it a deposit or obligation of or guaranteed by State Street Bank and Trust Company. All SSgA commingled funds pay State Street Bank and Trust Company for services as custodian, transfer agent, and shareholder servicing agent and may pay affiliates of State Street Bank and Trust Company for investment advisory services.
Not all products will be available to all investors, please contact SSgA for further information regarding this strategy.
The performance information should not be shown without these accompanying notes.
Emerging Markets Alpha Max Simulation Footnotes
19
Backtest Creation:The testing methodology used the Barra GEM optimization model to generate historical portfolios. The data used was only that data which would have been available at the time when the historical portfolios were generated, not what is available now. These processes help to eliminate various forms of survivorship bias, both in terms of a “smarter model” and in terms of making decisions based on information that was not available at the time.
Monthly portfolios were created, and returns are the result of a buy and hold assumption on each of these portfolios. Transaction costs were assumed as stated above.
This Emerging Markets Managed Volatility process was backtested in March 2009.
Emerging Markets Alpha Max Simulation Footnotes

20
Disclaimer
State Street Global Advisors Ireland Limited is regulated by the Central Bank of Ireland. Incorporated and registered in Ireland at Two Park Place, Upper Hatch Street, Dublin 2.Registered number 145221. Member of the Irish Association of Investment Managers.The whole or any part of this work may not be reproduced, copied or transmitted or any of its contents disclosed to third parties without SSgA's express written consent.Asset Allocation may be used in an effort to manage risk and enhance returns. It does not, however, guarantee a profit or protect against loss.Diversification does not ensure a profit or guarantee against loss.This material is solely for the private use of SSgA clients and is not intended for public dissemination.The value of investments can fall as well as rise. Past performance may not be a reliable guide to future performance.All information has been obtained from sources believed to be reliable, but its accuracy is not guaranteed. There is no representation or warranty as to the current accuracy,reliability or completeness of, nor liability for, decisions based on such information and it should not be relied on as such.Investing involves risk including the risk of loss of principal.Investing in foreign domiciled securities may involve risk of capital loss from unfavorable fluctuation in currency values, withholding taxes, from differences in generally accepted accounting principles or from economic or political instability in other nations. Investments in emerging or developing markets may be more volatile and less liquid than investing in developed markets and may involve exposure to economic structures that are generally less diverse and mature and to political systems which have less stability than those of more developed countries.Risk associated with equity investing include stock values which may fluctuate in response to the activities of individual companies and general market and economic conditions.Investing in commodities entail significant risk and is not appropriate for all investors. Although bonds generally present less short-term risk and volatility than stocks, bonds contain interest rate risks; the risk of issuer default; and inflation risk.Increase in real interest rates can cause the price of inflation-protected debt securities to decrease. Interest payments on inflation-protected debt securities can be unpredictable. Investing in high yield fixed income securities, otherwise known as junk bonds is considered speculative and involves greater risk of loss of principal and interest than investing in investment grade fixed income securities.© 2012 State Street Corporation - All Rights Reserved
21
Trademark Attribution Disclosure
Standard & Poor's (S&P) 500 Index is a registered trademark of Standard & Poor's Financial Services LLC.
Source: MSCI. Neither MSCI nor any other party involved in or related to compiling, computing or creating the MSCI data makes any express or implied warranties or representations with respect to such data (or the results to be obtained by the use thereof), and all such parties hereby expressly disclaim all warranties of originality, accuracy, completeness, merchantability or fitness for a particular purpose with respect to any of such data. Without limiting any of the foregoing, in no event shall MSCI, any of its affiliates or any third party involved in or related to compiling, computing or creating the data have any liability for any direct, indirect, special, punitive, consequential or any other damages (including lost profits) even if notified of the possibility of such damages. No further distribution or dissemination of the MSCI data is permitted without MSCI’s express written consent.
All information provided herein regarding JPMorgan Index products (referred to herein as "Index" or "Indices"), including without limitation, the levels of the Indices, is provided for informational purposes only and nothing herein constitutes, or forms part of, an offer or solicitation for the purchase or sale of any financial instrument or as an official confirmation of any transaction, or a valuation or price for any product referencing the Indices. Nor should anything herein be construed as a recommendation to adopt any investment strategy or as legal, tax of accounting advice.
Subscriber agrees that it will not without Barclay’s prior written consent, cause or permit such information to be redisseminated, recirculated or transmitted in any form to third parties or to affiliated companies or branch offices of Subscriber.
Russell Investment Group is the source and owner of the trademarks, service marks and copyrights related to the Russell Indexes. Russell 2000 ® is a trademark of Russell Investment Group.
“The MSCI EAFE is a trademark of MSCI Inc.”
CITIGROUP is a registered trademark and service mark of Citigroup Inc. or its affiliates and is used and registered throughout the world. The Citigroup non-USD WGBI (“Index”) is owned and maintained by Citigroup Index LLC (“Citigroup”). © Citigroup Index LLC 2004-2006. All rights reserved.
Dow Jones, US Select REIT SM," are service marks of Dow Jones & Company, Inc. and have been licensed for use for certain purposes by State Street Global Advisors (SSgA).
Dow Jones, UBS Commodity Index," are service marks of Dow Jones & Company, Inc. and have been licensed for use for certain purposes by State Street Global Advisors (SSgA).
Dow Jones, UBS Gold Sub-Index SM," are service marks of Dow Jones & Company, Inc. and have been licensed for use for certain purposes by State Street Global Advisors (SSgA).
“FTSE®”, “FT-SE®” and “Footsie®” are trade marks jointly owned by the London Stock Exchange Plc and The Financial Times Limited and are used by FTSE International Limited (“FTSE”) under license. “All-World”, “All-Share” and “All-Small” and “FTSE4Good” are trademarks of FTSE. FTSE Large Cap Ireland is calculated by FTSE. FTSE does not sponsor, endorse or promote this product and is not in any way connected to it and does not accept any liability. All intellectual property rights in the index values and constituent list vests in FTSE. SSgA has obtained full license from FTSE to use such intellectual property rights in the creation of this product.
IREMKT-0247

Thank you