Embed Size (px)
Citation preview
Collective Intelligence in Collaborative Tagging System
by
Xiaoyin Yang
A thesis
presented to the University of Waterloo
in fulfilment of the
thesis requirement for the degree of
Master of Applied Science
in
Management Sciences
Waterloo, Ontario, Canada, 2009
©Xiaoyin Yang 2009

I hereby declare that I am the sole author of this thesis. This is a true copy of the thesis, including any required final revisions, as accepted by my examiners.
I understand that my thesis may be made electronically available to the public.
ii
Abstract
Recently, a new form of organizing, sharing and finding information, named tagging, has
gained importance because its results are the product of the combined efforts of the actual
users’ opinions of the information. In this paper, we explore the conceptual model of the
del.icio.us tagging system in order to investigate the degree to which the tagging system’s
conceptual model reflects the human conceptual knowledge structure at both the
population level and the individual level. We use datasets extracted from the del.icio.us
system from 2003 to 2007 to obtain the strength of connection among tags, and compare
that with data for the association of the same concepts by actual human beings. The
results show that, overall, the conceptual model for the del.icio.us tagging system
captures human’s notion of concept similarity. Several potential applications are
mentioned.
iii
Acknowledgements
I would like to express my deep appreciation to my supervisors, Dr. Robert Duimering
and Dr. Mark Smucker, for their continued guidance, valued advice and constructive
criticism. Thanks also go to my committee members, Dr. Olga Vechtomova and Dr.
Frank Safayeni, for their careful review of the thesis as well as their constructive
comments and ideas.
I would also like to thank Sabrina, Danniel, Jonathan and Edward for participating in my
experiment. And thanks also go to all those University of Waterloo undergraduate
students who took time to complete the survey distributed throughout Msci 211 DE
course. Without their co-operation, the completion of this paper would not have been
possible.
Last but not least, I owe great thanks to Edward for his love, encouragement and
unwavering support. I also owe many thanks to my parents for their love, constant help
and encouragement over the years.
iv
Table of Contents
List of Tables ................................................................................................................................. vii
List of Figures .............................................................................................................................. viii
Chapter 1: Introduction ................................................................................................................... 1
Chapter 2: Background and Related Work ...................................................................................... 6
2.2.1. Stabilized Tagging Pattern ............................................................................................ 9
2.2.2. Cognitive and Linguistic Analysis of Tagging Behaviour ............................................ 9
2.2.3. Concepts Similarity Studies ........................................................................................ 10
Chapter 3: Methodology ................................................................................................................ 13
3.1. Data Selection ..................................................................................................................... 13
3.2. Survey Design .................................................................................................................... 14
3.3. Algorithm ........................................................................................................................... 17
3.3.1. A Modified Vector Space Model................................................................................. 18
3.3.2. Cosine Similarity ......................................................................................................... 19
3.4. Evaluation Methods ............................................................................................................ 19
3.4.1. Rank Order Correlation Methods ................................................................................ 20
3.4.2. Two Levels of Measurements ..................................................................................... 22
Chapter 4: Results ......................................................................................................................... 23
4.1. Population Level of Measurement ...................................................................................... 23
4.2. Individual Level of Measurement ...................................................................................... 28
Chapter 5: Discussion .................................................................................................................... 30
5.1. Summary of Results ........................................................................................................... 30
5.2. Analysis of Results ............................................................................................................. 30
5.2.1. Population Level Measurement Results ...................................................................... 30
5.2.2. Individual Level Measurement Results ....................................................................... 32
5.2.3. Analysis of Results which Fail to Support Our Hypothesis ........................................ 36
Chapter 6: Conclusion and Future Work ....................................................................................... 39
Appendices
Appendix A. Survey Invitation Letter ........................................................................................... 41
Appendix B. One Survey Screen Shot .......................................................................................... 42
v
Appendix C. Tested Topic Words and Lists of Concepts in Three Surveys ................................. 43
Appendix D. Experiment Results .................................................................................................. 45
References………………………………………………………………………………………...48
vi
List of Tables
Table 1 Combination of two different topics tested in section two ............................................... 17
Table 2 Paired scores arranged by concepts .................................................................................. 21
Table 3 Comparisons of relative ranking positions between each pair of concepts ...................... 21
Table 4 Spearman and Kendall’s Tau correlation test between survey average and algorithm
results for concepts similarity judgement within the same topic (n=10, two-tailed) ..................... 23
Table 5 Spearman and Kendall’s Tau correlation test between survey average and algorithm
results for concepts similarity judgement between topics (N=10, two-tailed) .............................. 25
Table 6 Spearman and Kendall’s Tau correlation test between survey average and algorithm
results for random selected concepts similarity judgement (N=10, two-tailed) ............................ 26
Table 7 Average of Spearman and Kendall’s Tau correlation test between individual participant
and algorithm results of concepts similarity judgement (number of tested concepts for each test
is10, two tailed) ............................................................................................................................. 28
Table 8 Concept having big differences in rank between survey and algorithm results for the topic
word knowledge (randomly selected) ........................................................................................... 36
Table 9 Concepts having a big difference in rank between survey and algorithm results for the
topic word fashion (within topic) .................................................................................................. 37
Table 10 Concepts having a big difference in rank between survey and algorithm results for the
topic word sound (within topic) .................................................................................................... 38
Table 11 Concepts having big differences between survey and algorithm results for the topic
word sound (within topic) ............................................................................................................. 38
vii
List of Figures
Figure 1 The conceptual model for tagging system (Retrieved Aug 2009, from
http://www.nosolousabilidad.com/hassan/visualizious/) ................................................................. 3
Figure 2 Tag cloud showing the most popular tags used in the del.icio.us system (Retrieved from
http://delicious.com in Aug 2009) ................................................................................................... 7
Figure 3 User interface showing a tag and related tags for active users (Retrieved from
http://del.icio.us.com/ in August 2008) ........................................................................................... 7
Figure 4 User interface for assigning tags to a website (Retrieved from http://del.icio.us.com/ in
August 2008) ................................................................................................................................... 8
Figure 5 One example of a topic word and a list of ten concepts .................................................. 15
Figure 6 Scatter plot of one statistically significant example within the same topic..................... 24
Figure 7 Scatter plots of two statistically insignificant examples within the same topic .............. 25
Figure 8 Scatter plot of statistically insignificant examples with random selected concepts ........ 27
Figure 9 Spearman and Kendall’s Tau correlation test between individual participant and
algorithm results for concepts similarity judgement within the same topic ( . 05= .648, . 05
.511) ............................................................................................................................................. 32
Figure 10 Spearman and Kendall’s Tau correlation test between individual participant and
algorithm results for concepts similarity judgement within the same topic ( . 05= .648, . 05
.511) ............................................................................................................................................. 33
Figure 11 Spearman and Kendall’s Tau correlation test between individual participant and
algorithm results for concepts similarity judgement within the same topic ( . 05= .648, . 05
.511) ............................................................................................................................................. 34
Figure 12 Spearman and Kendall’s Tau correlation test between individual participant and
algorithm results for concepts similarity judgement between topics ( . 05= .648, . 05 .511)
....................................................................................................................................................... 34
viii
ix
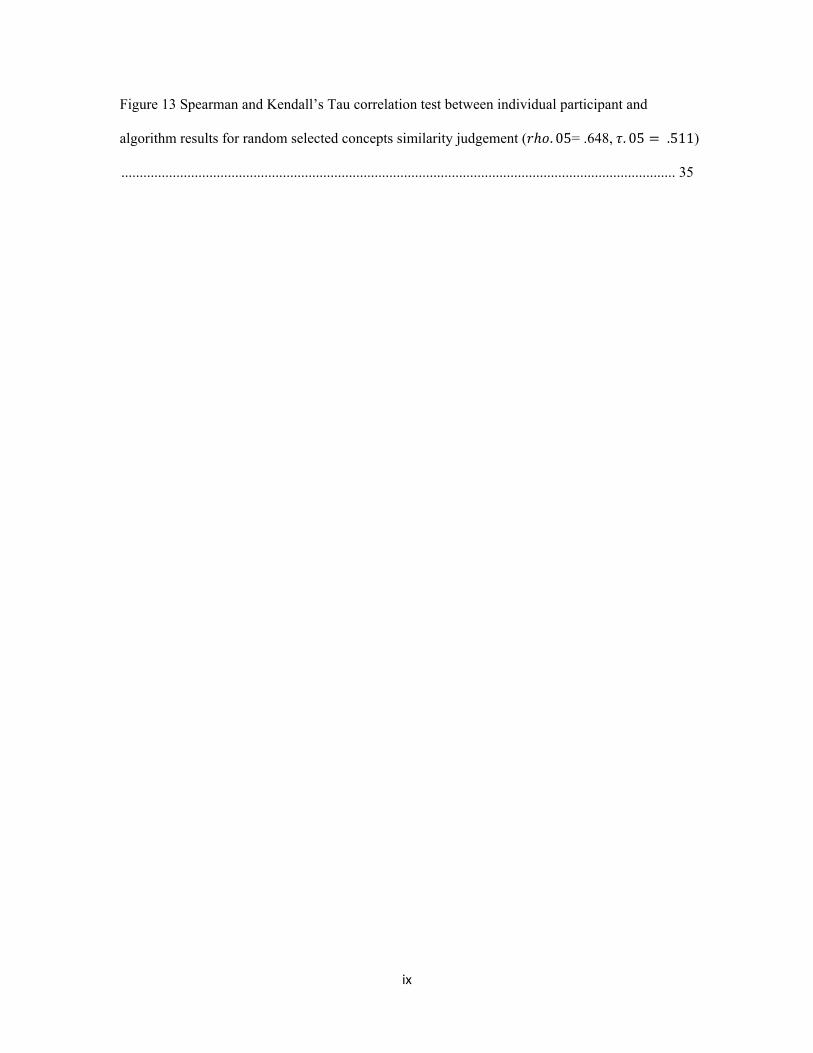
Figure 13 Spearman and Kendall’s Tau correlation test between individual participant and
algorithm results for random selected concepts similarity judgement ( . 05= .648, . 05 .511)
....................................................................................................................................................... 35
Chapter 1: Introduction
Over the last few decades, web search engines have fundamentally changed the ways
people share and locate information. To facilitate information retrieval, information
resources are often assigned index terms. Index terms become one of the determinant
factors of search effectiveness. If inappropriate, or if an insufficient variety of words are
used, the user will either not be able to find the information sought, or will require an
excessive amount of time to figure out which index term to use. Index term selection is a
very important stage of information retrieval.
In classical information retrieval systems, index terms are often assigned by two
techniques: manual indexing and automatic indexing (Louis, Carol & Thomas, 1990). For
manual indexing, subject experts select candidate words that they think can best represent
the document and produce better retrieval results. A classical example is a traditional
library indexing system. The shortcomings of this technique are: first, the process usually
takes a lot time, money and effort to complete; secondly, it involves the use of controlled
vocabulary, which, in turn, controls the use of synonyms, homonyms, grammatical
variations, misspellings and non-words to unite similar terms for the purpose of
establishing a single form of the term (MacGregor & McCulloch, 2006). For automatic
indexing, index terms are assigned from words actually showing up in the documents
being indexed. The ranking of web resources are based on the weight of terms, that is, the
frequency of words which appear in the documents. It also has some issues when broad
or narrow terms are used as queries, which is different from terms used in the document.
Users’ aspect (considering users’ opinions in the selection of index terms) in information
retrieval study has gained importance and has been studied in recent years (Ying-Hsang
& Nina, 2008). Recently, a new form of organizing, sharing and finding information,
named tagging, has become very popular on the internet. The tagging system is gaining
importance because its results are the product of the combined efforts of actual users’
opinions of the information. As Shirky (2005) argues, “the cataloguer can’t replicate the
1

mental models of the users better than the users can themselves, nor can they predict how
stable their proposed categorizations will be over time”.
A tagging system is a “collaboratively generated, open-ended labelling system that
enables internet users to categorize content” (“Folksonomy”, 2009). The basic principle
is that individuals use tags as meta-data to organize web-based information into
personalized, ad hoc categorization schemes which facilitate later retrieval. By sharing
their tags with others, users also contribute to the social construction of shared knowledge
structures, thereby reflecting how people collectively categorize and interpret web
resources. This activity is referred to by several names: collaborative tagging, social
bookmarking, folksonomy, and taxonomy. Popular examples are del.icio.us
(http://del.icio.us), Digg (http://digg.net), flickr (http://flickr.com) and CiteULike
(http://citeulike.org/).
In this study, we explore the conceptual model of the del.icio.us tagging system. The
conceptual model is extracted from the tripartite graph model of users, tags and web
resources. Tag words (concepts) are connected to each other through web resources they
have been tagged with. If we cluster tag words using the strength of connection, that is,
the number of times tag words are used together for the same web resource, we would get
the conceptual model of del.icio.us tagging system (a general picture is shown in Figure
1). In this paper, we focus on the connection of tags through web resources. The existing
tags and the connections among them in the tagging conceptual model might reflect how
humans categorize things with words, and how they perceive the connections among
those words.
2
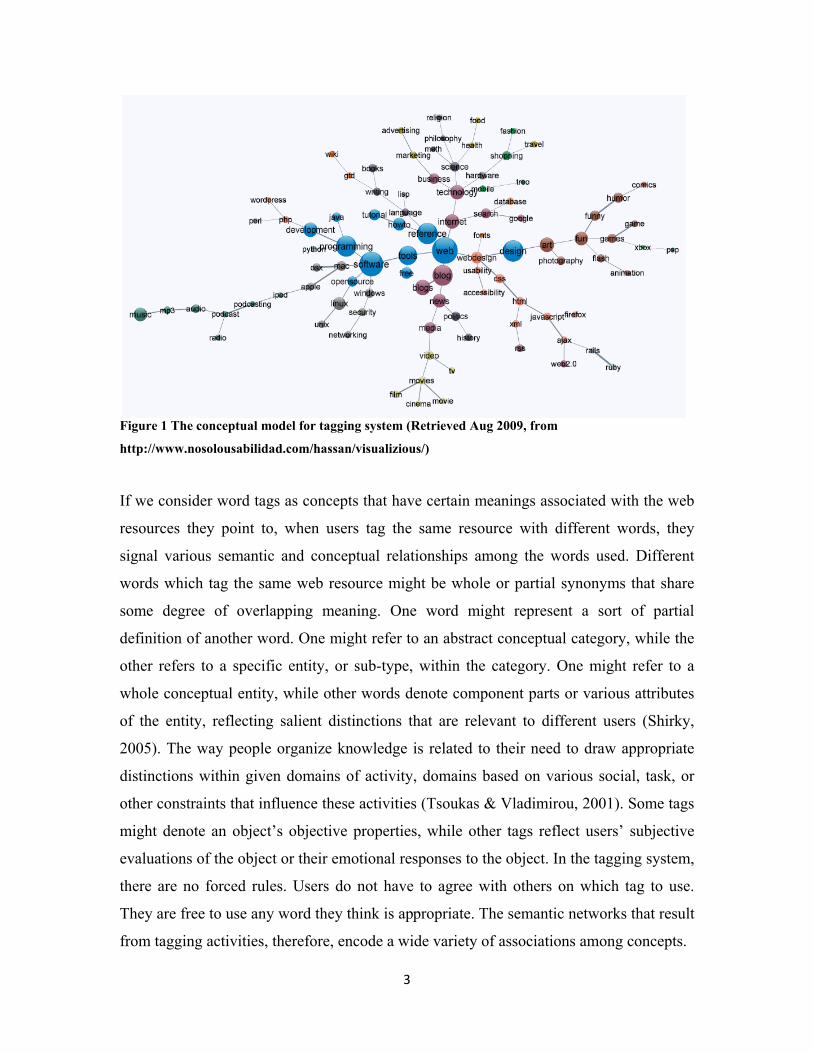
Figure 1 The conceptual model for tagging system (Retrieved Aug 2009, from
http://www.nosolousabilidad.com/hassan/visualizious/)
If we consider word tags as concepts that have certain meanings associated with the web
resources they point to, when users tag the same resource with different words, they
signal various semantic and conceptual relationships among the words used. Different
words which tag the same web resource might be whole or partial synonyms that share
some degree of overlapping meaning. One word might represent a sort of partial
definition of another word. One might refer to an abstract conceptual category, while the
other refers to a specific entity, or sub-type, within the category. One might refer to a
whole conceptual entity, while other words denote component parts or various attributes
of the entity, reflecting salient distinctions that are relevant to different users (Shirky,
2005). The way people organize knowledge is related to their need to draw appropriate
distinctions within given domains of activity, domains based on various social, task, or
other constraints that influence these activities (Tsoukas & Vladimirou, 2001). Some tags
might denote an object’s objective properties, while other tags reflect users’ subjective
evaluations of the object or their emotional responses to the object. In the tagging system,
there are no forced rules. Users do not have to agree with others on which tag to use.
They are free to use any word they think is appropriate. The semantic networks that result
from tagging activities, therefore, encode a wide variety of associations among concepts.
3
People organize their concepts in diverse ways that reflect particular tasks and activities,
and people often misinterpret ambiguous stimuli or have difficulties expressing
themselves precisely in communication. Thus, human cognition and language are richly
laden with polysemy (a word or phrase with multiple, related meanings) and synonymy
(different words or phrases with identical or very similar meanings); Although such
lexical ambiguities, which exist in tags, are deemed to be problematic for information
retrieval based on controlled-ontology classification systems, from our research
perspective they simply reflect the diverse forms of conceptual categories and concept
relations that characterize how people think. Overlapping concepts play an important role
in the human ability to discriminate among similar but differing referents, the ability to
express nuanced arguments, to convey precise information, and to draw new or subtle
distinctions that serve particular purposes. The structure of the tagging conceptual model
reflects this complex, evolving structure of human conceptual knowledge. Polysemy and
synonymy provide opportunities to obtain new insights into how people represent and
organize conceptual knowledge.
After observing the connections of tags in the conceptual model extracted from
del.icio.us, we noticed that the connections among concepts within categories were much
closer than those of cross category concepts. We also noticed that all concepts were
somewhat connected. So, in del.icio.us, we could make a connection between any two
selected words through the words that connected those two words. Considering these
three types of connections in the conceptual model for tagging systems mentioned above,
we wanted to know how tags in del.icio.us connected to human judgement of concepts
association in three ways: within same category concepts, between two categories
concepts, and randomly selected concepts.
The goal of this study is to explore the connection of tags in del.icio.us to see, on average,
how close the connection is to human’s notion of concept similarity. We will use data
retrieved from del.icio.us for exploratory and experimental studies to test the hypothesis
on both population level and individual level:
4
a) The within same category connections of tags in the conceptual model abstracted from
del.icio.us system are strongly correlated with human judgements of concepts within
same category association.
b) The between two categories connections of tags in the conceptual model abstracted
from del.icio.us system are strongly correlated with human judgements of concepts
association between two categories.
c) The randomly selected connections of tags in the conceptual model abstracted from
del.icio.us system are strongly correlated with human judgements of randomly selected
concepts association.
This paper hopes to make a significant contribution which enables us to have a proper
model to represent the human conceptual knowledge structure. Possible uses of this study
could be in the linguistic study of human vocabulary and in the evolution and
improvement of keyword extraction technology according to human categorization
schema for information retrieval, keyword marking strategy, and artificial intelligence.
The remaining chapters are organized as follows. Chapter 2 introduces the main
terminologies, the del.icio.us tagging structure, and reviews relevant research. In chapter
3, a discussion of data and filtering rules is given. We also present the experimental
survey design in detail and introduce the modified vector space model and cosine
similarity measurement used in our study. Methods for evaluating survey results and
del.icio.us tag connection results are also presented in chapter 3. Chapter 4 presents the
experimental results and a discussion of the results is given in chapter 5. Finally, the
conclusion and suggestions for future study are presented in chapter 6.
5
Chapter 2: Background and Related Work
2.1. Background
A tag is a relevant keyword or term associated with or assigned to a piece of information
like a picture, an article or a video clip. It describes the information and enables keyword-
based classification of the information to which it is applied (“Tag”, 2009).
Del.icio.us, the collaborative tagging system we focus on in this paper, allows users to
freely assign tags that are meaningful to them as resources, no matter whether the
resources have already been tagged by others or not. Users may use a different word for
the same concept or use a broader or more specific word for a related concept. If users
use phrases to tag resources, the system separates phrases into several single word tags
based on spaces.
The structure of del.icio.us can be characterized as a tripartite graph model with nodes
representing users, concepts (tags), and web resources (Marlow, Naaman, Boyd & Davis,
2006). This tripartite structure of del.icio.us makes it possible to see all the tags assigned
to a resource, all users who have used a particular tag, and other tags that have been used
for similar items.
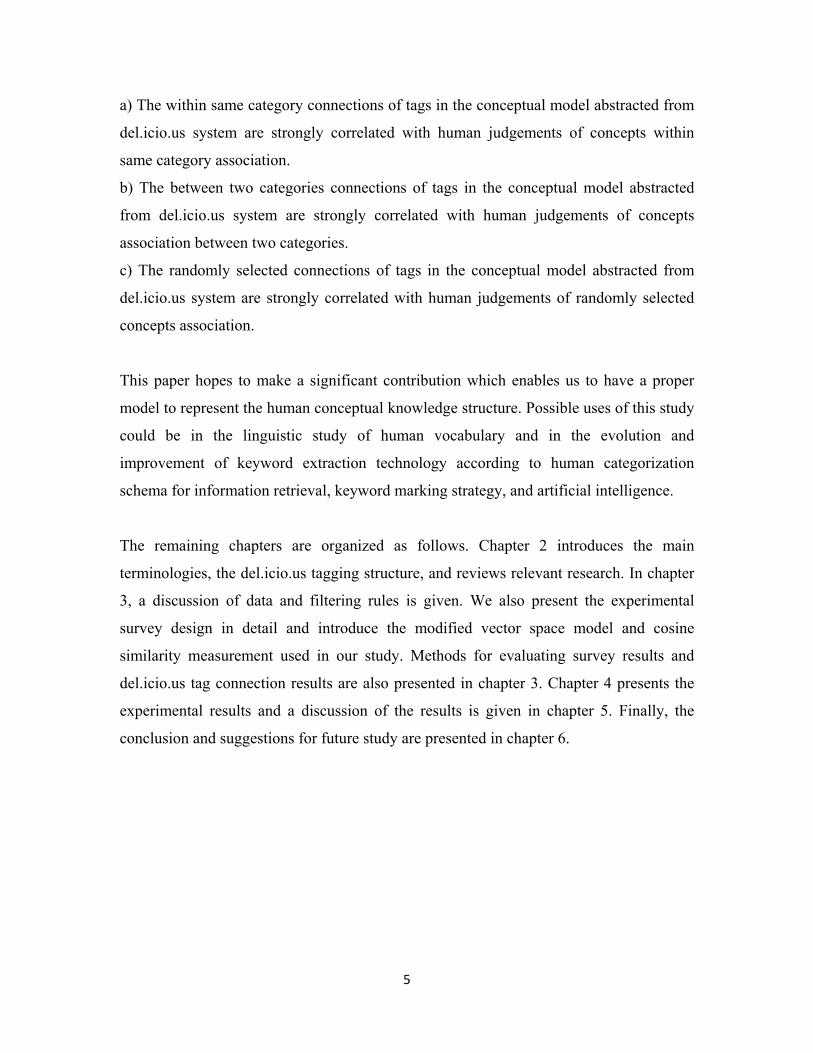
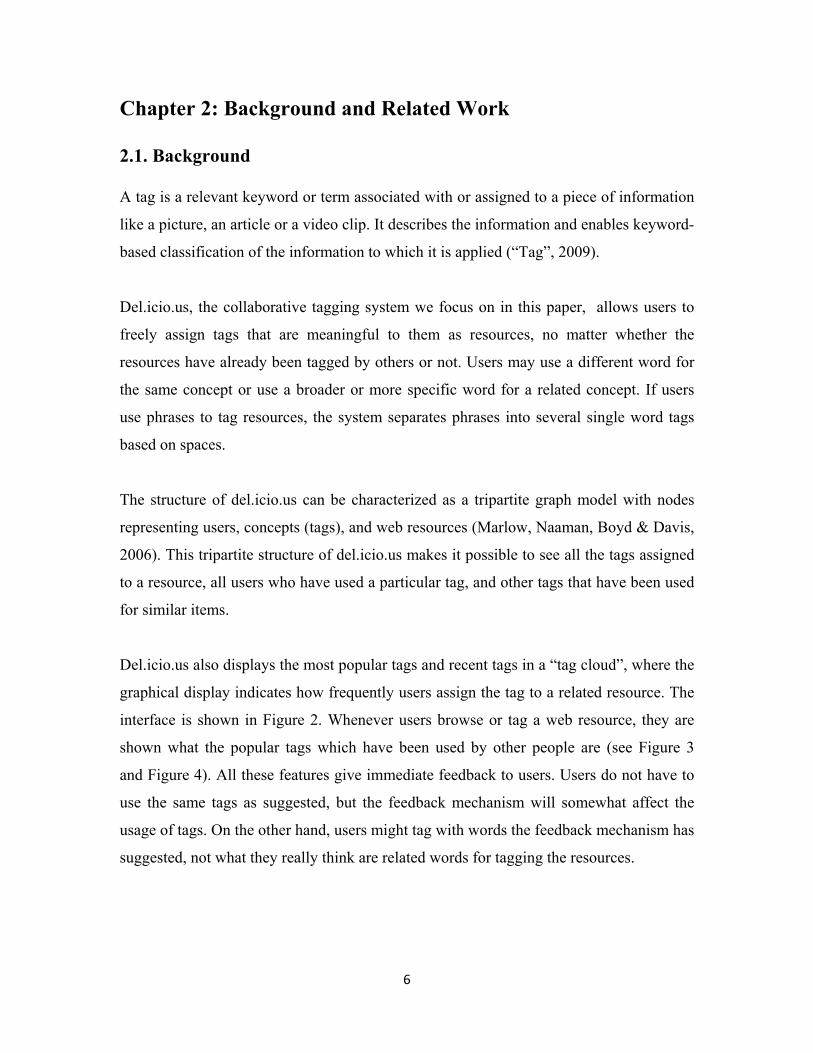
Del.icio.us also displays the most popular tags and recent tags in a “tag cloud”, where the
graphical display indicates how frequently users assign the tag to a related resource. The
interface is shown in Figure 2. Whenever users browse or tag a web resource, they are
shown what the popular tags which have been used by other people are (see Figure 3
and Figure 4). All these features give immediate feedback to users. Users do not have to
use the same tags as suggested, but the feedback mechanism will somewhat affect the
usage of tags. On the other hand, users might tag with words the feedback mechanism has
suggested, not what they really think are related words for tagging the resources.
6
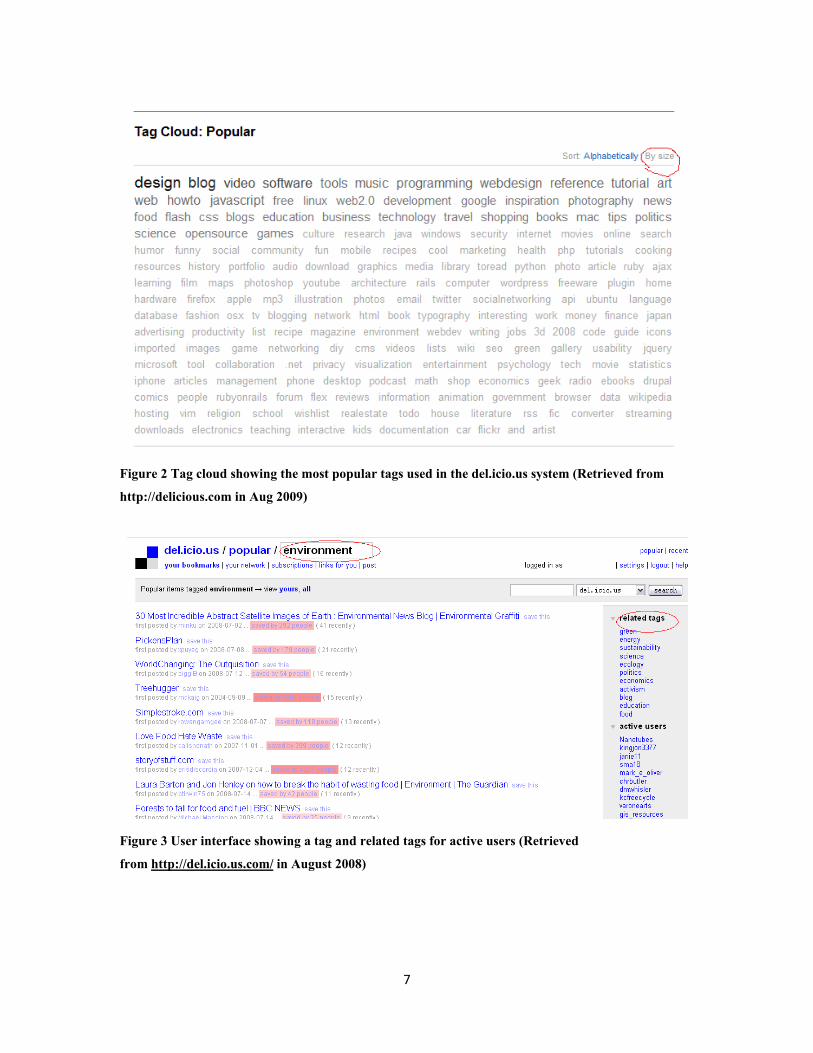
Figure 2 Tag cloud showing the most popular tags used in the del.icio.us system (Retrieved from
http://delicious.com in Aug 2009)
Figure 3 User interface showing a tag and related tags for active users (Retrieved
from http://del.icio.us.com/ in August 2008)
7
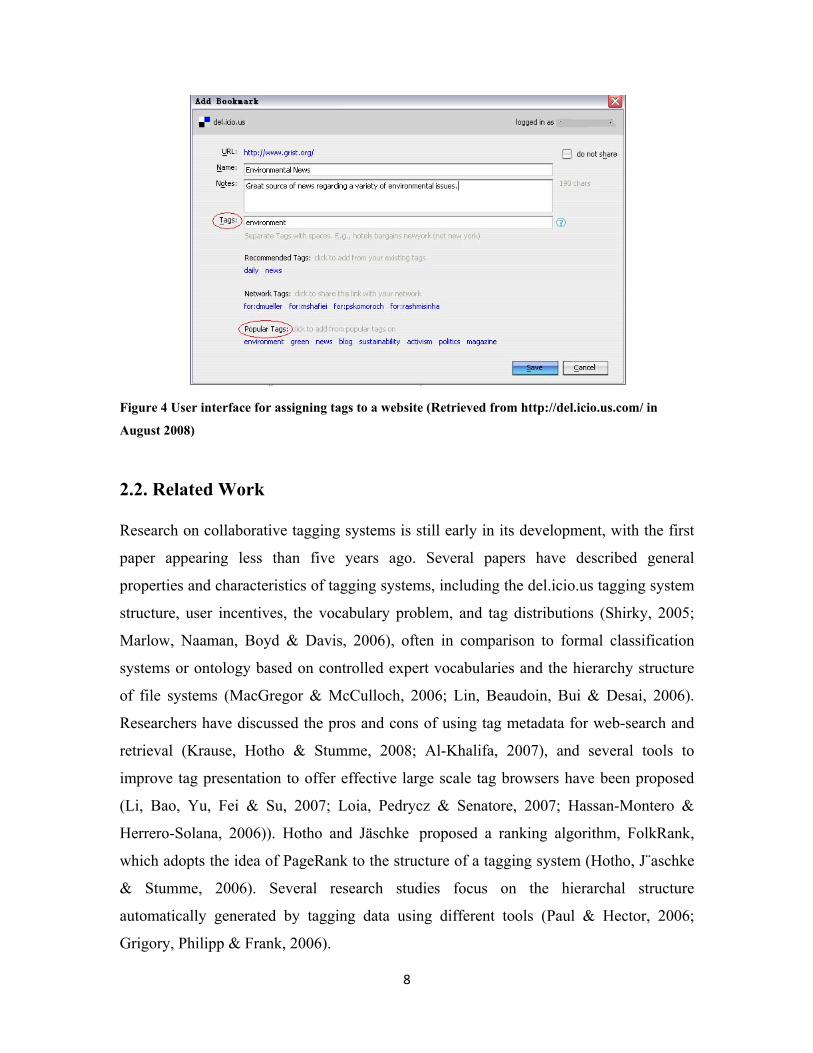
Figure 4 User interface for assigning tags to a website (Retrieved from http://del.icio.us.com/ in
August 2008)
2.2. Related Work
Research on collaborative tagging systems is still early in its development, with the first
paper appearing less than five years ago. Several papers have described general
properties and characteristics of tagging systems, including the del.icio.us tagging system
structure, user incentives, the vocabulary problem, and tag distributions (Shirky, 2005;
Marlow, Naaman, Boyd & Davis, 2006), often in comparison to formal classification
systems or ontology based on controlled expert vocabularies and the hierarchy structure
of file systems (MacGregor & McCulloch, 2006; Lin, Beaudoin, Bui & Desai, 2006).
Researchers have discussed the pros and cons of using tag metadata for web-search and
retrieval (Krause, Hotho & Stumme, 2008; Al-Khalifa, 2007), and several tools to
improve tag presentation to offer effective large scale tag browsers have been proposed
(Li, Bao, Yu, Fei & Su, 2007; Loia, Pedrycz & Senatore, 2007; Hassan-Montero &
Herrero-Solana, 2006)). Hotho and Jäschke proposed a ranking algorithm, FolkRank,
which adopts the idea of PageRank to the structure of a tagging system (Hotho, J¨aschke
& Stumme, 2006). Several research studies focus on the hierarchal structure
automatically generated by tagging data using different tools (Paul & Hector, 2006;
Grigory, Philipp & Frank, 2006).
8
Few researches, however, have really focused on the “collective intelligence” in
collaborative tagging systems. Those systems contain a lot of useful information or
knowledge, much more than any single human being could know. It may be possible to
use those systems to help us process information and solve problems, to use the data in
highly informed decision making, or at least to improve keyword extraction.
2.2.1. Stabilized Tagging Pattern
As we mentioned early, users tag things differently. They can use any word they think is
appropriate to tag a web resource. Early studies have shown that the combined tags of
any users’ web resources quickly give rise to a stable pattern (Golder & Huberman, 2005;
Ramon & Ricard, 2001). . These studies showed that after having been bookmarked only
100 times, the proportion of each of the tags is nearly fixed; regardless of how much
larger the system grows, the shape of tag distribution remains the same and thus
stable.Halpin et al. explains that the meaning of stable is that “tagging eventually settles
to a group of tags that describe the resource well, which indicates that users have
developed some consensus about tag usage and where new users mostly reinforce already
present tags in the same frequency as in the stable distribution.” (Halpin & Shepherd,
2007) The stability of tag distribution, as Golder and Huberman suggest, relies on both
the interaction between users and the shared cultural knowledge of users (Golder &
Huberman, 2005). Pind suggests that the sets of tags used within a community tend to
converge upon a commonly agreed set of meanings and usage, which relies on shared and
emergent social structures and behaviours as well as a related conceptual and linguistic
structure of the user community in the tagging system (Pind, 2005). The stabilised
tagging pattern in del.icio.us might be very useful for creating a commonly agreed upon
domain model.
2.2.2. Cognitive and Linguistic Analysis of Tagging Behaviour
One unique feature of the tagging system, when compared to the formal classification
system, is that users are involved in categorizing web resources with tags. To understand
9

users’ tagging behaviour better, we explored several research studies into the cognitive
and linguistic analysis of tagging behaviour.
Rashmi used a 2-stage categorization process to explain the fundamental properties of the
cognitive processing of tagging. When we tag an object, a certain number of semantically
related concepts or personal favour terms (i.e. useful terms) connected with the object
become activated in our brain. Then, in the next stage, our brain quickly calculates the
similarity between object and candidate tag words and evaluates the future findability for
the purpose of choosing the best tag word for the object (Rashmi, 2005). Shilad’s study
indicated that personal tendency and community influence affect the way we choose tags
(Shilad et al, 2006). In the linguistic area, Markus proposed a category model of tags for
linguistic and functional aspects of tag usage (Markus, Susanne & Christian, 2008).
Golder and Huberman also explored the types of functions tags perform, such as
organizing tasks (Golder & Huberman, 2005).
2.2.3. Concepts Similarity Studies
In psychology and linguistic areas, word association is mainly studied using “free
association test” (FAT). The idea of FAT test is that subjects are asked to give the first
word in their mind for a list of word (stimuli) presented to them. The results of FAT show
the list of stimuli, list of response word for each stimuli. The frequency of response word
is used to evaluate the strength of words association (Sinopalnikova, 2004). Deesse
proposed to use FAT test to measure semantic similarity of different words (Deese, 1965).
In the area of concepts similarity studies, a concept space approach has been used in
previous research (Kevin & Curt, 1996). The general idea of concept space is to create
different vocabularies and link vocabularies of similar meanings together. Previous
research studies mentioned several different approaches to process the concept space
approach, including using the distance between two concepts in a sentence or adopting
the relations of synsets in WordNet.
10
Those concepts similarity studies that use the distance between words in a sentence to
define the similarity of words are based on a hypothesis that “words that are similar in
meaning tend to occur in similar linguistic context”; the similarity is measured by “co-
occurrence pairs of named entities” (Patwardhan & Pedersen, 2006; Takaaki, Satoshi &
Ralph, 2004).
Several works have been proposed which use WordNet to measure concepts similarity.
WordNet was created by a team of linguists and psycholinguists at Princeton University.
It is a widely used lexical resource for processing natural language. It is different from a
traditional dictionary because it is organized according to word meanings not word forms.
In WordNet, synonymous words are organized into a synset. Synsets in WordNet consist
of nouns, adjective, verbs, and adverbs. An example of synset in WordNet is {car, auto,
automobile, machine, motorcar}. And synsets are linked together by difference relations
in WordNet, including: Hyponym/Hypernym (IS-A/HAS A), Meronym/Holonym (Part-
of/Has-Part), Meronym/Holonym (Member-of/Has-Member), Meronym/Holonym
(Substance-of/Has-Substance) (Richardson, Smeaton & Murphy, 1994). A more detail
explanation of the WordNet principle is given in “Introduction to WordNet: An On-line
Lexical Database” (George, Richard, Christiane, Derek & Katherine, 1990).
A number of approaches to measuring conceptual similarity based on WordNet have been
proposed over the years, including the Jiang and Conrath Similarity Measure (Jiang
&Conrath, 1997), Hirst and St-Onge’s relatedness measure (Hirst & St-Onge, 1998), the
approach proposed by Resnik (Resnik, 1995), that by Lin (Lin, 1998) and by Leacock-
Chodorow (Leacock & Chodorow, 1998). All these similarity measurements are designed
base on synsets and relation types defined in WordNet. These techniques have been used
in areas such as the automatic assignment of keywords to spoken text (Lonneke,
Vincenzo, Martin & Hatem, 2004) and in word sense disambiguation (Lin, 2004).
In our study, similarity of concepts is defined differently from previous approaches. We
believe that a human opinion of index terms has been included in the tagging system
through tags chosen to categorize web resources. The tags reflect how human categorize
11
things. And the words they use to categorize web resources might reflect how humans
think about categories of concepts and their connection. We use the stabilized conceptual
model of the del.icio.us tagging system to study the connection of concepts and how
close this model is to human’s notion of concept similarity. The model might add values
that, in turn, might improve existing information retrieval systems.
12
Chapter 3: Methodology
The purpose of this study is to examine the validity of whether the structure of tag word
connection in a collaborative tagging system such as del.ico.us could provide insight into
how humans think about the association of various concepts. To reach this goal, we used
datasets extracted from the del.icio.us system to obtain and assess association strength
among tag concepts, and compared these with ratings of association strength among the
same concepts by experiment participants. The methodology of this experiment includes
the use of initial data processing, survey design, similarity algorithm and statistical
evaluation.
3.1. Data Selection
The experiments were performed on the PINTS Experimental del.icio.us datasets
(“PINTS - Experimental datasets”, 2008 ), which contain 2,481,698 tags and 17,262,480
web resources from 2003 to 2006 collected from the del.icio.us tagging system. The data
represent a global view of the del.icio.us system.
After filtering out those tags containing non-ASCII characters (“ASCII is a character-
encoding scheme based on the ordering of the English alphabet” (“ASCII”, 2009)), we
noticed that around 97% of tags were used less than 100 times. Most of those low
frequency words were special terms, such as combinations of two English words, English
letters, location names, etc. Since we were more interested in commonly used concepts,
we set a threshold frequency of 100 for tags. The same applied for web resources, with
most of them tagged less than 100 times. In our study, we set a threshold frequency of
100 for web resources, so that we could focus on those web resources containing enough
tag data to analyze. After this initial filtering process, we had a dataset of 8,894 tags and
129,805 web resources. The 8,894 tags covered a wide variety of topics with computing
topics somewhat over represented in relation to other topics.
Further data filtering was done by human judgement. Four graduate students from the
University of Waterloo participated. They were given a list of all 8,894 tags. They
13
cooperated together as a team to filter out computer related words which do not have
other meanings, non-nouns, misspelled words, brand names, company names and country
names. This filtering method is used for survey design. We picked words that university
undergrads would all know for the survey. For the computation of similarity, as described
in section 3.3, we only filtered tags based on frequency. The results gave us 5,525
commonly used nouns, words we were most interested in.
3.2. Survey Design
As mentioned in the introduction, there are three types of concepts connection existed in
del.icio.us tagging system. We wanted to test three hypothesis, the within same category
concepts, between two categories concepts, and random selected concepts connection
between tags in del.icio.us and human judgement of concepts association. We used three
types of tests in surveys to capture human perception of concepts connection:
1. Test concepts connections to topic word using within same category concepts;
2. Test concepts connections to topic word using between two categories concepts;
3. Test concepts connections to topic word using randomly selected concepts.
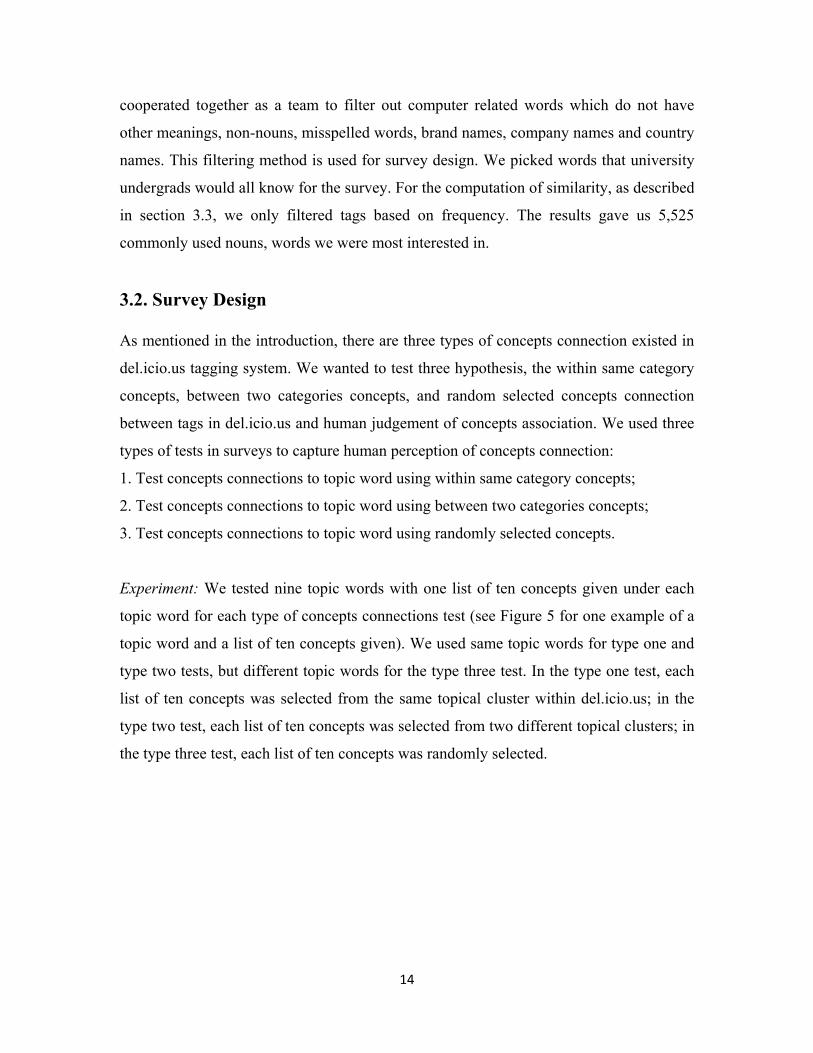
Experiment: We tested nine topic words with one list of ten concepts given under each
topic word for each type of concepts connections test (see Figure 5 for one example of a
topic word and a list of ten concepts given). We used same topic words for type one and
type two tests, but different topic words for the type three test. In the type one test, each
list of ten concepts was selected from the same topical cluster within del.icio.us; in the
type two test, each list of ten concepts was selected from two different topical clusters; in
the type three test, each list of ten concepts was randomly selected.
14
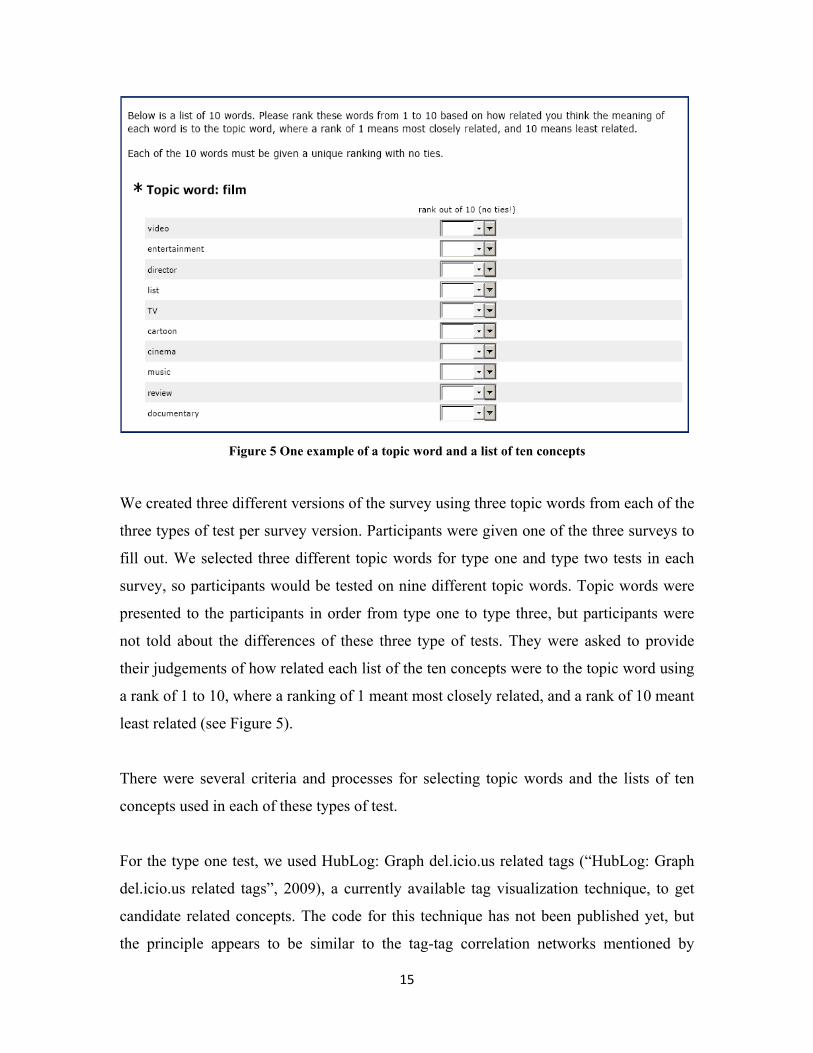
Figure 5 One example of a topic word and a list of ten concepts
We created three different versions of the survey using three topic words from each of the
three types of test per survey version. Participants were given one of the three surveys to
fill out. We selected three different topic words for type one and type two tests in each
survey, so participants would be tested on nine different topic words. Topic words were
presented to the participants in order from type one to type three, but participants were
not told about the differences of these three type of tests. They were asked to provide
their judgements of how related each list of the ten concepts were to the topic word using
a rank of 1 to 10, where a ranking of 1 meant most closely related, and a rank of 10 meant
least related (see Figure 5).
There were several criteria and processes for selecting topic words and the lists of ten
concepts used in each of these types of test.
For the type one test, we used HubLog: Graph del.icio.us related tags (“HubLog: Graph
del.icio.us related tags”, 2009), a currently available tag visualization technique, to get
candidate related concepts. The code for this technique has not been published yet, but
the principle appears to be similar to the tag-tag correlation networks mentioned by
15
Halpin. Haplin proposed to construct a tag-tag correlation networks “where the nodes
represent the tags and edges are weighted by the cosine similarity results” using Kawada-
Kawai algorithm (Halpin, Robu & Shepherd, 2007). The visualization shows a network
of related concepts considering only the central node which is the topic word. The first
order of links would list the top eleven related concepts; the second order of the links
would give another eleven related concepts; if we went further, the network would
eventually look like Figure 1.
In this study, we first selected a few abstract concepts as candidate words from 5,525 tags
to use as topic words. We then used the Hublog visualization tool to get the first order
and second order related concepts in the network as candidate concepts. These concepts
then were compared to the filtered 5,525 tags list. Only words existing in the list were
kept. Finally, if we got no less than ten related concepts left with which to conduct the
survey, we kept the topic word. Otherwise, we eliminated that topic word, since we
needed at least ten concepts for each topic word. For those topic words having more than
ten candidate concepts left, we computed the overlap in web resource between the topic
word and its candidate concepts and selected the concepts with the greatest overlap.
For the type two test, we decided to keep using the same topic words as in the type one
test, but we changed the lists of ten concepts. We kept only five concepts in each list, and
chose another five concepts from a different topic. The combination of two topics we
used in the survey is given in Table 1. The two topics were paired by hand in a random
fashion from type one topic words. The first column lists the topic words. The second
column is the other topic we used to select the other five concepts.
16
Table 1 Combination of two different topics tested in section two
film health trading film health sound environment illustration illustration fashion sound environment fashion school school vote vote trading
For the type three test, all the topic words and concepts were randomly selected from the
5,525 tags using the Excel random function, but we did filter out those concepts which
had no overlapping websites with topic words using the same algorithm we mentioned
before to calculate the size of the overlapping web resources between topic word and
concept. All topic words and lists of ten concepts used in the survey are listed in
Appendix C.
We emailed 150 students in an undergraduate organizational behaviour course in the
University of Waterloo to ask them to participate in the experiment. The study was
reviewed and received ethics clearance through the Office of Research Ethics at the
University of Waterloo. For a given topic word, the list of concepts was randomly
ordered using the survey software SurveyMonkey (“SurveyMonkey”, 2009). We got 87
responses in total, 27 for survey one, 30 for survey two, another 30 for survey three. In
the survey, participants were instructed to choose rankings from 1 to 10 with no ties.
However, because the survey software did not prevent the use of tied ranks, we got a few
tied ranks. Note that we did not eliminate these tied ranks from our data.
3.3. Algorithm
Although the Hublog visualization tool gives us some idea of how related concepts are,
the information is not very clear. It does not give exact data which states the strength of
the concepts’ connection. So the goal of this part was to design an algorithm to measure
the concept similarity of the del.icio.us tagging data. We used a modified vector space
17
model to store tag web resources (web pages) data, then calculated the connection of tags
using cosine similarity measurement. Notice that we designed the algorithm after
selecting the topic words and concepts used in the survey; further replications of this
study could use the algorithm’s concept similarity results directly to get the human
judgement feedback.
3.3.1. A Modified Vector Space Model
In a classical vector space model (VSM), documents are represented as vectors of index
terms. Each dimension corresponds to a separate term. That is, when t different terms are
th t d cument can be represented by a t-dimensional vector present in a document, a o
. , . , … , . , . represents the weight of the jth term. Given the index
vectors for two documents, it is possible to compute a similarity coefficient between them.
In our study, we needed to compute concept similarity instead of document similarity, so
we used a modified VSM. We represented concepts as vectors of associated web pages
where the weight of each URL represents how many times this concept (tag) has been
assigned to that web pages. For a large dataset, it could take a lot memory space and there
could be other limitations, such as long process time, re-indexing each time after a new
tag is added, etc. Instead of identifying each document by a complete vector, we chose
not to record those websites with zero weight, so we changed the original vector to the
rtwo comp ession ones below:
, , , , , , … , , ,
, , . , , , , … , , ,
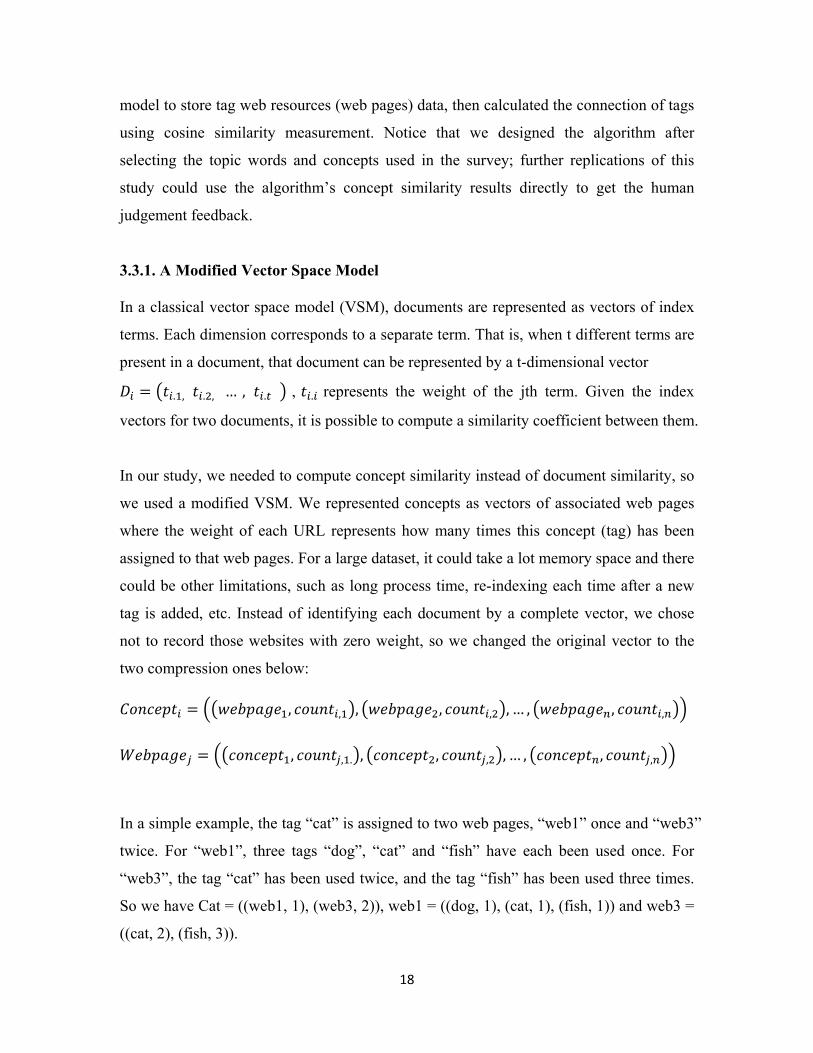
In a simple example, the tag “cat” is assigned to two web pages, “web1” once and “web3”
twice. For “web1”, three tags “dog”, “cat” and “fish” have each been used once. For
“web3”, the tag “cat” has been used twice, and the tag “fish” has been used three times.
So we have Cat = ((web1, 1), (web3, 2)), web1 = ((dog, 1), (cat, 1), (fish, 1)) and web3 =
((cat, 2), (fish, 3)).
18
3.3.2. Cosine Similarity
There are many different methods for measuring how similar two documents are or how
similar a document is to a query in classical VSM. In this study, we will use the well-
known cosine similarity measure as our measure of concept similarity in the modified
VSM we defined above.
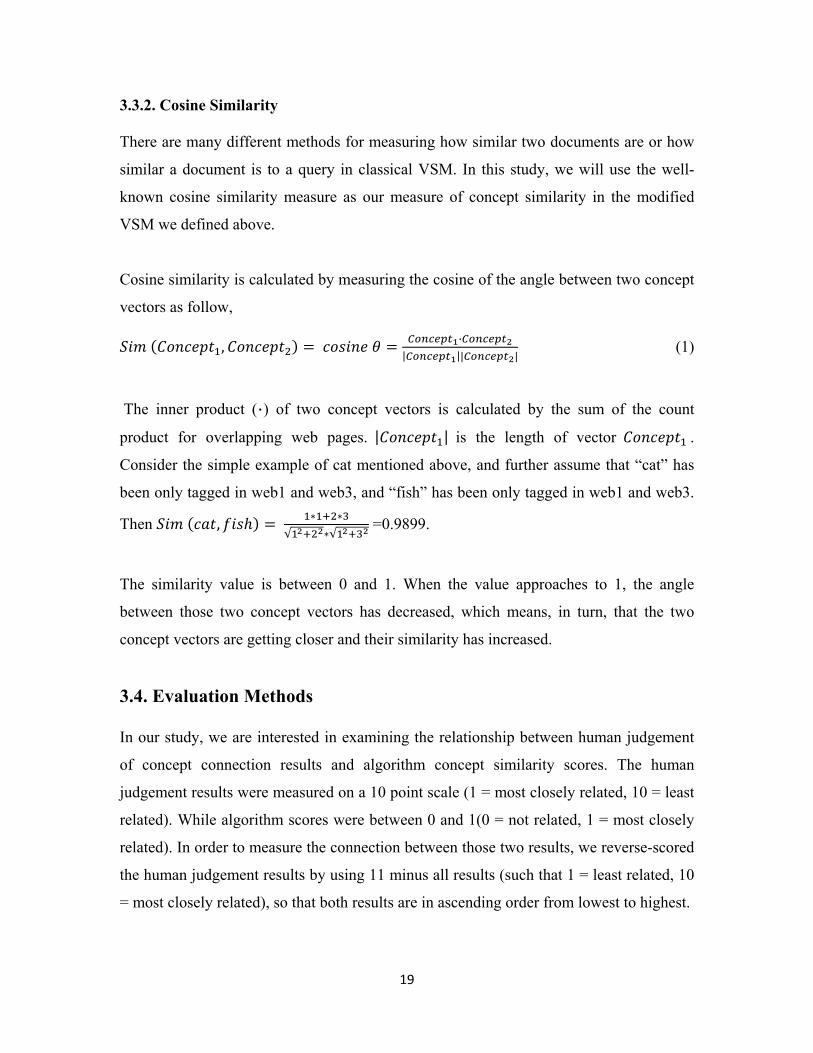
Cosine similarity is calculated by measuring the cosine of the angle between two concept
vectors as follow,
, ·| || |
(1)
The inner product (·) of two concept vectors is calculated by the sum of the count
product for overlapping web pages. | | is the length of vector .
Consider the simple example of cat mentioned above, and further assume that “cat” has
been only tagged in web1 and web3, and “fish” has been only tagged in web1 and web3.
Then , √ √
=0.9899.
The similarity value is between 0 and 1. When the value approaches to 1, the angle
between those two concept vectors has decreased, which means, in turn, that the two
concept vectors are getting closer and their similarity has increased.
3.4. Evaluation Methods
In our study, we are interested in examining the relationship between human judgement
of concept connection results and algorithm concept similarity scores. The human
judgement results were measured on a 10 point scale (1 = most closely related, 10 = least
related). While algorithm scores were between 0 and 1(0 = not related, 1 = most closely
related). In order to measure the connection between those two results, we reverse-scored
the human judgement results by using 11 minus all results (such that 1 = least related, 10
= most closely related), so that both results are in ascending order from lowest to highest.
19
3.4.1. Rank Order Correlation Methods
Whenever ranking data are involved, we need to use a nonparametric statistic. Two
nonparametric statistics used are the Spearman rank order correlation (rho) and Kendall’s
tau (τ).
The Spearman rank correlation and Kendall’s tau tests are both used to test the following
hypothesis:
Human judgements of concepts association results are strongly correlated with algorithm
similarity test results of the tag connections obtained from del.icio.us tagging data in the
underlying population.
(a) Spearman rank order correlation
Spearman’s rank order correlation coefficient (Liwen, 2001), rho, is used to measure the
correlation between the ranking of a population according to two methods of
measurement.
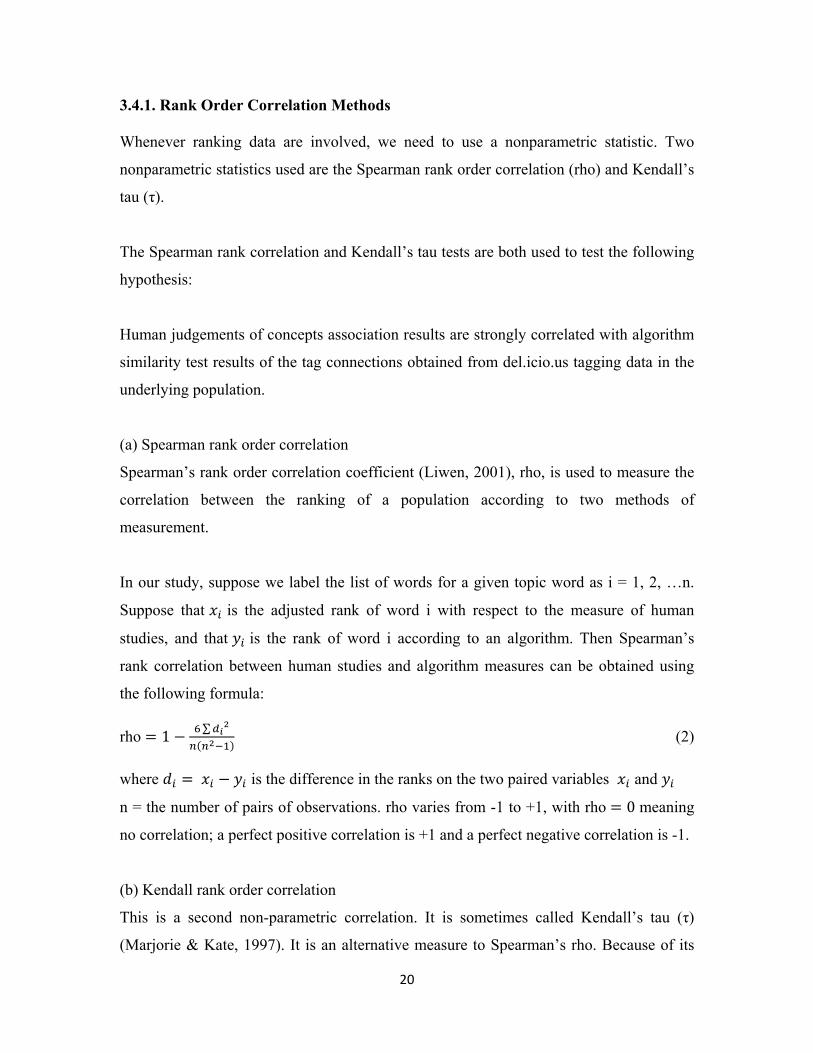
In our study, suppose we label the list of words for a given topic word as i = 1, 2, …n.
Suppose that is the adjusted rank of word i with respect to the measure of human
studies, and that is the rank of word i according to an algorithm. Then Spearman’s
rank correlation between human studies and algorithm measures can be obtained using
the f ng formula: ollowi
rho ∑1
where is the difference in the ranks on the two paired variables nd
(2)
a
n = the number of pairs of observations. rho varies from -1 to +1, with rho 0 meaning
no correlation; a perfect positive correlation is +1 and a perfect negative correlation is -1.
(b) Kendall rank order correlation
This is a second non-parametric correlation. It is sometimes called Kendall’s tau (τ)
(Marjorie & Kate, 1997). It is an alternative measure to Spearman’s rho. Because of its
20
similarity to Spearman’s rho, a null hypothesis similar to that used for Spearman’s rho
can be used for Kendall’s tau, so that we can compare the results of these two
nonparametric measures of association. But these two measurements are calculated in
different ways, so there are discrepancies in their results.
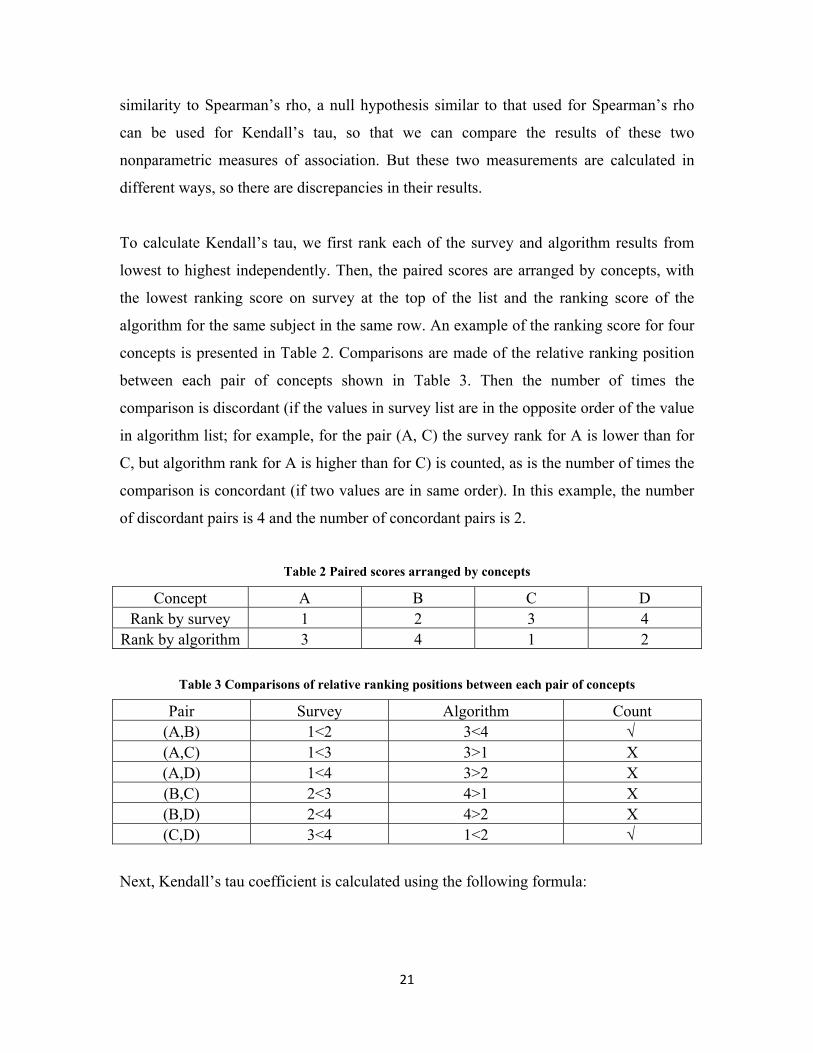
To calculate Kendall’s tau, we first rank each of the survey and algorithm results from
lowest to highest independently. Then, the paired scores are arranged by concepts, with
the lowest ranking score on survey at the top of the list and the ranking score of the
algorithm for the same subject in the same row. An example of the ranking score for four
concepts is presented in Table 2. Comparisons are made of the relative ranking position
between each pair of concepts shown in Table 3. Then the number of times the
comparison is discordant (if the values in survey list are in the opposite order of the value
in algorithm list; for example, for the pair (A, C) the survey rank for A is lower than for
C, but algorithm rank for A is higher than for C) is counted, as is the number of times the
comparison is concordant (if two values are in same order). In this example, the number
of discordant pairs is 4 and the number of concordant pairs is 2.
Table 2 Paired scores arranged by concepts
Concept A B C D Rank by survey 1 2 3 4
Rank by algorithm 3 4 1 2
Table 3 Comparisons of relative ranking positions between each pair of concepts
Pair Survey Algorithm Count (A,B) 1<2 3<4 √ (A,C) 1<3 3>1 X (A,D) 1<4 3>2 X (B,C) 2<3 4>1 X (B,D) 2<4 4>2 X (C,D) 3<4 1<2 √
Next, Kendall’s tau coefficient is calculated using the following formula:
21
� �� ��� � 1 /2
(3)
where �� is the number of concordant pairs of ranks; �� is the number of discordant
pairs of ranks; n (n-1)/2 is the total number of possible pairs of the ranks. If the
agreement between the two rankings is perfect and the two rankings are the same, the
coefficient has value +1. If the disagreement between the two rankings is perfect and one
ranking is the reverse of the other, the coefficient has value -1. If the rankings are
independent of one other, the coefficient has value 0. All other values lie between -1 and
1, and increasing values imply increasing agreement between the rankings.
3.4.2. Two Levels of Measurements
We conducted the two nonparametric measurements on both the population level and the
individual level. For the population level, we first took the average of all participants’
judgements of relation of concepts. Then, we used the average and algorithm similarity
results to conduct both Spearman’s rho and Kendall’s tau measurements. For the
individual level, we used each individual participant’s judgement of concept relation and
algorithm similarity results to conduct two nonparametric statistics tests, and then we
took an average of all individual correlation results. By conducting these two level tests,
we hoped to discover how different the two results would be. The results would also
indicate whether the overall human judgements of concept relation could be associated
with tag word connection from del.icio.us, and whether, on the individual level, a single
participant agreed with tag words connection from del.icio.us. The results would also
indicate how individual people agree or disagree with each other about concepts
connection.
22
Chapter 4: Results
The results are shown in the following tables and graphs.
4.1. Population Level of Measurement
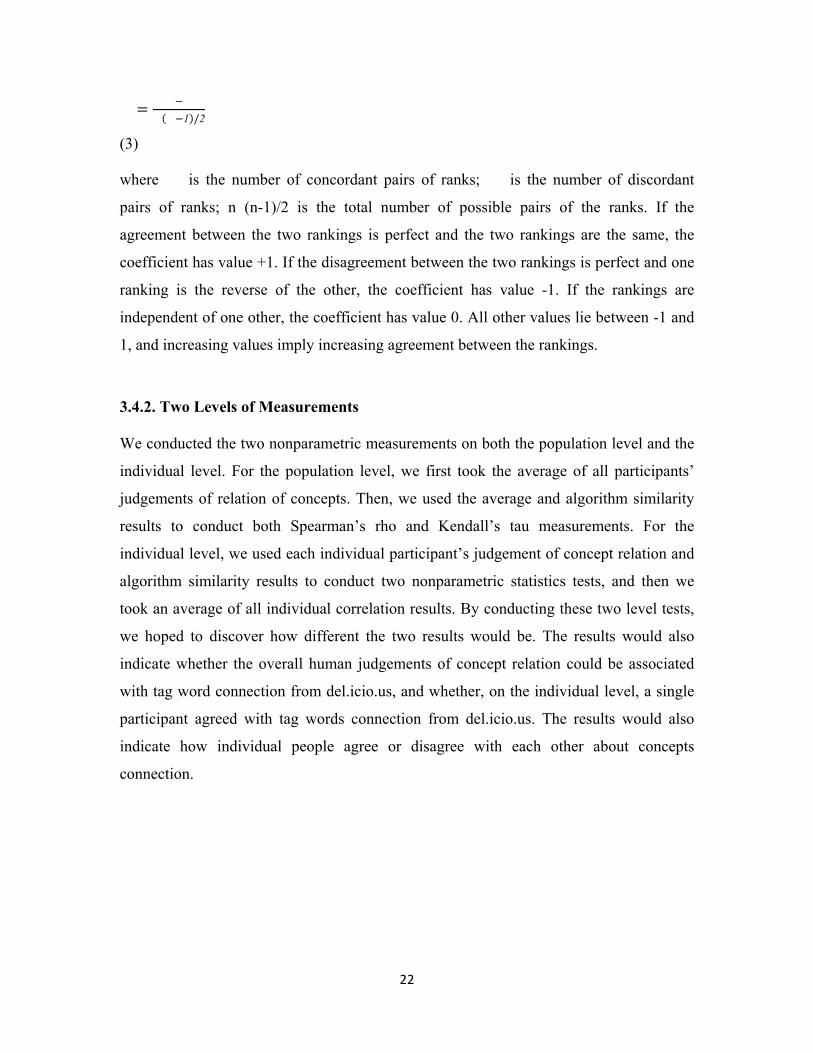
Table 4 Spearman and Kendall’s Tau correlation test between survey average and algorithm results
for concepts similarity judgement within the same topic (n=10, two-tailed)
Topic word Spearman's rho p Kendall's tau p
film .806(**) .005 .644(**) .009
trading .745(*) .013 .600(*) .016
health .855(**) .002 .733(**) .003
environment .818(**) .004 .689(**) .006
illustration .652(*) .041 .523(*) .038
sound -.042 .907 -.067 .788
fashion .273 .446 .156 .531
school .891(**) .001 .733(**) .003
vote .709(*) .022 .556(*) .025
** Correlation is significant at the .01 level (2-tailed).
* Correlation is significant at the .05 level (2-tailed).
Table 4 shows the correlation value for Spearman’s rho between survey and algorithm
results for concepts similarity judgement within the same topic. The Spearman’s
correlation test results show that the rho scores for the topic words “film,” “health,”
“environment” and “school” are significant at .01 level (p < .01); the rho scores for the
topic words “trading,” “illustration” and “vote” are significant at .05 level (.01< p < .05).
So we reject the null hypothesis at the .01 level and the .05 level accordingly, and
conclude that, in the underlying population, there is a statistically significant relationship
between human judgement of concepts similarity results and tag words connection from
del.icio.us for those topic words. The Spearman’s rho scores for all those topic words are
greater than 0, which indicates a positive correlation.
23
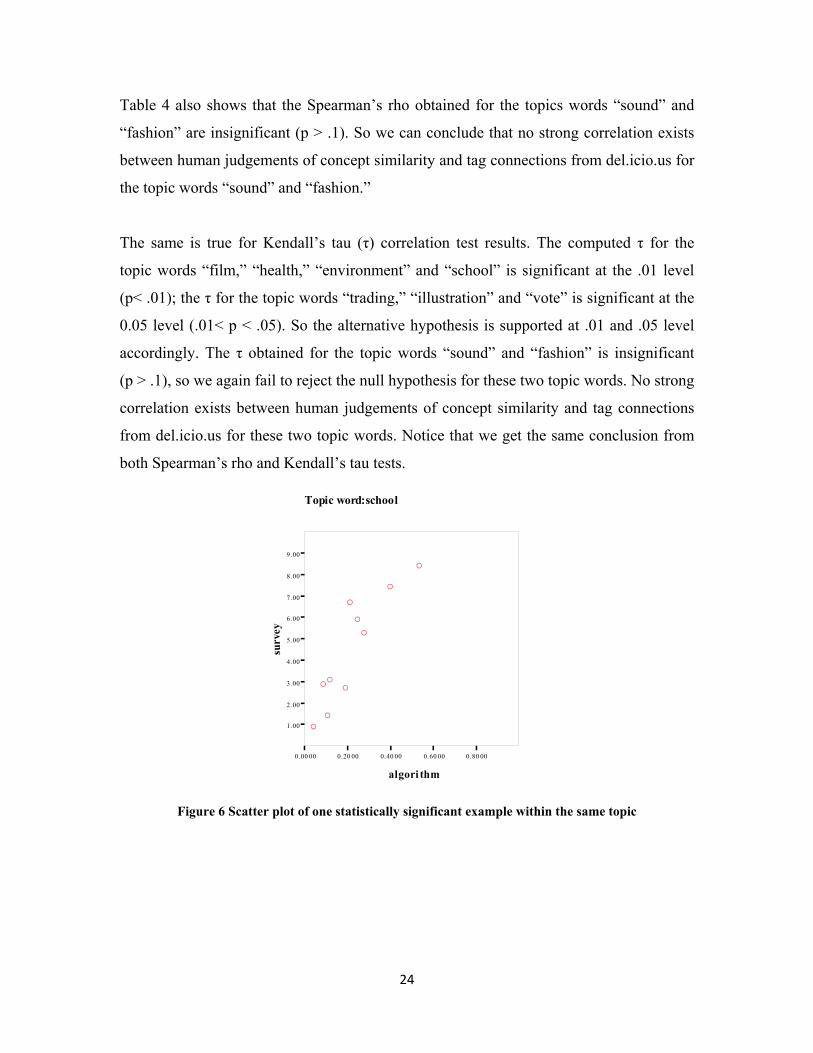
Table 4 also shows that the Spearman’s rho obtained for the topics words “sound” and
“fashion” are insignificant (p > .1). So we can conclude that no strong correlation exists
between human judgements of concept similarity and tag connections from del.icio.us for
the topic words “sound” and “fashion.”
The same is true for Kendall’s tau (τ) correlation test results. The computed τ for the
topic words “film,” “health,” “environment” and “school” is significant at the .01 level
(p< .01); the τ for the topic words “trading,” “illustration” and “vote” is significant at the
0.05 level (.01< p < .05). So the alternative hypothesis is supported at .01 and .05 level
accordingly. The τ obtained for the topic words “sound” and “fashion” is insignificant
(p > .1), so we again fail to reject the null hypothesis for these two topic words. No strong
correlation exists between human judgements of concept similarity and tag connections
from del.icio.us for these two topic words. Notice that we get the same conclusion from
both Spearman’s rho and Kendall’s tau tests.
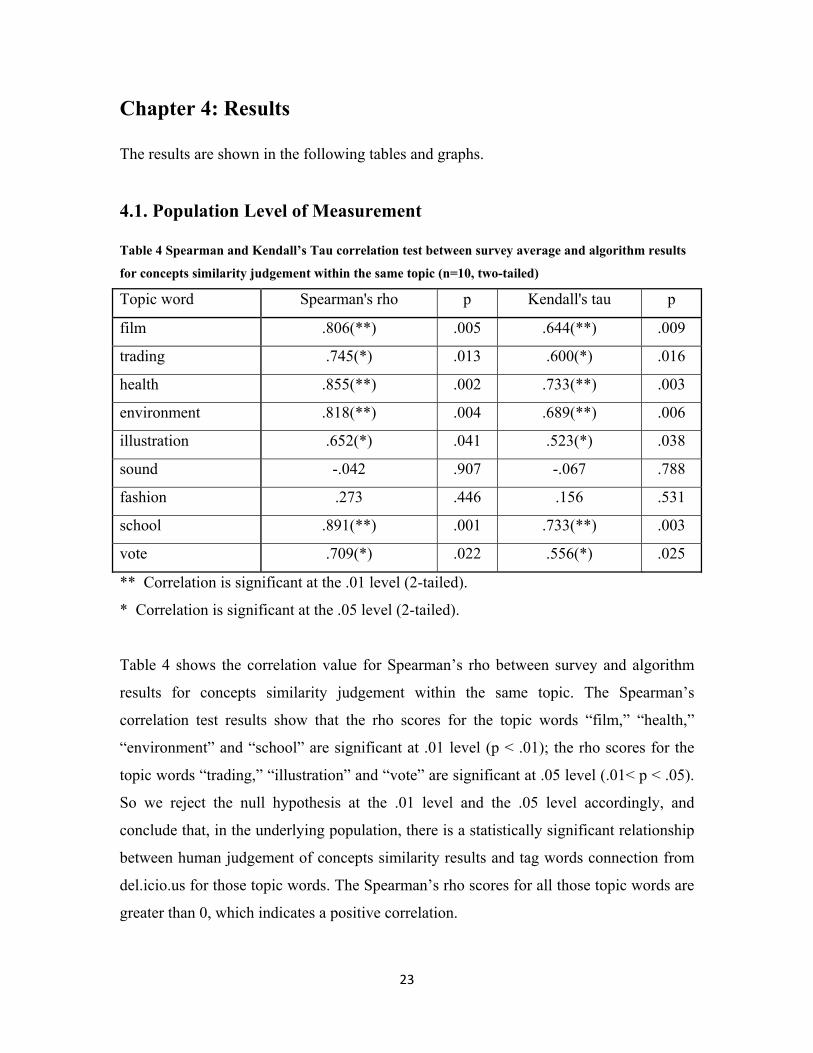
Topic word:school
0.00 00 0.20 00 0.40 00 0.60 00 0.80 00
algori thm
1.00
2.00
3.00
4.00
5.00
6.00
7.00
8.00
9.00
surv
ey
A
A
A
A
A
A
A
A
A
A
Figure 6 Scatter plot of one statistically significant example within the same topic
24
Topic word: sound
0.00 00 0.20 00 0.40 00 0.60 00 0.80 00
algori thm
1.00
2.00
3.00
4.00
5.00
6.00
7.00
8.00
9.00
surv
ey
A
A
A
A
A
A
A
A
A
A
sample
voice
Topic word:fashion
0.00 00 0.20 00 0.40 00 0.60 00 0.80 00
algori thm
1.00
2.00
3.00
4.00
5.00
6.00
7.00
8.00
9.00
surv
ey
A
A
A
A
A
A
AA
A
A
design
accessory
tshirt
Figure 7 Scatter plots of two statistically insignificant examples within the same topic
The scatter plots clearly show the differences between a statistically significant example
and an insignificant example. Concepts which have big differences in ranks have been
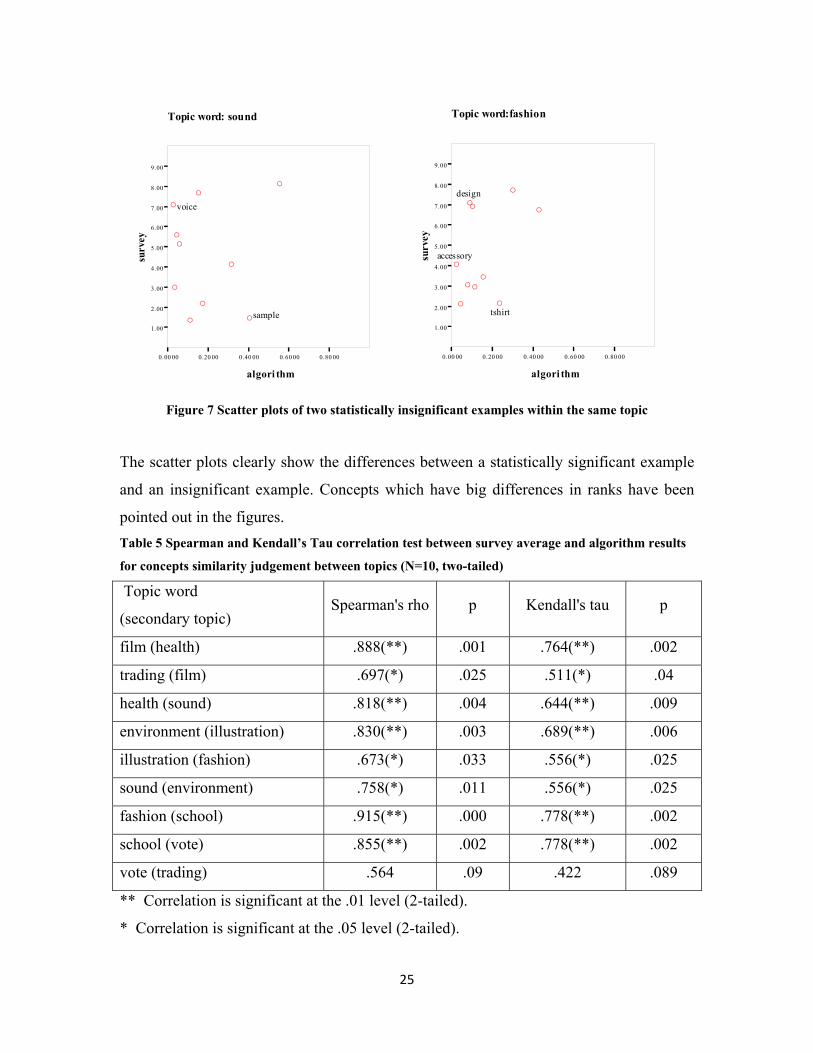
pointed out in the figures. Table 5 Spearman and Kendall’s Tau correlation test between survey average and algorithm results
for concepts similarity judgement between topics (N=10, two-tailed)
Topic word
(secondary topic) Spearman's rho p Kendall's tau p
film (health) .888(**) .001 .764(**) .002
trading (film) .697(*) .025 .511(*) .04
health (sound) .818(**) .004 .644(**) .009
environment (illustration) .830(**) .003 .689(**) .006
illustration (fashion) .673(*) .033 .556(*) .025
sound (environment) .758(*) .011 .556(*) .025
fashion (school) .915(**) .000 .778(**) .002
school (vote) .855(**) .002 .778(**) .002
vote (trading) .564 .09 .422 .089
** Correlation is significant at the .01 level (2-tailed).
* Correlation is significant at the .05 level (2-tailed).
25
Similar analysis is done for Spearman’s rho and Kendall’s tau results in Table 5
and Table 6. Table 5 shows the concepts similarity judgement across two topics. The
Spearman’s rho obtained demonstrates that for all the topic words, including “vote,” the p
value for which is less than .1, the relationship between human judgement of concepts
similarity results and tag words connection in del.icio.us is statistically significant in the
underlying population. The Kendall’s tau computation shows similar results.
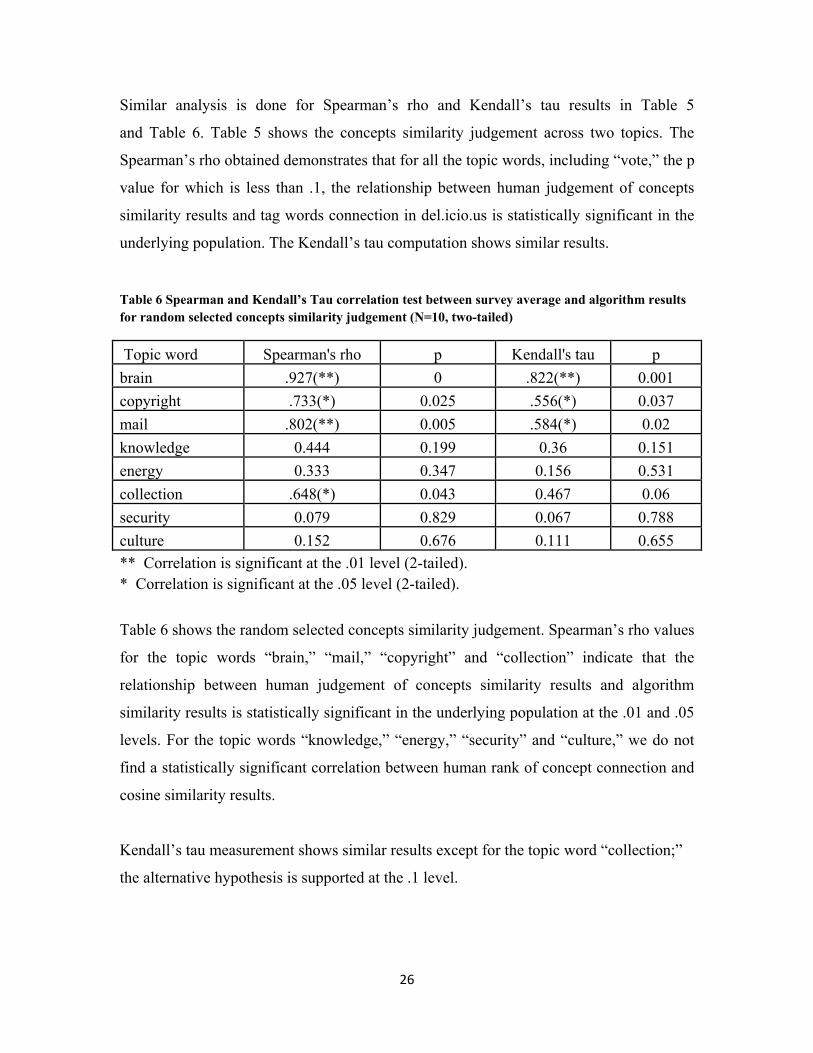
Table 6 Spearman and Kendall’s Tau correlation test between survey average and algorithm results for random selected concepts similarity judgement (N=10, two-tailed)
Topic word Spearman's rho p Kendall's tau p brain .927(**) 0 .822(**) 0.001 copyright .733(*) 0.025 .556(*) 0.037 mail .802(**) 0.005 .584(*) 0.02 knowledge 0.444 0.199 0.36 0.151 energy 0.333 0.347 0.156 0.531 collection .648(*) 0.043 0.467 0.06 security 0.079 0.829 0.067 0.788 culture 0.152 0.676 0.111 0.655 ** Correlation is significant at the .01 level (2-tailed). * Correlation is significant at the .05 level (2-tailed).
Table 6 shows the random selected concepts similarity judgement. Spearman’s rho values
for the topic words “brain,” “mail,” “copyright” and “collection” indicate that the
relationship between human judgement of concepts similarity results and algorithm
similarity results is statistically significant in the underlying population at the .01 and .05
levels. For the topic words “knowledge,” “energy,” “security” and “culture,” we do not
find a statistically significant correlation between human rank of concept connection and
cosine similarity results.
Kendall’s tau measurement shows similar results except for the topic word “collection;”
the alternative hypothesis is supported at the .1 level.
26
Topic word:knowledge
0.00 00 0.20 00 0.40 00 0.60 00 0.80 00
algori thm
1.00
2.00
3.00
4.00
5.00
6.00
7.00
8.00
9.00
surv
ey
A
A
A
A
A
A
A
A
A
A
employment
citizen
bibliograph
Topic word:energy
0.00 00 0.20 00 0.40 00 0.60 00 0.80 00
algori thm
1.00
2.00
3.00
4.00
5.00
6.00
7.00
8.00
9.00
surv
ey
A
A
A
A
A
A
A
A
A
A
source
Topic word:security
0.00 00 0.20 00 0.40 00 0.60 00 0.80 00
algori thm
1.00
2.00
3.00
4.00
5.00
6.00
7.00
8.00
9.00
surv
ey
A
A
A
A
A
A
A
A
A
A
travel
netvendor
Topic word:culture
0.00 00 0.20 00 0.40 00 0.60 00 0.80 00
algori thm
1.00
2.00
3.00
4.00
5.00
6.00
7.00
8.00
9.00
surv
ey
A
A
A
A
A
A
A
A
A
A
migration
character
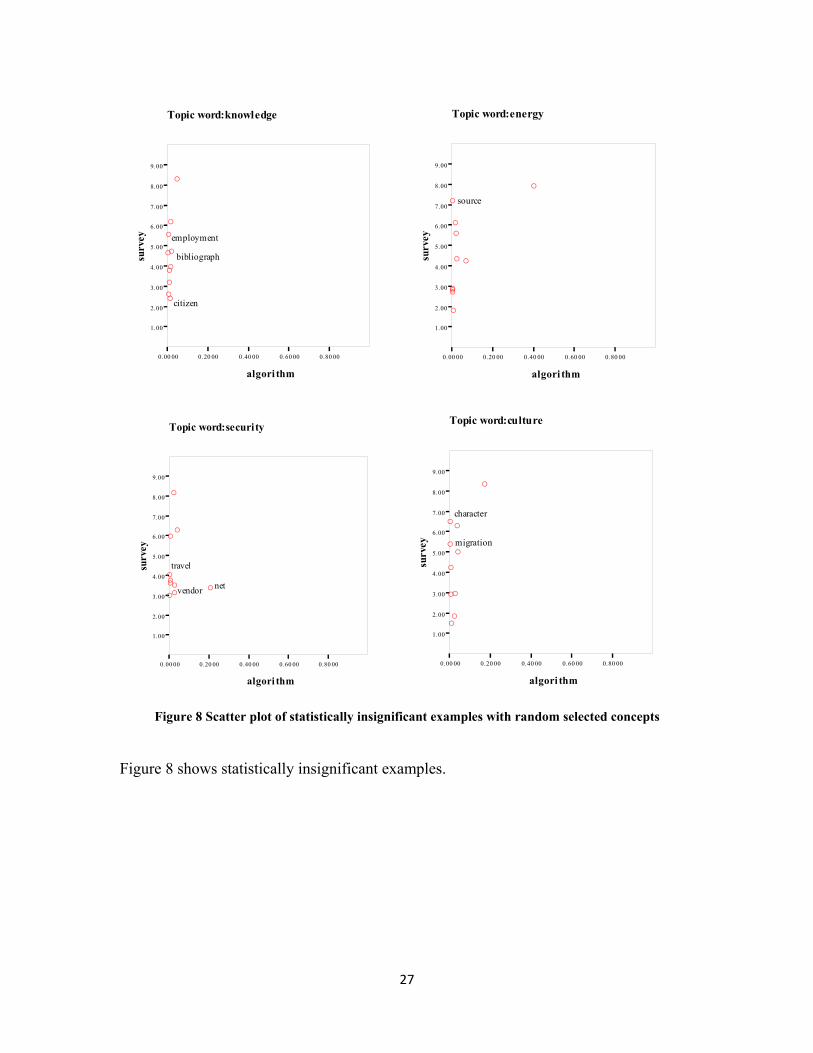
Figure 8 Scatter plot of statistically insignificant examples with random selected concepts
Figure 8 shows statistically insignificant examples.
27
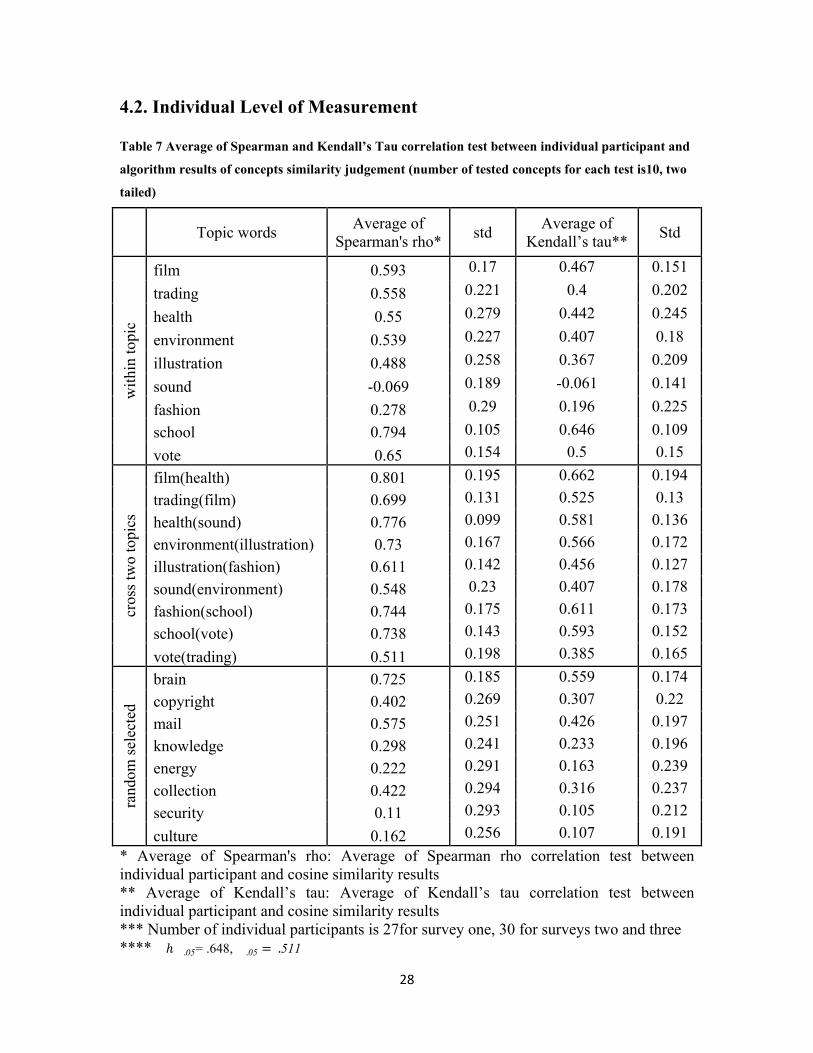
4.2. Individual Level of Measurement
Table 7 Average of Spearman and Kendall’s Tau correlation test between individual participant and
algorithm results of concepts similarity judgement (number of tested concepts for each test is10, two
tailed)
Topic words Average of Spearman's rho* std Average of
Kendall’s tau** Std
with
in to
pic
film 0.593 0.17 0.467 0.151
trading 0.558 0.221 0.4 0.202
health 0.55 0.279 0.442 0.245
environment 0.539 0.227 0.407 0.18
illustration 0.488 0.258 0.367 0.209
sound -0.069 0.189 -0.061 0.141
fashion 0.278 0.29 0.196 0.225 school 0.794 0.105 0.646 0.109 vote 0.65 0.154 0.5 0.15
cros
s tw
o to
pics
film(health) 0.801 0.195 0.662 0.194 trading(film) 0.699 0.131 0.525 0.13 health(sound) 0.776 0.099 0.581 0.136 environment(illustration) 0.73 0.167 0.566 0.172 illustration(fashion) 0.611 0.142 0.456 0.127 sound(environment) 0.548 0.23 0.407 0.178 fashion(school) 0.744 0.175 0.611 0.173 school(vote) 0.738 0.143 0.593 0.152 vote(trading) 0.511 0.198 0.385 0.165
rand
om se
lect
ed
brain 0.725 0.185 0.559 0.174 copyright 0.402 0.269 0.307 0.22 mail 0.575 0.251 0.426 0.197 knowledge 0.298 0.241 0.233 0.196 energy 0.222 0.291 0.163 0.239 collection 0.422 0.294 0.316 0.237 security 0.11 0.293 0.105 0.212 culture 0.162 0.256 0.107 0.191
* Average of Spearman's rho: Average of Spearman rho correlation test between individual participant and cosine similarity results ** Average of Kendall’s tau: Average of Kendall’s tau correlation test between individual participant and cosine similarity results *** Number of individual participants is 27for survey one, 30 for surveys two and three
28
**** � �.05= .648, �.05 .511
When we compare the results in Table 7 with those in Table 4, Table 5 and Table 6, we
notice several details involving the population level of measurement results and the
individual level of measurement results.
First, the overall correlation results for the average of individual level tests are smaller
than the ones for the population level tests.
Secondly, when we compare each individual result, we find that some results are very
similar for both levels of measurements. For example, for the topic word “school” under
the within topic concepts similarity judgement, the rhopopulation level = .891 and the
rhoindividual level = .794. On the other hand, some results are very different for the
population level test and individual level test. For example, for the topic word
“environment” under the within topic concepts similarity judgement, the
rhopopulation level= .818 while the rhoindividual level= .539.
And, finally, those topic words which have insignificant results in the population level
test also fail to reject the null hypothesis in the individual level test.
29
Chapter 5: Discussion
5.1. Summary of Results
After completing all experiments and tests, the population level measurement results
show that, for most topic words and their lists of concepts tested, the results support our
hypothesis that there is a strong correlation between human judgements of concept
similarity and the tag connections from del.icio.us. There are, however, a couple of
results which fail to support our hypothesis: the topic words “sound” and “fashion” for
the within same category concepts test, and the topic words “knowledge,” “energy,”
“security” and “culture” for the randomly selected concepts test. Overall, the results show
evidence that the within same category, between two categories and random selected
concepts connections of tags in the conceptual model abstracted from del.icio.us system
are strongly correlated with human judgements of concepts connections. The conceptual
model for the del.icio.us tagging system captures human cognitive concept association,
which in turn indicates that the del.icio.us tagging system might be a good platform for
representing how humans think about concepts connection.
An overview of the individual level measurement results in Table 7 shows that the overall
correlation results are smaller than those for population level measurement. Nor do the
two levels of measurement always have similar results. But in general, the individual
level tests results do tend to correspond. Notice that we are only testing the connection by
using ten words.
5.2. Analysis of Results
5.2.1. Population Level Measurement Results
When we compare Table 4, Table 5, and Table 6, both Spearman’s rho and Kendall’s tau
results indicate that tag connections in del.icio.us are much closer to human judgement
when the boundary of a conceptual category has been determined beforehand. And it can
better represent human thoughts about concepts connection when concepts are selected
from within a category instead of being totally randomly selected ones.
30
There might be some variations existing in the results when similar concepts are included
under a category because of the feedback mechanism in del.icio.us and because of the
way we designed our experiment. Users of del.icio.us would tend to adopt average
people’s suggestion on tag connections instead of creating their own. The average
knowledge in del.icio.us might affect the distribution of tag connections because of user
adoption of system suggested tags, which might affect tag connection in del.icio.us.
While in our survey, we asked individual people to judge the concepts connection and no
feedback was given. The survey results represent individual thought concerning concepts
connection. This could cause some differences between individual rankings of concepts
connection and cosine similarity results.
For tests involving two conceptual categories, people tend to distinguish the differences
in two categories better than differences within the same category. For example, given
five concepts: apple, orange, pear, pen, stapler, people can easily distinguish the
differences between the two categories and conclude that the first three concepts are more
connected to each other, and the remaining two concepts are closer to each other. But if
people are asked to compare the strength of connections among apple, orange, pear and
rank them from 1 to 3, task becomes more difficult than the previous task. And people
would not always indicate the same rank because they would connect the concepts in
different ways. Some might rank orange and pear closely because their colors are closer
to each other than to that of an apple; some might rank apple and orange more closely
because of the similarity in shapes; others might make a totally different connection
based on other attributes. This is likely the reason why we get better results for between
categories test compared to within category test.
When we are asked to connect randomly selected concepts, the task becomes even harder.
Participants commented that they had trouble distinguishing how the concepts were
related. Although they still could make connections among randomly selected words,
they would do it very differently, nor would they agree with each other that well.
31
5.2.2. Individual Level Measurement Results
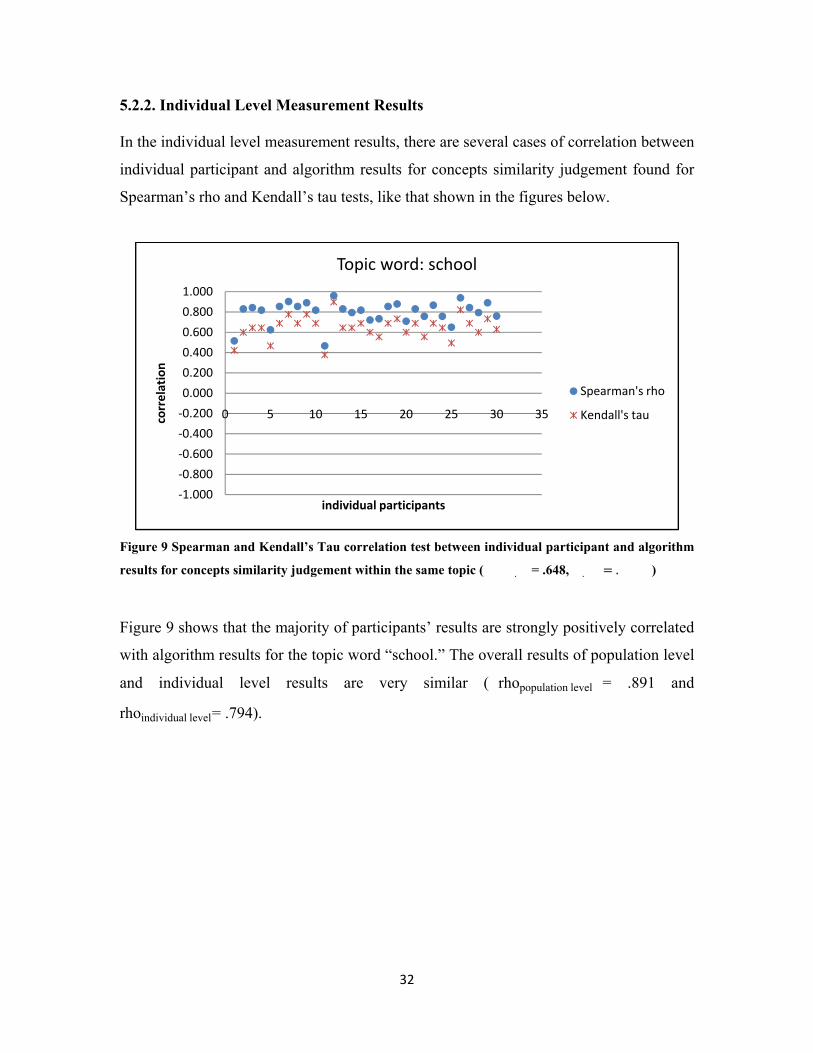
In the individual level measurement results, there are several cases of correlation between
individual participant and algorithm results for concepts similarity judgement found for
Spearman’s rho and Kendall’s tau tests, like that shown in the figures below.
‐1.000
‐0.800
‐0.600
‐0.400
‐0.200
0.000
0.200
0.400
0.600
0.800
1.000
0 5 10 15 20 25 30 35correlation
individual participants
Topic word: school
Spearman's rho
Kendall's tau
Figure 9 Spearman and Kendall’s Tau correlation test between individual participant and algorithm
results for concepts similarity judgement within the same topic (���.��= .648, �.�� .���)
Figure 9 shows that the majority of participants’ results are strongly positively correlated
with algorithm results for the topic word “school.” The overall results of population level
and individual level results are very similar ( rhopopulation level = .891 and
rhoindividual level= .794).
32
‐1.000
‐0.800
‐0.600
‐0.400
‐0.200
0.000
0.200
0.400
0.600
0.800
1.000
0 5 10 15 20 25 30 35correlation
individual participants
Topic word: environment
Spearman's rho
Kendall's tau
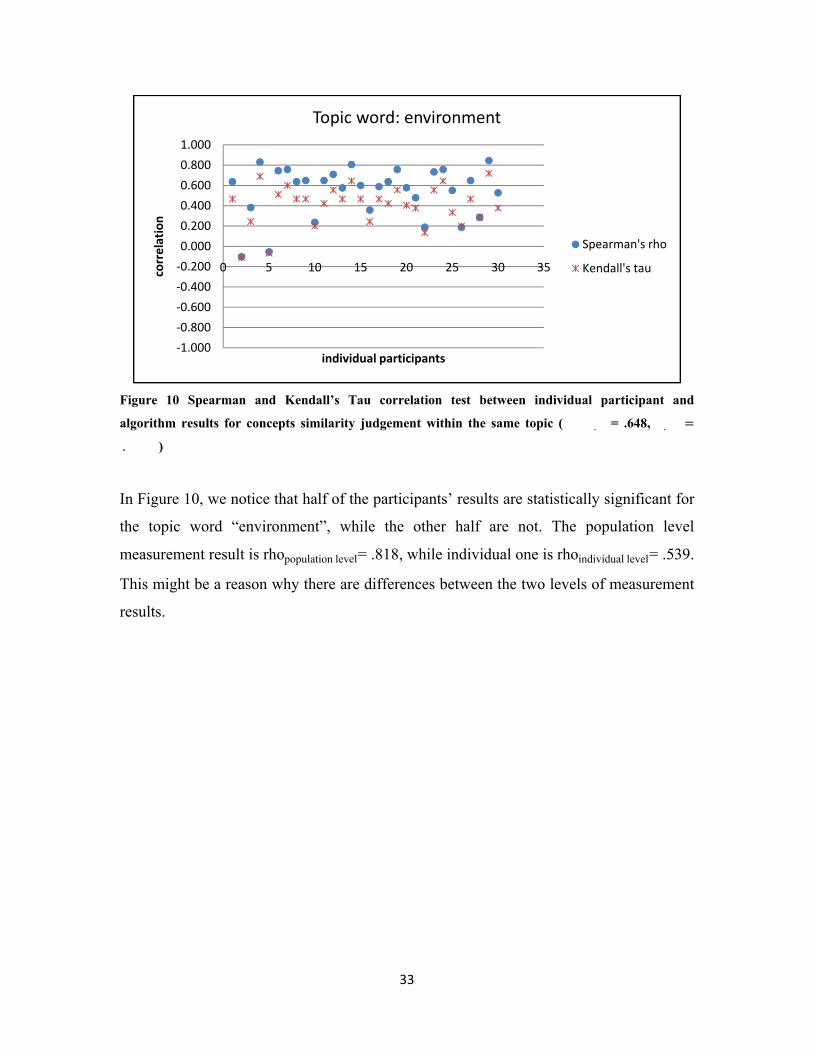
Figure 10 Spearman and Kendall’s Tau correlation test between individual participant and
algorithm results for concepts similarity judgement within the same topic (���.��= .648, �.��
.���)
In Figure 10, we notice that half of the participants’ results are statistically significant for
the topic word “environment”, while the other half are not. The population level
measurement result is rhopopulation level= .818, while individual one is rhoindividual level= .539.
This might be a reason why there are differences between the two levels of measurement
results.
33
‐1.000
‐0.800
‐0.600
‐0.400
‐0.200
0.000
0.200
0.400
0.600
0.800
1.000
0 5 10 15 20 25 30 35correlation
individaul participants
Topic word: sound
Spearman's rho
Kendall's tau
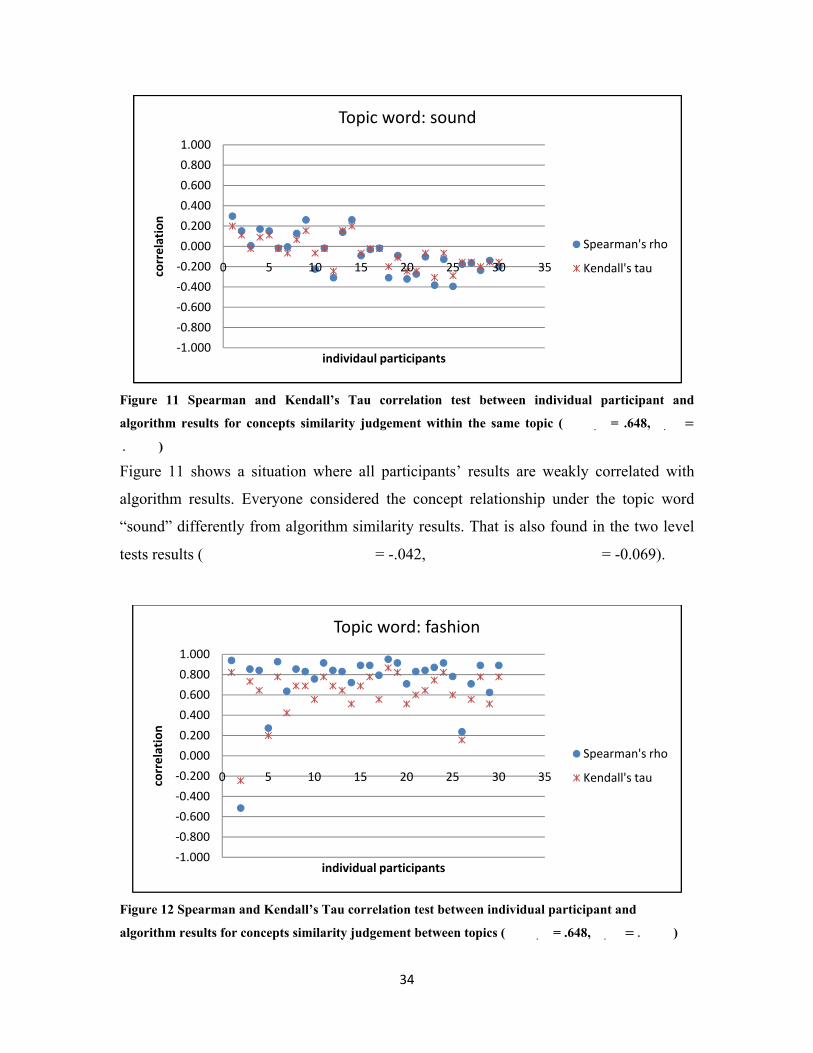
Figure 11 Spearman and Kendall’s Tau correlation test between individual participant and
algorithm results for concepts similarity judgement within the same topic (���.��= .648, �.��
.���)
Figure 11 shows a situation where all participants’ results are weakly correlated with
algorithm results. Everyone considered the concept relationship under the topic word
“sound” differently from algorithm similarity results. That is also found in the two level
tests results (������������� �����= -.042, ������������� �����= -0.069).
‐1.000
‐0.800
‐0.600
‐0.400
‐0.200
0.000
0.200
0.400
0.600
0.800
1.000
0 5 10 15 20 25 30 35correlation
individual participants
Topic word: fashion
Spearman's rho
Kendall's tau
Figure 12 Spearman and Kendall’s Tau correlation test between individual participant and
algorithm results for concepts similarity judgement between topics (���.��= .648, �.�� .���)
34
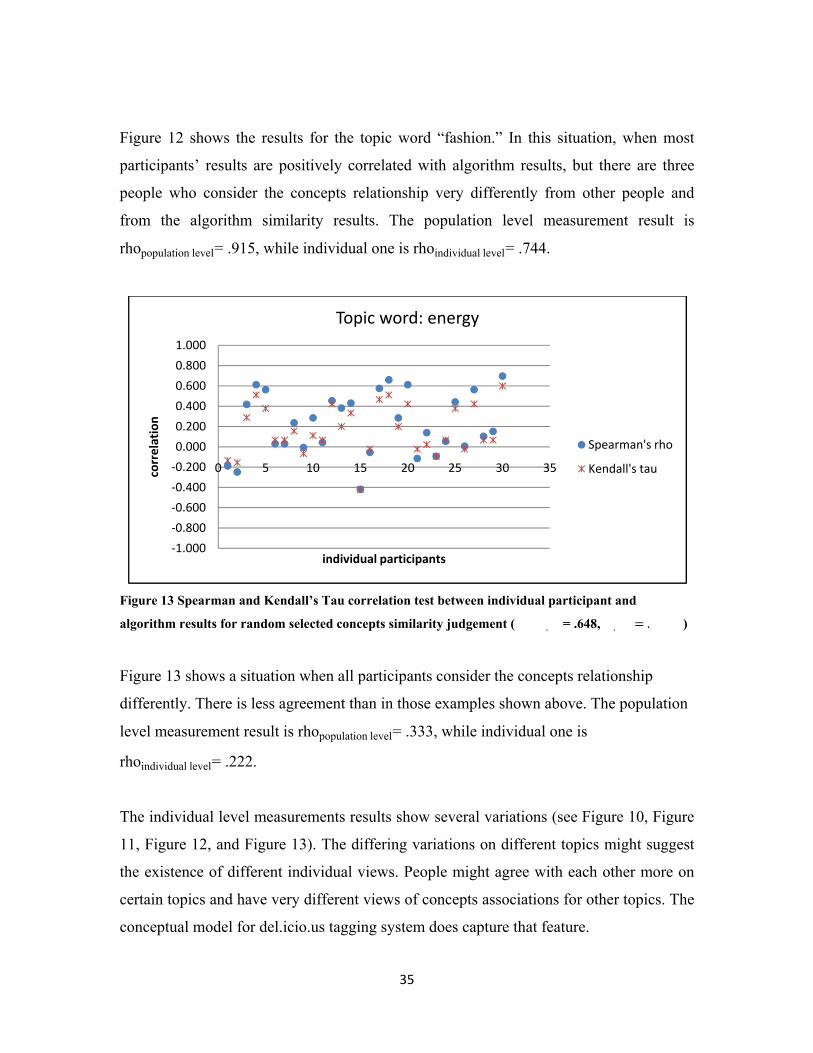
Figure 12 shows the results for the topic word “fashion.” In this situation, when most
participants’ results are positively correlated with algorithm results, but there are three
people who consider the concepts relationship very differently from other people and
from the algorithm similarity results. The population level measurement result is
rhopopulation level= .915, while individual one is rhoindividual level= .744.
‐1.000
‐0.800
‐0.600
‐0.400
‐0.200
0.000
0.200
0.400
0.600
0.800
1.000
0 5 10 15 20 25 30 35correlation
individual participants
Topic word: energy
Spearman's rho
Kendall's tau
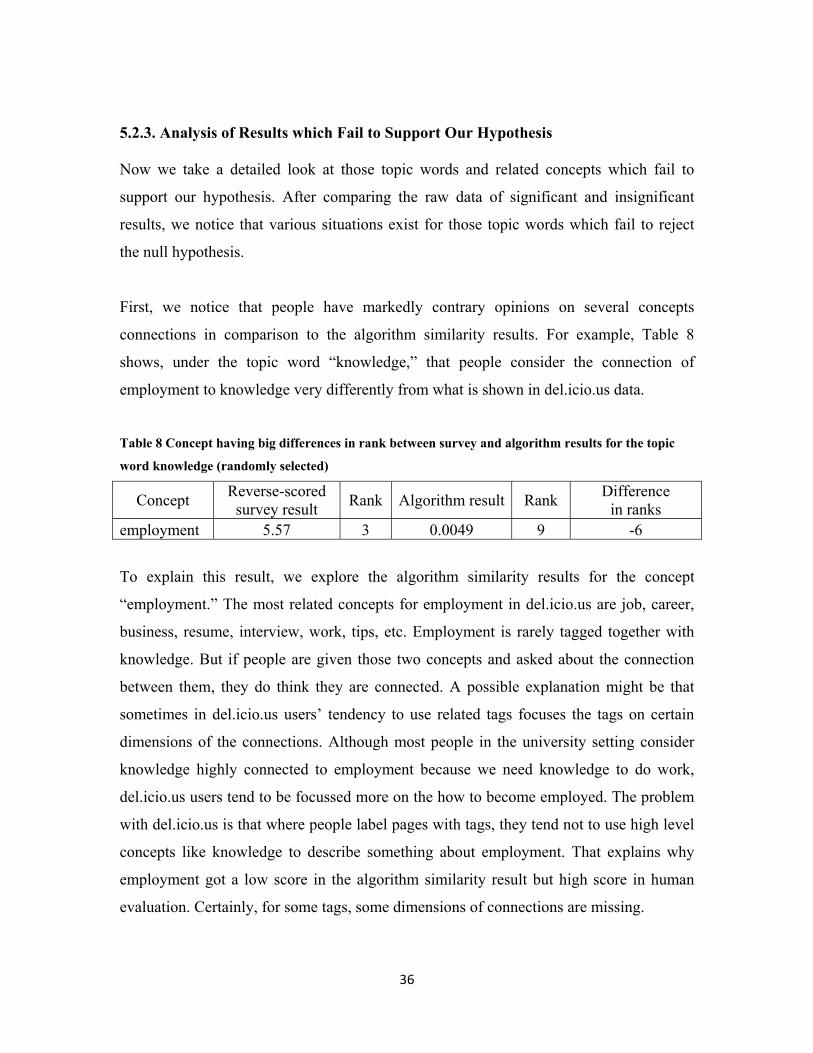
Figure 13 Spearman and Kendall’s Tau correlation test between individual participant and
algorithm results for random selected concepts similarity judgement (���.��= .648, �.�� .���)
Figure 13 shows a situation when all participants consider the concepts relationship
differently. There is less agreement than in those examples shown above. The population
level measurement result is rhopopulation level= .333, while individual one is
rhoindividual level= .222.
The individual level measurements results show several variations (see Figure 10, Figure
11, Figure 12, and Figure 13). The differing variations on different topics might suggest
the existence of different individual views. People might agree with each other more on
certain topics and have very different views of concepts associations for other topics. The
conceptual model for del.icio.us tagging system does capture that feature.
35
5.2.3. Analysis of Results which Fail to Support Our Hypothesis
Now we take a detailed look at those topic words and related concepts which fail to
support our hypothesis. After comparing the raw data of significant and insignificant
results, we notice that various situations exist for those topic words which fail to reject
the null hypothesis.
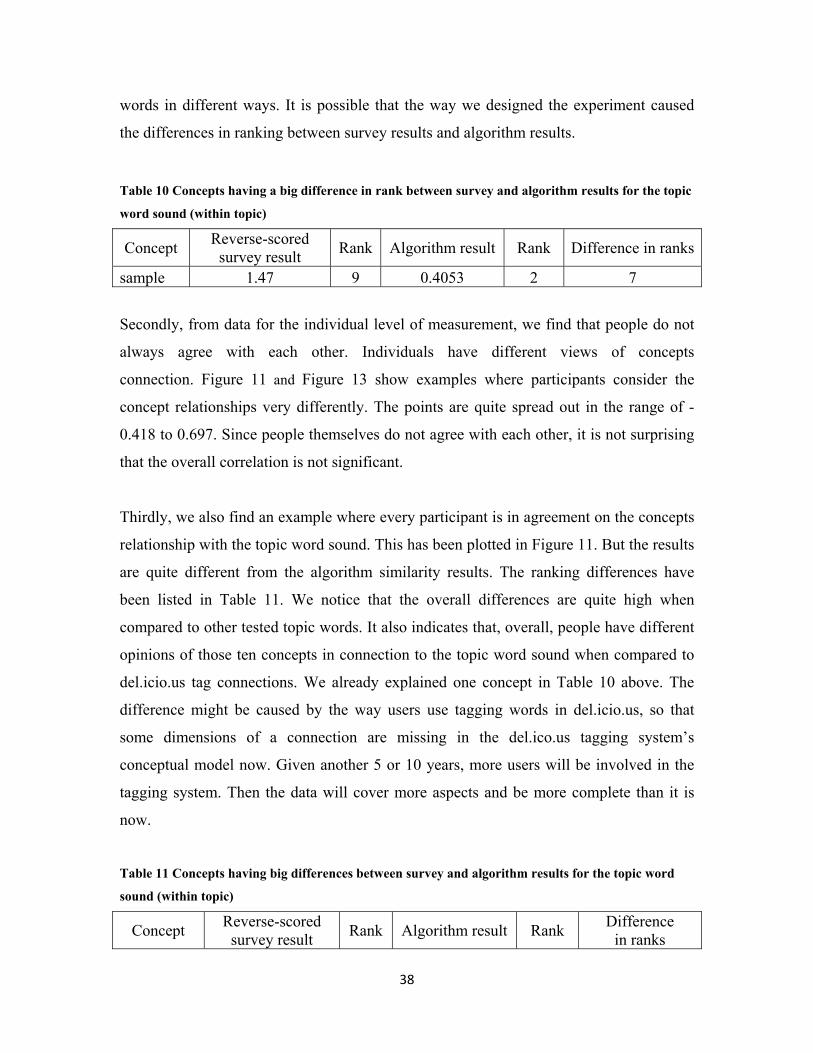
First, we notice that people have markedly contrary opinions on several concepts
connections in comparison to the algorithm similarity results. For example, Table 8
shows, under the topic word “knowledge,” that people consider the connection of
employment to knowledge very differently from what is shown in del.icio.us data.
Table 8 Concept having big differences in rank between survey and algorithm results for the topic
word knowledge (randomly selected)
Concept Reverse-scored survey result Rank Algorithm result Rank Difference
in ranks employment 5.57 3 0.0049 9 -6
To explain this result, we explore the algorithm similarity results for the concept
“employment.” The most related concepts for employment in del.icio.us are job, career,
business, resume, interview, work, tips, etc. Employment is rarely tagged together with
knowledge. But if people are given those two concepts and asked about the connection
between them, they do think they are connected. A possible explanation might be that
sometimes in del.icio.us users’ tendency to use related tags focuses the tags on certain
dimensions of the connections. Although most people in the university setting consider
knowledge highly connected to employment because we need knowledge to do work,
del.icio.us users tend to be focussed more on the how to become employed. The problem
with del.icio.us is that where people label pages with tags, they tend not to use high level
concepts like knowledge to describe something about employment. That explains why
employment got a low score in the algorithm similarity result but high score in human
evaluation. Certainly, for some tags, some dimensions of connections are missing.
36

Exploring other examples, we notice that the causes for the huge difference in rankings
are not always the same. Difference might be caused by an over representation of
computer related topics in del.icio.us data. Since the del.icio.us system was created in
2003, the early users of this system were people who had a major interest in computer
related things, so most of their tags are computer terms. Later on, even though other
people became involved in the system, its computer origins still affect the tagging
distribution. In our evaluation, we eliminated computer related words, but we did not
filter out those web pages that contain computer related words. Consequently, our results
may still be affected by the over representation of computer related topics. For example,
the concept design in Table 9 has been used very frequently with computer related
concepts like software in del.icio.us, which may cause the connection between fashion
and design to be quite low in algorithm similarity results.
Table 9 Concepts having a big difference in rank between survey and algorithm results for the topic
word fashion (within topic)
Concept Reverse-scored survey result Rank Algorithm result Rank Difference in ranks
design 7.10 2 0.0890 7 -5 accessory 2.07 5 0.0225 10 -5
Some concepts, like “accessory” in Table 9, tend to be used more often with subcategory
concepts like “footwear,” “jewellery,” “handbag,” etc. Others, like the concept “sample”
in Table 10, del.icio.us users place together with “sound”, as in “sound sample” for
online music. Since online music is very popular on the web, many people tag them
together, which make the two concepts more similar. It is also possible that in del.icio.us,
users use tags for the purposes of relocating and sharing information. The tag connection
retrieved when this happens might lose certain dimensions connections would otherwise
have. This also occurs when people categorize things. When we need to come up with a
word to describe an item, our mind does not necessarily capture a whole picture of the
concepts connected to that item. We might only get a couple of directly connected words
but not all of the possible words. But when we are given a list of words related to the item,
as was done in our survey, our mind can make connections with the item to all these
37
words in different ways. It is possible that the way we designed the experiment caused
the differences in ranking between survey results and algorithm results.
Table 10 Concepts having a big difference in rank between survey and algorithm results for the topic
word sound (within topic)
Concept Reverse-scored survey result Rank Algorithm result Rank Difference in ranks
sample 1.47 9 0.4053 2 7
Secondly, from data for the individual level of measurement, we find that people do not
always agree with each other. Individuals have different views of concepts
connection. Figure 11 and Figure 13 show examples where participants consider the
concept relationships very differently. The points are quite spread out in the range of -
0.418 to 0.697. Since people themselves do not agree with each other, it is not surprising
that the overall correlation is not significant.
Thirdly, we also find an example where every participant is in agreement on the concepts
relationship with the topic word sound. This has been plotted in Figure 11. But the results
are quite different from the algorithm similarity results. The ranking differences have
been listed in Table 11. We notice that the overall differences are quite high when
compared to other tested topic words. It also indicates that, overall, people have different
opinions of those ten concepts in connection to the topic word sound when compared to
del.icio.us tag connections. We already explained one concept in Table 10 above. The
difference might be caused by the way users use tagging words in del.icio.us, so that
some dimensions of a connection are missing in the del.ico.us tagging system’s
conceptual model now. Given another 5 or 10 years, more users will be involved in the
tagging system. Then the data will cover more aspects and be more complete than it is
now.
Table 11 Concepts having big differences between survey and algorithm results for the topic word
sound (within topic)
Concept Reverse-scored survey result Rank Algorithm result Rank Difference
in ranks
38
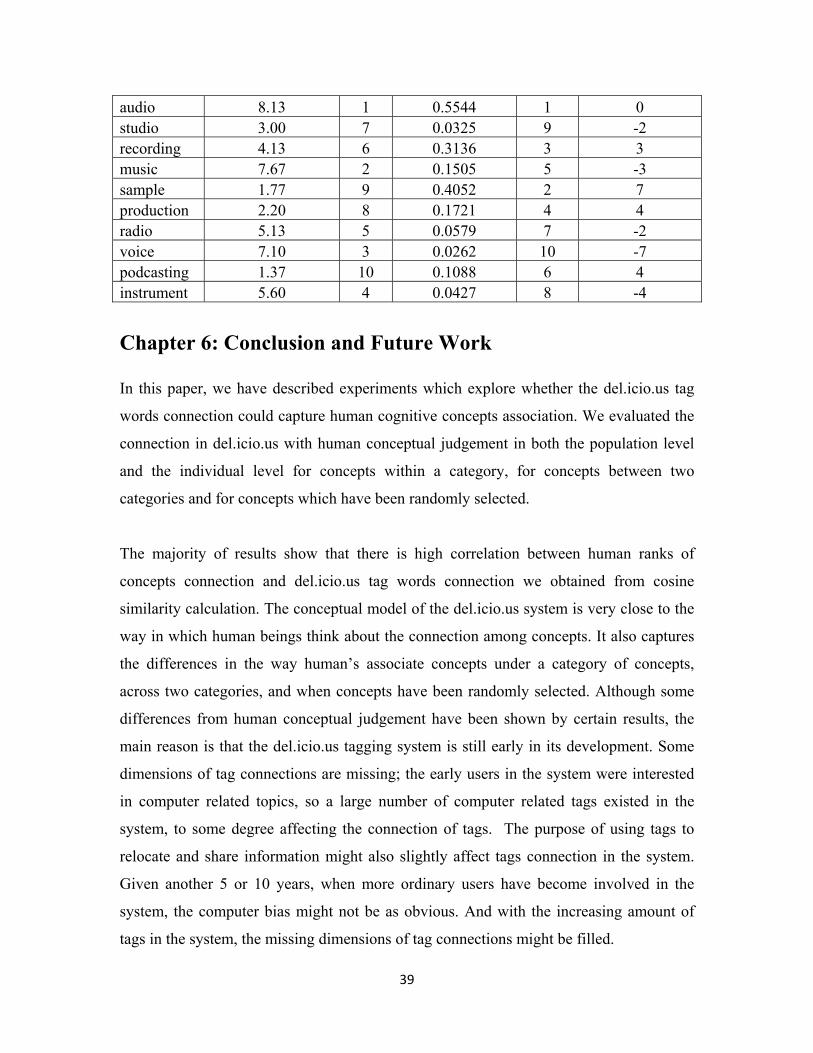
audio 8.13 1 0.5544 1 0 studio 3.00 7 0.0325 9 -2 recording 4.13 6 0.3136 3 3 music 7.67 2 0.1505 5 -3 sample 1.77 9 0.4052 2 7 production 2.20 8 0.1721 4 4 radio 5.13 5 0.0579 7 -2 voice 7.10 3 0.0262 10 -7 podcasting 1.37 10 0.1088 6 4 instrument 5.60 4 0.0427 8 -4
Chapter 6: Conclusion and Future Work
In this paper, we have described experiments which explore whether the del.icio.us tag
words connection could capture human cognitive concepts association. We evaluated the
connection in del.icio.us with human conceptual judgement in both the population level
and the individual level for concepts within a category, for concepts between two
categories and for concepts which have been randomly selected.
The majority of results show that there is high correlation between human ranks of
concepts connection and del.icio.us tag words connection we obtained from cosine
similarity calculation. The conceptual model of the del.icio.us system is very close to the
way in which human beings think about the connection among concepts. It also captures
the differences in the way human’s associate concepts under a category of concepts,
across two categories, and when concepts have been randomly selected. Although some
differences from human conceptual judgement have been shown by certain results, the
main reason is that the del.icio.us tagging system is still early in its development. Some
dimensions of tag connections are missing; the early users in the system were interested
in computer related topics, so a large number of computer related tags existed in the
system, to some degree affecting the connection of tags. The purpose of using tags to
relocate and share information might also slightly affect tags connection in the system.
Given another 5 or 10 years, when more ordinary users have become involved in the
system, the computer bias might not be as obvious. And with the increasing amount of
tags in the system, the missing dimensions of tag connections might be filled.
39
Even now, however, we could use the conceptual model of the del.icio.us tagging system
as a model for studying human understanding of concepts connection, in order to conduct
research in the area of linguistic study with its massive amount of data, to add user value
in improving keyword extraction technology, or to use a commonly agreed upon domain
of the knowledge of a collective population to process information and solve problems.
Finally, we have pointed out several areas for future research. First, as we mentioned
earlier, we designed the survey before using cosine similarity algorithm to obtain
concepts similarity results. Candidate concepts are selected using Hublog visualization
tool and algorithm to calculate size of overlapped websites that tag has been used to.
Further study could directly use cosine similarity algorithm (see Section 3.3) results to
select candidate words for the survey. Secondly, since we did not filter out those web
pages which over represented computer related topics, our results were affected. Further
study could work on a more advanced algorithm design to better deal with the problem
and get an even more precise measurement of concept similarity. Thirdly, there are some
limitations to the design of our experiment. We gave participants topic words and ten
related concepts for them to make a judgement about the concepts’ connection, which is
slightly different from the tagging process in del.icio.us. If we were to give certain topic
words to participants and let them come up with a number of concepts related to each
topic word, the process would be closer to the tagging process in del.icio.us. Fourthly, a
comparison of the del.icio.us tagging system and a traditional information retrieval
system or WordNet could be done to evaluate user preference and the effectiveness of
information retrieval. Fifthly, since the conceptual model of the del.ico.us tagging system
is not fixed, future vocabulary change and new phenomenon occurrence will be recorded
in the conceptual model as well. A comparison of future conceptual models for the
tagging system and the one we have right now could also be done.
40
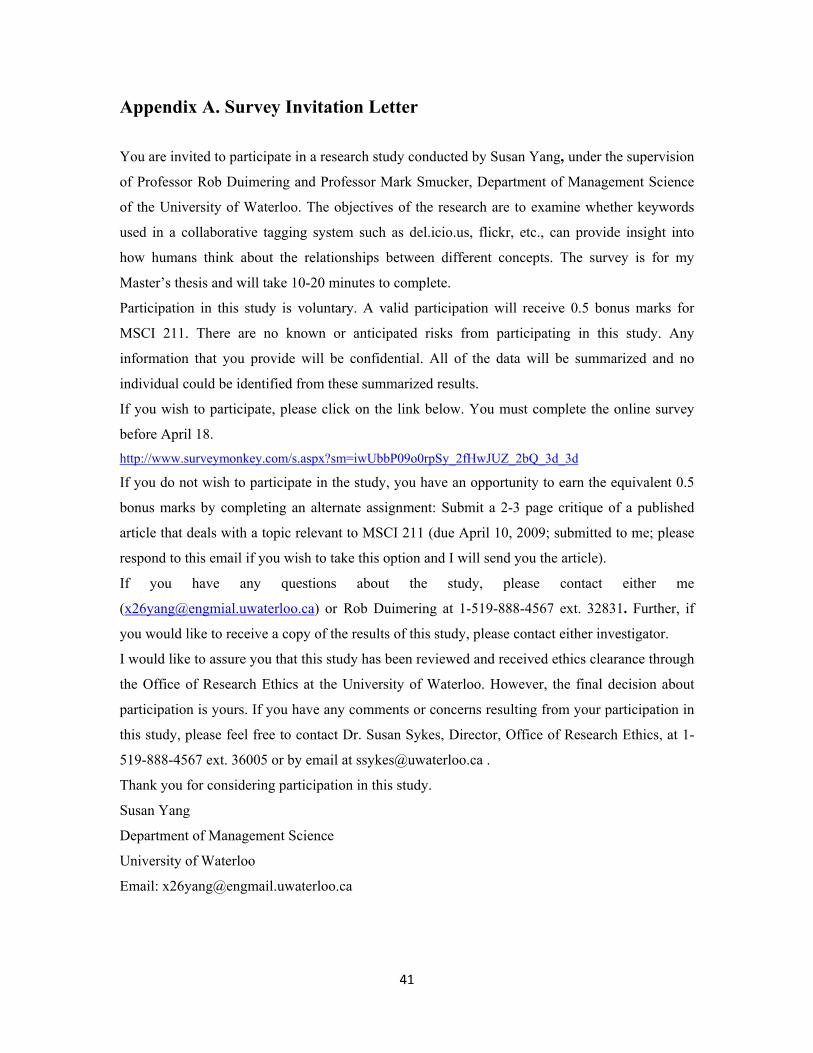
Appendix A. Survey Invitation Letter
You are invited to participate in a research study conducted by Susan Yang, under the supervision
of Professor Rob Duimering and Professor Mark Smucker, Department of Management Science
of the University of Waterloo. The objectives of the research are to examine whether keywords
used in a collaborative tagging system such as del.icio.us, flickr, etc., can provide insight into
how humans think about the relationships between different concepts. The survey is for my
Master’s thesis and will take 10-20 minutes to complete.
Participation in this study is voluntary. A valid participation will receive 0.5 bonus marks for
MSCI 211. There are no known or anticipated risks from participating in this study. Any
information that you provide will be confidential. All of the data will be summarized and no
individual could be identified from these summarized results.
If you wish to participate, please click on the link below. You must complete the online survey
before April 18. http://www.surveymonkey.com/s.aspx?sm=iwUbbP09o0rpSy_2fHwJUZ_2bQ_3d_3d
If you do not wish to participate in the study, you have an opportunity to earn the equivalent 0.5
bonus marks by completing an alternate assignment: Submit a 2-3 page critique of a published
article that deals with a topic relevant to MSCI 211 (due April 10, 2009; submitted to me; please
respond to this email if you wish to take this option and I will send you the article).
If you have any questions about the study, please contact either me
([email protected]) or Rob Duimering at 1-519-888-4567 ext. 32831. Further, if
you would like to receive a copy of the results of this study, please contact either investigator.
I would like to assure you that this study has been reviewed and received ethics clearance through
the Office of Research Ethics at the University of Waterloo. However, the final decision about
participation is yours. If you have any comments or concerns resulting from your participation in
this study, please feel free to contact Dr. Susan Sykes, Director, Office of Research Ethics, at 1-
519-888-4567 ext. 36005 or by email at [email protected] .
Thank you for considering participation in this study.
Susan Yang
Department of Management Science
University of Waterloo
Email: [email protected]
41
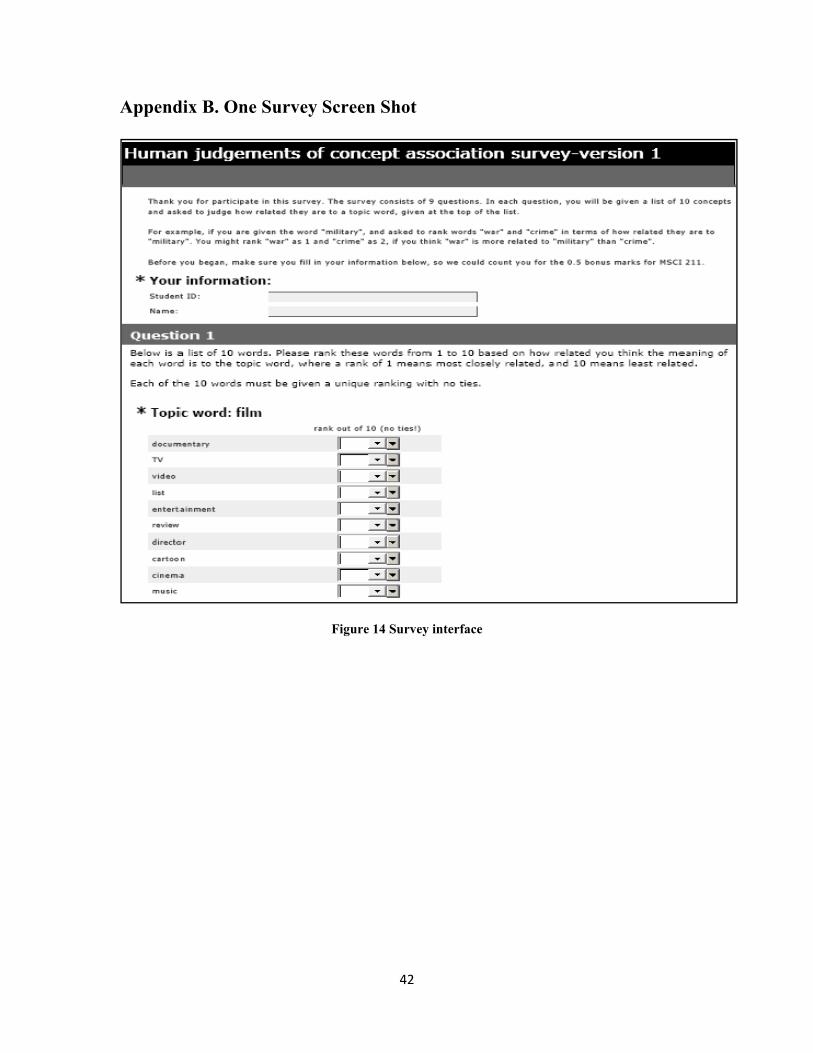
Appendix B. One Survey Screen Shot
Figure 14 Survey interface
42
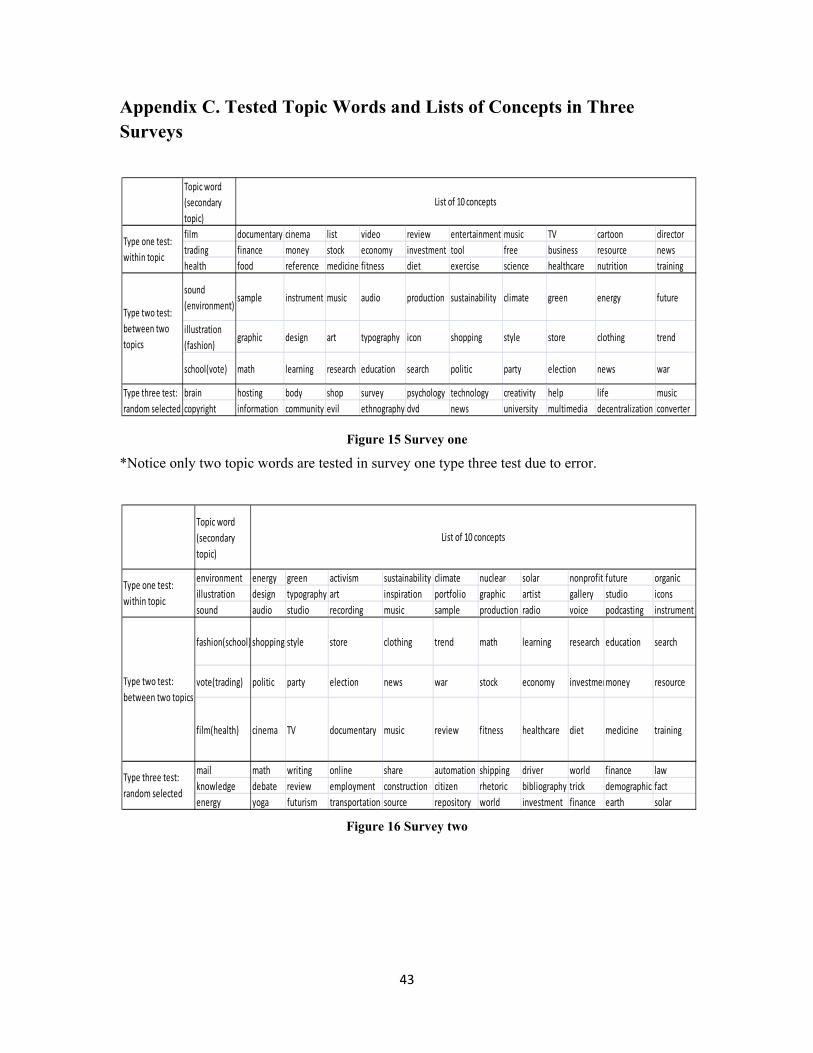
Appendix C. Tested Topic Words and Lists of Concepts in Three Surveys
Topic word (secondary topic)film documentary cinema list video review entertainment music TV cartoon directortrading finance money stock economy investment tool free business resource newshealth food reference medicine fitness diet exercise science healthcare nutrition training
sound (environment)
sample instrument music audio production sustainability climate green energy future
illustration (fashion)
graphic design art typography icon shopping style store clothing trend
school(vote) math learning research education search politic party election news war
brain hosting body shop survey psychology technology creativity help life musiccopyright information community evil ethnography dvd news university multimedia decentralization converter
Type one test: within topic
Type two test: between two topics
List of 10 concepts
Type three test: random selected
Figure 15 Survey one
*Notice only two topic words are tested in survey one type three test due to error.
Topic word (secondary topic)
environment energy green activism sustainability climate nuclear solar nonprofit future organicillustration design typography art inspiration portfolio graphic artist gallery studio iconssound audio studio recording music sample production radio voice podcasting instrument
fashion(school) shopping style store clothing trend math learning research education search
vote(trading) politic party election news war stock economy investmenmoney resource
film(health) cinema TV documentary music review fitness healthcare diet medicine training
mail math writing online share automation shipping driver world finance lawknowledge debate review employment construction citizen rhetoric bibliography trick demographic factenergy yoga futurism transportation source repository world investment finance earth solar
List of 10 concepts
Type one test: within topic
Type two test: between two topics
Type three test: random selected
Figure 16 Survey two
43
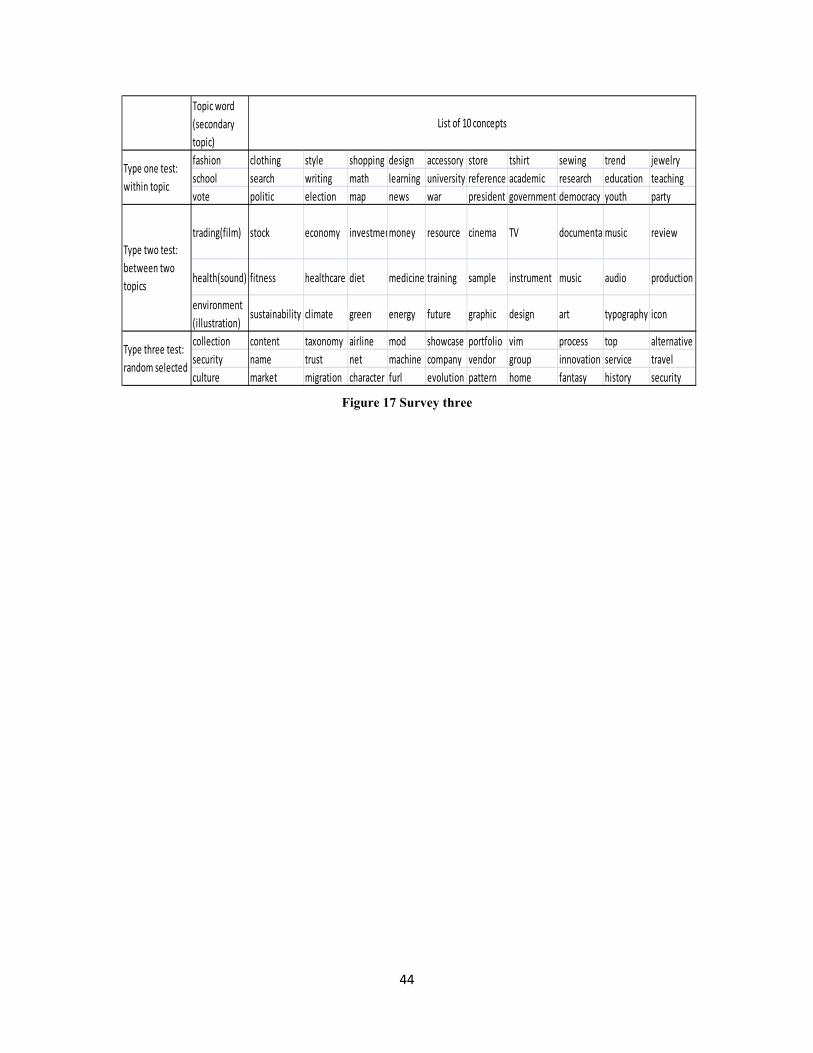
Topic word (secondary topic)fashion clothing style shopping design accessory store tshirt sewing trend jewelryschool search writing math learning university reference academic research education teachingvote politic election map news war president government democracy youth party
trading(film) stock economy investmenmoney resource cinema TV documenta music review
health(sound) fitness healthcare diet medicine training sample instrument music audio production
environment (illustration)
sustainability climate green energy future graphic design art typography icon
collection content taxonomy airline mod showcase portfolio vim process top alternativesecurity name trust net machine company vendor group innovation service travelculture market migration character furl evolution pattern home fantasy history security
List of 10 concepts
Type one test: within topic
Type two test: between two topics
Type three test: random selected
Figure 17 Survey three
44
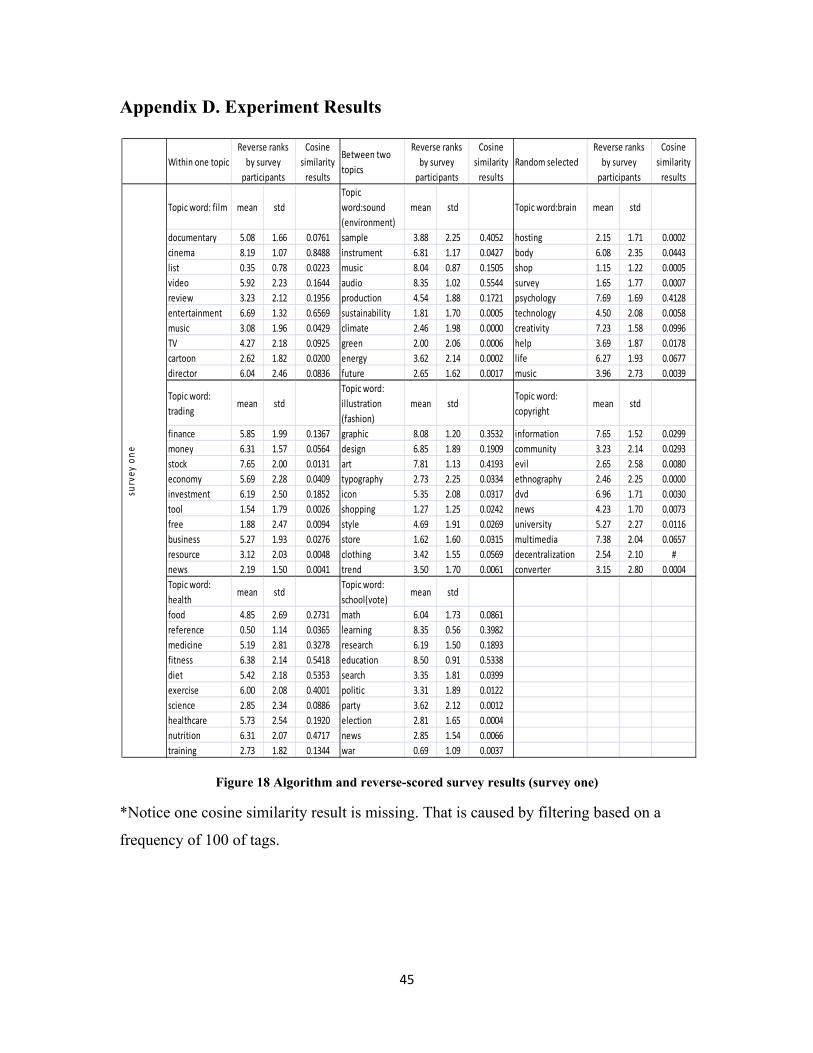
Appendix D. Experiment Results
Within one topicCosine
similarity results
Between two topics
Cosine similarity results
Random selectedCosine
similarity results
Topic word: film mean stdTopic word:sound (environment)
mean std Topic word:brain mean std
documentary 5.08 1.66 0.0761 sample 3.88 2.25 0.4052 hosting 2.15 1.71 0.0002cinema 8.19 1.07 0.8488 instrument 6.81 1.17 0.0427 body 6.08 2.35 0.0443list 0.35 0.78 0.0223 music 8.04 0.87 0.1505 shop 1.15 1.22 0.0005video 5.92 2.23 0.1644 audio 8.35 1.02 0.5544 survey 1.65 1.77 0.0007review 3.23 2.12 0.1956 production 4.54 1.88 0.1721 psychology 7.69 1.69 0.4128entertainment 6.69 1.32 0.6569 sustainability 1.81 1.70 0.0005 technology 4.50 2.08 0.0058music 3.08 1.96 0.0429 climate 2.46 1.98 0.0000 creativity 7.23 1.58 0.0996TV 4.27 2.18 0.0925 green 2.00 2.06 0.0006 help 3.69 1.87 0.0178cartoon 2.62 1.82 0.0200 energy 3.62 2.14 0.0002 life 6.27 1.93 0.0677director 6.04 2.46 0.0836 future 2.65 1.62 0.0017 music 3.96 2.73 0.0039
Topic word: trading
mean std Topic word: illustration (fashion)
mean stdTopic word: copyright
mean std
finance 5.85 1.99 0.1367 graphic 8.08 1.20 0.3532 information 7.65 1.52 0.0299money 6.31 1.57 0.0564 design 6.85 1.89 0.1909 community 3.23 2.14 0.0293stock 7.65 2.00 0.0131 art 7.81 1.13 0.4193 evil 2.65 2.58 0.0080economy 5.69 2.28 0.0409 typography 2.73 2.25 0.0334 ethnography 2.46 2.25 0.0000investment 6.19 2.50 0.1852 icon 5.35 2.08 0.0317 dvd 6.96 1.71 0.0030tool 1.54 1.79 0.0026 shopping 1.27 1.25 0.0242 news 4.23 1.70 0.0073free 1.88 2.47 0.0094 style 4.69 1.91 0.0269 university 5.27 2.27 0.0116business 5.27 1.93 0.0276 store 1.62 1.60 0.0315 multimedia 7.38 2.04 0.0657resource 3.12 2.03 0.0048 clothing 3.42 1.55 0.0569 decentralization 2.54 2.10 #news 2.19 1.50 0.0041 trend 3.50 1.70 0.0061 converter 3.15 2.80 0.0004Topic word: health
mean stdTopic word: school(vote)
mean std
food 4.85 2.69 0.2731 math 6.04 1.73 0.0861reference 0.50 1.14 0.0365 learning 8.35 0.56 0.3982medicine 5.19 2.81 0.3278 research 6.19 1.50 0.1893fitness 6.38 2.14 0.5418 education 8.50 0.91 0.5338diet 5.42 2.18 0.5353 search 3.35 1.81 0.0399exercise 6.00 2.08 0.4001 politic 3.31 1.89 0.0122science 2.85 2.34 0.0886 party 3.62 2.12 0.0012healthcare 5.73 2.54 0.1920 election 2.81 1.65 0.0004nutrition 6.31 2.07 0.4717 news 2.85 1.54 0.0066training 2.73 1.82 0.1344 war 0.69 1.09 0.0037
Reverse ranks by survey participants
Reverse ranks by survey participants
Reverse ranks by survey participants
surv
ey one
Figure 18 Algorithm and reverse-scored survey results (survey one)
*Notice one cosine similarity result is missing. That is caused by filtering based on a
frequency of 100 of tags.
45
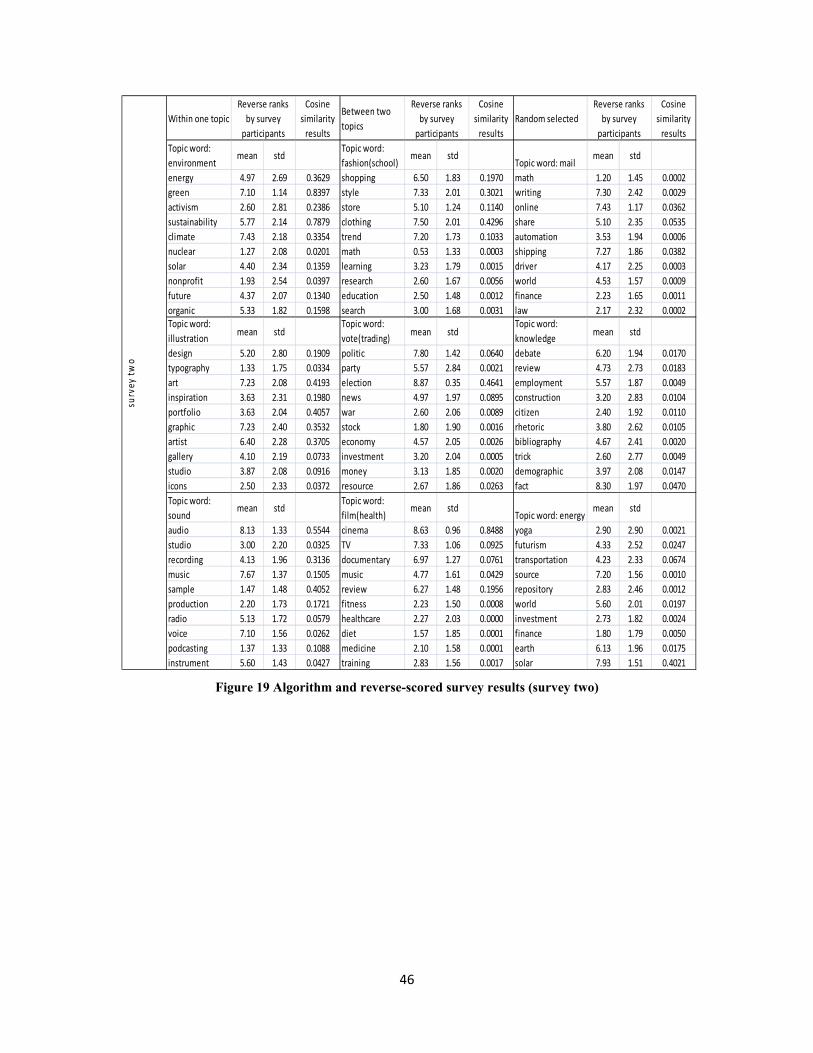
Within one topicCosine
similarity results
Between two topics
Cosine similarity results
Random selectedCosine
similarity results
Topic word: environment
mean stdTopic word: fashion(school)
mean stdTopic word: mail
mean std
energy 4.97 2.69 0.3629 shopping 6.50 1.83 0.1970 math 1.20 1.45 0.0002green 7.10 1.14 0.8397 style 7.33 2.01 0.3021 writing 7.30 2.42 0.0029activism 2.60 2.81 0.2386 store 5.10 1.24 0.1140 online 7.43 1.17 0.0362sustainability 5.77 2.14 0.7879 clothing 7.50 2.01 0.4296 share 5.10 2.35 0.0535climate 7.43 2.18 0.3354 trend 7.20 1.73 0.1033 automation 3.53 1.94 0.0006nuclear 1.27 2.08 0.0201 math 0.53 1.33 0.0003 shipping 7.27 1.86 0.0382solar 4.40 2.34 0.1359 learning 3.23 1.79 0.0015 driver 4.17 2.25 0.0003nonprofit 1.93 2.54 0.0397 research 2.60 1.67 0.0056 world 4.53 1.57 0.0009future 4.37 2.07 0.1340 education 2.50 1.48 0.0012 finance 2.23 1.65 0.0011organic 5.33 1.82 0.1598 search 3.00 1.68 0.0031 law 2.17 2.32 0.0002Topic word: illustration
mean stdTopic word: vote(trading)
mean stdTopic word: knowledge
mean std
design 5.20 2.80 0.1909 politic 7.80 1.42 0.0640 debate 6.20 1.94 0.0170typography 1.33 1.75 0.0334 party 5.57 2.84 0.0021 review 4.73 2.73 0.0183art 7.23 2.08 0.4193 election 8.87 0.35 0.4641 employment 5.57 1.87 0.0049inspiration 3.63 2.31 0.1980 news 4.97 1.97 0.0895 construction 3.20 2.83 0.0104portfolio 3.63 2.04 0.4057 war 2.60 2.06 0.0089 citizen 2.40 1.92 0.0110graphic 7.23 2.40 0.3532 stock 1.80 1.90 0.0016 rhetoric 3.80 2.62 0.0105artist 6.40 2.28 0.3705 economy 4.57 2.05 0.0026 bibliography 4.67 2.41 0.0020gallery 4.10 2.19 0.0733 investment 3.20 2.04 0.0005 trick 2.60 2.77 0.0049studio 3.87 2.08 0.0916 money 3.13 1.85 0.0020 demographic 3.97 2.08 0.0147icons 2.50 2.33 0.0372 resource 2.67 1.86 0.0263 fact 8.30 1.97 0.0470Topic word: sound
mean stdTopic word: film(health)
mean stdTopic word: energy
mean std
audio 8.13 1.33 0.5544 cinema 8.63 0.96 0.8488 yoga 2.90 2.90 0.0021studio 3.00 2.20 0.0325 TV 7.33 1.06 0.0925 futurism 4.33 2.52 0.0247recording 4.13 1.96 0.3136 documentary 6.97 1.27 0.0761 transportation 4.23 2.33 0.0674music 7.67 1.37 0.1505 music 4.77 1.61 0.0429 source 7.20 1.56 0.0010sample 1.47 1.48 0.4052 review 6.27 1.48 0.1956 repository 2.83 2.46 0.0012production 2.20 1.73 0.1721 fitness 2.23 1.50 0.0008 world 5.60 2.01 0.0197radio 5.13 1.72 0.0579 healthcare 2.27 2.03 0.0000 investment 2.73 1.82 0.0024voice 7.10 1.56 0.0262 diet 1.57 1.85 0.0001 finance 1.80 1.79 0.0050podcasting 1.37 1.33 0.1088 medicine 2.10 1.58 0.0001 earth 6.13 1.96 0.0175instrument 5.60 1.43 0.0427 training 2.83 1.56 0.0017 solar 7.93 1.51 0.4021
survey
two
Reverse ranks by survey participants
Reverse ranks by survey participants
Reverse ranks by survey participants
Figure 19 Algorithm and reverse-scored survey results (survey two)
46
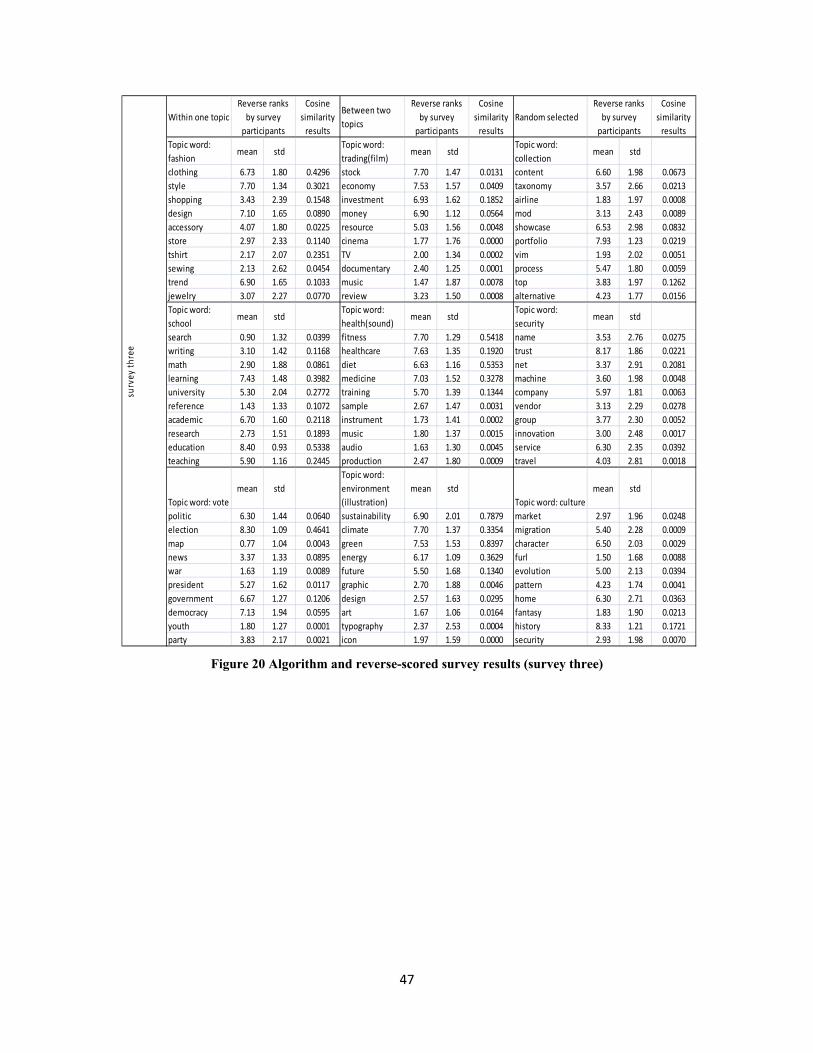
Within one topicCosine
similarity results
Between two topics
Cosine similarity results
Random selectedCosine
similarity results
Topic word: fashion
mean stdTopic word: trading(film)
mean stdTopic word: collection
mean std
clothing 6.73 1.80 0.4296 stock 7.70 1.47 0.0131 content 6.60 1.98 0.0673style 7.70 1.34 0.3021 economy 7.53 1.57 0.0409 taxonomy 3.57 2.66 0.0213shopping 3.43 2.39 0.1548 investment 6.93 1.62 0.1852 airline 1.83 1.97 0.0008design 7.10 1.65 0.0890 money 6.90 1.12 0.0564 mod 3.13 2.43 0.0089accessory 4.07 1.80 0.0225 resource 5.03 1.56 0.0048 showcase 6.53 2.98 0.0832store 2.97 2.33 0.1140 cinema 1.77 1.76 0.0000 portfolio 7.93 1.23 0.0219tshirt 2.17 2.07 0.2351 TV 2.00 1.34 0.0002 vim 1.93 2.02 0.0051sewing 2.13 2.62 0.0454 documentary 2.40 1.25 0.0001 process 5.47 1.80 0.0059trend 6.90 1.65 0.1033 music 1.47 1.87 0.0078 top 3.83 1.97 0.1262jewelry 3.07 2.27 0.0770 review 3.23 1.50 0.0008 alternative 4.23 1.77 0.0156Topic word: school
mean stdTopic word: health(sound)
mean stdTopic word: security
mean std
search 0.90 1.32 0.0399 fitness 7.70 1.29 0.5418 name 3.53 2.76 0.0275writing 3.10 1.42 0.1168 healthcare 7.63 1.35 0.1920 trust 8.17 1.86 0.0221math 2.90 1.88 0.0861 diet 6.63 1.16 0.5353 net 3.37 2.91 0.2081learning 7.43 1.48 0.3982 medicine 7.03 1.52 0.3278 machine 3.60 1.98 0.0048university 5.30 2.04 0.2772 training 5.70 1.39 0.1344 company 5.97 1.81 0.0063reference 1.43 1.33 0.1072 sample 2.67 1.47 0.0031 vendor 3.13 2.29 0.0278academic 6.70 1.60 0.2118 instrument 1.73 1.41 0.0002 group 3.77 2.30 0.0052research 2.73 1.51 0.1893 music 1.80 1.37 0.0015 innovation 3.00 2.48 0.0017education 8.40 0.93 0.5338 audio 1.63 1.30 0.0045 service 6.30 2.35 0.0392teaching 5.90 1.16 0.2445 production 2.47 1.80 0.0009 travel 4.03 2.81 0.0018
Topic word: votemean std
Topic word: environment (illustration)
mean stdTopic word: culture
mean std
politic 6.30 1.44 0.0640 sustainability 6.90 2.01 0.7879 market 2.97 1.96 0.0248election 8.30 1.09 0.4641 climate 7.70 1.37 0.3354 migration 5.40 2.28 0.0009map 0.77 1.04 0.0043 green 7.53 1.53 0.8397 character 6.50 2.03 0.0029news 3.37 1.33 0.0895 energy 6.17 1.09 0.3629 furl 1.50 1.68 0.0088war 1.63 1.19 0.0089 future 5.50 1.68 0.1340 evolution 5.00 2.13 0.0394president 5.27 1.62 0.0117 graphic 2.70 1.88 0.0046 pattern 4.23 1.74 0.0041government 6.67 1.27 0.1206 design 2.57 1.63 0.0295 home 6.30 2.71 0.0363democracy 7.13 1.94 0.0595 art 1.67 1.06 0.0164 fantasy 1.83 1.90 0.0213youth 1.80 1.27 0.0001 typography 2.37 2.53 0.0004 history 8.33 1.21 0.1721party 3.83 2.17 0.0021 icon 1.97 1.59 0.0000 security 2.93 1.98 0.0070
Reverse ranks by survey participants
Reverse ranks by survey participants
Reverse ranks by survey participants
survey
three
Figure 20 Algorithm and reverse-scored survey results (survey three)
47
References
Al-Khalifa, H.S. (2007). Exploring the Value of Folksonomies for Creating Semantic Metadata. International Journal on Semantic Web and Information Systems , 3, 13-39.
ASCII. (n.d.). Retrieved June 2009, from wikipedia: http://en.wikipedia.org/wiki/ASCII
Deese, J.: The Structure of Associations in Language and Thought. Baltimore (1965). Folksonomy. (n.d.). Retrieved Janauary 2009 , from Wikipedia: http://en.wikipedia.org/w/index.php?title=Folksonomy&oldid=201598719
George, A.M., Richard B., Christiane, F., Derek, G., & Katherine, J.M. (1990). Introduction to WordNet: An On-line Lexical Database. International Journal of Lexicography , 3 (4), 235-244.
Golder, S., & Huberman, B. A. (2005). The Structure of Collaborative Tagging Systems. HP Labs technical report.
Grigory, B., Philipp, K., & Frank, S. (2006). Automated tag clustering:Improving search and exploration in the tag space. In Proceedings of the WWW 2006 Collaborative Web Tagging Workshop.
Halpin, H., Robu, V., & Shepherd, H. (2007). The Complex Dynamics of Collaborative Tagging. Proceedings of the 16th international conference on World Wide Web, (pp. 211-220). Banff, Alberta, Canada.
Hassan-Montero,Y., & Herrero-Solana,V. (2006). Improving Tag-clouds as Visual Information Retrieval Interfaces. Proc. InfoSciT.
Hirst, G., & St-Onge, D. (1998). Lexical Chains as Representations of Context for the Detection and Correction of Malapropisms. In C. Fellbaum, WordNet: An Electronic Lexical Database (pp. 305-332). Cambridge, Massachusetts: The MIT Press.
Hotho, A., J¨aschke, R., Schmitz, C., & Stumme, G. (2006). Information retrieval in folksonomies: Search and ranking. Proc. of ESWC 2006 , 411--426.
HubLog: Graph del.icio.us related tags. (n.d.). Retrieved January 2009, from http://hublog.hubmed.org/archives/001049.html
Jackendoff, R. (1983). Semantics and Cognition. Cambridge, MA: MIT Press.
Jacob, E. K. (2004, Winter). Classification and categorization: A difference that makes a difference. Library Trends,515-540 .
Jiang, J.J., & Conrath, D.W. (1997). Semantic Similarity based on Corpus Statistics and Lexical Taxonomy. Proceedings of the International Conference on Research in Computational Linguistics, (pp. 19-33). Taiwan.
48
Kenvin, L. & Curt, B. (1996). Producing High-dimensional Semantic Spaces from Lexial Co-occurrence. Behavour Research Methods, Instruments, & Computers, 28(2), 203-208
Krause,B., Hotho, A., & Stumme,G. (2008). A Comparison of Social Bookmarking with Traditional Search. Advances in Information Retrieval , 4956, 101-113.
Leacock, C., & Chodorow, M. (1998). Combining Local Context and WordNet Similarity for Word Sense Identification. In C. Fellbaum, WordNet: An Electronic Lexical Database (pp. 265-283). Cambridge, Massachusetts: The MIT Press.
Li, R., Bao,S.,Yu,Y., Fei,B., & Su,Z. (2007). Towards Effective Browsing of Large Scale Social Annotations. Proceedings of the 16th International Conference on World Wide Web, (pp. 943-952). Banff, Alberta, Canada.
Lin, D. (1998). An Iinformation-theoretic Definition of Similarity. Proceedings of the International Conference on Machine Learning, (pp. 296–304). Madison, Wisconsin.
Lin, D. (2004). Word Sense Disambiguation with a Similarity-Smoothed Case Library. Computers and the Humanities , 34, 147-152.
Lin,X., Beaudoin, J.E., Bui, Y., & Desai, K. (2006). Exploring Characteristics of Social Classification. 17th SIG Classification Research Workshop.
Liwen, V. (2001). In Statistical Methods for the Information Professional: A Practical, Painless Approach to Understanding, Using, and Interpreting Statistics (pp. 140-143). Information Today, Inc.
Loia,V., Pedrycz, W., & Senatore,S. (2007). Semantic Web Content Analysis: A Study in Proximity-based Collaborative Clustering. Fuzzy Systems , 15, 1294-1312.
Lonneke, P., Vincenzo, P., Martin, R., & Hatem, G. (2004). Automatic Keyword Extration from Spoken Text. A Comparison of Two Lexical Resources: the EDR and WordNet. Procedings of the LREC 2004 International Conference, (pp. 2205-2208). Lisbon, Portugal.
Louis M.G., Carol C.L., & Thomas K.L. (1990). All the Right Words: Finding What You Want as a Function of Richness of Indexing Vocabulary. Journal of the American Society for Information Science , 41 (8), 547-559.
MacGregor, G., & McCulloch, E. (2006). Collaborative tagging as a knowledge. Library Review , 55 (5), 291-300.
MacGregor, G., & McCulloch, E. (2006). Collaborative Tagging as a Knowledge Organisation and Resource Discovery Tool. Library View , 55.
Marjorie, A.P., & Kate, P. (1997). In Nonparametric Statistics in Health Care Research: Statistics for Small Samples and Unusual Distributions (pp. 265-274). SAGE.
Markus, H., Susanne, M., & Christian, W. (2008). Tagging Tagging. Analysing user keywords in scientific bibliography management systems. Journal of Digital Information , 9 (27).
49
Marlow,C., Naaman, M., Boyd, D., & Davis, M. (2006). HT06, Tagging Paper, Taxonomy, Flickr, academic article, to read. 17th Conf. Hypertext and hypermedia. Odense, Denmark.
Mika, P. (2007). Ontologies are us: A unified model of social networks and semantics. Journal of Web Semantics , 5-15.
Patwardhan S, & Pedersen T. (2006). Using WordNet-based Context Vectors to Estimate the Semantic Relatedness of Concepts. Proceedings of the EACL 2006 workshop, (pp. 1-8). Trento, Italy.
Paul, H., & Hector, G.M. (2006). Collaborative creation of communal hierarchical taxonomies in social tagging systems. InfoLab.
Pind, L. (2005, January 23). Folksonomies: How we can improve the tags. Retrieved from http://pinds.com/2005/01/23/folksonomies-how-we-can-improve-the-tags/
PINTS - Experimental datasets . (n.d.). Retrieved May 2008, from Universität Koblenz-Landau: http://www.uni-koblenz.de/FB4/Institutes/IFI/AGStaab/Research/DataSets/PINTSExperimentsDataSets
Ramon, F.C., & Ricard, V.S. (2001). The Small World of Human Language. The Royal Society , 2261-2265.
Rashmi. (2005, September 27). A Cognitive Analysis of Tagging. Retrieved from http://rashmisinha.com/2005/09/27/a-cognitive-analysis-of-tagging/
Resnik, P. (1995). Using Information Content to Evaluate Semantic Similarity. Proceedings of the 14th International Joint Conference on Artificial Intelligence, (pp. 448-453). Montreal.
Richardson, R., Smeaton A.F., & Murphy,J. (1994). Using WordNet as a Knowledge Based for Measuring Semantic Similarity between Words. Proceeding of AICS Conference.
Rosch, E. (1973). On the internal structure of perceptual and semantic categories. In T. Moore, Cognitive development and the acquisition of language (p. 308). Oxford, England: Academic Press.
Rosch, E. (1978). Principles of Categorization. In M. S. Eric, Concepts: core readings (pp. 189-206).
Sinopalnikova, A.: 2004, ‘Word Association Thesaurus as a Resource for Building WordNet’. In: Proceedings of the 2nd International WordNet Conference. Brno, Czech Republic, pp. 199–205.
Shilad, S., et al. (2006). Tagging, Communities, Vocabulary, Evolution. Proceedings of the 2006 20th anniversary conference on Computer supported cooperative work, (pp. 181 - 190). Banff, Alberta, Canada.
Shirky, C. (2005, Spring). Ontology is overrated: categories, links, and tags. Retrieved from Economics & Culture, Media & Community: http://www.shirky.com/writings/ontology_overrated.html
50
51
Shirky, C. (2005, August 27). Semi-structured meta-data has a poss: A response to Gene Smith. Retrieved from http://tagsonomy.com/index.php/semi-structured-meta-data-has-a-posse-a-response-to-gene-smith
SurveyMonkey. (n.d.). Retrieved March 2009, from http://www.surveymonkey.com/
Tag (metadata). (n.d.). Retrieved March 2009, from Wikipedia: http://en.wikipedia.org/wiki/Tag_(metadata)
Takaaki, H., Satoshi, S., & Ralph, G. (2004). Discovering Relations among Named Entities from Large Corpora. Proceedings of the 42nd Annual Meeting on Association for Computational Linguistics. Barcelona, Spain.
Tsoukas, H., & Vladimirou, E. (2001). What is organizational knowledge? Journal of Management Studies , 38 (7), 973-993.
Ying-Hsang, L., & Nina, W. (2008). Do Human-Developed Index Terms Help Users? An Experimental Study of MeSH Terms in Biomedical Searching. ASIS&T 2008 Annual Meeting. Columbus, Ohio.
Yusef, H.M., & Victor, H.S. (n.d.). Visualizious. Retrieved 08 22, 2009, from http://www.nosolousabilidad.com/hassan/visualizious/


![arXiv:0812.0698v1 [cs.IR] 3 Dec 2008semantics in social tagging systems. Key words: folksonomy, collaborative tagging, emergent semantics, online communities, web 2.0 1 Introduction](https://img.pdfslide.us/doc/110x75/5fab3f7b4ce4fe0f3c21139c/arxiv08120698v1-csir-3-dec-2008-semantics-in-social-tagging-systems-key-words.jpg)


![Collaborative and Collective [Artistic] Research](https://img.pdfslide.us/doc/110x75/55a83a7a1a28ab09778b4786/collaborative-and-collective-artistic-research.jpg)