Embed Size (px)
Citation preview
Collective Bargaining Process and Its
Outcome
College of Business & Economics CHED Center of Development in Business & Management Education
Collective Bargaining Process and Its Outcome
SERIES 1999-03
Divina M. Edralin, Ph.D. De La Salle University, Philippines
The CBERD Working Paper Series constitutes studies that are preliminary and subject to further revisions. They are being circulated in a limited number of copies only for purposes of soliciting comments and suggestions for further refinements. The studies under the Series are unedited and unreviewed. The views and opinions expressed are those of the author(s) and do not necessarily reflect those of the Center. Not for quotation without permission from the author(s) and the Center. For comments, suggestions or further inquiries please contact: Center for Business and Economics Research and Development (CBERD) 2nd Floor, Medrano Hall, La Salle Bldg., 2401 Taft Avenue, Manila, Philippines Tel Nos: (632) 3030869 and (632) 5244611 loc. 149; Fax No: (632) 3030869; Email: [email protected] or [email protected] Or visit our website at http://www.dlsu.edu.ph
About the Author
Dr. Divina M. Edralin is a Full Professor at the Business Management Department of the College of Business and Economics (CBE) of De La Salle University-Manila. She is also the Director of the Center for Business and Economics Research and Development (CBERD). She also holds the Don Antonio L. Tambunting Sr., Professorial Chair in Business Administration. She earned her Doctor in Management from De La Salle University-Manila, and her MA Industrial Relations from the Institute of Industrial Relations of the University of the Philippines. Her areas of expertise and research interest include human resource management, entrepreneurship, collective bargaining, and labor issues.
Abstract
Dr. Divina Edralin
This research on the collective bargaining process as initiated by trade unions and the results of such efforts had been undertaken on the premise that trade unions are founded on the principle of strength in numbers, and organized to fight for the worker’s rights, get better terms and conditions of work, and improve the overall quality of life and political power of its members, primarily through collective bargaining with employers. A survey was conducted among 90 unionized firms in Metro Manila, with both union and management representatives taken as respondents. Content analysis of the existing CBA in the unionized firms was done to determine the common economic and political issues negotiated by collective bargaining. Results indicate that the collective bargaining process is time-consuming because of the length of time involved in preparing the proposals and counter proposals, the long hours spent during negotiations which is stretched over an average of nine (9) months, and the monitoring of the implementation of the CBA which is for a period of three to five years. The collective bargaining process is also a complicated encounter because of the varying strategies and tactics used by both parties in the pre-negotiation and actual negotiation stages. Other factors that add to the complexity of the process include the composition of the respective panels of negotiators (particularly the presence of a lawyer), and the differing attitudes and goals of the panel members. The study also reveals that the type of industry to which the company belongs, and the union’s membership in a federation have no correlation with the number of strategies and success factors identified by both union and management. The number of economic issues negotiated are significantly different according to the type of industry, with unions in the non-manufacturing sector getting more than those in the manufacturing sector. On the other hand, the number of political issues bargained by the federated unions are significantly different from the number bargained by the independent unions, with the federated unions getting more, particularly provisions related to union assistance. Lastly, both management and union have the same perception on the factors that will contribute to the success of the collective bargaining process foremost of which is trust between parties.
Collective Bargaining Process and Its Outcome
Dr. Divina Edralin*
“Good labor relations…. Cannot be brought about by legislation…. I believe that enlightened labor and enlightened management working together, can accomplish far more by peaceful bargaining than is possible though legislation.” (Harry Truman)
1. Introduction
The trade union, as a form of organization among workers, evolved in different parts of the world, in widely differing conditions and for varying reasons. Its historical formation from the early 1800s can be traced to economic, political, and social theories. As cited by Flippo (1984), trade unions are formed by the workers “to promote, protect, and improve, through collective action, the social, economic, and political interests of its members.” Corrollarily, Hoxie (1986) argued that labor unions’ primary aim is to protect and pursue the economic interests (such as raise wages, shorten hours of work, and increase the security of employment) of its own members. The Constitution and By-laws of one of the most active national trade unions in the Philippines, which is called the National Union of Workers in the Hotel, Restaurant and Allied Industries, stipulates that its four main objectives are to: (1) unite and organize all workers into one union; (2) promote job security and defend workers’ rights to self- organization, collective bargaining, and concerted action; (3) secure better terms and conditions of work; and (4) promote and advance the interests and general welfare of workers. These objectives are very similar to those cited in the economic, political and social theories on the formation of unions. Even the Philippine Labor Code (1998) defines a labor organization as “any union or association of employees which exists in whole or in part for the purpose of collective bargaining or of dealing with employers concerning terms and conditions of employment.”
The available literature also show that the development of trade unions over the years had been very complicated, and like a pendulum, swings as much between experiences of failures as well as of successes. Today’s labor unions, however, have reached a critical point in their history, and their role in society is hotly disputed (McConville, 1986). This situation may be attributed to the fact that trade unions, as observed by Dijillas (1994), have considerable varying impact on the economic growth and political stability of the country.
On the premise that trade unions are founded on the principle of strength in numbers, and organized to fight for workers’ rights, get better terms and conditions of work, and improve the overall quality of life and political power of its members, primarily through collective bargaining with employers, this research on the collective
* I wish to acknowledge Ms. Ma. Theresa Mosquito for her assistance in the tabulation and statistical analysis of the sample data. Thanks are accorded to Mr. Eleazar Tolledo for facilitating the collection of the data through his Industrial Relations students under the Applied Corporate Management Program of the Business Management Department. I also thank Mr. Raymund Habaradas for editing the paper.
bargaining process as initiated by trade unions, and the results of such efforts, had been undertaken. Specifically, this paper aimed to: 1. identify the dynamics of the collective bargaining process in terms of its:
1.1 principles 1.2 stages 1.3 composition of the panel of negotiators 1.4 strategies used in the negotiation
2. determine the outcome of the collective bargaining process in terms of the common political and economic issues covered in the collective bargaining agreement (CBA);
3. identify significant differences in the number of strategies used by the parties, number of political and economic issues negotiated, and number of success factors experienced in the collective bargaining process based on the type of industry of the firms and union affiliation with a federation.
4. correlate the number of strategies used by the parties, number of political and economic issues negotiated, and number of success factors experienced based on the type of industry of the firms and union affiliation with a federation.
5. analyze the difficulties/problems encountered by the union and management during the collective bargaining negotiations; and
6. determine the factors that contribute to the success of collective bargaining negotiations.
2. Theoretical Framework
Collective bargaining is a long, complex, and emotional-rational process, the outcome of which depends on the balance of power between the union and management and their bargaining stances (Ballot, 1992).
It is defined by Byars and Rue (1991) as a process that involves the negotiation, drafting, administration, and interpretation of a written agreement between an employer and a union for a specific period of time . This process therefore involves proposals and counter-proposals, demands and counter-demands wherein each party tries to obtain for itself the best or most favorable terms and conditions. It also involves constant communication between the union and the management during the effectivity of the written contract in order to avoid disputes in the interpretation and implementation of its provisions. By the same token, Baldoz (1995) explained that collective bargaining, which is basically a wage-setting and dispute settlement system, is the centerpiece of the industrial relations in the Philippines. It is a procedure whose end result is the making of collective agreements between employer and accredited representatives of employees concerning political and economic issues of employment. It requires both parties to deal with each other with open and fair minds, and to sincerely endeavor to overcome obstacles existing between them to the end that industrial relations may be successful, peaceful, and beneficial to both parties. However, collective bargaining does not end with the execution of an agreement. It is a continuous process and involves a continuing legal duty.
As indicated, the end result of the collective bargaining process is a contract which is called the Collective Bargaining Agreement or simply CBA. The CBA
stipulates the joint understanding of the union and management concerning wages, hours of work, and all other terms and conditions of employment within the bargaining unit, including mandatory provisions for grievance and arbitration machinery (BLES, 1998). In the USA, about 2.4 million workers are under major collective bargaining agreements (those covering 1,000 workers or more) which are scheduled to expire or be reopened in 1996. These workers constitute about 30 percent of the 8.2 million employees under such agreements in private industry and State and local governments (Monthly Labor Review, 1996). In the Philippines, 683,000 workers or 23.8% of the total 2.865 million workforce of 6,540 establishments were reported to be covered by collective bargaining agreements (CBAs) in 1997. The said companies with CBAs represented 15.1% of the total number of 43,358 firms in the country in 1997. Per type of industry, the manufacturing sector, which constituted the bulk of establishments, only had 18.3% of such firms with CBAs; while the financing, insurance real estate and business services had 33.1% of such firms covered by CBAs making it the industry with the biggest slice of companies with CBAs (BLES, 1998). Refer to Appendix 1 for details.
It can also be noted that the collective bargaining process seems to differ more in style than in substance. Scarth (1994) in his study identified two styles, namely: (1) the adversarial and (2) the cooperative. The adversarial style involves a high degree of animosity and antagonism between the union and management during the negotiation, while the cooperative style is more of a collaborative effort between the union and management to arrive at an agreement. Power (1996) added a new contract negotiation style called target-specific bargaining. This model is a team-based, interactive process which helps one organization and its bargaining unit/s bury old tensions and sign long-term agreements.
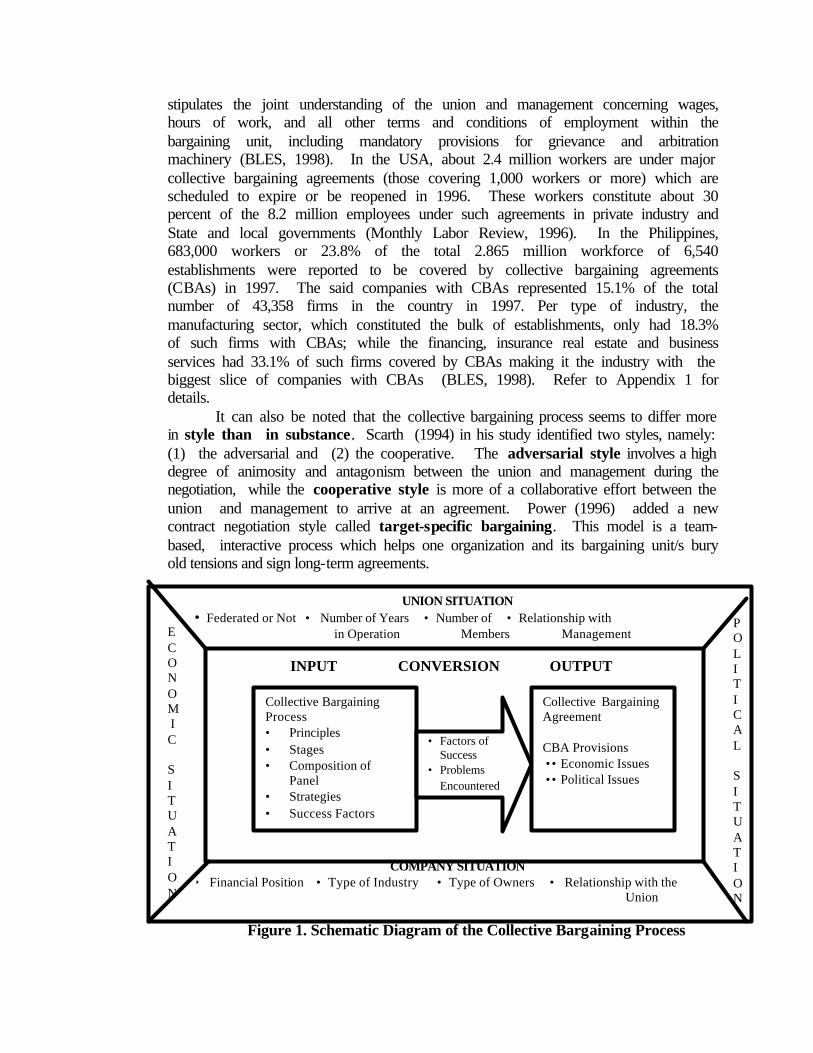
Figure 1. Schematic Diagram of the Collective Bargaining Process
UNION SITUATION • Federated or Not • Number of Years • Number of • Relationship with in Operation Members Management INPUT CONVERSION OUTPUT
COMPANY SITUATION • Financial Position • Type of Industry • Type of Owners • Relationship with the
Union
E C ONOM I C S I T U A T I ON
Collective Bargaining Process • Principles • Stages • Composition of
Panel • Strategies • Success Factors
• Factors of Success
• Problems Encountered
Collective Bargaining Agreement CBA Provisions •• Economic Issues •• Political Issues
P O L I T I C A L S I T U A T I ON
Viewing collective bargaining as a dynamic and complex process of encounter between the management and the union, whose respective goals differ from one another, the above diagram summarizes the collective bargaining framework of the study. Using the input-output model of Kast and Rosenweig (1974), the collective bargaining process is considered as the input, while the collective bargaining agreement which stipulates the economic and political issues negotiated is the output. The factors of success and the problems encountered are then considered to be the conversion variables. The input-output process is then assumed to be affected by both the internal environment represented by the union and company situations and the external environment the most important factors of which are the economic and political scenarios.
3. Methodology Descriptive and comparative research designs were employed to realize the
objectives of the study. A survey among 90 unionized firms in Metro Manila was conducted with both
the union and management representatives taken as respondents for the survey. Table 1 presents the distribution of the actual samples.
The three page survey questionnaire, which had been pre-tested, focused on gathering data related to company profile, union profile, strategies used by the union and the management in the CBA negotiation, problems the parties encountered during negotiation, and the factors of success experienced in CBA negotiations.
Content analysis of the existing CBA in each unionized firm was done to determine the common economic and political issues negotiated by collective bargaining.
The collected data were analyzed with the use of the SPSS (Statistical Package for Social Sciences) program. The percentage, mean, and simple ranking were utilized for the descriptive part. To test the null hypothesis for equality of means for the groups, a non-parametric approach was used. Significance tests for differences between the groups (by type of industry: manufacturing vs. non-manufacturing; by type of union affiliation: independent vs. federated, by respondent: union vs. management) was done. The independent samples t- test and Mann-Whitney or U test were used to test for the equality of means. The Mann-Whitney test is an alternative test which made use of the ranks to test the equality of means. Kolmogorov-Smirnov was also used to test if the two groups compared come from the same distribution. Furthermore, Spearman’s rank correlation coefficients were obtained and significance tests of these coefficients were made to test the null hypothesis on whether there is a correlation between the different variables under study.
4. Findings 4.1 Profile of the Firms and their Unions
Ninety (90) unionized firms, composed of 42 manufacturing (47%) and 48 non-manufacturing (53%) establishments, participated in the survey. Classified by size of employment, 6.67% are small, 10% are medium and 83.33% are large companies with an average of 1,613 employees. By ownership, 34% are multinationals, 29% are Filipino-Chinese, 22% are Filipino, 7% are Chinese, and 7% are owned by other nationalities. Moreover, these companies, which are predominantly corporations (98%), had been in existence for an average of 37 years, with some of the firms operating for at least five years, and for as long as more than 80 years. (Refer to Table 2)
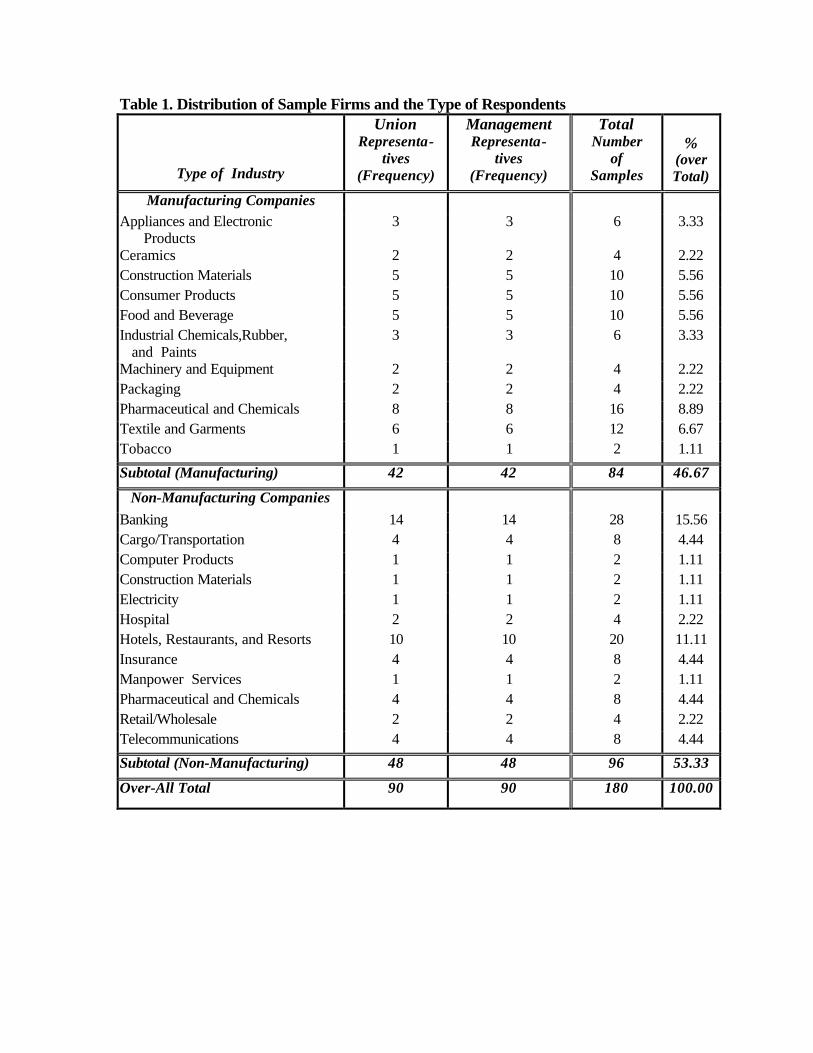
Table 1. Distribution of Sample Firms and the Type of Respondents
Type of Industry
Union Representa-
tives (Frequency)
Management Representa-
tives (Frequency)
Total Number
of Samples
%
(over Total)
Manufacturing Companies Appliances and Electronic Products
3 3 6 3.33
Ceramics 2 2 4 2.22 Construction Materials 5 5 10 5.56 Consumer Products 5 5 10 5.56 Food and Beverage 5 5 10 5.56 Industrial Chemicals,Rubber, and Paints
3 3 6 3.33
Machinery and Equipment 2 2 4 2.22 Packaging 2 2 4 2.22 Pharmaceutical and Chemicals 8 8 16 8.89 Textile and Garments 6 6 12 6.67 Tobacco 1 1 2 1.11
Subtotal (Manufacturing) 42 42 84 46.67
Non-Manufacturing Companies Banking 14 14 28 15.56 Cargo/Transportation 4 4 8 4.44 Computer Products 1 1 2 1.11 Construction Materials 1 1 2 1.11 Electricity 1 1 2 1.11 Hospital 2 2 4 2.22 Hotels, Restaurants, and Resorts 10 10 20 11.11 Insurance 4 4 8 4.44 Manpower Services 1 1 2 1.11 Pharmaceutical and Chemicals 4 4 8 4.44 Retail/Wholesale 2 2 4 2.22 Telecommunications 4 4 8 4.44
Subtotal (Non-Manufacturing) 48 48 96 53.33
Over-All Total 90 90 180 100.00
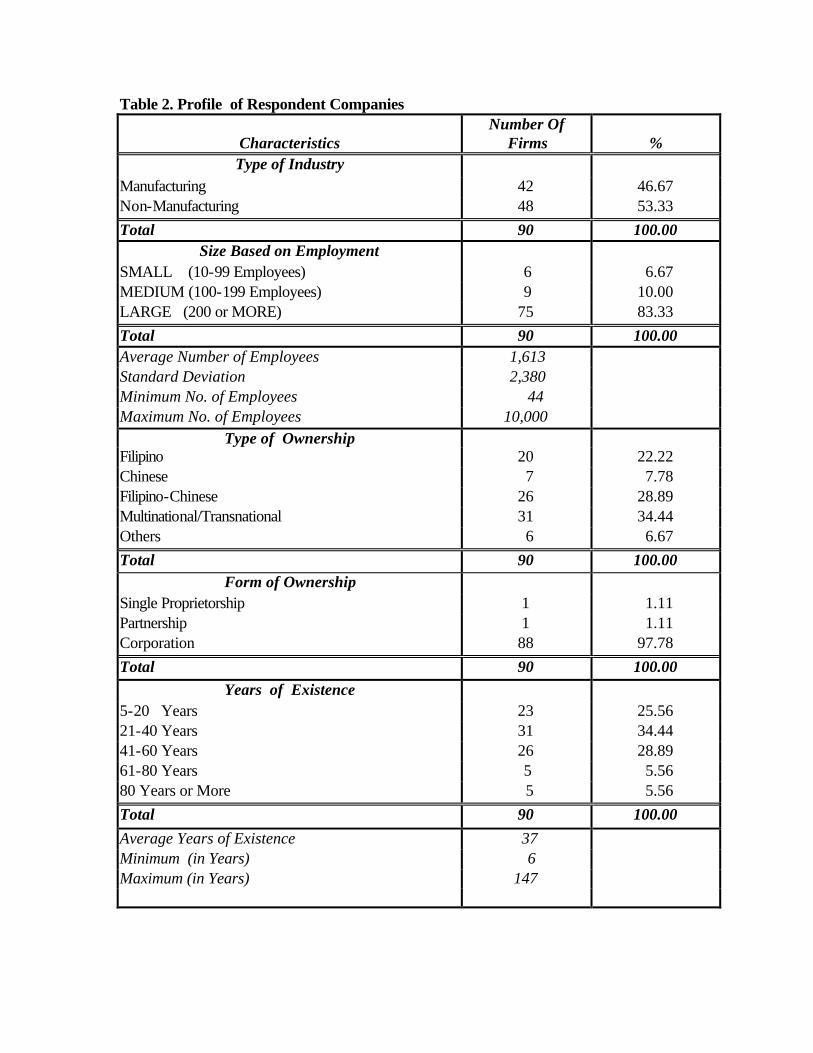
Table 2. Profile of Respondent Companies
Characteristics Number Of
Firms
% Type of Industry
Manufacturing 42 46.67 Non-Manufacturing 48 53.33 Total 90 100.00
Size Based on Employment SMALL (10-99 Employees) 6 6.67 MEDIUM (100-199 Employees) 9 10.00 LARGE (200 or MORE) 75 83.33 Total 90 100.00 Average Number of Employees 1,613 Standard Deviation 2,380 Minimum No. of Employees 44 Maximum No. of Employees 10,000
Type of Ownership Filipino 20 22.22 Chinese 7 7.78 Filipino-Chinese 26 28.89 Multinational/Transnational 31 34.44 Others 6 6.67 Total 90 100.00
Form of Ownership Single Proprietorship 1 1.11 Partnership 1 1.11 Corporation 88 97.78 Total 90 100.00
Years of Existence 5-20 Years 23 25.56 21-40 Years 31 34.44 41-60 Years 26 28.89 61-80 Years 5 5.56 80 Years or More 5 5.56 Total 90 100.00 Average Years of Existence 37 Minimum (in Years) 6 Maximum (in Years) 147
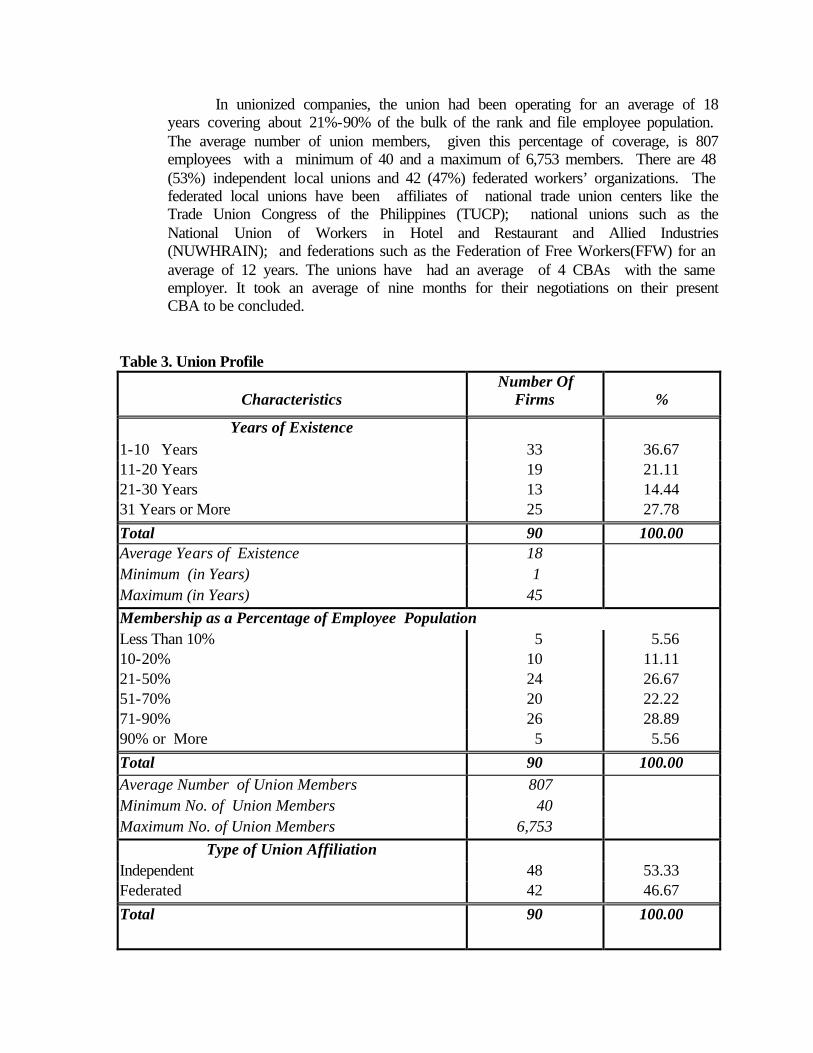
In unionized companies, the union had been operating for an average of 18 years covering about 21%-90% of the bulk of the rank and file employee population. The average number of union members, given this percentage of coverage, is 807 employees with a minimum of 40 and a maximum of 6,753 members. There are 48 (53%) independent local unions and 42 (47%) federated workers’ organizations. The federated local unions have been affiliates of national trade union centers like the Trade Union Congress of the Philippines (TUCP); national unions such as the National Union of Workers in Hotel and Restaurant and Allied Industries (NUWHRAIN); and federations such as the Federation of Free Workers(FFW) for an average of 12 years. The unions have had an average of 4 CBAs with the same employer. It took an average of nine months for their negotiations on their present CBA to be concluded.
Table 3. Union Profile
Characteristics
Number Of Firms
%
Years of Existence 1-10 Years 33 36.67 11-20 Years 19 21.11 21-30 Years 13 14.44 31 Years or More 25 27.78 Total 90 100.00 Average Years of Existence 18 Minimum (in Years) 1 Maximum (in Years) 45 Membership as a Percentage of Employee Population Less Than 10% 5 5.56 10-20% 10 11.11 21-50% 24 26.67 51-70% 20 22.22 71-90% 26 28.89 90% or More 5 5.56 Total 90 100.00 Average Number of Union Members 807 Minimum No. of Union Members 40 Maximum No. of Union Members 6,753
Type of Union Affiliation Independent 48 53.33 Federated 42 46.67 Total 90 100.00
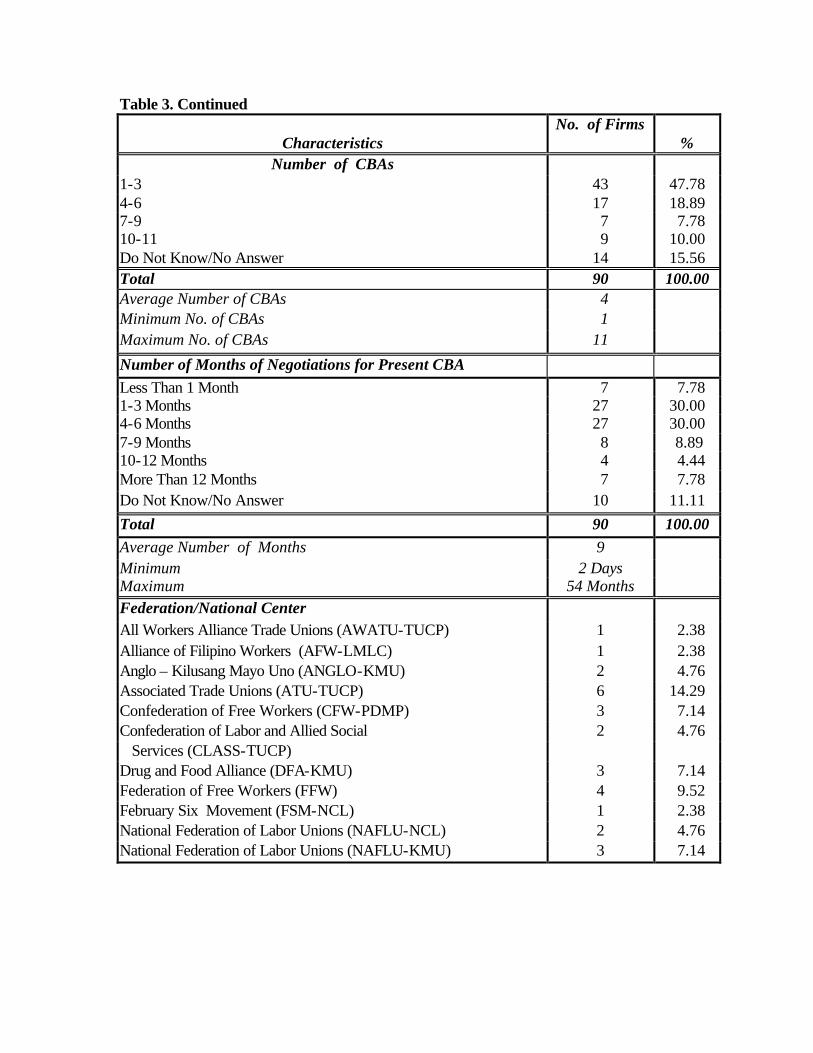
Table 3. Continued
Characteristics No. of Firms
% Number of CBAs
1-3 43 47.78 4-6 17 18.89 7-9 7 7.78 10-11 9 10.00 Do Not Know/No Answer 14 15.56 Total 90 100.00 Average Number of CBAs 4 Minimum No. of CBAs 1 Maximum No. of CBAs 11
Number of Months of Negotiations for Present CBA Less Than 1 Month 7 7.78 1-3 Months 27 30.00 4-6 Months 27 30.00 7-9 Months 8 8.89 10-12 Months 4 4.44 More Than 12 Months 7 7.78 Do Not Know/No Answer 10 11.11 Total 90 100.00 Average Number of Months 9 Minimum 2 Days Maximum 54 Months Federation/National Center All Workers Alliance Trade Unions (AWATU-TUCP) 1 2.38 Alliance of Filipino Workers (AFW-LMLC) 1 2.38 Anglo – Kilusang Mayo Uno (ANGLO-KMU) 2 4.76 Associated Trade Unions (ATU-TUCP) 6 14.29 Confederation of Free Workers (CFW-PDMP) 3 7.14 Confederation of Labor and Allied Social 2 4.76 Services (CLASS-TUCP) Drug and Food Alliance (DFA-KMU) 3 7.14 Federation of Free Workers (FFW) 4 9.52 February Six Movement (FSM-NCL) 1 2.38 National Federation of Labor Unions (NAFLU-NCL) 2 4.76 National Federation of Labor Unions (NAFLU-KMU) 3 7.14
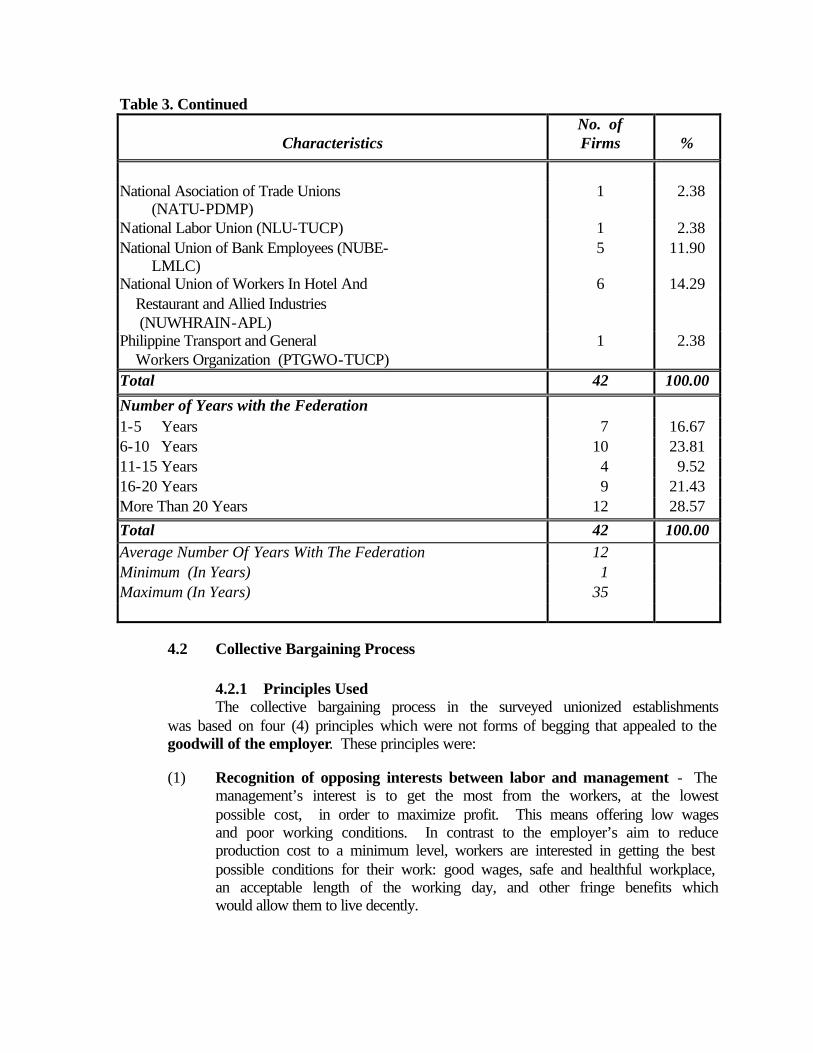
Table 3. Continued
Characteristics No. of Firms
%
National Asociation of Trade Unions (NATU-PDMP)
1 2.38
National Labor Union (NLU-TUCP) 1 2.38 National Union of Bank Employees (NUBE- LMLC)
5 11.90
National Union of Workers In Hotel And 6 14.29 Restaurant and Allied Industries (NUWHRAIN-APL)
Philippine Transport and General Workers Organization (PTGWO-TUCP)
1 2.38
Total 42 100.00
Number of Years with the Federation 1-5 Years 7 16.67 6-10 Years 10 23.81 11-15 Years 4 9.52 16-20 Years 9 21.43 More Than 20 Years 12 28.57 Total 42 100.00 Average Number Of Years With The Federation 12 Minimum (In Years) 1 Maximum (In Years) 35
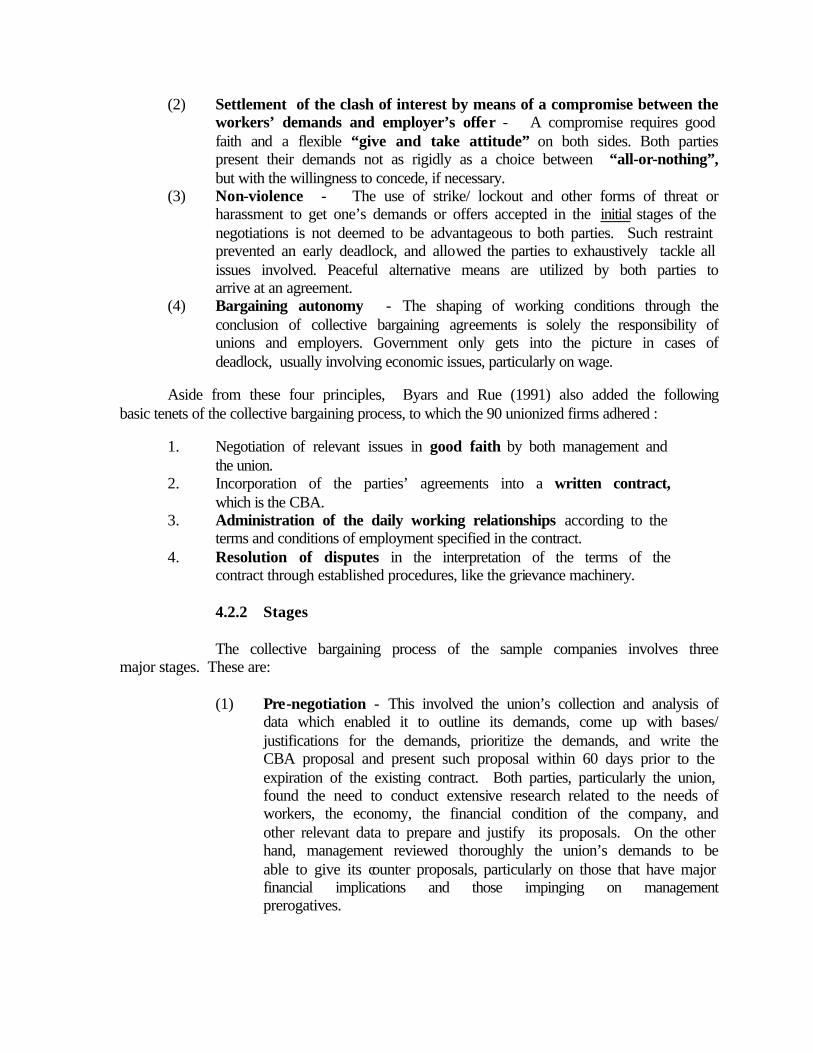
4.2 Collective Bargaining Process
4.2.1 Principles Used The collective bargaining process in the surveyed unionized establishments
was based on four (4) principles which were not forms of begging that appealed to the goodwill of the employer. These principles were:
(1) Recognition of opposing interests between labor and management - The
management’s interest is to get the most from the workers, at the lowest possible cost, in order to maximize profit. This means offering low wages and poor working conditions. In contrast to the employer’s aim to reduce production cost to a minimum level, workers are interested in getting the best possible conditions for their work: good wages, safe and healthful workplace, an acceptable length of the working day, and other fringe benefits which would allow them to live decently.
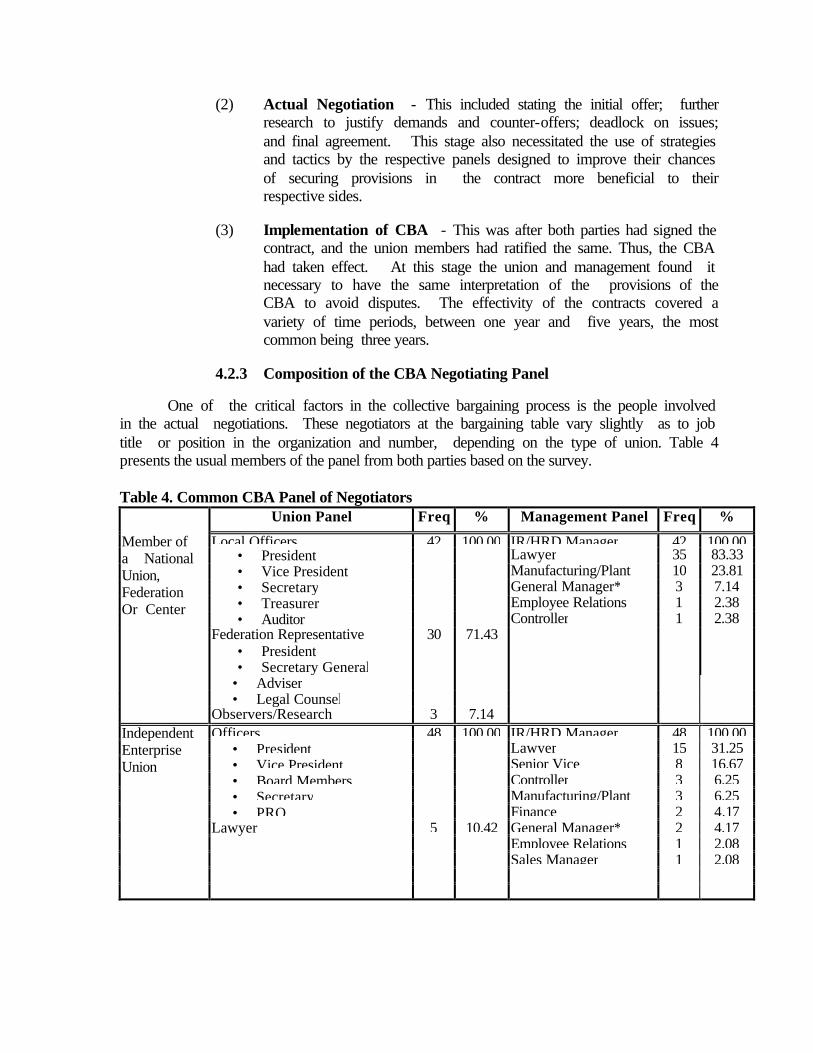
(2) Settlement of the clash of interest by means of a compromise between the workers’ demands and employer’s offer - A compromise requires good faith and a flexible “give and take attitude” on both sides. Both parties present their demands not as rigidly as a choice between “all-or-nothing”, but with the willingness to concede, if necessary.
(3) Non-violence - The use of strike/ lockout and other forms of threat or harassment to get one’s demands or offers accepted in the initial stages of the negotiations is not deemed to be advantageous to both parties. Such restraint prevented an early deadlock, and allowed the parties to exhaustively tackle all issues involved. Peaceful alternative means are utilized by both parties to arrive at an agreement.
(4) Bargaining autonomy - The shaping of working conditions through the conclusion of collective bargaining agreements is solely the responsibility of unions and employers. Government only gets into the picture in cases of deadlock, usually involving economic issues, particularly on wage.
Aside from these four principles, Byars and Rue (1991) also added the following basic tenets of the collective bargaining process, to which the 90 unionized firms adhered :
1. Negotiation of relevant issues in good faith by both management and the union.
2. Incorporation of the parties’ agreements into a written contract, which is the CBA.
3. Administration of the daily working relationships according to the terms and conditions of employment specified in the contract.
4. Resolution of disputes in the interpretation of the terms of the contract through established procedures, like the grievance machinery.
4.2.2 Stages
The collective bargaining process of the sample companies involves three major stages. These are:
(1) Pre-negotiation - This involved the union’s collection and analysis of data which enabled it to outline its demands, come up with bases/ justifications for the demands, prioritize the demands, and write the CBA proposal and present such proposal within 60 days prior to the expiration of the existing contract. Both parties, particularly the union, found the need to conduct extensive research related to the needs of workers, the economy, the financial condition of the company, and other relevant data to prepare and justify its proposals. On the other hand, management reviewed thoroughly the union’s demands to be able to give its counter proposals, particularly on those that have major financial implications and those impinging on management prerogatives.
(2) Actual Negotiation - This included stating the initial offer; further research to justify demands and counter-offers; deadlock on issues; and final agreement. This stage also necessitated the use of strategies and tactics by the respective panels designed to improve their chances of securing provisions in the contract more beneficial to their respective sides.
(3) Implementation of CBA - This was after both parties had signed the
contract, and the union members had ratified the same. Thus, the CBA had taken effect. At this stage the union and management found it necessary to have the same interpretation of the provisions of the CBA to avoid disputes. The effectivity of the contracts covered a variety of time periods, between one year and five years, the most common being three years.
4.2.3 Composition of the CBA Negotiating Panel One of the critical factors in the collective bargaining process is the people involved in the actual negotiations. These negotiators at the bargaining table vary slightly as to job title or position in the organization and number, depending on the type of union. Table 4 presents the usual members of the panel from both parties based on the survey. Table 4. Common CBA Panel of Negotiators
Union Panel Freq % Management Panel Freq %
Local Officers 42 100.00 IR/HRD Manager 42 100.00 • President Lawyer 35 83.33 • Vice President Manufacturing/Plant 10 23.81 • Secretary General Manager* 3 7.14 • Treasurer Employee Relations 1 2.38 • Auditor Controller 1 2.38
Federation Representative 30 71.43 • President • Secretary General
• Adviser • Legal Counsel
Member of a National Union, Federation Or Center
Observers/Research 3 7.14 Officers 48 100.00 IR/HRD Manager 48 100.00
• President Lawyer 15 31.25 • Vice President Senior Vice 8 16.67 • Board Members Controller 3 6.25 • Secretary Manufacturing/Plant 3 6.25 • PRO Finance 2 4.17
5 10.42 General Manager* 2 4.17 Lawyer Employee Relations 1 2.08
Sales Manager 1 2.08
Independent Enterprise Union
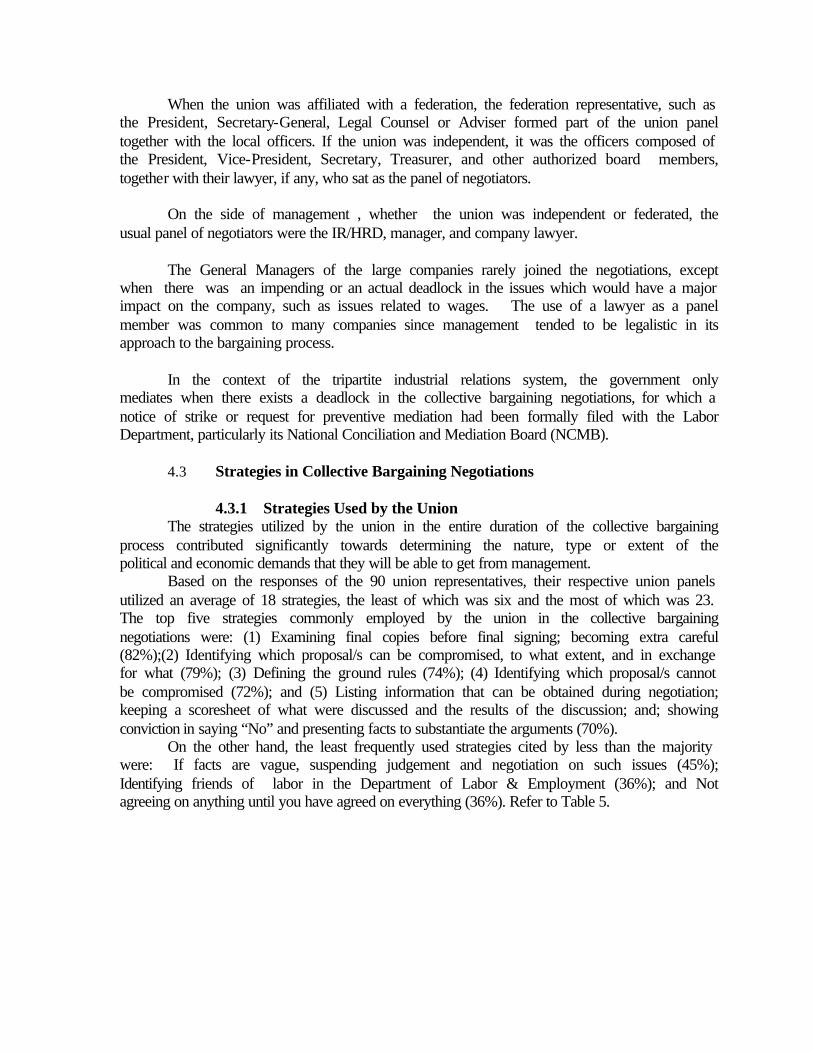
When the union was affiliated with a federation, the federation representative, such as the President, Secretary-General, Legal Counsel or Adviser formed part of the union panel together with the local officers. If the union was independent, it was the officers composed of the President, Vice-President, Secretary, Treasurer, and other authorized board members, together with their lawyer, if any, who sat as the panel of negotiators. On the side of management , whether the union was independent or federated, the usual panel of negotiators were the IR/HRD, manager, and company lawyer. The General Managers of the large companies rarely joined the negotiations, except when there was an impending or an actual deadlock in the issues which would have a major impact on the company, such as issues related to wages. The use of a lawyer as a panel member was common to many companies since management tended to be legalistic in its approach to the bargaining process.
In the context of the tripartite industrial relations system, the government only mediates when there exists a deadlock in the collective bargaining negotiations, for which a notice of strike or request for preventive mediation had been formally filed with the Labor Department, particularly its National Conciliation and Mediation Board (NCMB).
4.3 Strategies in Collective Bargaining Negotiations
4.3.1 Strategies Used by the Union The strategies utilized by the union in the entire duration of the collective bargaining
process contributed significantly towards determining the nature, type or extent of the political and economic demands that they will be able to get from management.
Based on the responses of the 90 union representatives, their respective union panels utilized an average of 18 strategies, the least of which was six and the most of which was 23. The top five strategies commonly employed by the union in the collective bargaining negotiations were: (1) Examining final copies before final signing; becoming extra careful (82%);(2) Identifying which proposal/s can be compromised, to what extent, and in exchange for what (79%); (3) Defining the ground rules (74%); (4) Identifying which proposal/s cannot be compromised (72%); and (5) Listing information that can be obtained during negotiation; keeping a scoresheet of what were discussed and the results of the discussion; and; showing conviction in saying “No” and presenting facts to substantiate the arguments (70%). On the other hand, the least frequently used strategies cited by less than the majority were: If facts are vague, suspending judgement and negotiation on such issues (45%); Identifying friends of labor in the Department of Labor & Employment (36%); and Not agreeing on anything until you have agreed on everything (36%). Refer to Table 5.
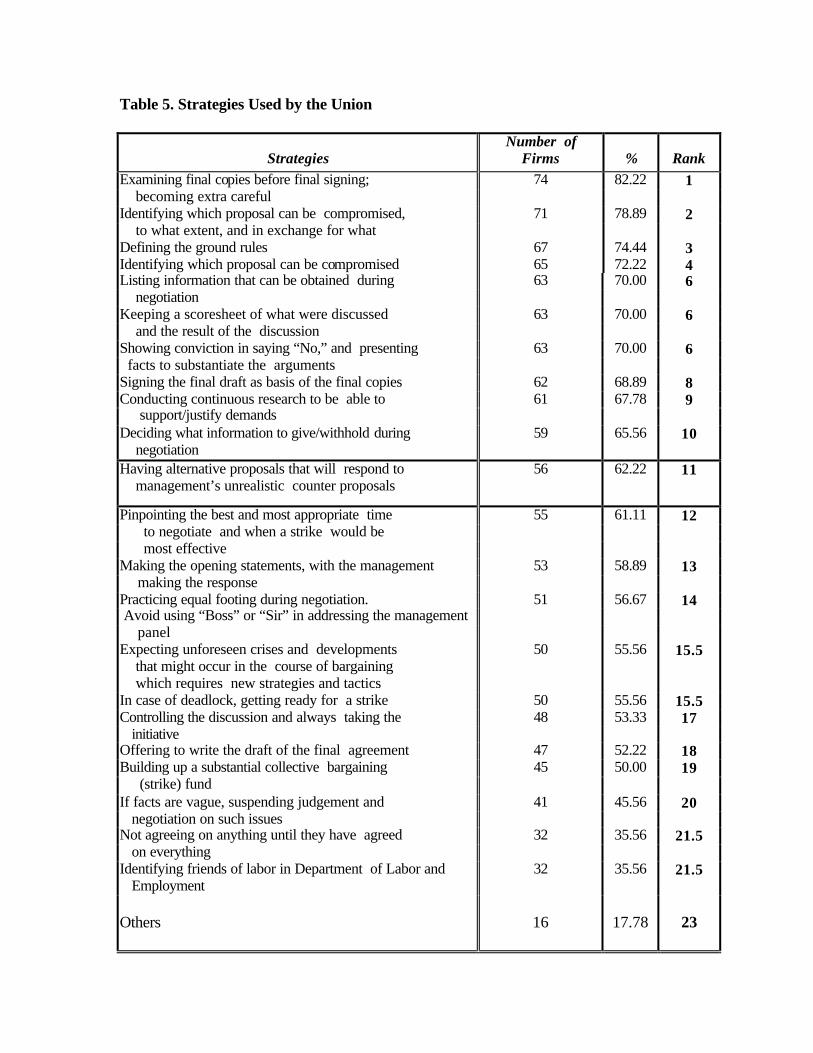
Table 5. Strategies Used by the Union
Strategies
Number of Firms
%
Rank
74 82.22 1 Examining final copies before final signing; becoming extra careful
71 78.89 2 Identifying which proposal can be compromised, to what extent, and in exchange for what Defining the ground rules 67 74.44 3 Identifying which proposal can be compromised 65 72.22 4
63 70.00 6 Listing information that can be obtained during negotiation
63 70.00 6 Keeping a scoresheet of what were discussed and the result of the discussion
63 70.00 6 Showing conviction in saying “No,” and presenting facts to substantiate the arguments Signing the final draft as basis of the final copies 62 68.89 8
61 67.78 9 Conducting continuous research to be able to support/justify demands Deciding what information to give/withhold during negotiation
59 65.56 10
Having alternative proposals that will respond to management’s unrealistic counter proposals
56 62.22 11
55 61.11 12
Pinpointing the best and most appropriate time to negotiate and when a strike would be most effective
53 58.89 13 Making the opening statements, with the management making the response
Practicing equal footing during negotiation. 51 56.67 14 Avoid using “Boss” or “Sir” in addressing the management
panel 50 55.56 15.5
Expecting unforeseen crises and developments that might occur in the course of bargaining which requires new strategies and tactics In case of deadlock, getting ready for a strike 50 55.56 15.5 Controlling the discussion and always taking the 48 53.33 17 initiative Offering to write the draft of the final agreement 47 52.22 18
45 50.00 19 Building up a substantial collective bargaining (strike) fund
41 45.56 20 If facts are vague, suspending judgement and negotiation on such issues
32 35.56 21.5 Not agreeing on anything until they have agreed on everything Identifying friends of labor in Department of Labor and
Employment 32 35.56 21.5
Others
16
17.78
23
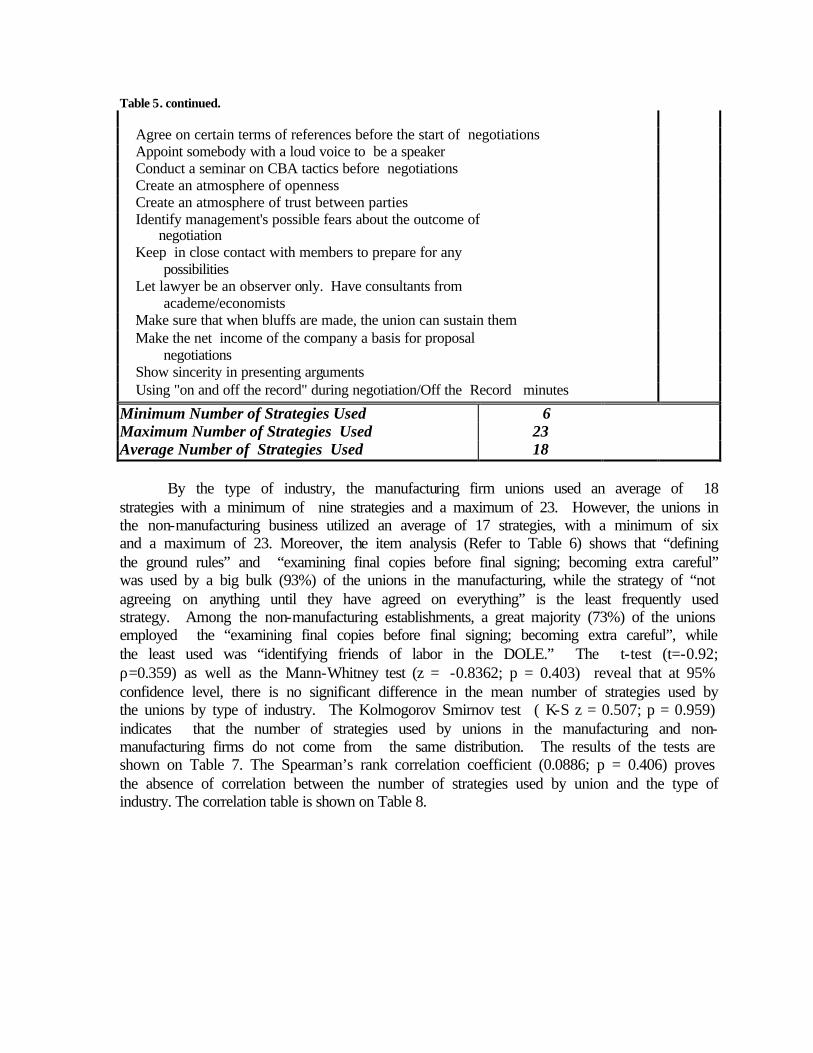
Table 5. continued. Agree on certain terms of references before the start of negotiations Appoint somebody with a loud voice to be a speaker Conduct a seminar on CBA tactics before negotiations Create an atmosphere of openness Create an atmosphere of trust between parties Identify management's possible fears about the outcome of negotiation
Keep in close contact with members to prepare for any possibilities
Let lawyer be an observer only. Have consultants from academe/economists
Make sure that when bluffs are made, the union can sustain them Make the net income of the company a basis for proposal negotiations
Show sincerity in presenting arguments Using "on and off the record" during negotiation/Off the Record minutes Minimum Number of Strategies Used 6 Maximum Number of Strategies Used 23 Average Number of Strategies Used 18
By the type of industry, the manufacturing firm unions used an average of 18
strategies with a minimum of nine strategies and a maximum of 23. However, the unions in the non-manufacturing business utilized an average of 17 strategies, with a minimum of six and a maximum of 23. Moreover, the item analysis (Refer to Table 6) shows that “defining the ground rules” and “examining final copies before final signing; becoming extra careful” was used by a big bulk (93%) of the unions in the manufacturing, while the strategy of “not agreeing on anything until they have agreed on everything” is the least frequently used strategy. Among the non-manufacturing establishments, a great majority (73%) of the unions employed the “examining final copies before final signing; becoming extra careful”, while the least used was “identifying friends of labor in the DOLE.” The t-test (t=-0.92; ρ=0.359) as well as the Mann-Whitney test (z = -0.8362; p = 0.403) reveal that at 95% confidence level, there is no significant difference in the mean number of strategies used by the unions by type of industry. The Kolmogorov Smirnov test ( K-S z = 0.507; p = 0.959) indicates that the number of strategies used by unions in the manufacturing and non-manufacturing firms do not come from the same distribution. The results of the tests are shown on Table 7. The Spearman’s rank correlation coefficient (0.0886; p = 0.406) proves the absence of correlation between the number of strategies used by union and the type of industry. The correlation table is shown on Table 8.
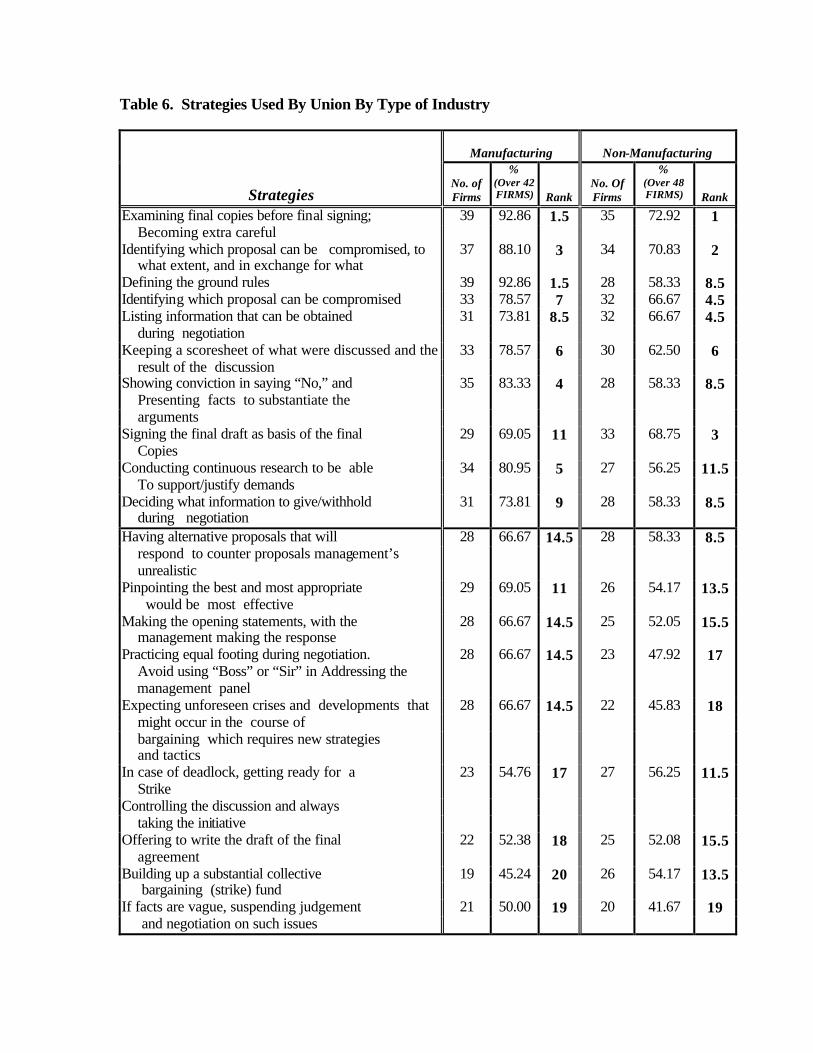
Table 6. Strategies Used By Union By Type of Industry
Manufacturing
Non-Manufacturing
Strategies
No. of Firms
% (Over 42 FIRMS)
Rank
No. Of Firms
% (Over 48 FIRMS)
Rank
Examining final copies before final signing; 39 92.86 1.5 35 72.92 1 Becoming extra careful
37 88.10 3 34 70.83 2 Identifying which proposal can be compromised, to what extent, and in exchange for what
Defining the ground rules 39 92.86 1.5 28 58.33 8.5 Identifying which proposal can be compromised 33 78.57 7 32 66.67 4.5 Listing information that can be obtained 31 73.81 8.5 32 66.67 4.5 during negotiation
33 78.57 6 30 62.50 6 Keeping a scoresheet of what were discussed and the result of the discussion
Showing conviction in saying “No,” and Presenting facts to substantiate the
35 83.33 4 28 58.33 8.5
arguments Signing the final draft as basis of the final Copies
29 69.05 11 33 68.75 3
Conducting continuous research to be able 34 80.95 5 27 56.25 11.5 To support/justify demands Deciding what information to give/withhold during negotiation
31 73.81 9 28 58.33 8.5
28 66.67 14.5 28 58.33 8.5 Having alternative proposals that will respond to counter proposals management’s
unrealistic
29 69.05 11 26 54.17 13.5 Pinpointing the best and most appropriate would be most effective
28 66.67 14.5 25 52.05 15.5 Making the opening statements, with the management making the response
28 66.67 14.5 23 47.92 17 Practicing equal footing during negotiation. Avoid using “Boss” or “Sir” in Addressing the management panel
28 66.67 14.5 22 45.83 18
Expecting unforeseen crises and developments that might occur in the course of
bargaining which requires new strategies and tactics
In case of deadlock, getting ready for a Strike
23 54.76 17 27 56.25 11.5
Controlling the discussion and always taking the initiative Offering to write the draft of the final agreement
22 52.38 18 25 52.08 15.5
19 45.24 20 26 54.17 13.5 Building up a substantial collective bargaining (strike) fund
21 50.00 19 20 41.67 19 If facts are vague, suspending judgement and negotiation on such issues
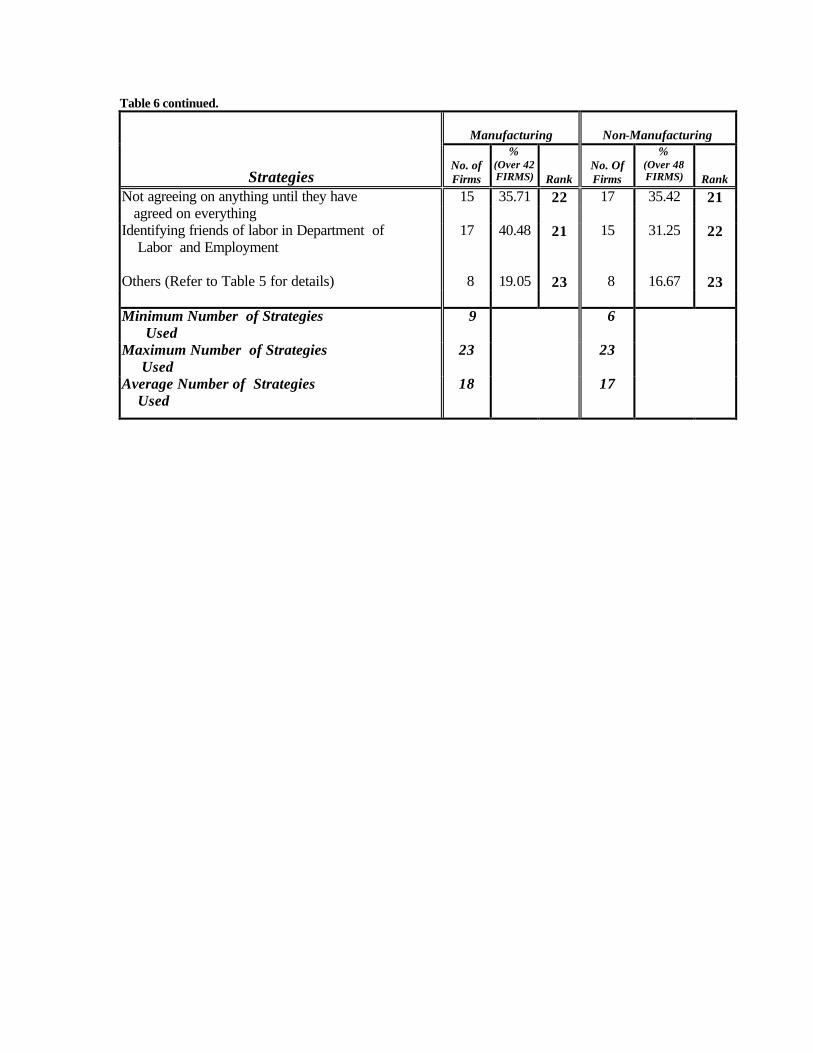
Table 6 continued.
Manufacturing
Non-Manufacturing
Strategies
No. of Firms
% (Over 42 FIRMS)
Rank
No. Of Firms
% (Over 48 FIRMS)
Rank 15 35.71 22 17 35.42 21 Not agreeing on anything until they have
agreed on everything Identifying friends of labor in Department of Labor and Employment
17 40.48 21 15 31.25 22
Others (Refer to Table 5 for details) 8 19.05 23 8 16.67 23
Minimum Number of Strategies Used
9 6
Maximum Number of Strategies Used
23 23
Average Number of Strategies Used
18 17
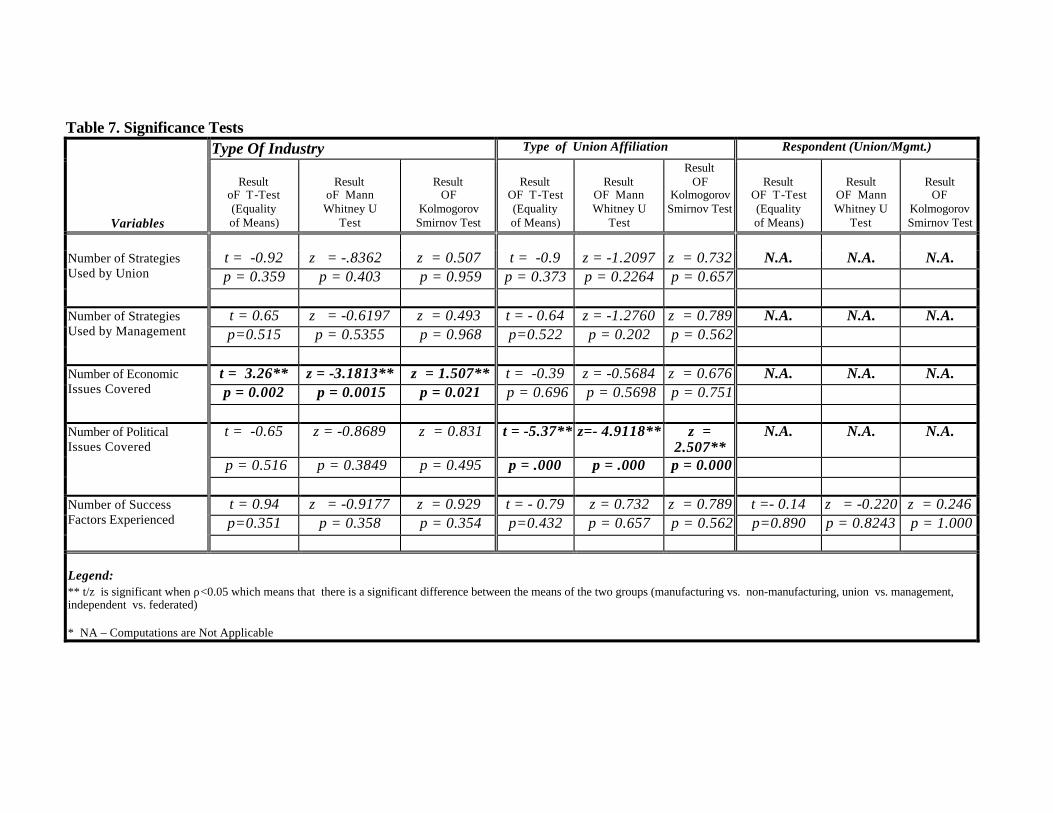
Table 7. Significance Tests Type Of Industry Type of Union Affiliation Respondent (Union/Mgmt.)
Variables
Result
oF T-Test (Equality of Means)
Result
oF Mann Whitney U
Test
Result
OF Kolmogorov Smirnov Test
Result
OF T-Test (Equality of Means)
Result
OF Mann Whitney U
Test
Result OF
Kolmogorov Smirnov Test
Result
OF T-Test (Equality of Means)
Result
OF Mann Whitney U
Test
Result
OF Kolmogorov Smirnov Test
t = -0.92 z = -.8362 z = 0.507 t = -0.9 z = -1.2097 z = 0.732 N.A. N.A. N.A. p = 0.359 p = 0.403 p = 0.959 p = 0.373 p = 0.2264 p = 0.657
Number of Strategies Used by Union
t = 0.65 z = -0.6197 z = 0.493 t = - 0.64 z = -1.2760 z = 0.789 N.A. N.A. N.A. p=0.515 p = 0.5355 p = 0.968 p=0.522 p = 0.202 p = 0.562
Number of Strategies Used by Management
t = 3.26** z = -3.1813** z = 1.507** t = -0.39 z = -0.5684 z = 0.676 N.A. N.A. N.A. p = 0.002 p = 0.0015 p = 0.021 p = 0.696 p = 0.5698 p = 0.751
Number of Economic Issues Covered
t = -0.65 z = -0.8689 z = 0.831 t = -5.37** z=- 4.9118** z =
2.507** N.A. N.A. N.A.
p = 0.516 p = 0.3849 p = 0.495 p = .000 p = .000 p = 0.000
Number of Political Issues Covered
t = 0.94 z = -0.9177 z = 0.929 t = - 0.79 z = 0.732 z = 0.789 t =- 0.14 z = -0.220 z = 0.246 p=0.351 p = 0.358 p = 0.354 p=0.432 p = 0.657 p = 0.562 p=0.890 p = 0.8243 p = 1.000
Number of Success Factors Experienced
Legend: ** t/z is significant when ρ<0.05 which means that there is a significant difference between the means of the two groups (manufacturing vs. non-manufacturing, union vs. management, independent vs. federated) * NA – Computations are Not Applicable
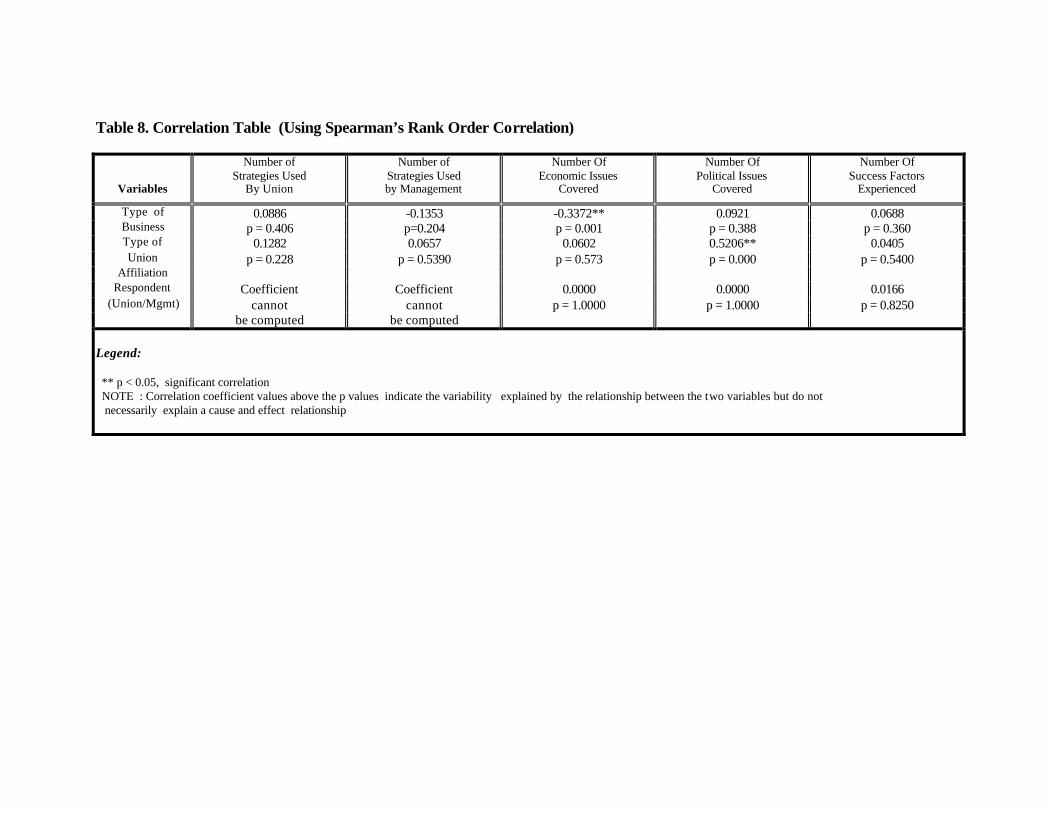
Table 8. Correlation Table (Using Spearman’s Rank Order Correlation)
Variables
Number of Strategies Used
By Union
Number of Strategies Used by Management
Number Of Economic Issues
Covered
Number Of Political Issues
Covered
Number Of Success Factors
Experienced
Type of 0.0886 -0.1353 -0.3372** 0.0921 0.0688 Business p = 0.406 p=0.204 p = 0.001 p = 0.388 p = 0.360 Type of 0.1282 0.0657 0.0602 0.5206** 0.0405 Union p = 0.228 p = 0.5390 p = 0.573 p = 0.000 p = 0.5400
Affiliation Respondent Coefficient Coefficient 0.0000 0.0000 0.0166
(Union/Mgmt) cannot cannot p = 1.0000 p = 1.0000 p = 0.8250 be computed be computed
Legend: ** p < 0.05, significant correlation NOTE : Correlation coefficient values above the p values indicate the variability explained by the relationship between the two variables but do not necessarily explain a cause and effect relationship
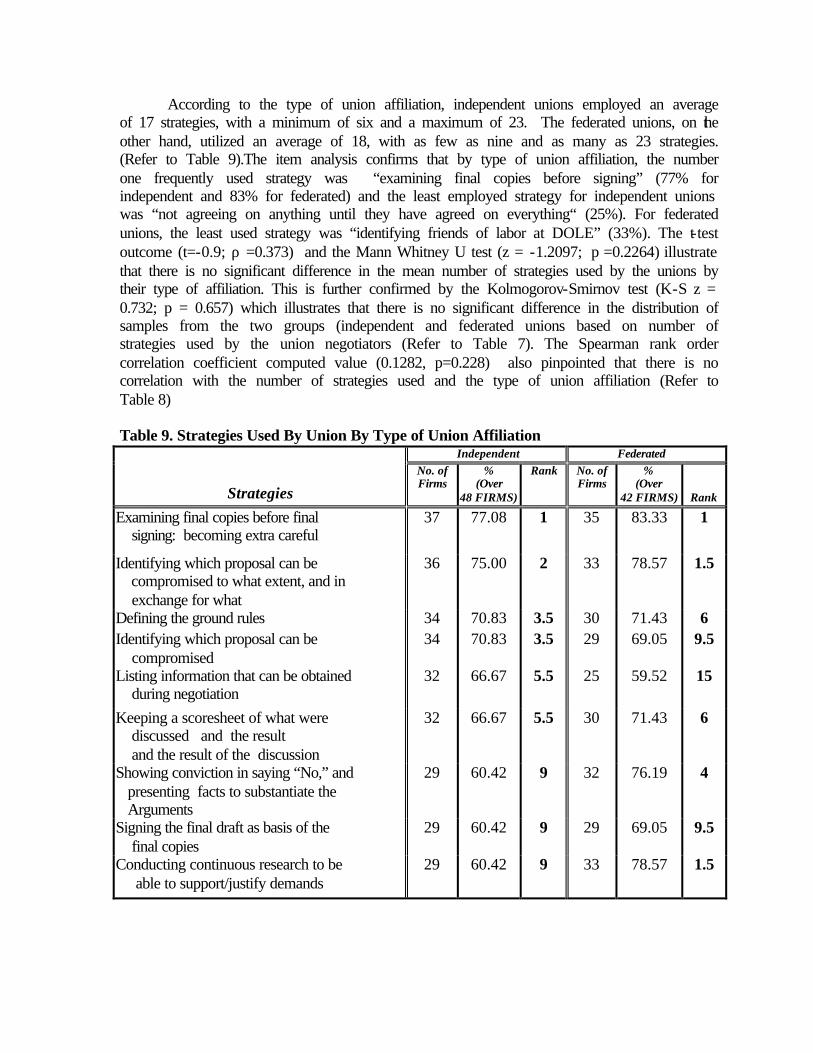
According to the type of union affiliation, independent unions employed an average of 17 strategies, with a minimum of six and a maximum of 23. The federated unions, on the other hand, utilized an average of 18, with as few as nine and as many as 23 strategies. (Refer to Table 9).The item analysis confirms that by type of union affiliation, the number one frequently used strategy was “examining final copies before signing” (77% for independent and 83% for federated) and the least employed strategy for independent unions was “not agreeing on anything until they have agreed on everything“ (25%). For federated unions, the least used strategy was “identifying friends of labor at DOLE” (33%). The t-test outcome (t=-0.9; ρ =0.373) and the Mann Whitney U test (z = -1.2097; p =0.2264) illustrate that there is no significant difference in the mean number of strategies used by the unions by their type of affiliation. This is further confirmed by the Kolmogorov-Smirnov test (K-S z = 0.732; p = 0.657) which illustrates that there is no significant difference in the distribution of samples from the two groups (independent and federated unions based on number of strategies used by the union negotiators (Refer to Table 7). The Spearman rank order correlation coefficient computed value (0.1282, p=0.228) also pinpointed that there is no correlation with the number of strategies used and the type of union affiliation (Refer to Table 8)
Table 9. Strategies Used By Union By Type of Union Affiliation
Independent Federated
Strategies No. of Firms
% (Over
48 FIRMS)
Rank No. of Firms
% (Over
42 FIRMS)
Rank
Examining final copies before final signing: becoming extra careful
37 77.08 1 35 83.33 1
Identifying which proposal can be compromised to what extent, and in exchange for what
36 75.00 2 33 78.57 1.5
Defining the ground rules 34 70.83 3.5 30 71.43 6 Identifying which proposal can be compromised
34 70.83 3.5 29 69.05 9.5
Listing information that can be obtained during negotiation
32 66.67 5.5 25 59.52 15
Keeping a scoresheet of what were discussed and the result and the result of the discussion
32 66.67 5.5 30 71.43 6
Showing conviction in saying “No,” and presenting facts to substantiate the Arguments
29 60.42 9 32 76.19 4
Signing the final draft as basis of the final copies
29 60.42 9 29 69.05 9.5
Conducting continuous research to be able to support/justify demands
29 60.42 9 33 78.57 1.5
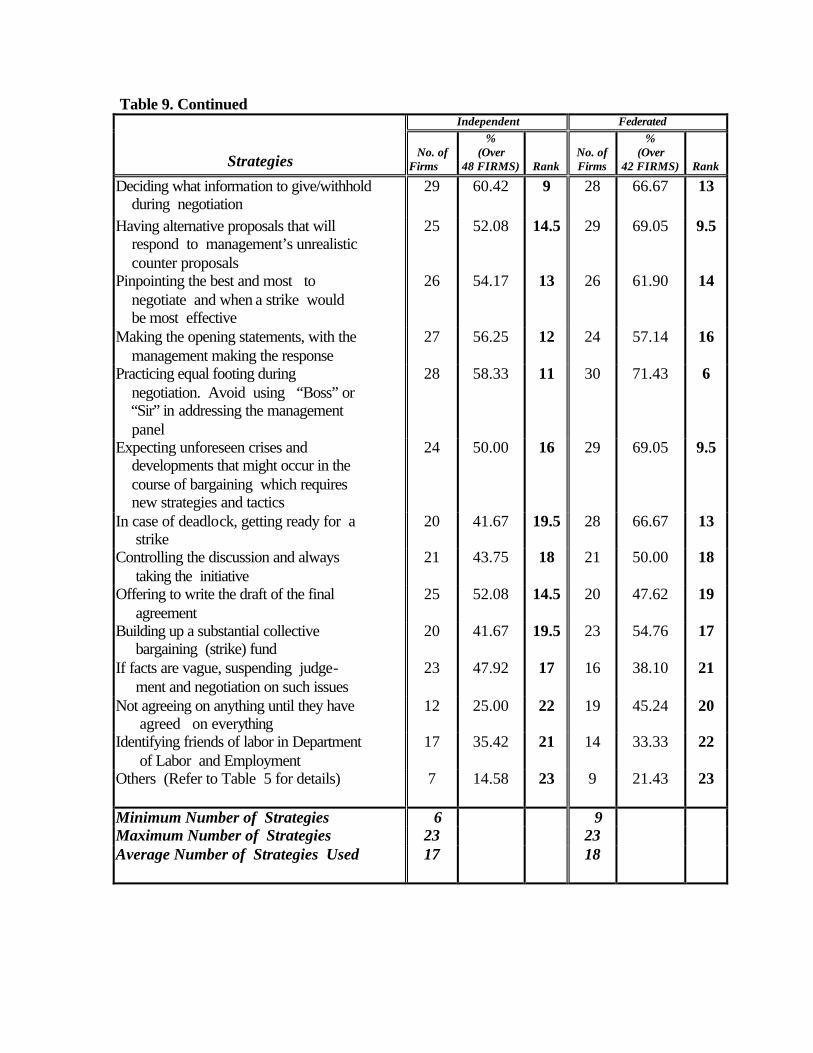
Table 9. Continued Independent Federated
Strategies
No. of
Firms
% (Over
48 FIRMS)
Rank
No. of Firms
% (Over
42 FIRMS)
Rank
Deciding what information to give/withhold during negotiation
29 60.42 9 28 66.67 13
Having alternative proposals that will respond to management’s unrealistic
counter proposals
25
52.08 14.5 29 69.05 9.5
Pinpointing the best and most to negotiate and when a strike would be most effective
26 54.17 13 26 61.90 14
Making the opening statements, with the management making the response
27 56.25 12 24 57.14 16
Practicing equal footing during negotiation. Avoid using “Boss” or “Sir” in addressing the management panel
28 58.33 11 30 71.43 6
Expecting unforeseen crises and developments that might occur in the course of bargaining which requires new strategies and tactics
24 50.00 16 29 69.05 9.5
In case of deadlock, getting ready for a strike
20 41.67 19.5 28 66.67 13
Controlling the discussion and always taking the initiative
21 43.75 18 21 50.00 18
Offering to write the draft of the final agreement
25 52.08 14.5 20 47.62 19
Building up a substantial collective bargaining (strike) fund
20 41.67 19.5 23 54.76 17
If facts are vague, suspending judge- ment and negotiation on such issues
23 47.92 17 16 38.10 21
Not agreeing on anything until they have agreed on everything
12 25.00 22 19 45.24 20
Identifying friends of labor in Department of Labor and Employment
17 35.42 21 14 33.33 22
Others (Refer to Table 5 for details)
7 14.58 23 9 21.43 23
Minimum Number of Strategies 6 9 Maximum Number of Strategies 23 23 Average Number of Strategies Used
17 18
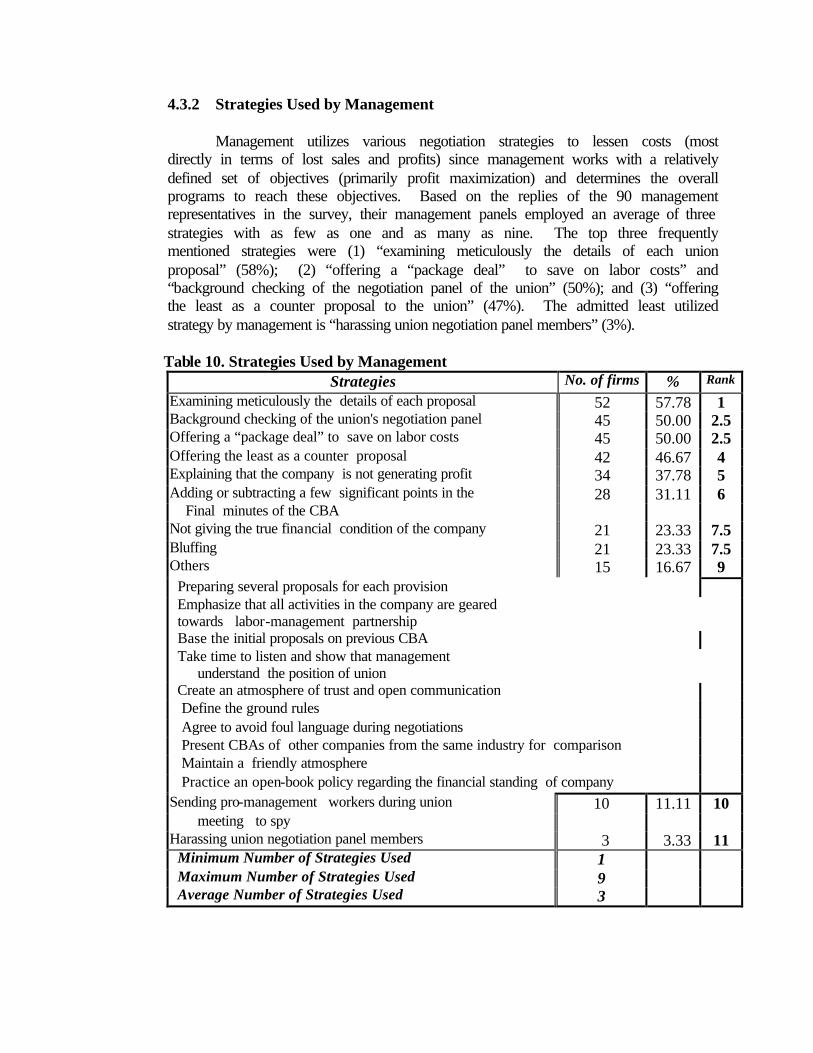
4.3.2 Strategies Used by Management Management utilizes various negotiation strategies to lessen costs (most
directly in terms of lost sales and profits) since management works with a relatively defined set of objectives (primarily profit maximization) and determines the overall programs to reach these objectives. Based on the replies of the 90 management representatives in the survey, their management panels employed an average of three strategies with as few as one and as many as nine. The top three frequently mentioned strategies were (1) “examining meticulously the details of each union proposal” (58%); (2) “offering a “package deal” to save on labor costs” and “background checking of the negotiation panel of the union” (50%); and (3) “offering the least as a counter proposal to the union” (47%). The admitted least utilized strategy by management is “harassing union negotiation panel members” (3%).
Table 10. Strategies Used by Management
Strategies No. of firms % Rank
Examining meticulously the details of each proposal 52 57.78 1 Background checking of the union's negotiation panel 45 50.00 2.5 Offering a “package deal” to save on labor costs 45 50.00 2.5 Offering the least as a counter proposal 42 46.67 4 Explaining that the company is not generating profit 34 37.78 5 Adding or subtracting a few significant points in the 28 31.11 6 Final minutes of the CBA Not giving the true financial condition of the company 21 23.33 7.5 Bluffing 21 23.33 7.5 Others 15 16.67 9 Preparing several proposals for each provision Emphasize that all activities in the company are geared towards labor-management partnership Base the initial proposals on previous CBA Take time to listen and show that management understand the position of union Create an atmosphere of trust and open communication Define the ground rules Agree to avoid foul language during negotiations Present CBAs of other companies from the same industry for comparison Maintain a friendly atmosphere Practice an open-book policy regarding the financial standing of company Sending pro-management workers during union 10 11.11 10 meeting to spy Harassing union negotiation panel members 3 3.33 11 Minimum Number of Strategies Used 1 Maximum Number of Strategies Used 9 Average Number of Strategies Used 3
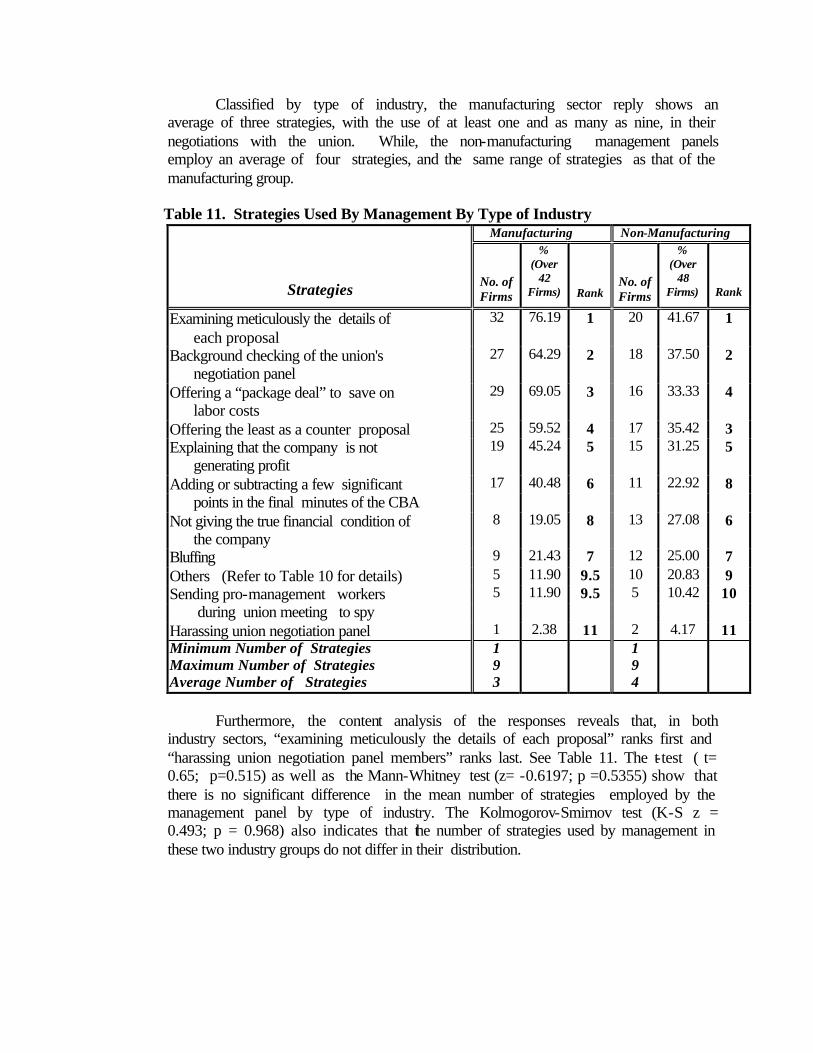
Classified by type of industry, the manufacturing sector reply shows an average of three strategies, with the use of at least one and as many as nine, in their negotiations with the union. While, the non-manufacturing management panels employ an average of four strategies, and the same range of strategies as that of the manufacturing group.
Table 11. Strategies Used By Management By Type of Industry
Manufacturing Non-Manufacturing
Strategies
No. of Firms
% (Over
42 Firms)
Rank
No. of Firms
% (Over
48 Firms)
Rank
Examining meticulously the details of each proposal
32 76.19 1 20 41.67 1
Background checking of the union's negotiation panel
27 64.29 2 18 37.50 2
Offering a “package deal” to save on labor costs
29 69.05 3 16 33.33 4
Offering the least as a counter proposal 25 59.52 4 17 35.42 3 Explaining that the company is not generating profit
19 45.24 5 15 31.25 5
Adding or subtracting a few significant 17 40.48 6 11 22.92 8 points in the final minutes of the CBA Not giving the true financial condition of the company
8 19.05 8 13 27.08 6
Bluffing 9 21.43 7 12 25.00 7 Others (Refer to Table 10 for details) 5 11.90 9.5 10 20.83 9 Sending pro-management workers 5 11.90 9.5 5 10.42 10 during union meeting to spy Harassing union negotiation panel 1 2.38 11 2 4.17 11 Minimum Number of Strategies 1 1 Maximum Number of Strategies 9 9 Average Number of Strategies 3 4
Furthermore, the content analysis of the responses reveals that, in both
industry sectors, “examining meticulously the details of each proposal” ranks first and “harassing union negotiation panel members” ranks last. See Table 11. The t-test ( t= 0.65; p=0.515) as well as the Mann-Whitney test (z= -0.6197; p =0.5355) show that there is no significant difference in the mean number of strategies employed by the management panel by type of industry. The Kolmogorov-Smirnov test (K-S z = 0.493; p = 0.968) also indicates that the number of strategies used by management in these two industry groups do not differ in their distribution.
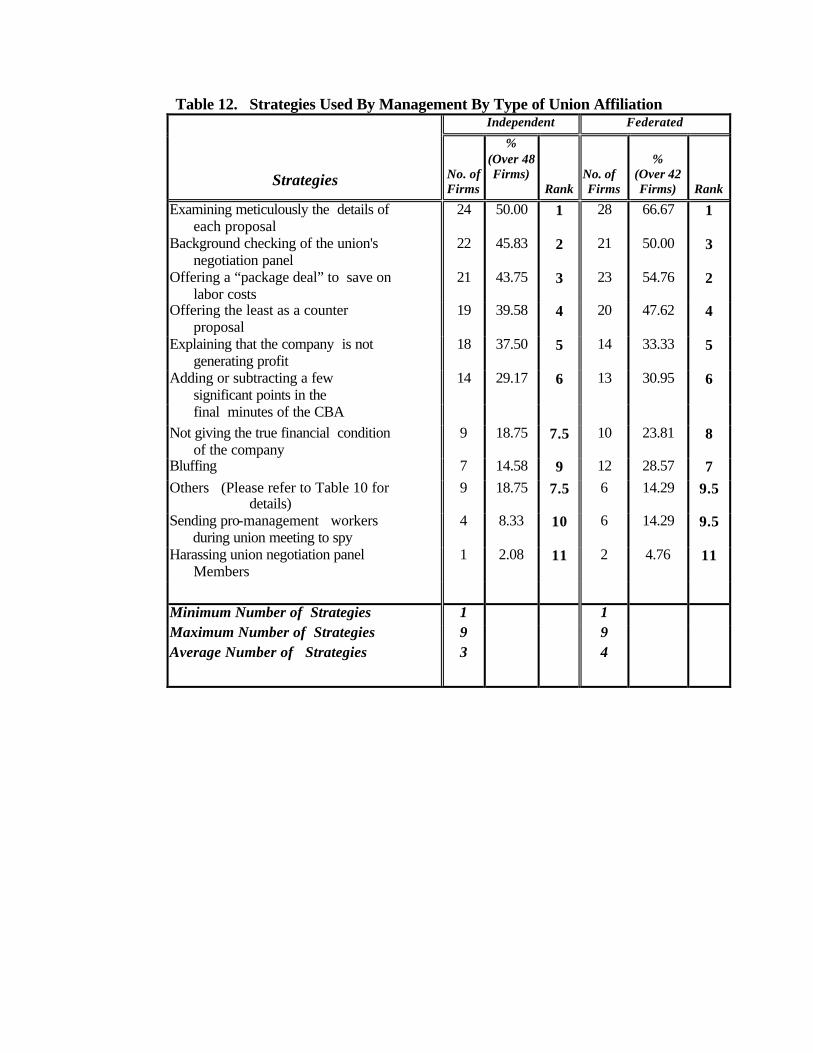
Table 12. Strategies Used By Management By Type of Union Affiliation Independent Federated
Strategies
No. of Firms
% (Over 48 Firms)
Rank
No. of Firms
%
(Over 42 Firms)
Rank
Examining meticulously the details of each proposal
24 50.00 1 28 66.67 1
Background checking of the union's negotiation panel
22 45.83 2 21 50.00 3
Offering a “package deal” to save on labor costs
21 43.75 3 23 54.76 2
Offering the least as a counter proposal
19 39.58 4 20 47.62 4
Explaining that the company is not generating profit
18 37.50 5 14 33.33 5
Adding or subtracting a few significant points in the
14 29.17 6 13 30.95 6
final minutes of the CBA Not giving the true financial condition of the company
9 18.75 7.5 10 23.81 8
Bluffing 7 14.58 9 12 28.57 7 Others (Please refer to Table 10 for details)
9 18.75 7.5 6 14.29 9.5
Sending pro-management workers during union meeting to spy
4 8.33 10 6 14.29 9.5
Harassing union negotiation panel Members
1 2.08 11 2 4.76 11
Minimum Number of Strategies 1 1 Maximum Number of Strategies 9 9 Average Number of Strategies 3 4
5. Common Political and Economic Issues
The CBAs cover a variety of issues, which may be broadly categorized as: political and economic. The political issues are those related to: (1) coverage/scope; (2) union security; (3) job security or security of tenure (4) rights and responsibilities of parties; (5) company rules and regulations; (6) management prerogatives; (7) strikes/lockouts; (8) check off; (9) grievance procedure; (10) disciplinary measures; (11) labor-management council/committee (12) union leave; (13) union holiday-off; and (14) union assistance . The economic issues, on the other hand, are those related to: (1) wages; (2) premiums; (3) allowances; (4) bonuses; (5) hospitalization; (6) insurance; (7) retirement; (8) productivity incentives; (9) meal subsidies; (10) uniforms; (11) promotions; and (12) leaves.
Based on this classification of CBA issues, the content analysis of the existing
contracts of the 90 unionized firms reveals a number of interesting patterns.
5.1 Economic Issues
On the major economic issues covered, all (100%) CBAs have wage provisions which stipulate among others, across the board increases ranging from a minimum of 10%/P150 per month, to a maximum of 15%/P2,200 per month with an average of 13%/P786 per month for three years. One hundred percent (100%) of the union contracts contain provisions on premiums mandated by law. These are payment for services rendered for night duty, overtime, holiday and rest day. All (100%) companies also have CBA provisions on vacation and sick leave benefits, with a minimum entitlement of 10 days to a maximum of 21 days, or an average of 15 days per year. Other leaves such as emergency, birthday, bereavement and funeral, are also manifested in 98% of the CBAs. These leaves range from one day up to 15 days with an average of seven days. The third most frequently (89%) negotiated economic provision is hospitalization. This benefit gives at least P5,000 and as much as P130,000, with an average of P40,879, per year. Bonus provisions are included in 76% of the CBAs. This benefit is over and above the 13th month pay. Workers receive at least one month to a maximum of four months with an average of two months yearly bonus. Retirement provisions are also indicated in a considerable number of contracts (71%). The retirement benefit is equivalent to 15 days’ to three months’ pay with an average of one month salary per year of service. Allowances provisions rank fifth (66%), with a minimum of P100 to P4,000, and an average of P1,343 per month as employee allowance. The insurance provisions, on the other hand, cover life insurance benefits for employees, ranging from P11,000 to P600,000, with an average of P164,937. Uniform benefit is also stipulated in 60% of the CBAs. Employees receive two sets/P500 to six sets/P6,000, with an average of four sets/P1,922 per year. Meal subsidies are negotiated in 54% of the contracts. Management subsidizes about P8.00 to P100 with an average of P41.00 per duty meal. However, hotel and restaurant workers get free meals because of the nature of their establishments.
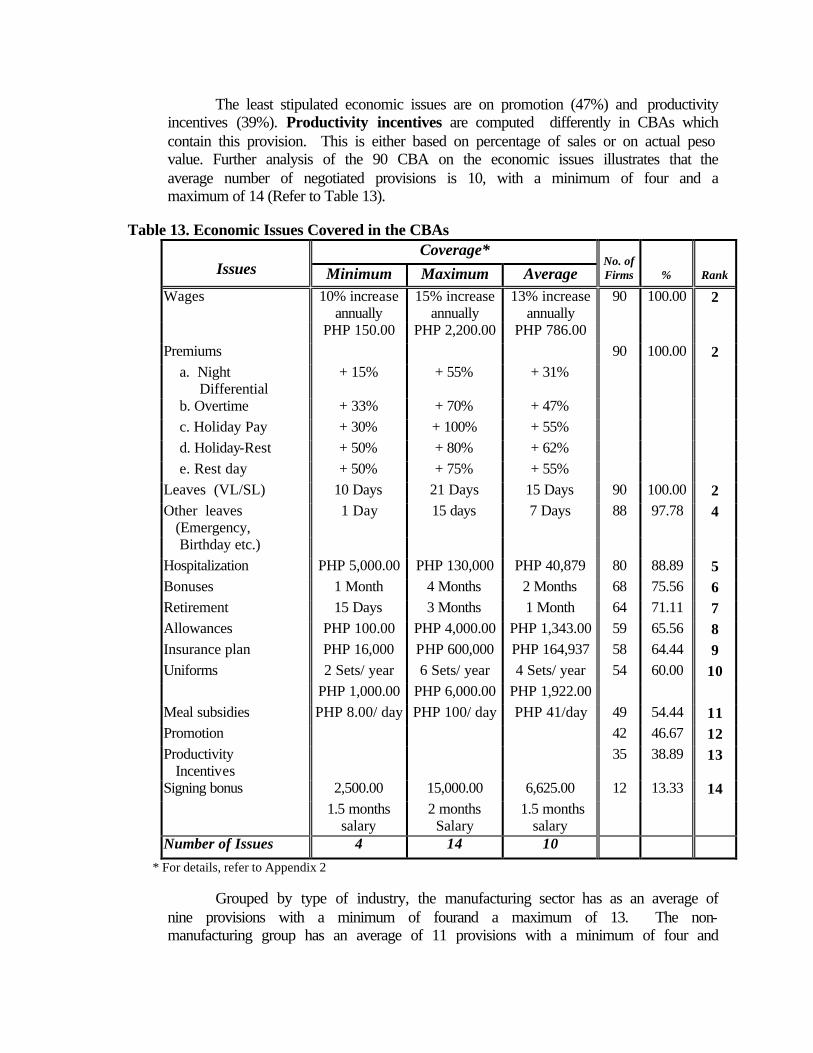
The least stipulated economic issues are on promotion (47%) and productivity incentives (39%). Productivity incentives are computed differently in CBAs which contain this provision. This is either based on percentage of sales or on actual peso value. Further analysis of the 90 CBA on the economic issues illustrates that the average number of negotiated provisions is 10, with a minimum of four and a maximum of 14 (Refer to Table 13).
Table 13. Economic Issues Covered in the CBAs
Coverage* Issues Minimum Maximum Average
No. of Firms
%
Rank
Wages 10% increase annually
15% increase annually
13% increase annually
90 100.00 2
PHP 150.00 PHP 2,200.00 PHP 786.00 Premiums 90 100.00 2 a. Night Differential
+ 15% + 55% + 31%
b. Overtime + 33% + 70% + 47% c. Holiday Pay + 30% + 100% + 55% d. Holiday-Rest + 50% + 80% + 62% e. Rest day + 50% + 75% + 55% Leaves (VL/SL) 10 Days 21 Days 15 Days 90 100.00 2 Other leaves (Emergency,
1 Day 15 days 7 Days 88 97.78 4
Birthday etc.) Hospitalization PHP 5,000.00 PHP 130,000 PHP 40,879 80 88.89 5 Bonuses 1 Month 4 Months 2 Months 68 75.56 6 Retirement 15 Days 3 Months 1 Month 64 71.11 7 Allowances PHP 100.00 PHP 4,000.00 PHP 1,343.00 59 65.56 8 Insurance plan PHP 16,000 PHP 600,000 PHP 164,937 58 64.44 9 Uniforms 2 Sets/ year 6 Sets/ year 4 Sets/ year 54 60.00 10
PHP 1,000.00 PHP 6,000.00 PHP 1,922.00 Meal subsidies PHP 8.00/ day PHP 100/ day PHP 41/day 49 54.44 11 Promotion 42 46.67 12 Productivity Incentives
35 38.89 13
Signing bonus 2,500.00 15,000.00 6,625.00 12 13.33 14 1.5 months
salary 2 months
Salary 1.5 months
salary
Number of Issues 4 14 10 * For details, refer to Appendix 2
Grouped by type of industry, the manufacturing sector has as an average of nine provisions with a minimum of fourand a maximum of 13. The non-manufacturing group has an average of 11 provisions with a minimum of four and
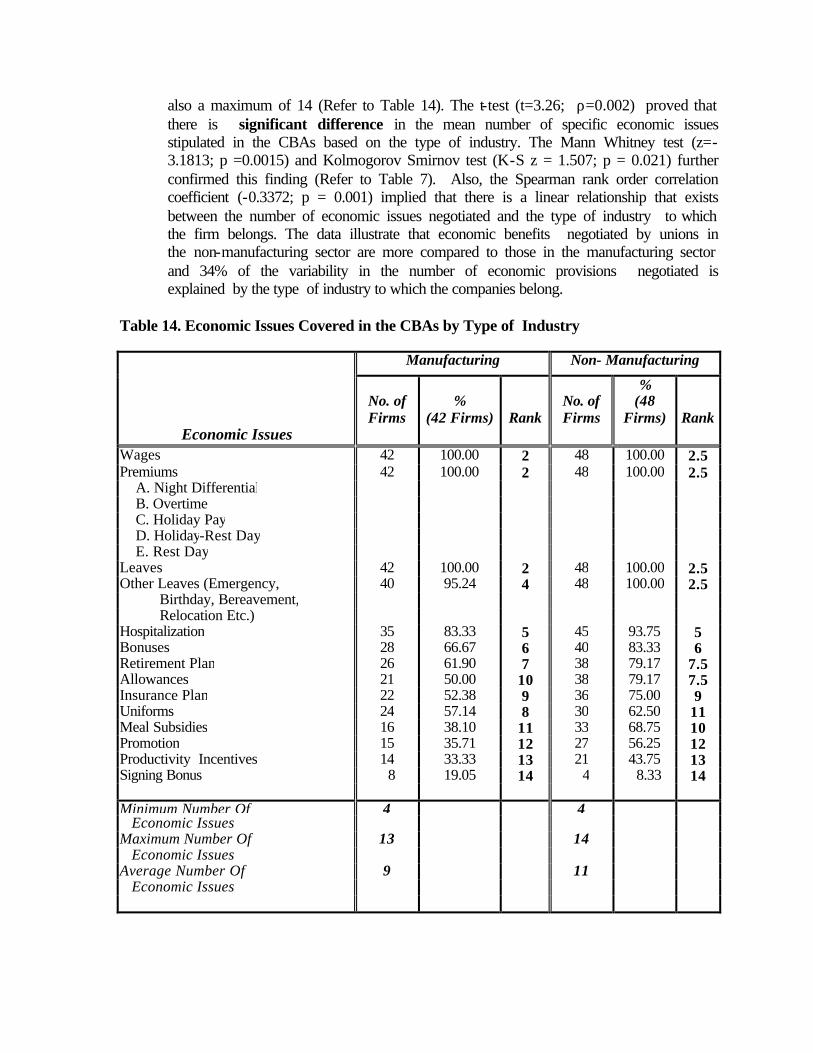
also a maximum of 14 (Refer to Table 14). The t-test (t=3.26; ρ=0.002) proved that there is significant difference in the mean number of specific economic issues stipulated in the CBAs based on the type of industry. The Mann Whitney test (z=-3.1813; p =0.0015) and Kolmogorov Smirnov test (K-S z = 1.507; p = 0.021) further confirmed this finding (Refer to Table 7). Also, the Spearman rank order correlation coefficient (-0.3372; p = 0.001) implied that there is a linear relationship that exists between the number of economic issues negotiated and the type of industry to which the firm belongs. The data illustrate that economic benefits negotiated by unions in the non-manufacturing sector are more compared to those in the manufacturing sector and 34% of the variability in the number of economic provisions negotiated is explained by the type of industry to which the companies belong.
Table 14. Economic Issues Covered in the CBAs by Type of Industry
Manufacturing Non- Manufacturing
Economic Issues
No. of Firms
%
(42 Firms)
Rank
No. of Firms
% (48
Firms)
Rank
Wages 42 100.00 2 48 100.00 2.5 Premiums 42 100.00 2 48 100.00 2.5 A. Night Differential B. Overtime C. Holiday Pay D. Holiday-Rest Day E. Rest Day Leaves 42 100.00 2 48 100.00 2.5 Other Leaves (Emergency, 40 95.24 4 48 100.00 2.5 Birthday, Bereavement, Relocation Etc.) Hospitalization 35 83.33 5 45 93.75 5 Bonuses 28 66.67 6 40 83.33 6 Retirement Plan 26 61.90 7 38 79.17 7.5 Allowances 21 50.00 10 38 79.17 7.5 Insurance Plan 22 52.38 9 36 75.00 9 Uniforms 24 57.14 8 30 62.50 11 Meal Subsidies 16 38.10 11 33 68.75 10 Promotion 15 35.71 12 27 56.25 12 Productivity Incentives 14 33.33 13 21 43.75 13 Signing Bonus 8 19.05 14 4 8.33 14
Minimum Number Of 4 4 Economic Issues Maximum Number Of 13 14 Economic Issues Average Number Of 9 11 Economic Issues
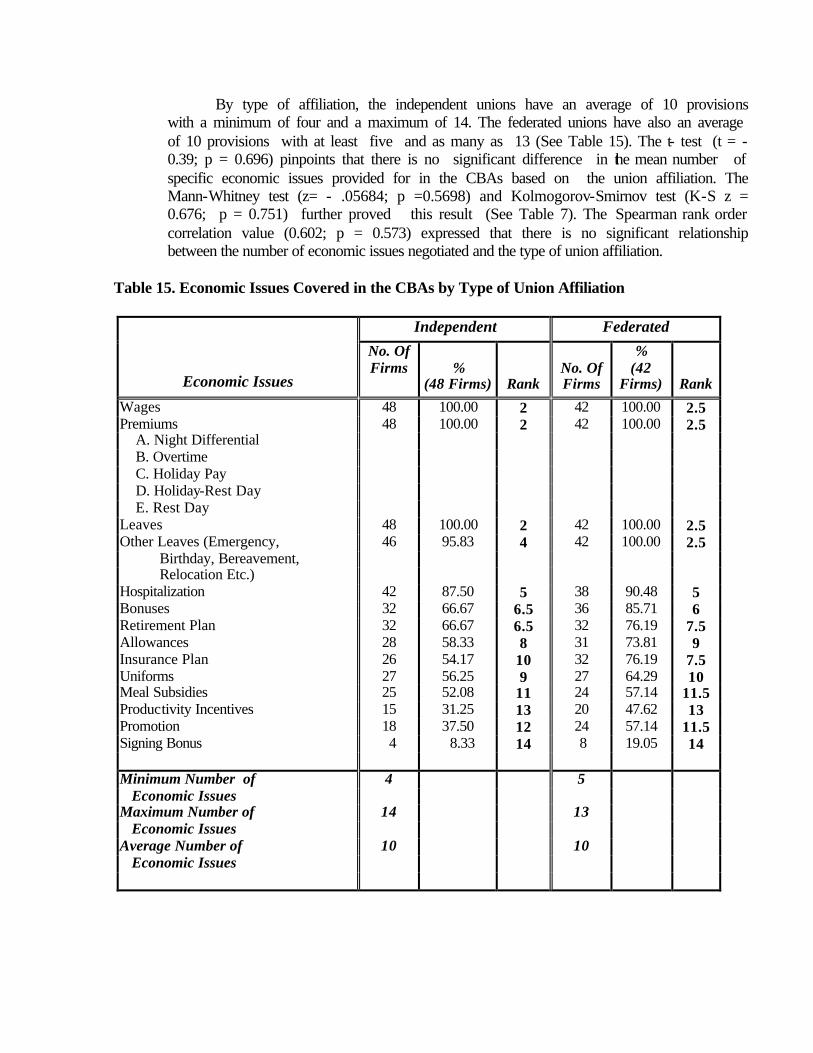
By type of affiliation, the independent unions have an average of 10 provisions with a minimum of four and a maximum of 14. The federated unions have also an average of 10 provisions with at least five and as many as 13 (See Table 15). The t- test (t = -0.39; p = 0.696) pinpoints that there is no significant difference in the mean number of specific economic issues provided for in the CBAs based on the union affiliation. The Mann-Whitney test (z= - .05684; p =0.5698) and Kolmogorov-Smirnov test (K-S z = 0.676; p = 0.751) further proved this result (See Table 7). The Spearman rank order correlation value (0.602; p = 0.573) expressed that there is no significant relationship between the number of economic issues negotiated and the type of union affiliation.
Table 15. Economic Issues Covered in the CBAs by Type of Union Affiliation
Independent Federated
Economic Issues
No. Of Firms
%
(48 Firms)
Rank
No. Of Firms
% (42
Firms)
Rank
Wages 48 100.00 2 42 100.00 2.5 Premiums 48 100.00 2 42 100.00 2.5 A. Night Differential B. Overtime C. Holiday Pay D. Holiday-Rest Day E. Rest Day Leaves 48 100.00 2 42 100.00 2.5 Other Leaves (Emergency, 46 95.83 4 42 100.00 2.5 Birthday, Bereavement, Relocation Etc.) Hospitalization 42 87.50 5 38 90.48 5 Bonuses 32 66.67 6.5 36 85.71 6 Retirement Plan 32 66.67 6.5 32 76.19 7.5 Allowances 28 58.33 8 31 73.81 9 Insurance Plan 26 54.17 10 32 76.19 7.5 Uniforms 27 56.25 9 27 64.29 10 Meal Subsidies 25 52.08 11 24 57.14 11.5 Productivity Incentives 15 31.25 13 20 47.62 13 Promotion 18 37.50 12 24 57.14 11.5 Signing Bonus 4 8.33 14 8 19.05 14
Minimum Number of 4 5 Economic Issues Maximum Number of 14 13 Economic Issues Average Number of 10 10 Economic Issues
4.2 Political Issues
Going over the specific political issues covered in the 90 CBAs, some noticeable trends exist. All (100%) contracts have a job security/security of tenure provision which includes the classification of employees, grounds and procedures for employee termination, and retrenchment of employees. The second most specified issue (90%) is the grievance procedure which defines the mechanism for the settlement of dispute and grievances arising from the interpretation and implementation of the terms of the CBA. The grievance machinery includes the definition and steps involved in the processing of grievance/s, who has the right to present the grievance to the company and who is supposed to respond to this; the number of days for the resolution of the complaint; and the voluntary arbitration procedure. A majority (87%) of the CBAs also defines the coverage/scope of the collective bargaining unit (CBU). It specifies the definition of the word “employee/s” and the coverage of the collective bargaining unit (CBU), usually of the regular rank-and-file employees, excluding those occupying “sensitive or confidential” positions, like the secretary to the GM/President, HRD assistant, assistant to the Controller. The union security issues are the fourth top priority (83%) in the negotiation. This section seeks to preserve and protect the union’s existence and effectiveness as an organization by ensuring its continued membership among CBU employees, and efficient collection of dues and other assessments. The common provision shown is either a maintenance of membership clause where employees are given the option to join the union or not, but once they join, they are required to continue their membership in good standing during the effectivity of the CBA. Another is the union shop security clause where employees must join the union within a specified period of time (usually 15-30 days from date of regularization), as a condition for their continued employment.
Surprisingly, only 82% of the reviewed contracts contains a provision on management prerogatives which emphasize the right of management to hire, transfer, promote, assess performance, and conduct job standardization. The sixth (6th) commonly included provision is the no strikes/lockouts clause. This section stipulates the obligations of the union with regards to when a strike could be initiated (e.g. on issues like union busting, and violation/s of CBA provisions). By the same token it also stipulates what management should follow regarding lockouts. The article on rights and responsibilities of parties is written in 71% of the CBAs. This article confirms the rights of management, recognizes the rights and privileges of the union and the obligations of both the union and management to implement in good faith the agreed terms & conditions of employment, and comply with all the other CBA provisions. The check off provision is guaranteed by 62% of the unions. This issue is concerned with the employer’s regular deduction from the employees’ salaries the amounts corresponding to their union dues, strike fund contributions, fines, agency fees, and other special assessments and remit these to the union.
The least stipulated political provisions are those related to labor-management council/committee (42%) and disciplinary measures (34%). The labor-management committee (or LMC) article specifies its objective to serve as a venue to solve problems affecting employees and management, and its mechanisms,
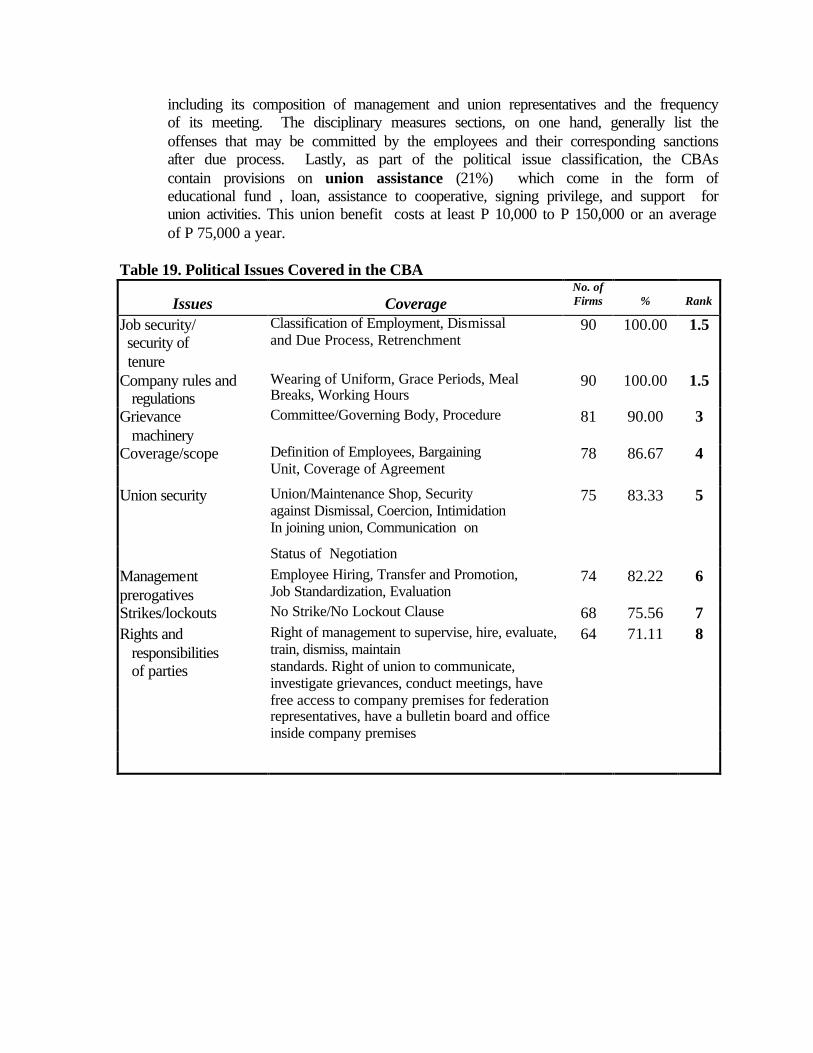
including its composition of management and union representatives and the frequency of its meeting. The disciplinary measures sections, on one hand, generally list the offenses that may be committed by the employees and their corresponding sanctions after due process. Lastly, as part of the political issue classification, the CBAs contain provisions on union assistance (21%) which come in the form of educational fund , loan, assistance to cooperative, signing privilege, and support for union activities. This union benefit costs at least P 10,000 to P 150,000 or an average of P 75,000 a year.
Table 19. Political Issues Covered in the CBA
Issues
Coverage No. of Firms
%
Rank
Job security/ security of tenure
Classification of Employment, Dismissal and Due Process, Retrenchment
90 100.00 1.5
Company rules and regulations
Wearing of Uniform, Grace Periods, Meal Breaks, Working Hours
90 100.00 1.5
Grievance machinery
Committee/Governing Body, Procedure 81 90.00 3
78 86.67 4 Coverage/scope Definition of Employees, Bargaining Unit, Coverage of Agreement Union/Maintenance Shop, Security against Dismissal, Coercion, Intimidation In joining union, Communication on
75 83.33 5 Union security
Status of Negotiation Management prerogatives
Employee Hiring, Transfer and Promotion, Job Standardization, Evaluation
74 82.22 6
Strikes/lockouts No Strike/No Lockout Clause 68 75.56 7 64 71.11 8
Rights and responsibilities of parties
Right of management to supervise, hire, evaluate, train, dismiss, maintain standards. Right of union to communicate, investigate grievances, conduct meetings, have free access to company premises for federation representatives, have a bulletin board and office inside company premises
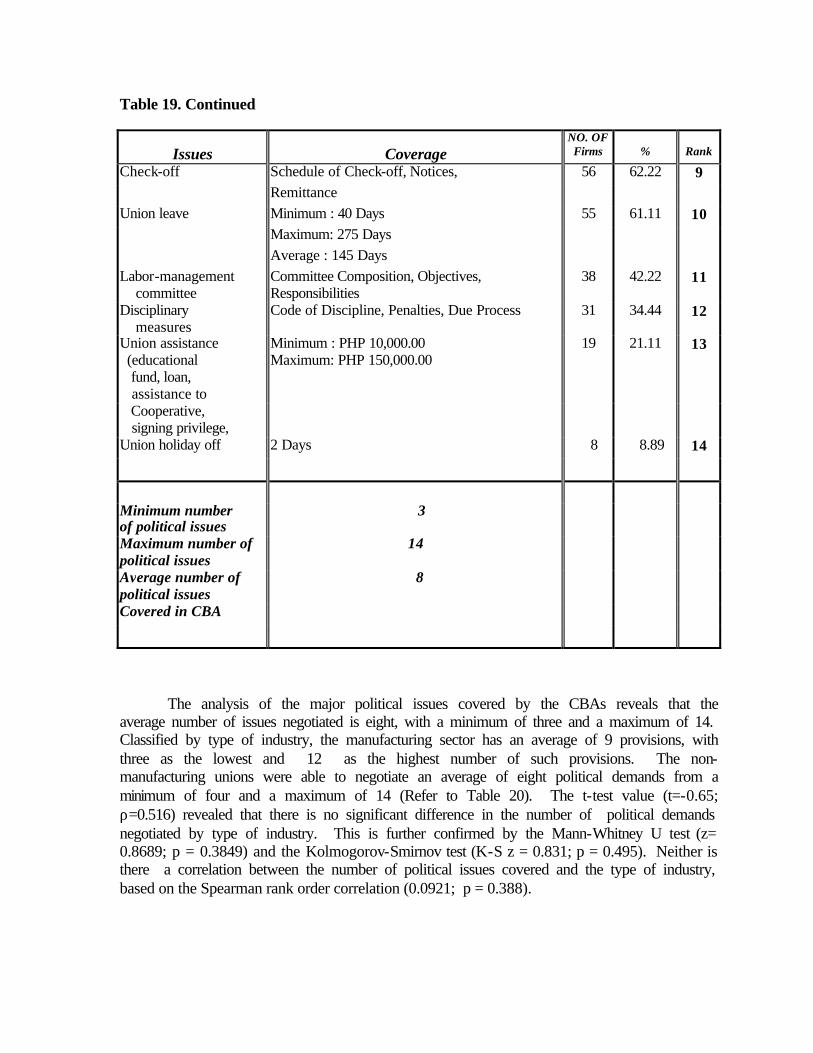
Table 19. Continued
Issues
Coverage
NO. OF Firms
%
Rank
Check-off Schedule of Check-off, Notices, 56 62.22 9 Remittance
Union leave Minimum : 40 Days 55 61.11 10 Maximum: 275 Days Average : 145 Days
Labor-management committee
Committee Composition, Objectives, Responsibilities
38 42.22 11
Disciplinary measures
Code of Discipline, Penalties, Due Process 31 34.44 12
Union assistance (educational fund, loan, assistance to
Minimum : PHP 10,000.00 Maximum: PHP 150,000.00
19 21.11 13
Cooperative, signing privilege,
Union holiday off 2 Days 8 8.89 14
Minimum number of political issues
3
Maximum number of political issues
14
Average number of political issues
8
Covered in CBA
The analysis of the major political issues covered by the CBAs reveals that the average number of issues negotiated is eight, with a minimum of three and a maximum of 14. Classified by type of industry, the manufacturing sector has an average of 9 provisions, with three as the lowest and 12 as the highest number of such provisions. The non-manufacturing unions were able to negotiate an average of eight political demands from a minimum of four and a maximum of 14 (Refer to Table 20). The t-test value (t=-0.65; ρ=0.516) revealed that there is no significant difference in the number of political demands negotiated by type of industry. This is further confirmed by the Mann-Whitney U test (z= 0.8689; p = 0.3849) and the Kolmogorov-Smirnov test (K-S z = 0.831; p = 0.495). Neither is there a correlation between the number of political issues covered and the type of industry, based on the Spearman rank order correlation (0.0921; p = 0.388).
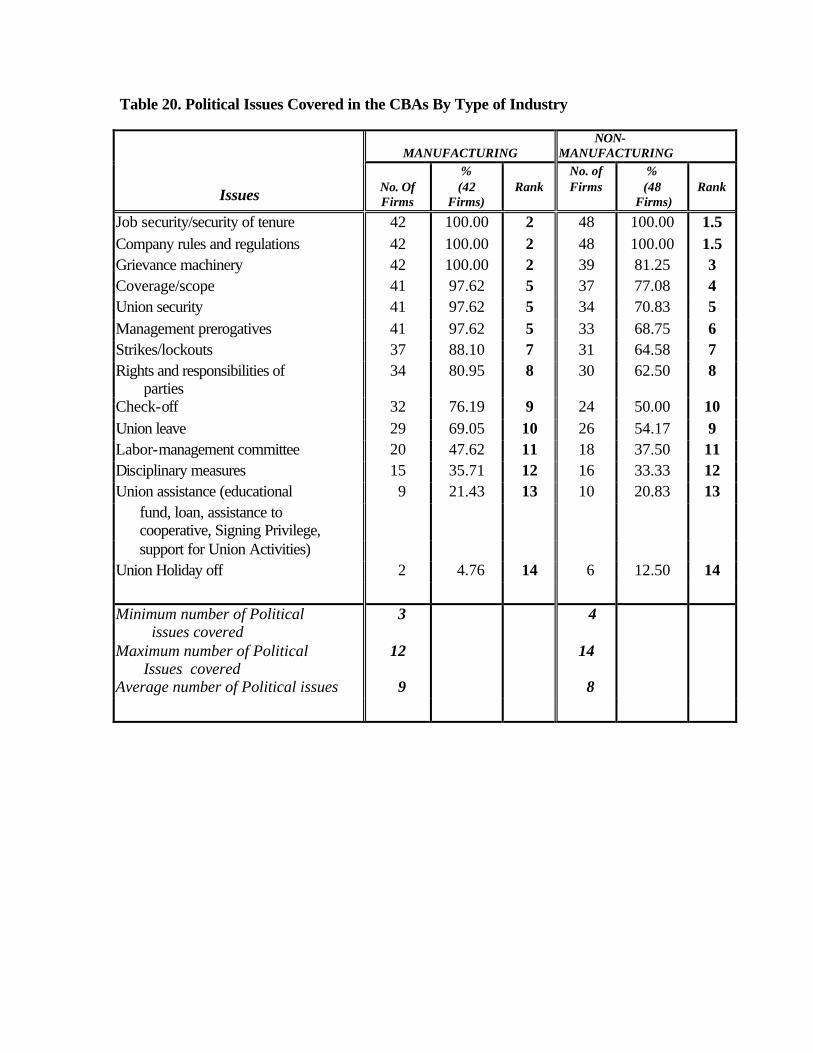
Table 20. Political Issues Covered in the CBAs By Type of Industry
MANUFACTURING
NON- MANUFACTURING
Issues
No. Of Firms
% (42
Firms)
Rank
No. of Firms
% (48
Firms)
Rank
Job security/security of tenure 42 100.00 2 48 100.00 1.5 Company rules and regulations 42 100.00 2 48 100.00 1.5 Grievance machinery 42 100.00 2 39 81.25 3 Coverage/scope 41 97.62 5 37 77.08 4 Union security 41 97.62 5 34 70.83 5 Management prerogatives 41 97.62 5 33 68.75 6 Strikes/lockouts 37 88.10 7 31 64.58 7 Rights and responsibilities of parties
34 80.95 8 30 62.50 8
Check-off 32 76.19 9 24 50.00 10 Union leave 29 69.05 10 26 54.17 9 Labor-management committee 20 47.62 11 18 37.50 11 Disciplinary measures 15 35.71 12 16 33.33 12 Union assistance (educational 9 21.43 13 10 20.83 13 fund, loan, assistance to cooperative, Signing Privilege,
support for Union Activities) Union Holiday off 2 4.76 14 6 12.50 14
Minimum number of Political issues covered
3 4
Maximum number of Political Issues covered
12 14
Average number of Political issues 9 8
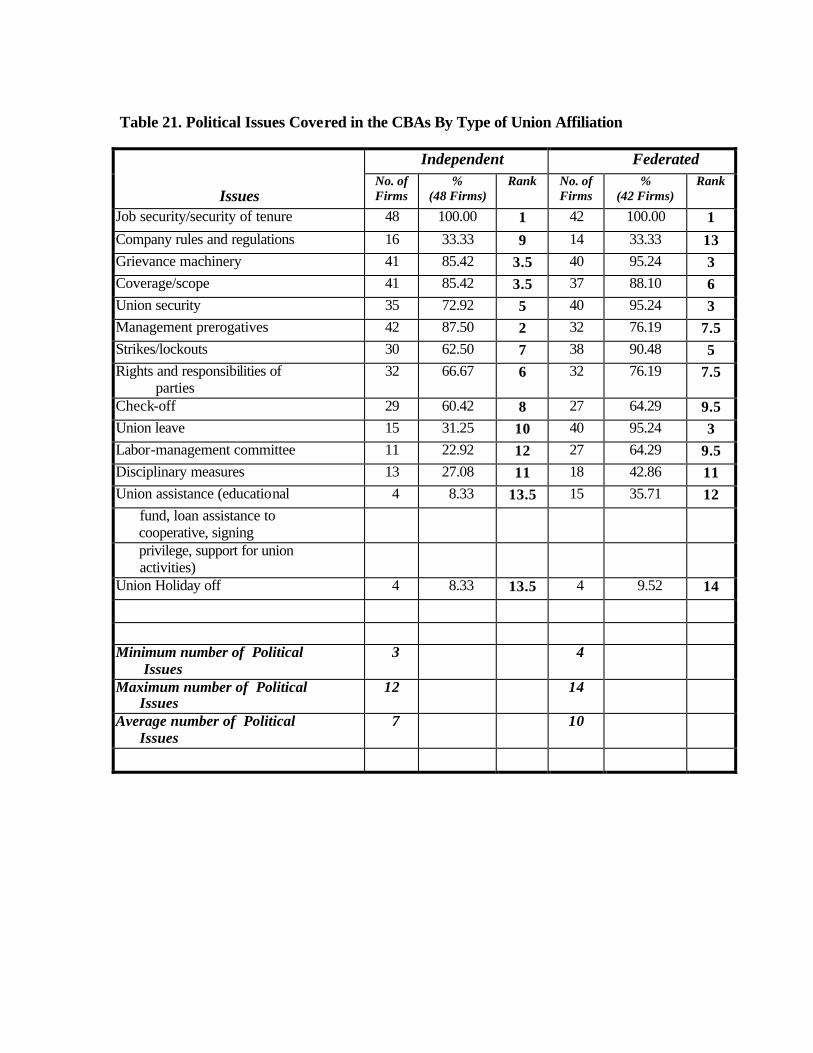
Table 21. Political Issues Covered in the CBAs By Type of Union Affiliation
Independent Federated
Issues No. of Firms
% (48 Firms)
Rank No. of Firms
% (42 Firms)
Rank
Job security/security of tenure 48 100.00 1 42 100.00 1 Company rules and regulations 16 33.33 9 14 33.33 13 Grievance machinery 41 85.42 3.5 40 95.24 3 Coverage/scope 41 85.42 3.5 37 88.10 6 Union security 35 72.92 5 40 95.24 3 Management prerogatives 42 87.50 2 32 76.19 7.5 Strikes/lockouts 30 62.50 7 38 90.48 5 Rights and responsibilities of parties
32 66.67 6 32 76.19 7.5
Check-off 29 60.42 8 27 64.29 9.5 Union leave 15 31.25 10 40 95.24 3 Labor-management committee 11 22.92 12 27 64.29 9.5 Disciplinary measures 13 27.08 11 18 42.86 11 Union assistance (educational 4 8.33 13.5 15 35.71 12 fund, loan assistance to cooperative, signing
privilege, support for union activities)
Union Holiday off 4 8.33 13.5 4 9.52 14
Minimum number of Political Issues
3 4
Maximum number of Political Issues
12 14
Average number of Political Issues
7 10
When analyzed by type of union affiliation, the independent unions only were able to secure in their CBAs an average of seven political demands, with a minimum three and as many as 12. On the other hand, the federated unions were able to bargain for a higher average of 10 political provisions with a minimum pegged at four and the maximum at 14. The t-test (t=-5.37; p = 0.000) , Mann- Whitney U test (z = -4.9118; p = 0.000), and Kolmogorov-Smirnov test (K-S z = 2.507; p = 0.000) computation results all indicate that there is a significant difference in the number of political issues negotiated by type of union affiliation. The Spearman rank order correlation value (0.5206; p = 0.000) verified that there is a significant relationship between the number of political issues bargained and the type of union affiliation. The information clearly illustrates that there are more political issues negotiated by federated unions compared to the independent unions, and 52% of the variability in the number of political provisions bargained is explained by the type of union affiliation. 6. Problems Encountered During CBA Negotiations
Mondy and Noe (1981) opined that diversity is probably the key characteristic of
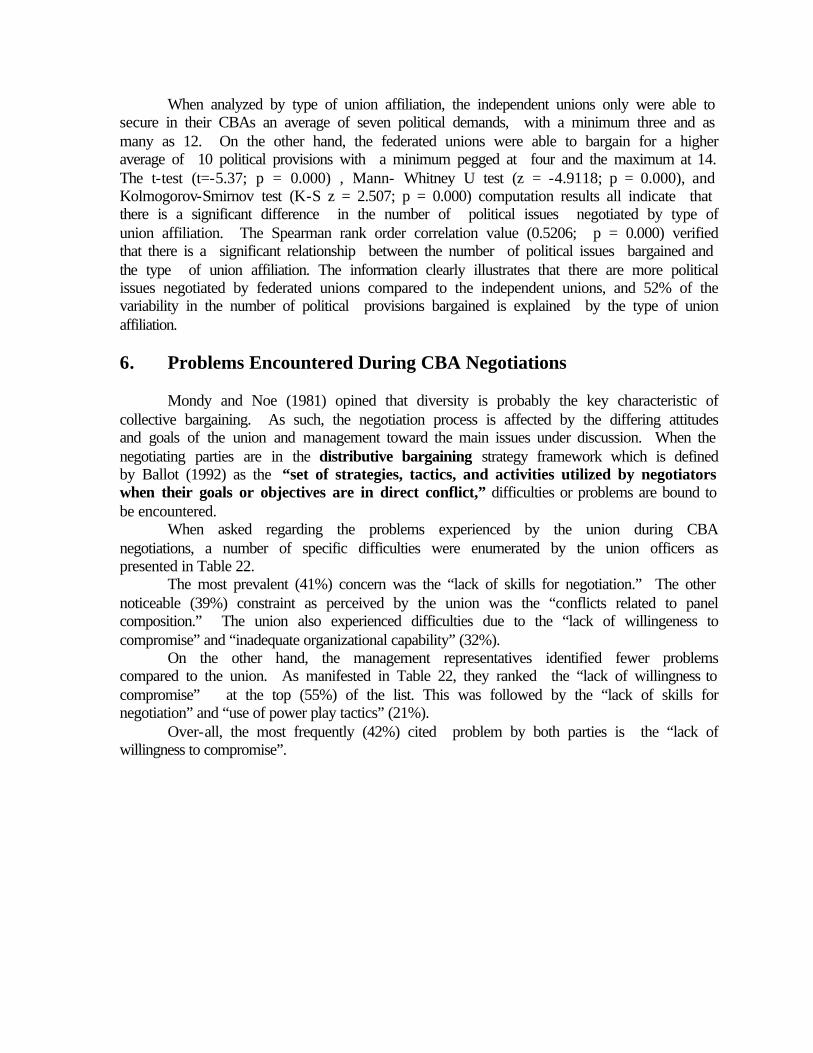
collective bargaining. As such, the negotiation process is affected by the differing attitudes and goals of the union and management toward the main issues under discussion. When the negotiating parties are in the distributive bargaining strategy framework which is defined by Ballot (1992) as the “set of strategies, tactics, and activities utilized by negotiators when their goals or objectives are in direct conflict,” difficulties or problems are bound to be encountered. When asked regarding the problems experienced by the union during CBA negotiations, a number of specific difficulties were enumerated by the union officers as presented in Table 22. The most prevalent (41%) concern was the “lack of skills for negotiation.” The other noticeable (39%) constraint as perceived by the union was the “conflicts related to panel composition.” The union also experienced difficulties due to the “lack of willingeness to compromise” and “inadequate organizational capability” (32%). On the other hand, the management representatives identified fewer problems compared to the union. As manifested in Table 22, they ranked the “lack of willingness to compromise” at the top (55%) of the list. This was followed by the “lack of skills for negotiation” and “use of power play tactics” (21%). Over-all, the most frequently (42%) cited problem by both parties is the “lack of willingness to compromise”.
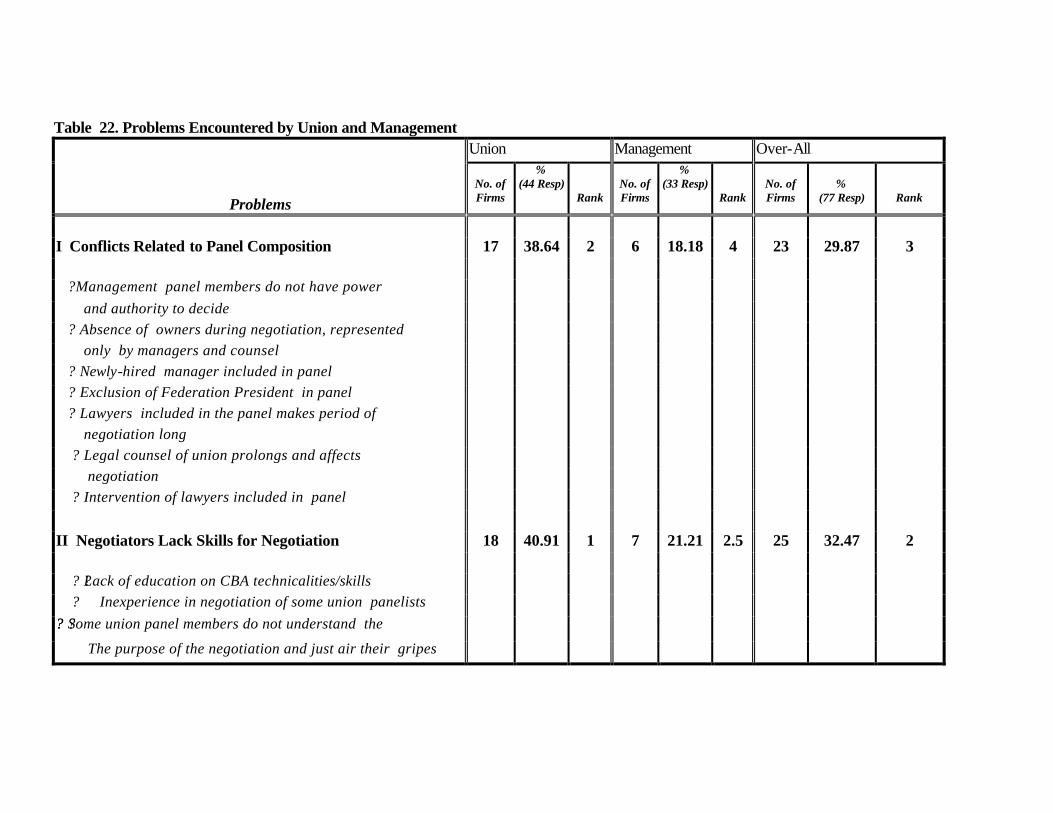
Table 22. Problems Encountered by Union and Management Union Management Over-All
Problems
No. of Firms
% (44 Resp)
Rank
No. of Firms
% (33 Resp)
Rank
No. of Firms
%
(77 Resp)
Rank
I Conflicts Related to Panel Composition 17 38.64 2 6 18.18 4 23 29.87 3
?Management panel members do not have power and authority to decide ? Absence of owners during negotiation, represented only by managers and counsel ? Newly-hired manager included in panel ? Exclusion of Federation President in panel ? Lawyers included in the panel makes period of negotiation long ? Legal counsel of union prolongs and affects negotiation ? Intervention of lawyers included in panel
II Negotiators Lack Skills for Negotiation 18 40.91 1 7 21.21 2.5 25 32.47 2
? ?Lack of education on CBA technicalities/skills ? Inexperience in negotiation of some union panelists ?? ?Some union panel members do not understand the The purpose of the negotiation and just air their gripes
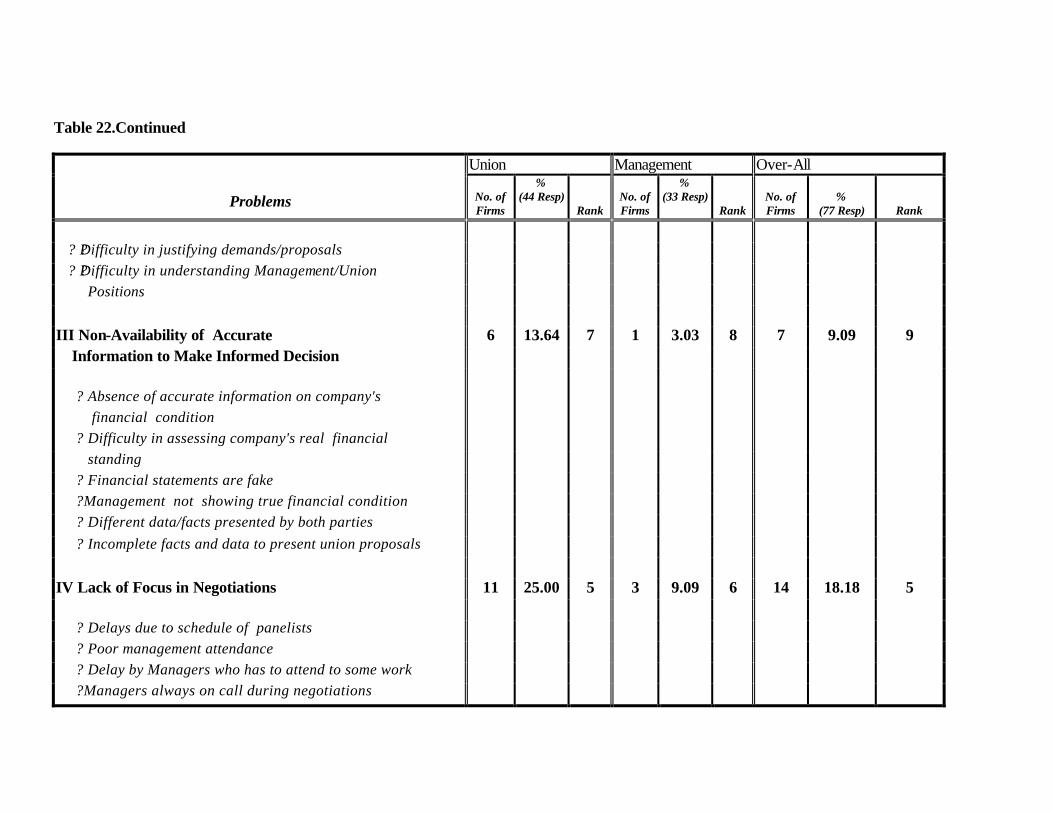
Table 22.Continued
Union Management Over-All
Problems
No. of Firms
% (44 Resp)
Rank
No. of Firms
% (33 Resp)
Rank
No. of Firms
%
(77 Resp)
Rank
? ?Difficulty in justifying demands/proposals ? ?Difficulty in understanding Management/Union Positions
III Non-Availability of Accurate 6 13.64 7 1 3.03 8 7 9.09 9 Information to Make Informed Decision
? Absence of accurate information on company's financial condition ? Difficulty in assessing company's real financial standing ? Financial statements are fake ?Management not showing true financial condition ? Different data/facts presented by both parties ? Incomplete facts and data to present union proposals
IV Lack of Focus in Negotiations 11 25.00 5 3 9.09 6 14 18.18 5
? Delays due to schedule of panelists ? Poor management attendance ? Delay by Managers who has to attend to some work ?Managers always on call during negotiations
Table 22.Continued
Union Management Over-All
Problems
No. of Firms
% (44 Resp)
Rank
No. of Firms
% (33 Resp)
Rank
No. of Firms
%
Rank
V Lack of Willingness to Compromise 14 31.82 3.5 18 54.55 1 32 41.56 1
? Closed mind of management ? Hardline attitude of management/union ? Hardline position of management/union ? No one wants to compromise ? Unreasonable proposals/counter proposals ? Disagreement on certain proposals
VI Economic Constraints During 5 11.36 8 4 12.12 5 9 11.69 8 Negotiations
? Company has poor financial condition due to crisis ? Difficult to bargain if the company is not doing well ? Wage orders declared during negotiations ? Peso devaluated resulting on loss - difficulty in explaining to union
VII Lack of Sincerity 10 22.73 6 10 12.99 7 ?Management uses delaying tactics ?Management is bluffing
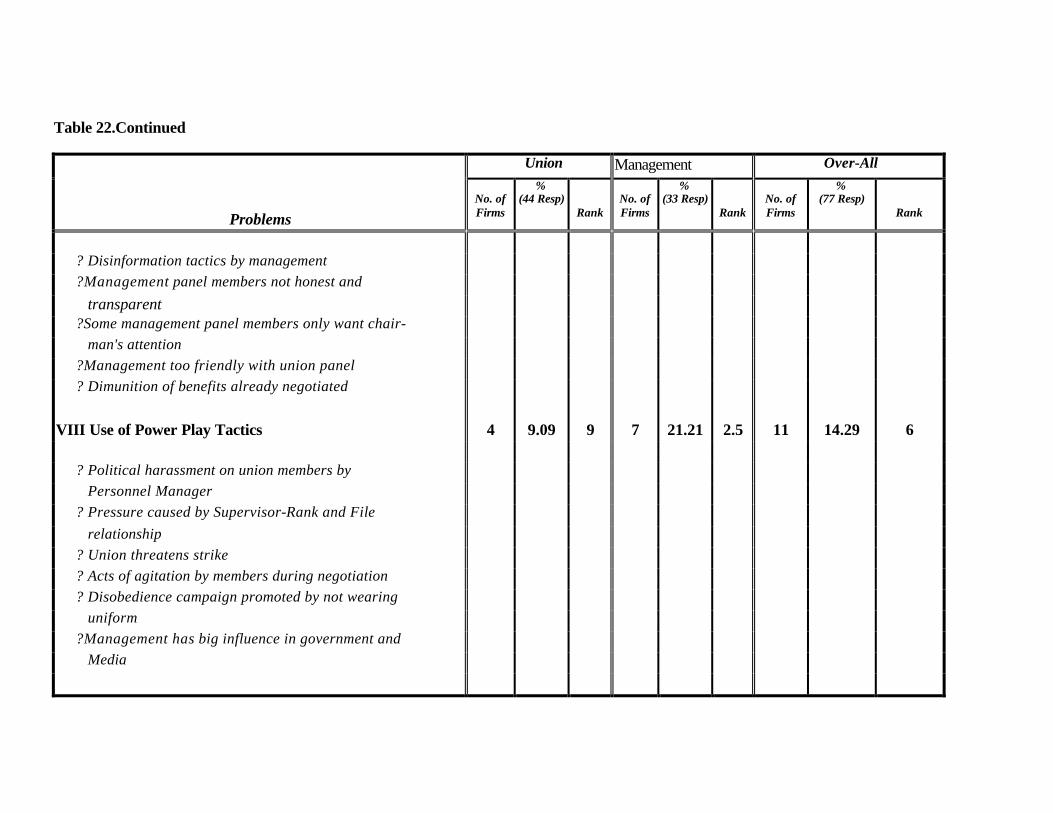
Table 22.Continued
Union Management Over-All
Problems
No. of Firms
% (44 Resp)
Rank
No. of Firms
% (33 Resp)
Rank
No. of Firms
% (77 Resp)
Rank
? Disinformation tactics by management ?Management panel members not honest and transparent ?Some management panel members only want chair- man's attention ?Management too friendly with union panel ? Dimunition of benefits already negotiated
VIII Use of Power Play Tactics 4 9.09 9 7 21.21 2.5 11 14.29 6
? Political harassment on union members by Personnel Manager ? Pressure caused by Supervisor-Rank and File relationship ? Union threatens strike ? Acts of agitation by members during negotiation ? Disobedience campaign promoted by not wearing uniform ?Management has big influence in government and Media
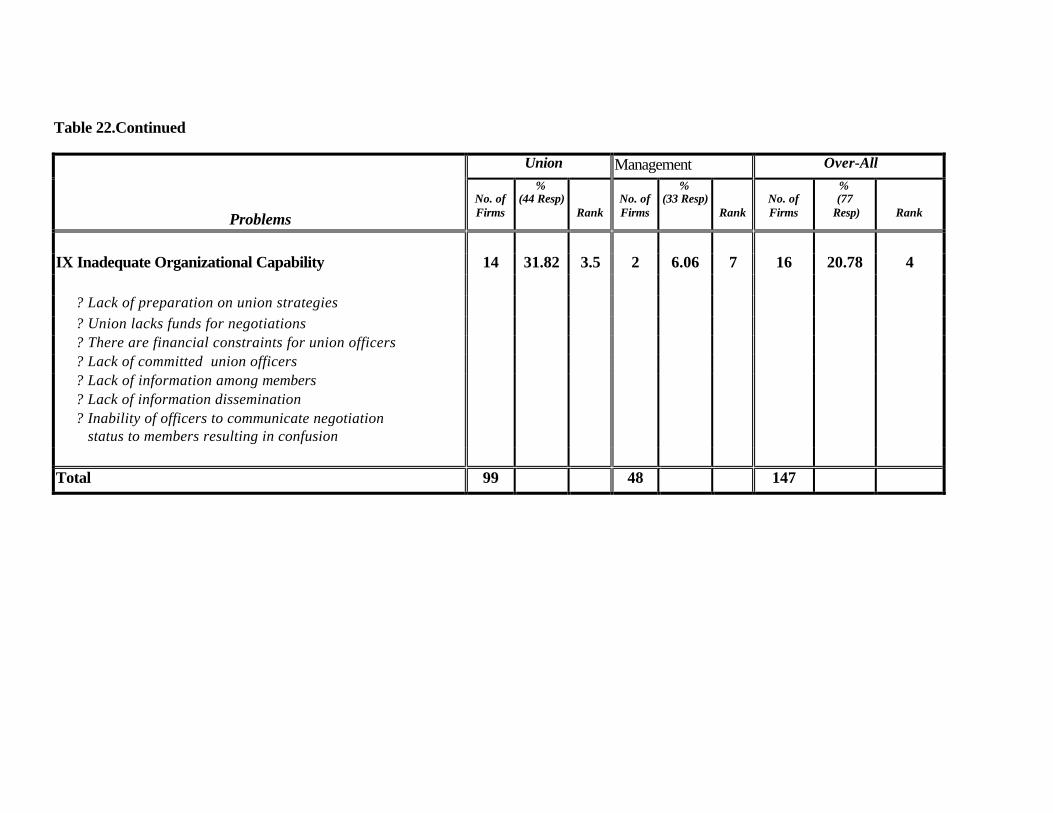
Table 22.Continued
Union Management Over-All
Problems
No. of Firms
% (44 Resp)
Rank
No. of Firms
% (33 Resp)
Rank
No. of Firms
% (77
Resp)
Rank
IX Inadequate Organizational Capability 14 31.82 3.5 2 6.06 7 16 20.78 4
? Lack of preparation on union strategies ? Union lacks funds for negotiations ? There are financial constraints for union officers ? Lack of committed union officers ? Lack of information among members ? Lack of information dissemination ? Inability of officers to communicate negotiation status to members resulting in confusion
Total 99 48 147
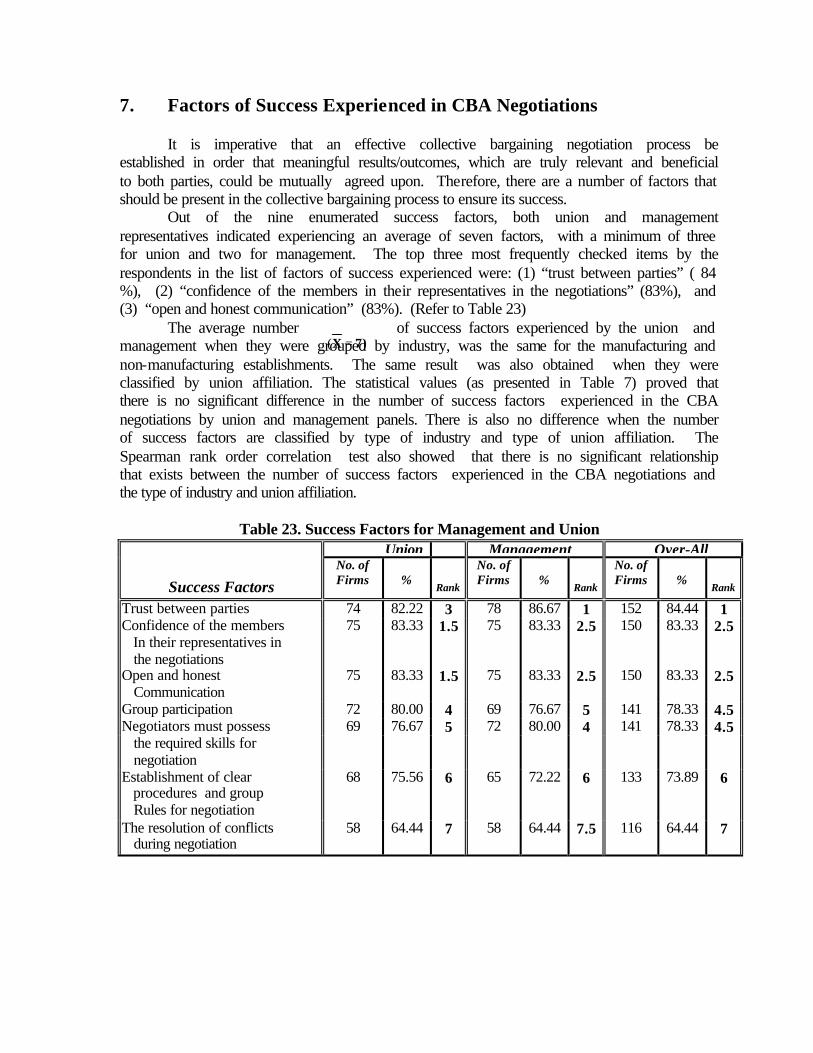
7. Factors of Success Experienced in CBA Negotiations It is imperative that an effective collective bargaining negotiation process be established in order that meaningful results/outcomes, which are truly relevant and beneficial to both parties, could be mutually agreed upon. Therefore, there are a number of factors that should be present in the collective bargaining process to ensure its success. Out of the nine enumerated success factors, both union and management representatives indicated experiencing an average of seven factors, with a minimum of three for union and two for management. The top three most frequently checked items by the respondents in the list of factors of success experienced were: (1) “trust between parties” ( 84 %), (2) “confidence of the members in their representatives in the negotiations” (83%), and (3) “open and honest communication” (83%). (Refer to Table 23)
The average number of success factors experienced by the union and management when they were grouped by industry, was the same for the manufacturing and non-manufacturing establishments. The same result was also obtained when they were classified by union affiliation. The statistical values (as presented in Table 7) proved that there is no significant difference in the number of success factors experienced in the CBA negotiations by union and management panels. There is also no difference when the number of success factors are classified by type of industry and type of union affiliation. The Spearman rank order correlation test also showed that there is no significant relationship that exists between the number of success factors experienced in the CBA negotiations and the type of industry and union affiliation.
Table 23. Success Factors for Management and Union Union Management Over-All
Success Factors
No. of Firms
%
Rank
No. of Firms
%
Rank
No. of Firms
%
Rank
Trust between parties 74 82.22 3 78 86.67 1 152 84.44 1 Confidence of the members 75 83.33 1.5 75 83.33 2.5 150 83.33 2.5 In their representatives in the negotiations
Open and honest Communication
75 83.33 1.5 75 83.33 2.5 150 83.33 2.5
Group participation 72 80.00 4 69 76.67 5 141 78.33 4.5 69 76.67 5 72 80.00 4 141 78.33 4.5 Negotiators must possess
the required skills for negotiation
Establishment of clear procedures and group Rules for negotiation
68 75.56 6 65 72.22 6 133 73.89 6
The resolution of conflicts during negotiation
58 64.44 7 58 64.44 7.5 116 64.44 7
)( 7X =
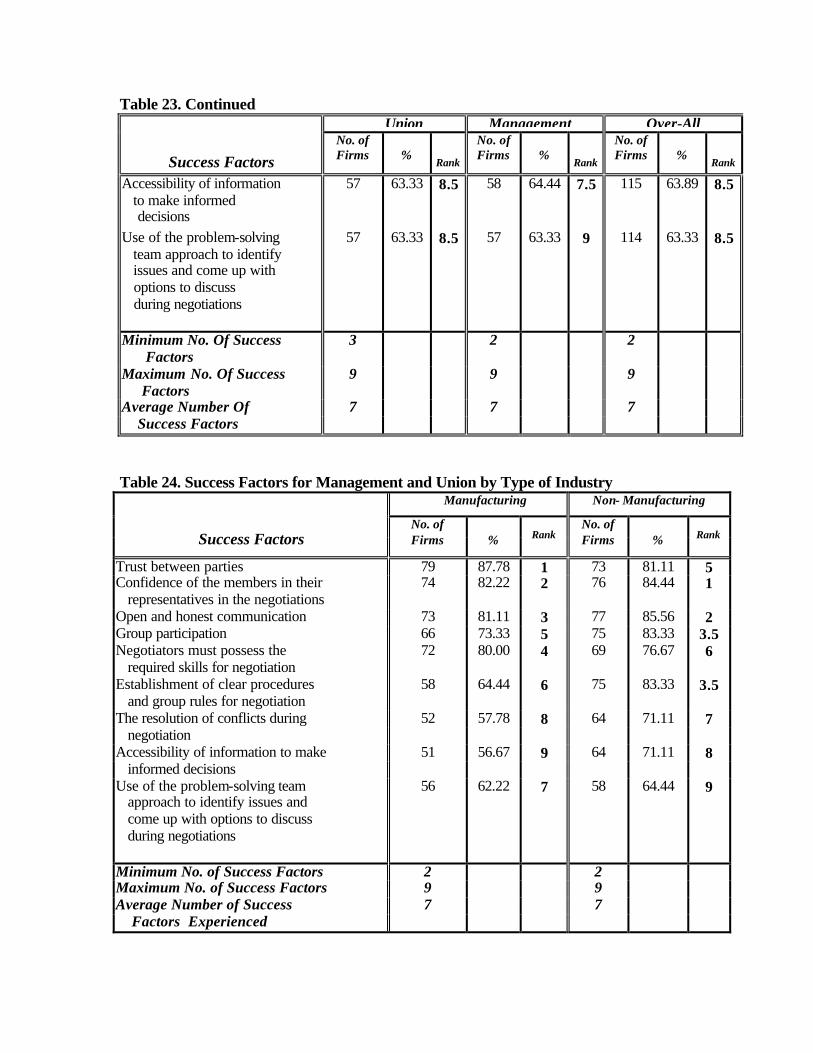
Table 23. Continued Union Management Over-All
Success Factors
No. of Firms
%
Rank
No. of Firms
%
Rank
No. of Firms
%
Rank
Accessibility of information to make informed decisions
57 63.33 8.5 58 64.44 7.5 115 63.89 8.5
Use of the problem-solving team approach to identify issues and come up with options to discuss during negotiations
57 63.33 8.5 57 63.33 9 114 63.33 8.5
Minimum No. Of Success Factors
3 2 2
Maximum No. Of Success Factors
9 9 9
Average Number Of 7 7 7 Success Factors Table 24. Success Factors for Management and Union by Type of Industry
Manufacturing Non- Manufacturing
Success Factors No. of Firms
%
Rank
No. of Firms
%
Rank
Trust between parties 79 87.78 1 73 81.11 5 Confidence of the members in their representatives in the negotiations
74 82.22 2 76 84.44 1
Open and honest communication 73 81.11 3 77 85.56 2 Group participation 66 73.33 5 75 83.33 3.5 Negotiators must possess the required skills for negotiation
72 80.00 4 69 76.67 6
Establishment of clear procedures and group rules for negotiation
58 64.44 6 75 83.33 3.5
52 57.78 8 64 71.11 7 The resolution of conflicts during negotiation
51 56.67 9 64 71.11 8 Accessibility of information to make informed decisions Use of the problem-solving team approach to identify issues and come up with options to discuss during negotiations
56 62.22 7 58 64.44 9
Minimum No. of Success Factors 2 2 Maximum No. of Success Factors 9 9 Average Number of Success 7 7 Factors Experienced
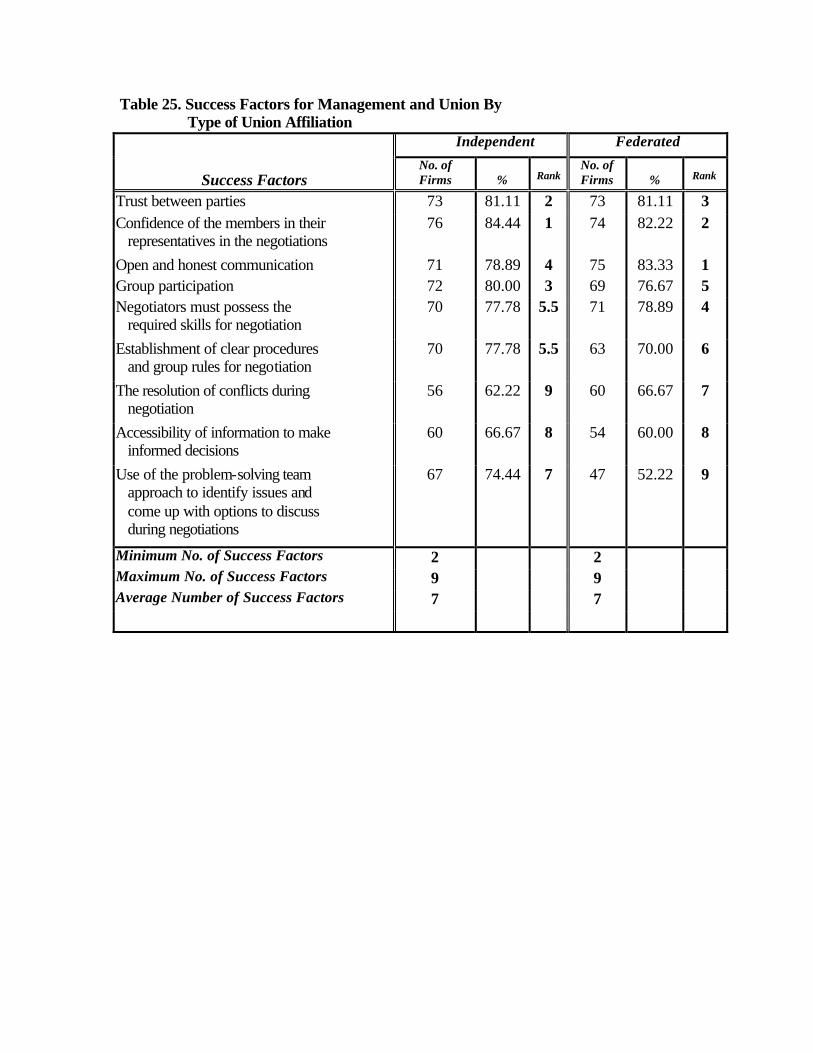
Table 25. Success Factors for Management and Union By Type of Union Affiliation
Independent Federated
Success Factors No. of Firms
%
Rank
No. of Firms
%
Rank
Trust between parties 73 81.11 2 73 81.11 3 Confidence of the members in their representatives in the negotiations
76 84.44 1 74 82.22 2
Open and honest communication 71 78.89 4 75 83.33 1 Group participation 72 80.00 3 69 76.67 5 Negotiators must possess the required skills for negotiation
70 77.78 5.5 71 78.89 4
Establishment of clear procedures and group rules for negotiation
70 77.78 5.5 63 70.00 6
The resolution of conflicts during negotiation
56 62.22 9 60 66.67 7
Accessibility of information to make informed decisions
60 66.67 8 54 60.00 8
Use of the problem-solving team approach to identify issues and come up with options to discuss during negotiations
67 74.44 7 47 52.22 9
Minimum No. of Success Factors 2 2 Maximum No. of Success Factors 9 9 Average Number of Success Factors 7 7
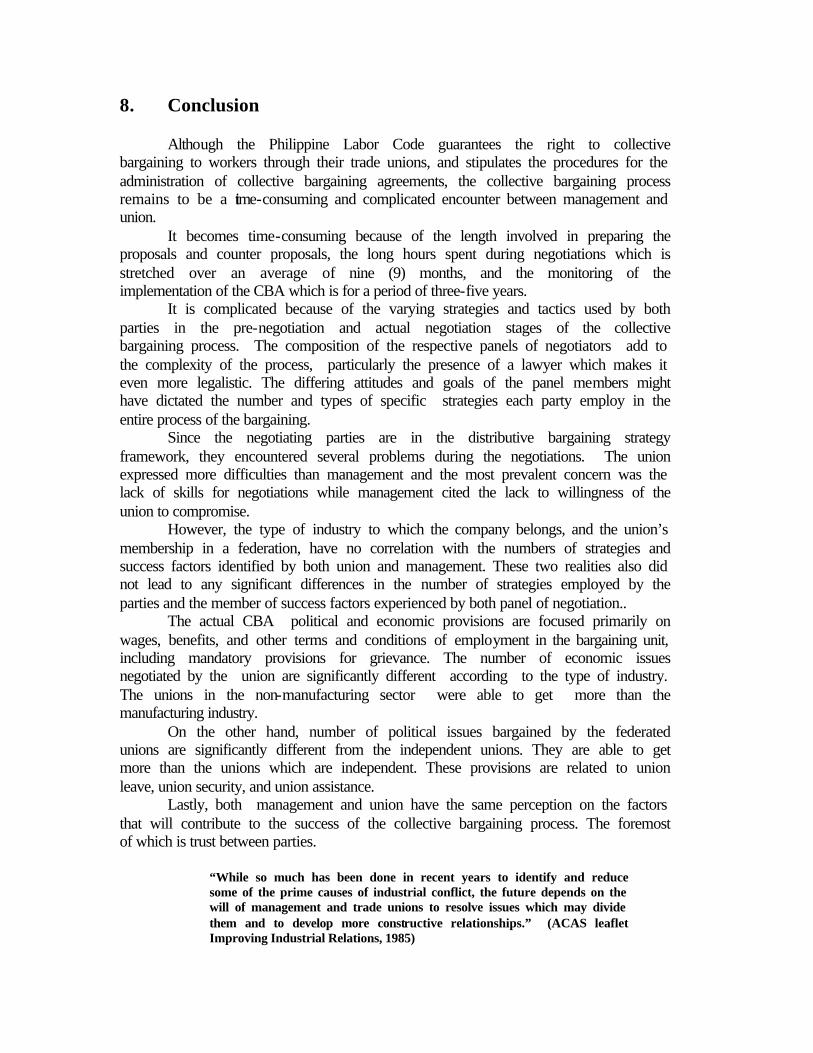
8. Conclusion Although the Philippine Labor Code guarantees the right to collective bargaining to workers through their trade unions, and stipulates the procedures for the administration of collective bargaining agreements, the collective bargaining process remains to be a time-consuming and complicated encounter between management and union.
It becomes time-consuming because of the length involved in preparing the proposals and counter proposals, the long hours spent during negotiations which is stretched over an average of nine (9) months, and the monitoring of the implementation of the CBA which is for a period of three-five years.
It is complicated because of the varying strategies and tactics used by both parties in the pre-negotiation and actual negotiation stages of the collective bargaining process. The composition of the respective panels of negotiators add to the complexity of the process, particularly the presence of a lawyer which makes it even more legalistic. The differing attitudes and goals of the panel members might have dictated the number and types of specific strategies each party employ in the entire process of the bargaining.
Since the negotiating parties are in the distributive bargaining strategy framework, they encountered several problems during the negotiations. The union expressed more difficulties than management and the most prevalent concern was the lack of skills for negotiations while management cited the lack to willingness of the union to compromise.
However, the type of industry to which the company belongs, and the union’s membership in a federation, have no correlation with the numbers of strategies and success factors identified by both union and management. These two realities also did not lead to any significant differences in the number of strategies employed by the parties and the member of success factors experienced by both panel of negotiation..
The actual CBA political and economic provisions are focused primarily on wages, benefits, and other terms and conditions of employment in the bargaining unit, including mandatory provisions for grievance. The number of economic issues negotiated by the union are significantly different according to the type of industry. The unions in the non-manufacturing sector were able to get more than the manufacturing industry.
On the other hand, number of political issues bargained by the federated unions are significantly different from the independent unions. They are able to get more than the unions which are independent. These provisions are related to union leave, union security, and union assistance.
Lastly, both management and union have the same perception on the factors that will contribute to the success of the collective bargaining process. The foremost of which is trust between parties.
“While so much has been done in recent years to identify and reduce some of the prime causes of industrial conflict, the future depends on the will of management and trade unions to resolve issues which may divide them and to develop more constructive relationships.” (ACAS leaflet Improving Industrial Relations, 1985)
References Allen, S. and Clark, R. (1986). “Union, pension, wealth, and age compensation profit.”,
Industrial and Labor Relation Review. Ballot, M. (1996). Labor-management relations in a changing environment. New York:
John Wiley & Sons, Inc. pp61-169 Byars, L. L. and Rue, L.W. (1994). Human resource management, (4th ed.) Illinois: Irwin Bureau of Labor and Employment Statistics. (1996). Current Labor Statistics: July-August. Cascio, W.F. (1992). Managing Human Resources (3rd ed.) Dejillas, L. (1994). Trade union behavior in the Philippines 1946-1990. Quezon City:
Ateneo de Manila University Press. Dessler, G. (1997). Human Resource Management. (7th ed.) Erickson, C. (1996). “A re-interpretation of pattern bargaining. Industrial and Labor
Relations Review, Vol. 49. Issue 4. P615 Flippo, E.. (1984). Personnel Management, (6th ed.). New York: McGraw-Hill Book Co. Foz, V.. (1998). The labor code of the Philippines and its implementing rules and
regulations. (ed). Quezon City: Philippine Law Gazette. pp 41-43. Hoxie, R. (1986). The economic program of trade unions. (Reprinted in Trade Unions, ed.).
W.E.J. McMarthy. pp 35-46. International Labor Organization (1982). Wages: A worker’s education manual. Geneva:
International labor Organization. Ivancevich, J. (1992). Human resource management - Foundation of personnel (5th ed.). Kast, F. and Rosenweig, J. (1974). Organization and management (2nd ed.). New York:
McGraw Hill Book Company. pp106-111 Kilberg, William. (1990). “How we pay people” American Enterprise. Macalinao, D. (1981). Organizational effectiveness of labor unions in selected hotels and
restaurants. Quezon City: U.P. unpublished masteral thesis. McConville, B. (1986). The role of trade unions. London: Macdonald & Co. Ltd. Monthly Labor Review. (1996). Bargaining outlook for 1996.
Personnel Journal. (1996). Labor adversaries bury the hatchet . Milkovich, G.T. and Newman, J.M. (1990). Compensation (3rd ed.). Homewood, Illinois
: Irwin. Mondy, W. and Noe, R. (1996). Human resource management (6th ed.). New Jersey:
Prentice-Hall Int’l Inc. p462-530. ___________________. (1981). Personnel: The management of human resources. Boston:
Allyn and Bacon, Inc. pp406-430. Patrick, D.C. Successful nonadversarial collective bargaining practices. Dissertation
Abstracts International. Volume: 55-11, Sec.: A, p:3952. Robert S. (1979). “Are unions an anachronism?” Haward Business Review. Scarth, Gary N. (1996). A case study analysis of the transition from adhersarial to
cooperative collective bargaining. Dissertation Abstracts International. Volume: 55-04, Section: A, page: 0824.