Embed Size (px)
Citation preview
Page 1 Collective Bargaining Highlights June 2013
Collective Bargaining HighlightsJune 2013
In This Issue Page
Agreements Settled in June 1Wage Settlements 2Wage Trends by Sector 3June Settlements 4 - 5Selected Settlement Summaries 6Major Negotiations Underway 18Consumer Price Index 18
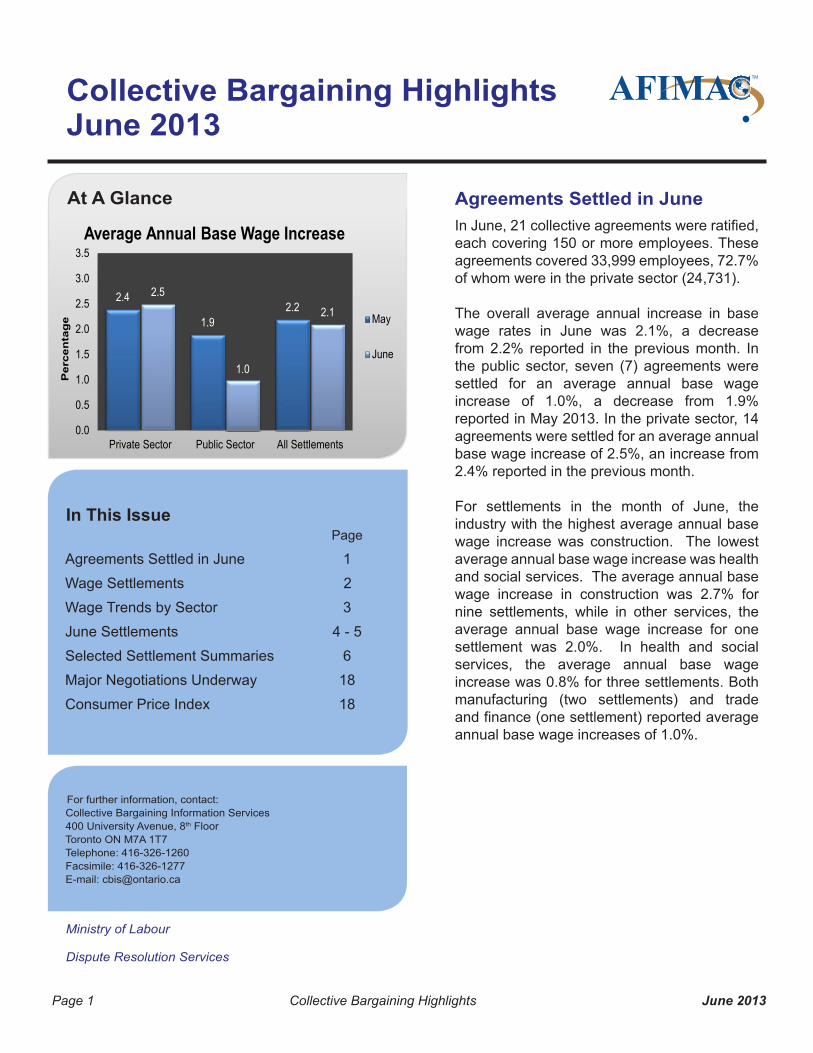
Agreements Settled in June
each covering 150 or more employees. These agreements covered 33,999 employees, 72.7% of whom were in the private sector (24,731).
The overall average annual increase in base wage rates in June was 2.1%, a decrease from 2.2% reported in the previous month. In the public sector, seven (7) agreements were settled for an average annual base wage increase of 1.0%, a decrease from 1.9% reported in May 2013. In the private sector, 14 agreements were settled for an average annual base wage increase of 2.5%, an increase from 2.4% reported in the previous month.
For settlements in the month of June, the industry with the highest average annual base wage increase was construction. The lowest average annual base wage increase was health and social services. The average annual base wage increase in construction was 2.7% for nine settlements, while in other services, the average annual base wage increase for one settlement was 2.0%. In health and social services, the average annual base wage increase was 0.8% for three settlements. Both manufacturing (two settlements) and trade
annual base wage increases of 1.0%.
2.4
1.92.2
2.5
1.0
2.1
0.0
0.5
1.0
1.5
2.0
2.5
3.0
3.5
Private Sector Public Sector All Settlements
Per
cen
tag
e
Average Annual Base Wage Increase
May
June
For further information, contact: Collective Bargaining Information Services 400 University Avenue, 8th Floor Toronto ON M7A 1T7 Telephone: 416-326-1260 Facsimile: 416-326-1277 E-mail: [email protected]
Ministry of Labour
Dispute Resolution Services
At A Glance

Page 2 Collective Bargaining Highlights June 2013
Table 1: Wage Settlements Current Month, Current Three YearsJUNE ANNUAL
Agmts
EmplsAverage Annual
Increase 2011 2012Jan - Jun
2013
% % %
Private Sector 14 24,731 2.5 1.9 1.2 2.4
Public Sector 7 9,268 1.0 1.6 1.4 0.2
All Settlements 21 33,999 2.1 1.7 1.3 0.9
Table 2: Wage Settlements by Industry, Current Month, Current Three YearsJUNE ANNUAL
Agmts
EmplsAverage Annual
Increase 2011 2012Jan - Jun
2013Industries % % %
Primary 1 400 1.7 3.3 2.5 2.1Manufacturing 2 1,020 1.0 1.4 0.8 1.3Construction 9 18,220 2.7 1.3 1.9 2.6
Trade and Finance 1 6,918 1.0 1.3 1.0 1.4Transportation,Communications & Utilities 1 4,901 1.8 2.6 1.9 1.9Public Administration 3 964 1.5 2.2 1.4 0.5Education & Related Services - - - 1.8 1.2 0.0Health & Social Services 3 1,386 0.8 1.2 1.1 1.5Other Services 1 190 2.0 2.2 1.7 2.1All Settlements 21 33,999 2.1 1.7 1.3 0.9
Wage Settlements - June
Page 3 Collective Bargaining Highlights June 2013
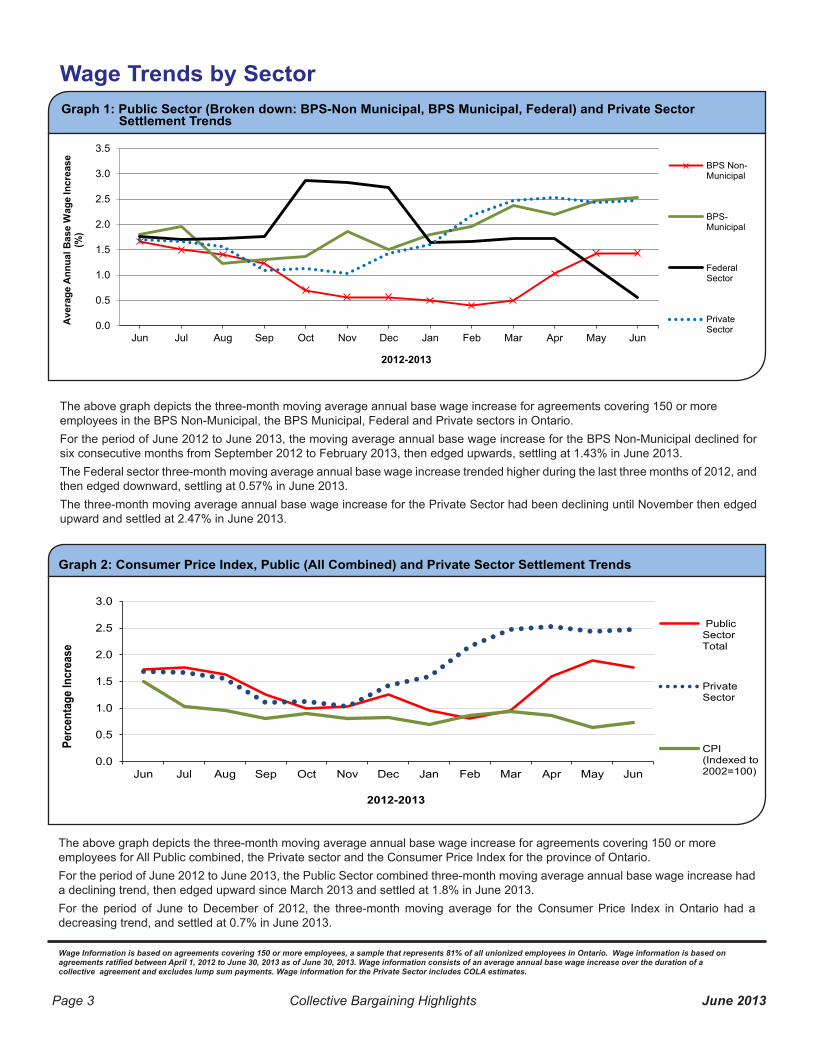
Graph 1: Public Sector (Broken down: BPS-Non Municipal, BPS Municipal, Federal) and Private Sector Settlement Trends
0.0
0.5
1.0
1.5
2.0
2.5
3.0
3.5
Jun Jul Aug Sep Oct Nov Dec Jan Feb Mar Apr May Jun
Ave
rage
Ann
ual B
ase
Wag
e In
crea
se
(%)
2012-2013
BPS Non-Municipal
BPS-Municipal
FederalSector
PrivateSector
The above graph depicts the three-month moving average annual base wage increase for agreements covering 150 or more employees in the BPS Non-Municipal, the BPS Municipal, Federal and Private sectors in Ontario. For the period of June 2012 to June 2013, the moving average annual base wage increase for the BPS Non-Municipal declined for six consecutive months from September 2012 to February 2013, then edged upwards, settling at 1.43% in June 2013. The Federal sector three-month moving average annual base wage increase trended higher during the last three months of 2012, and then edged downward, settling at 0.57% in June 2013.The three-month moving average annual base wage increase for the Private Sector had been declining until November then edged upward and settled at 2.47% in June 2013.
Graph 2: Consumer Price Index, Public (All Combined) and Private Sector Settlement Trends
Wage Information is based on agreements covering 150 or more employees, a sample that represents 81% of all unionized employees in Ontario. Wage information is based on
The above graph depicts the three-month moving average annual base wage increase for agreements covering 150 or more employees for All Public combined, the Private sector and the Consumer Price Index for the province of Ontario.For the period of June 2012 to June 2013, the Public Sector combined three-month moving average annual base wage increase had a declining trend, then edged upward since March 2013 and settled at 1.8% in June 2013.For the period of June to December of 2012, the three-month moving average for the Consumer Price Index in Ontario had a decreasing trend, and settled at 0.7% in June 2013.
Wage Trends by Sector
0.0
0.5
1.0
1.5
2.0
2.5
3.0
Jun Jul Aug Sep Oct Nov Dec Jan Feb Mar Apr May Jun
Perc
enta
ge In
crea
se
2012-2013
PublicSectorTotal
PrivateSector
CPI(Indexed to2002=100)
Page 4 Collective Bargaining Highlights June 2013
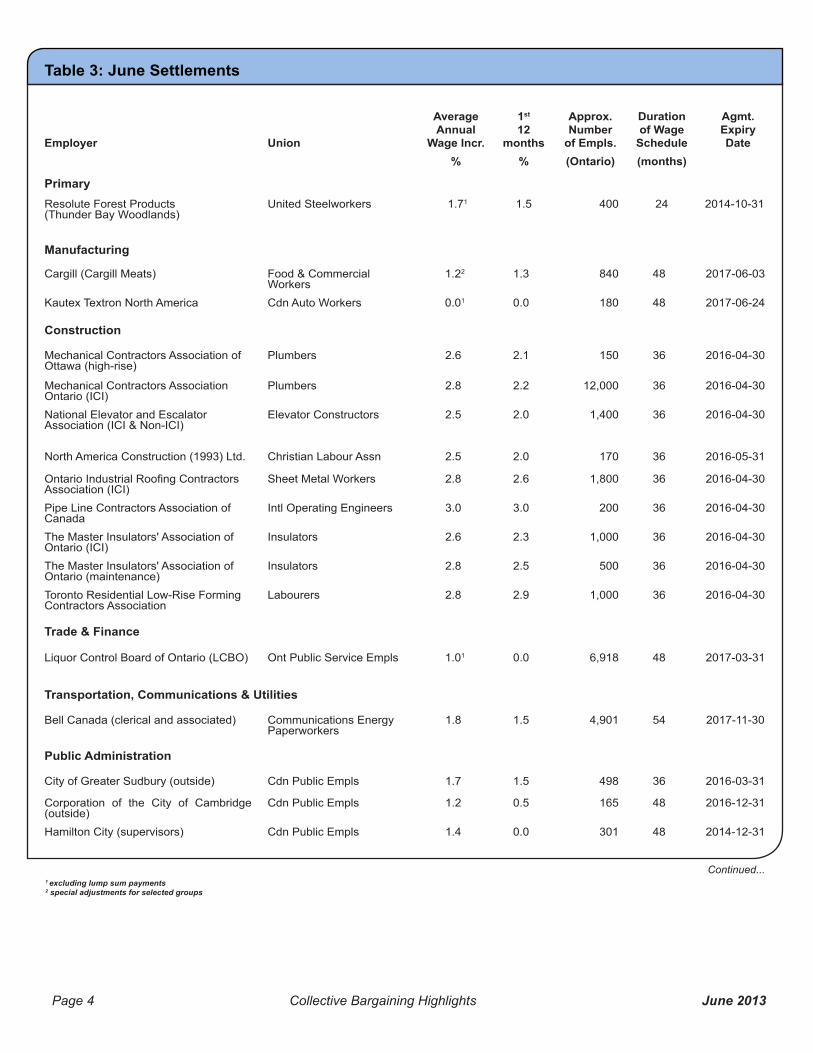
Table 3: June Settlements
1 excluding lump sum payments2 special adjustments for selected groups
Continued...
Employer Union
Average Annual
Wage Incr.
1st 12
months
Approx. Number
of Empls.
Duration of Wage
Schedule
Agmt.ExpiryDate
% % (Ontario) (months)
PrimaryResolute Forest Products (Thunder Bay Woodlands)
United Steelworkers 1.71 1.5 400 24 2014-10-31
Manufacturing
Cargill (Cargill Meats) Food & Commercial Workers
1.22 1.3 840 48 2017-06-03
Kautex Textron North America Cdn Auto Workers 0.01 0.0 180 48 2017-06-24
Construction
Mechanical Contractors Association of Ottawa (high-rise)
Plumbers 2.6 2.1 150 36 2016-04-30
Mechanical Contractors Association Ontario (ICI)
Plumbers 2.8 2.2 12,000 36 2016-04-30
National Elevator and Escalator Association (ICI & Non-ICI)
Elevator Constructors 2.5 2.0 1,400 36 2016-04-30
North America Construction (1993) Ltd. Christian Labour Assn 2.5 2.0 170 36 2016-05-31
Association (ICI)Sheet Metal Workers 2.8 2.6 1,800 36 2016-04-30
Pipe Line Contractors Association of Canada
Intl Operating Engineers 3.0 3.0 200 36 2016-04-30
The Master Insulators' Association of Ontario (ICI)
Insulators 2.6 2.3 1,000 36 2016-04-30
The Master Insulators' Association of Ontario (maintenance)
Insulators 2.8 2.5 500 36 2016-04-30
Toronto Residential Low-Rise Forming Contractors Association
Labourers 2.8 2.9 1,000 36 2016-04-30
Trade & Finance
Liquor Control Board of Ontario (LCBO) Ont Public Service Empls 1.01 0.0 6,918 48 2017-03-31
Transportation, Communications & Utilities
Bell Canada (clerical and associated) Communications Energy Paperworkers
1.8 1.5 4,901 54 2017-11-30
Public Administration
City of Greater Sudbury (outside) Cdn Public Empls 1.7 1.5 498 36 2016-03-31
Corporation of the City of Cambridge (outside)
Cdn Public Empls 1.2 0.5 165 48 2016-12-31
Hamilton City (supervisors) Cdn Public Empls 1.4 0.0 301 48 2014-12-31
Page 5 Collective Bargaining Highlights June 2013
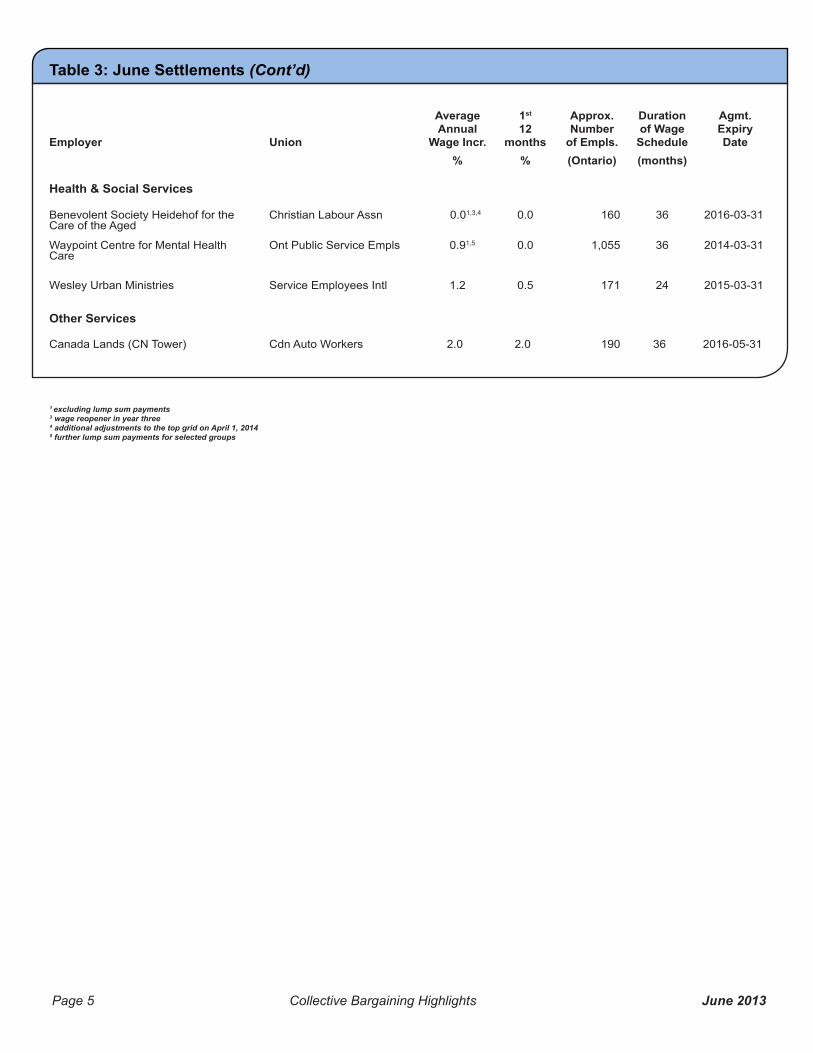
Table 3: June Settlements (Cont’d)
Employer Union
Average Annual
Wage Incr.
1st 12
months
Approx. Number
of Empls.
Duration of Wage
Schedule
Agmt.ExpiryDate
% % (Ontario) (months)
Health & Social Services
Benevolent Society Heidehof for the Care of the Aged
Christian Labour Assn 0.01,3,4 0.0 160 36 2016-03-31
Waypoint Centre for Mental Health Care
Ont Public Service Empls 0.91,5 0.0 1,055 36 2014-03-31
Wesley Urban Ministries Service Employees Intl 1.2 0.5 171 24 2015-03-31
Other Services
Canada Lands (CN Tower) Cdn Auto Workers 2.0 2.0 190 36 2016-05-31
1 excluding lump sum payments3
4
5 further lump sum payments for selected groups
Page 6 Collective Bargaining Highlights June 2013
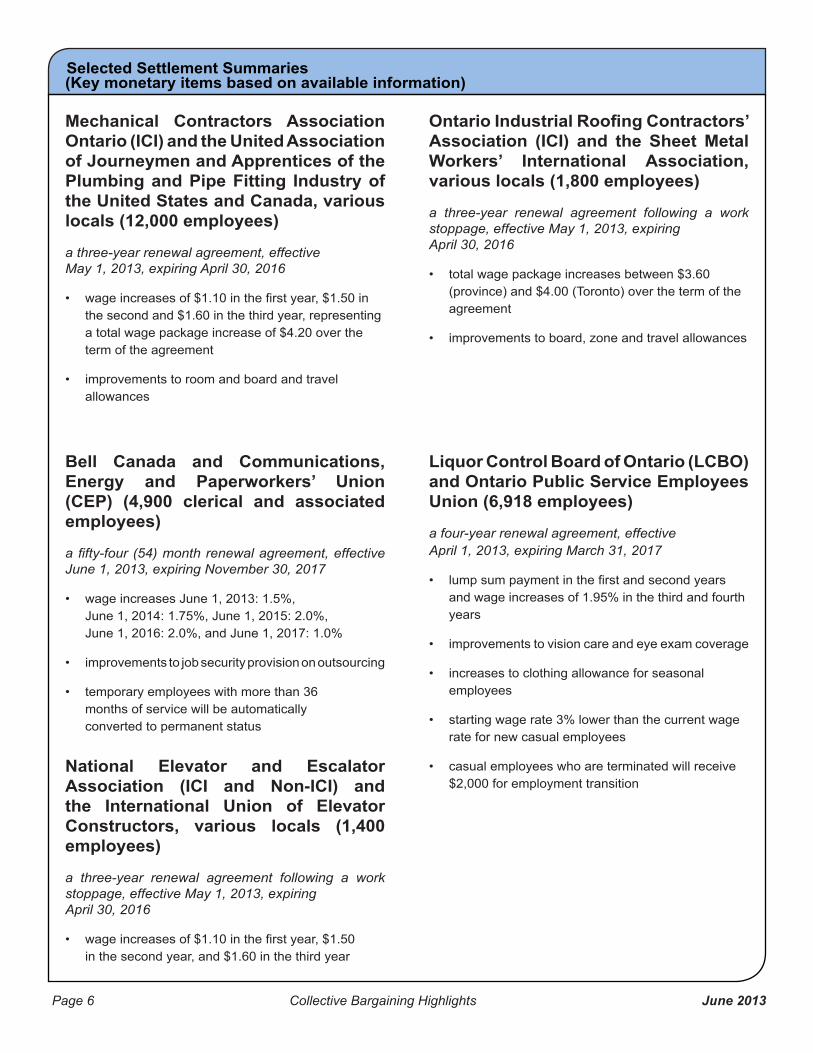
Selected Settlement Summaries(Key monetary items based on available information)
Mechanical Contractors Association Ontario (ICI) and the United Association of Journeymen and Apprentices of the Plumbing and Pipe Fitting Industry of the United States and Canada, various locals (12,000 employees)
a three-year renewal agreement, effective May 1, 2013, expiring April 30, 2016
the second and $1.60 in the third year, representing a total wage package increase of $4.20 over the term of the agreement
improvements to room and board and travel allowances
Bell Canada and Communications, Energy and Paperworkers’ Union (CEP) (4,900 clerical and associated employees)
June 1, 2013, expiring November 30, 2017
wage increases June 1, 2013: 1.5%, June 1, 2014: 1.75%, June 1, 2015: 2.0%, June 1, 2016: 2.0%, and June 1, 2017: 1.0%
improvements to job security provision on outsourcing
temporary employees with more than 36 months of service will be automatically converted to permanent status
National Elevator and Escalator Association (ICI and Non-ICI) and the International Union of Elevator Constructors, various locals (1,400 employees)
a three-year renewal agreement following a work stoppage, effective May 1, 2013, expiring April 30, 2016
in the second year, and $1.60 in the third year
Association (ICI) and the Sheet Metal Workers’ International Association, various locals (1,800 employees)
a three-year renewal agreement following a work stoppage, effective May 1, 2013, expiring April 30, 2016
total wage package increases between $3.60 (province) and $4.00 (Toronto) over the term of the agreement
improvements to board, zone and travel allowances
Liquor Control Board of Ontario (LCBO) and Ontario Public Service Employees Union (6,918 employees)
a four-year renewal agreement, effective April 1, 2013, expiring March 31, 2017
and wage increases of 1.95% in the third and fourth years
improvements to vision care and eye exam coverage
increases to clothing allowance for seasonal employees
starting wage rate 3% lower than the current wage rate for new casual employees
casual employees who are terminated will receive $2,000 for employment transition

Page 7 Collective Bargaining Highlights June 2013
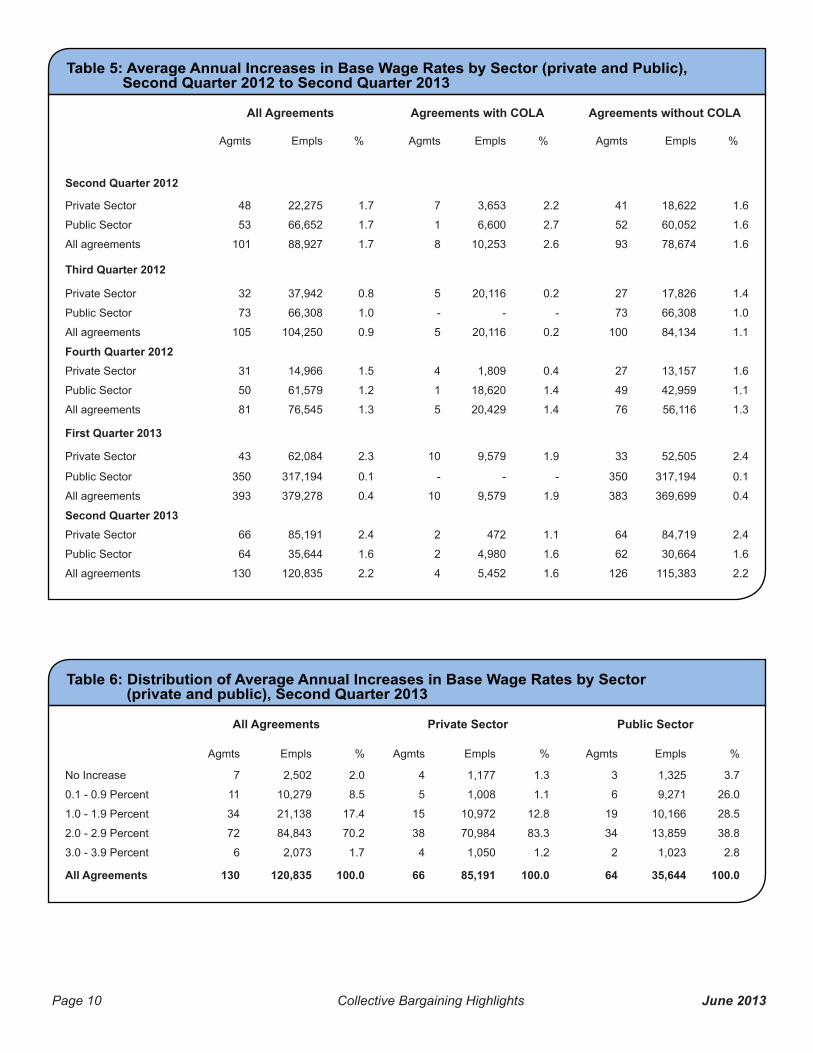
Second Quarter 2013During the second quarter of 2013, 130 collective
more Ontario-based employees. These agreements covered 120,835 employees (Table 5), 70.5% (85,191) of whom were in the private sector. By industry, the majority of employees were in health and social services (16,199), retail trade (7,463), electricity, gas and water (5,414) and communications (5,396) (Table 8).
Wage AdjustmentsSecond quarter settlements (Table 5) provided an overall annual increase of 2.2%, an increase from 0.4% in the previous quarter. In the public sector, the average annual wage increase was 1.6%, compared to 0.1% in the previous quarter. The private sector reported an average annual wage increase of 2.4%, up from 2.3% in the previous quarter. The industries with the highest average annual wage increases in the second quarter (Table 8) were construction (2.6%), local government (2.5%), transportation (2.4%), electrical products and accommodation and food services (2.0%), and personal services (1.9%). Annual wage adjustments for the industries with the highest concentration of employees averaged 1.8% in health and social services (16,199), 1.0% in retail trade (7,463), 1.7% in electricity, gas and water (5,414) and 1.8% in communications (5,396).
In the second quarter of 2013, approximately 17.4% (21,138) of all employees (Table 6) received average annual wage increases ranging from 1% to 1.9%, compared to 70.2% (84,843) who received average annual wage increases ranging from 2% to 2.9%. In the public sector, 28.5% (10,166) of employees were covered by agreements with average annual wage increases ranging from 1% to 1.9%, compared to 12.8% (10,972) of the private sector employees. In the private sector 83.3% (70,984) of employees received average annual wage increases ranging from 2% to 2.9%, compared to 38.8% (13,859) of public sector employees.
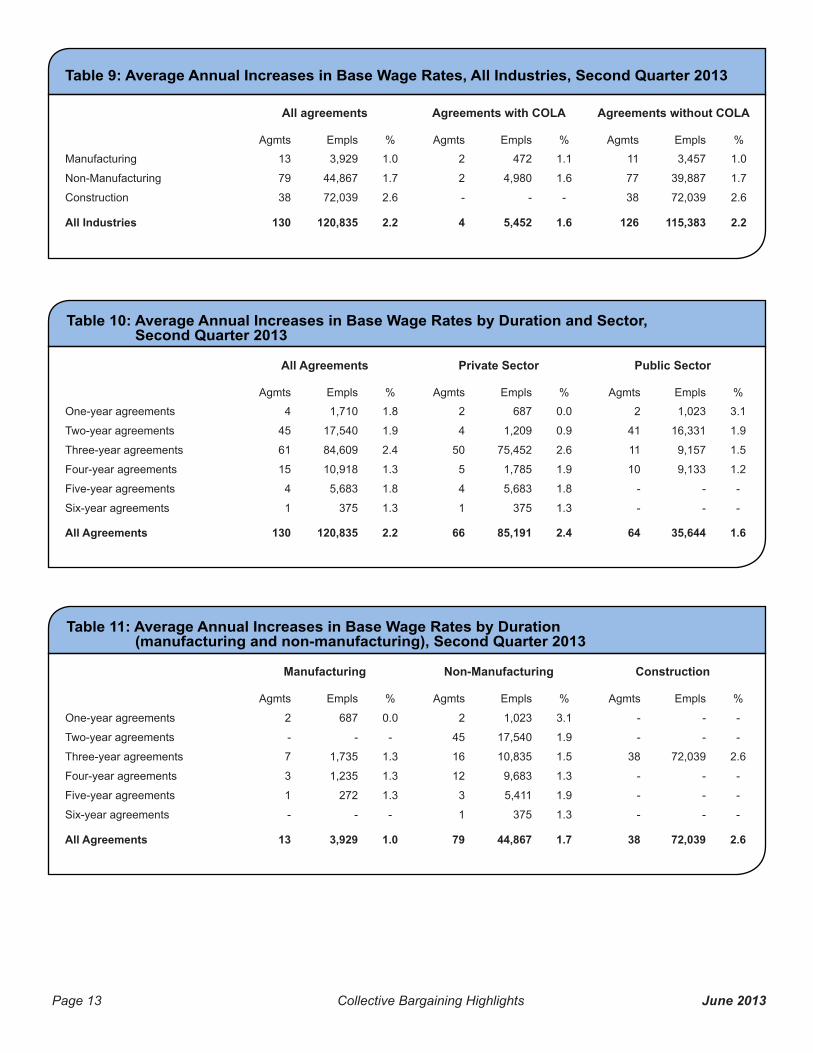
Of the total number of employees for whom agreements were reached during the second quarter of 2013 (Table 10), 70.0% (84,609) were covered by three-year agreements. In the private sector, three-year agreements were the most common, covering 88.6% (75,452) of employees compared to 1.41% (1,209) of employees covered by two-year agreements. In the public sector, 45.8% (16,331) were covered by two-year agreements and 25.7% (9,157) by three-year agreements. Approximately 44.15% (1,735) of manufacturing employees and 24.1% (10,835) of non-manufacturing employees were covered by three-year agreements.
Negotiations
within 3.2 months from the start of negotiations, compared to 14.9 months in the public sector (Table 13).
Of all settlements reached during the second quarter of 2013, 23 agreements covering 26% (31,477) of employees were negotiated directly by the parties, compared to 56 agreements covering 48.9% (59,122) of employees reached with the assistance of conciliation or mediation. Forty-seven (47) agreements, covering 20.6% (24,885) of employees were settled by arbitration, and four (4) agreements were reached following a work stoppage (Table 14).
In the public sector, approximately 31.6% (11,276) of employees reached settlements with the assistance of conciliation or mediation, while 10% (3,617) were reached through direct bargaining. In the private sector, 56.2% (47,846) reached agreements with the assistance of conciliation or mediation, compared to 32.7% (27,860) who settled by direct bargaining.
Page 8 Collective Bargaining Highlights June 2013
Upcoming BargainingMajor negotiations continuing into the third quarter of 2013 include the federal government, municipalities, police services boards, hospitals, nursing homes and homes for the aged, universities, the Ontario Government (provincial police/civilian uniform), Hydro One, Canadian Red Cross, construction industry (ICI and Non-ICI) and the Council of Academic Hospitals of Ontario.
Major agreements scheduled to expire during the third quarter of 2013 include CAMI Automotive and Essar Steel Algoma.
Work StoppagesDuring the second quarter of 2013, 21 work stoppages were reported under Ontario jurisdiction, compared to 52 reported for the same period in 2012. Work
employees and resulted in 178,110 person-days lost, compared to 7,408 employees and 108,310 person-days lost reported during the same period in 2012 (Table 15 and 16).
From January to June 2013, eight work stoppages were reported in the manufacturing sector, a decrease from 13 reported during the same period in 2012. In comparison, the non-manufacturing sector reported
the same period in 2012. In the construction sector, eight (8) work stoppages were reported during the
0.02% of the estimated working time in Ontario was lost due to work stoppages (Table 16 and 17).
Page 9 Collective Bargaining Highlights June 2013
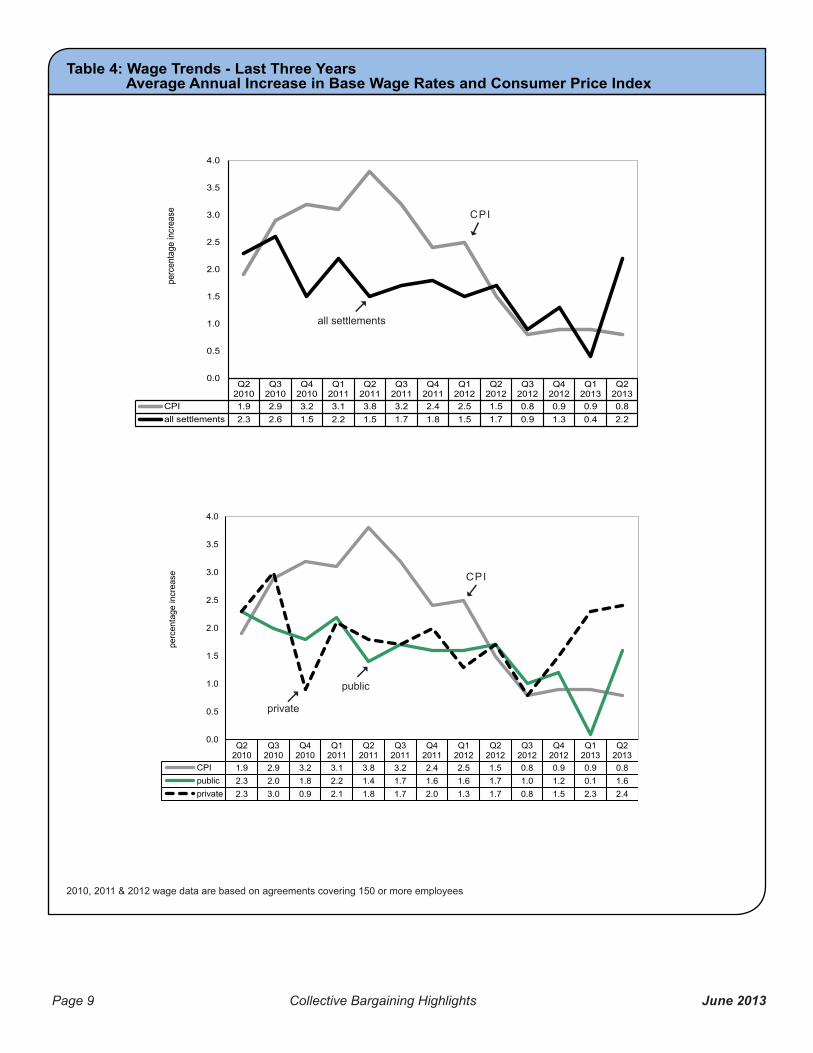
Table 4: Wage Trends - Last Three Years Average Annual Increase in Base Wage Rates and Consumer Price Index
Q22010
Q32010
Q42010
Q12011
Q22011
Q32011
Q42011
Q12012
Q22012
Q32012
Q42012
Q12013
Q22013
CPI 1.9 2.9 3.2 3.1 3.8 3.2 2.4 2.5 1.5 0.8 0.9 0.9 0.8all settlements 2.3 2.6 1.5 2.2 1.5 1.7 1.8 1.5 1.7 0.9 1.3 0.4 2.2
0.0
0.5
1.0
1.5
2.0
2.5
3.0
3.5
4.0pe
rcen
tage
incr
ease
Q22010
Q32010
Q42010
Q12011
Q22011
Q32011
Q42011
Q12012
Q22012
Q32012
Q42012
Q12013
Q22013
CPI 1.9 2.9 3.2 3.1 3.8 3.2 2.4 2.5 1.5 0.8 0.9 0.9 0.8public 2.3 2.0 1.8 2.2 1.4 1.7 1.6 1.6 1.7 1.0 1.2 0.1 1.6private 2.3 3.0 0.9 2.1 1.8 1.7 2.0 1.3 1.7 0.8 1.5 2.3 2.4
0.0
0.5
1.0
1.5
2.0
2.5
3.0
3.5
4.0
perc
enta
ge in
crea
se
2010, 2011 & 2012 wage data are based on agreements covering 150 or more employees
all settlements
CPI
public
CPI
private
Page 10 Collective Bargaining Highlights June 2013
Table 5: Average Annual Increases in Base Wage Rates by Sector (private and Public), Second Quarter 2012 to Second Quarter 2013
Table 6: Distribution of Average Annual Increases in Base Wage Rates by Sector (private and public), Second Quarter 2013
All Agreements Agreements with COLA Agreements without COLA
Agmts Empls % Agmts Empls % Agmts Empls %
Second Quarter 2012
Private Sector 48 22,275 1.7 7 3,653 2.2 41 18,622 1.6
Public Sector 53 66,652 1.7 1 6,600 2.7 52 60,052 1.6
All agreements 101 88,927 1.7 8 10,253 2.6 93 78,674 1.6
Third Quarter 2012
Private Sector 32 37,942 0.8 5 20,116 0.2 27 17,826 1.4
Public Sector 73 66,308 1.0 - - - 73 66,308 1.0
All agreements 105 104,250 0.9 5 20,116 0.2 100 84,134 1.1
Fourth Quarter 2012Private Sector 31 14,966 1.5 4 1,809 0.4 27 13,157 1.6
Public Sector 50 61,579 1.2 1 18,620 1.4 49 42,959 1.1
All agreements 81 76,545 1.3 5 20,429 1.4 76 56,116 1.3
First Quarter 2013
Private Sector 43 62,084 2.3 10 9,579 1.9 33 52,505 2.4
Public Sector 350 317,194 0.1 - - - 350 317,194 0.1
All agreements 393 379,278 0.4 10 9,579 1.9 383 369,699 0.4
Second Quarter 2013Private Sector 66 85,191 2.4 2 472 1.1 64 84,719 2.4
Public Sector 64 35,644 1.6 2 4,980 1.6 62 30,664 1.6
All agreements 130 120,835 2.2 4 5,452 1.6 126 115,383 2.2
All Agreements Private Sector Public Sector
Agmts Empls % Agmts Empls % Agmts Empls %
No Increase 7 2,502 2.0 4 1,177 1.3 3 1,325 3.7
0.1 - 0.9 Percent 11 10,279 8.5 5 1,008 1.1 6 9,271 26.0
1.0 - 1.9 Percent 34 21,138 17.4 15 10,972 12.8 19 10,166 28.5
2.0 - 2.9 Percent 72 84,843 70.2 38 70,984 83.3 34 13,859 38.8
3.0 - 3.9 Percent 6 2,073 1.7 4 1,050 1.2 2 1,023 2.8
All Agreements 130 120,835 100.0 66 85,191 100.0 64 35,644 100.0
Page 11 Collective Bargaining Highlights June 2013
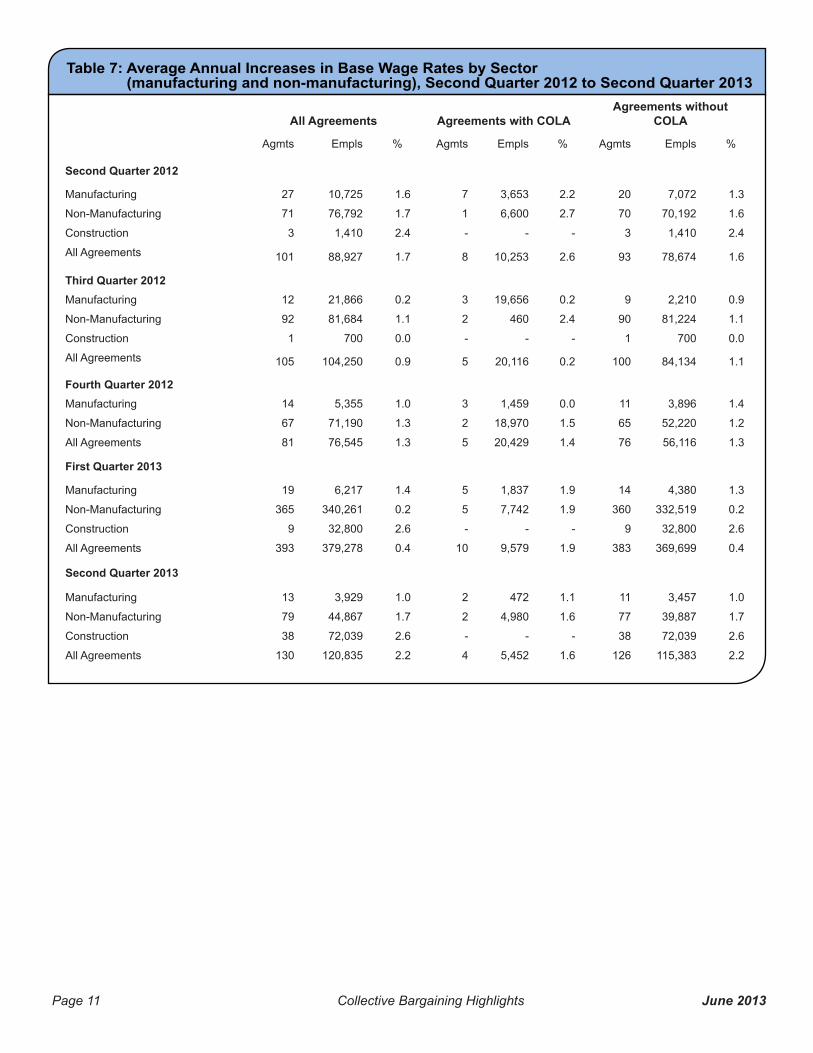
Table 7: Average Annual Increases in Base Wage Rates by Sector (manufacturing and non-manufacturing), Second Quarter 2012 to Second Quarter 2013
All Agreements Agreements with COLAAgreements without
COLA
Agmts Empls % Agmts Empls % Agmts Empls %
Second Quarter 2012
Manufacturing 27 10,725 1.6 7 3,653 2.2 20 7,072 1.3
Non-Manufacturing 71 76,792 1.7 1 6,600 2.7 70 70,192 1.6
Construction 3 1,410 2.4 - - - 3 1,410 2.4
All Agreements 101 88,927 1.7 8 10,253 2.6 93 78,674 1.6
Third Quarter 2012Manufacturing 12 21,866 0.2 3 19,656 0.2 9 2,210 0.9
Non-Manufacturing 92 81,684 1.1 2 460 2.4 90 81,224 1.1
Construction 1 700 0.0 - - - 1 700 0.0
All Agreements 105 104,250 0.9 5 20,116 0.2 100 84,134 1.1
Fourth Quarter 2012Manufacturing 14 5,355 1.0 3 1,459 0.0 11 3,896 1.4
Non-Manufacturing 67 71,190 1.3 2 18,970 1.5 65 52,220 1.2
All Agreements 81 76,545 1.3 5 20,429 1.4 76 56,116 1.3
First Quarter 2013
Manufacturing 19 6,217 1.4 5 1,837 1.9 14 4,380 1.3
Non-Manufacturing 365 340,261 0.2 5 7,742 1.9 360 332,519 0.2
Construction 9 32,800 2.6 - - - 9 32,800 2.6
All Agreements 393 379,278 0.4 10 9,579 1.9 383 369,699 0.4
Second Quarter 2013
Manufacturing 13 3,929 1.0 2 472 1.1 11 3,457 1.0
Non-Manufacturing 79 44,867 1.7 2 4,980 1.6 77 39,887 1.7
Construction 38 72,039 2.6 - - - 38 72,039 2.6
All Agreements 130 120,835 2.2 4 5,452 1.6 126 115,383 2.2

Page 12 Collective Bargaining Highlights June 2013
Table 8: Average Annual Increases in Base Wage Rates by Industry, Second Quarter 2013
All Agreements Agreements with COLAAgreements without
COLAAgmts Empls % Agmts Empls % Agmts Empls %
Manufacturing
Food, Beverage 4 2,016 1.0 - - - 4 2,016 1.0
Rubber, Plastics 1 185 1.0 - - - 1 185 1.0
Paper 1 158 1.0 - - - 1 158 1.0
Primary Metals 2 437 1.6 1 272 1.3 1 165 2.0
Transportation Equipment 2 542 0.0 - - - 2 542 0.0
Electrical Products 1 176 2.0 - - - 1 176 2.0
Chemicals 2 415 1.7 1 200 0.7 1 215 2.6
Total 13 3,929 1.0 2 472 1.1 11 3,457 1.0
Non-Manufacturing
Forestry 1 400 1.7 - - - 1 400 1.7
Transportation 4 1,438 2.4 - - - 4 1,438 2.4
Storage 1 310 0.0 - - - 1 310 0.0
Communications 3 5,396 1.8 - - - 3 5,396 1.8
Electricity, Gas, Water 3 5,414 1.7 2 4,980 1.6 1 434 2.7
Retail Trade 3 7,463 1.0 - - - 3 7,463 1.0
Education & Related Services 2 1,000 0.4 - - - 2 1,000 0.4
Health & Social Services 47 16,199 1.8 - - - 47 16,199 1.8
Recreational Services 1 400 0.6 - - - 1 400 0.6
Management Services 1 344 0.9 - - - 1 344 0.9
Personal Services 2 600 1.9 - - - 2 600 1.9
Accommodation & Food Services 1 190 2.0 - - - 1 190 2.0
Federal Government 1 280 1.7 - - - 1 280 1.7
Provincial Government 1 565 0.0 - - - 1 565 0.0
Local Government 8 4,868 2.5 - - - 8 4,868 2.5
Total 79 44,867 1.7 2 4,980 1.6 77 39,887 1.7
Construction 38 72,039 2.6 - - - 38 72,039 2.6
All Industries 130 120,835 2.2 4 5,452 1.6 126 115,383 2.2
Page 13 Collective Bargaining Highlights June 2013
Table 9: Average Annual Increases in Base Wage Rates, All Industries, Second Quarter 2013
Table 10: Average Annual Increases in Base Wage Rates by Duration and Sector, Second Quarter 2013
Table 11: Average Annual Increases in Base Wage Rates by Duration (manufacturing and non-manufacturing), Second Quarter 2013
All agreements Agreements with COLA Agreements without COLA
Agmts Empls % Agmts Empls % Agmts Empls %
Manufacturing 13 3,929 1.0 2 472 1.1 11 3,457 1.0
Non-Manufacturing 79 44,867 1.7 2 4,980 1.6 77 39,887 1.7
Construction 38 72,039 2.6 - - - 38 72,039 2.6
All Industries 130 120,835 2.2 4 5,452 1.6 126 115,383 2.2
All Agreements Private Sector Public Sector
Agmts Empls % Agmts Empls % Agmts Empls %
One-year agreements 4 1,710 1.8 2 687 0.0 2 1,023 3.1
Two-year agreements 45 17,540 1.9 4 1,209 0.9 41 16,331 1.9
Three-year agreements 61 84,609 2.4 50 75,452 2.6 11 9,157 1.5
Four-year agreements 15 10,918 1.3 5 1,785 1.9 10 9,133 1.2
Five-year agreements 4 5,683 1.8 4 5,683 1.8 - - -
Six-year agreements 1 375 1.3 1 375 1.3 - - -
All Agreements 130 120,835 2.2 66 85,191 2.4 64 35,644 1.6
Manufacturing Non-Manufacturing Construction
Agmts Empls % Agmts Empls % Agmts Empls %
One-year agreements 2 687 0.0 2 1,023 3.1 - - -
Two-year agreements - - - 45 17,540 1.9 - - -
Three-year agreements 7 1,735 1.3 16 10,835 1.5 38 72,039 2.6
Four-year agreements 3 1,235 1.3 12 9,683 1.3 - - -
Five-year agreements 1 272 1.3 3 5,411 1.9 - - -
Six-year agreements - - - 1 375 1.3 - - -
All Agreements 13 3,929 1.0 79 44,867 1.7 38 72,039 2.6

Page 14 Collective Bargaining Highlights June 2013
Table 12: Duration of Negotiations by Sector, Second Quarter 2013
Table 13: Average Duration of Negotiations by Sector, Second Quarter 2013
Table 14: Stage of Settlement by Sector, Second Quarter 2013
Total Private Sector Public Sector
Agmts Empls Agmts Empls Agmts Empls
1-3 Months 56 67,078 47 62,165 9 4,913
4-6 Months 22 33,553 14 21,346 8 12,207
7-9 Months 4 1,319 3 905 1 414
10-12 Months 2 561 1 375 1 186
13 Months and Over 46 18,324 1 400 45 17,924
Total 130 120,835 66 85,191 64 35,644
Average Duration of Negotiations
months
Private Sector 3.2
Public Sector 14.9
Total 9.0
Total Private Sector Public Sector
Agmts Empls Agmts Empls Agmts Empls
Direct Bargaining 23 31,477 17 27,860 6 3,617
Conciliation 30 23,599 26 22,040 4 1,559
Mediation 26 35,523 15 25,806 11 9,717
Arbitration 47 24,885 4 4,134 43 20,751
Work Stoppage 4 5,351 4 5,351 - -
Total 130 120,835 66 85,191 64 35,644

Page 15 Collective Bargaining Highlights June 2013
Table 15: Work Stoppages, January - June 2012 and 2013
Table 16: Person-Days Lost, January - June 2012 and 2013
January - June 2013 January - June 2012
Manufacturing 8 13
Non-Manufacturing 5 22
Construction 8 17
All Industries 21 52
January - June 2013 January - June 2012
Manufacturing 48,350 42,970
Non-Manufacturing 8,710 63,450
Construction 121,050 1,890
All Industries 178,110 108,310
As of June 30, 2013, 11 work stoppages, covering a total of 3,731 employees were carried over to July 2013. (Data are collected for all work stoppages involving two or more employees under Ontario Jurisdiction).
Page 16 Collective Bargaining Highlights June 2013
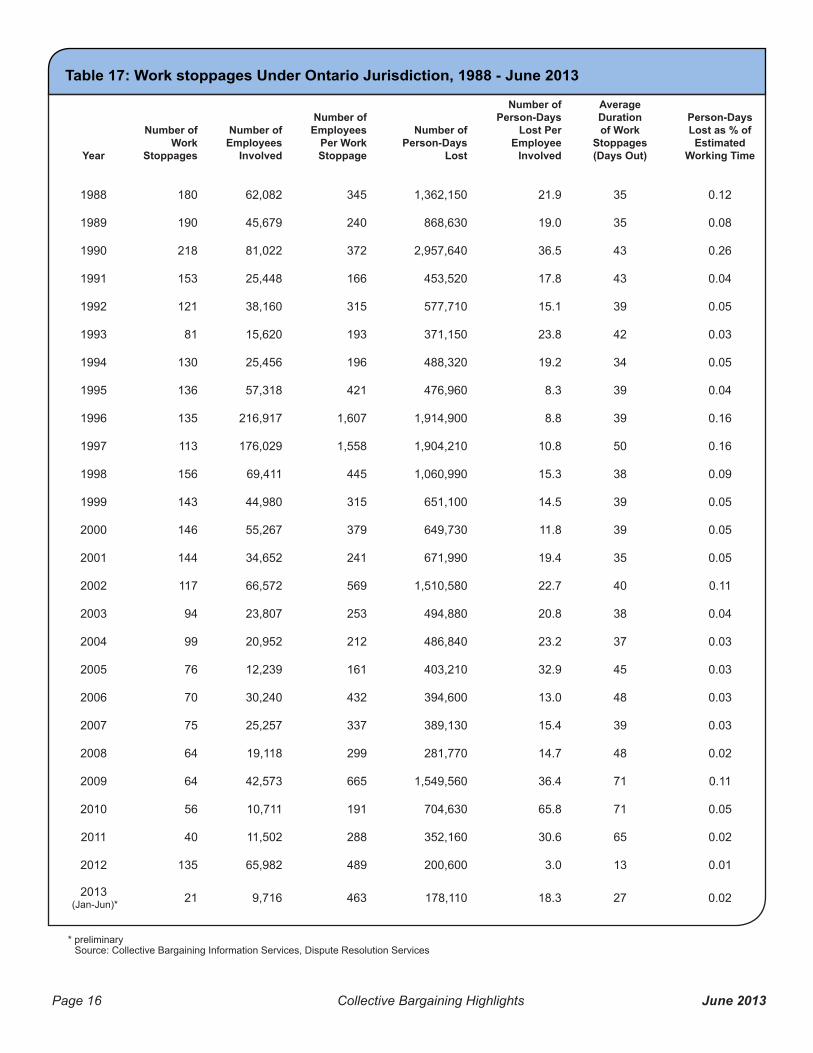
Table 17: Work stoppages Under Ontario Jurisdiction, 1988 - June 2013
Year
Number of Work
Stoppages
Number of Employees
Involved
Number of Employees
Per Work Stoppage
Number of Person-Days
Lost
Number of Person-Days
Lost Per Employee
Involved
Average Duration of Work
Stoppages (Days Out)
Person-Days Lost as % of Estimated
Working Time
1988 180 62,082 345 1,362,150 21.9 35 0.12
1989 190 45,679 240 868,630 19.0 35 0.08
1990 218 81,022 372 2,957,640 36.5 43 0.26
1991 153 25,448 166 453,520 17.8 43 0.04
1992 121 38,160 315 577,710 15.1 39 0.05
1993 81 15,620 193 371,150 23.8 42 0.03
1994 130 25,456 196 488,320 19.2 34 0.05
1995 136 57,318 421 476,960 8.3 39 0.04
1996 135 216,917 1,607 1,914,900 8.8 39 0.16
1997 113 176,029 1,558 1,904,210 10.8 50 0.16
1998 156 69,411 445 1,060,990 15.3 38 0.09
1999 143 44,980 315 651,100 14.5 39 0.05
2000 146 55,267 379 649,730 11.8 39 0.05
2001 144 34,652 241 671,990 19.4 35 0.05
2002 117 66,572 569 1,510,580 22.7 40 0.11
2003 94 23,807 253 494,880 20.8 38 0.04
2004 99 20,952 212 486,840 23.2 37 0.03
2005 76 12,239 161 403,210 32.9 45 0.03
2006 70 30,240 432 394,600 13.0 48 0.03
2007 75 25,257 337 389,130 15.4 39 0.03
2008 64 19,118 299 281,770 14.7 48 0.02
2009 64 42,573 665 1,549,560 36.4 71 0.11
2010 56 10,711 191 704,630 65.8 71 0.05
2011 40 11,502 288 352,160 30.6 65 0.02
2012 135 65,982 489 200,600 3.0 13 0.01
2013 (Jan-Jun)* 21 9,716 463 178,110 18.3 27 0.02
* preliminary Source: Collective Bargaining Information Services, Dispute Resolution Services
Page 17 Collective Bargaining Highlights June 2013
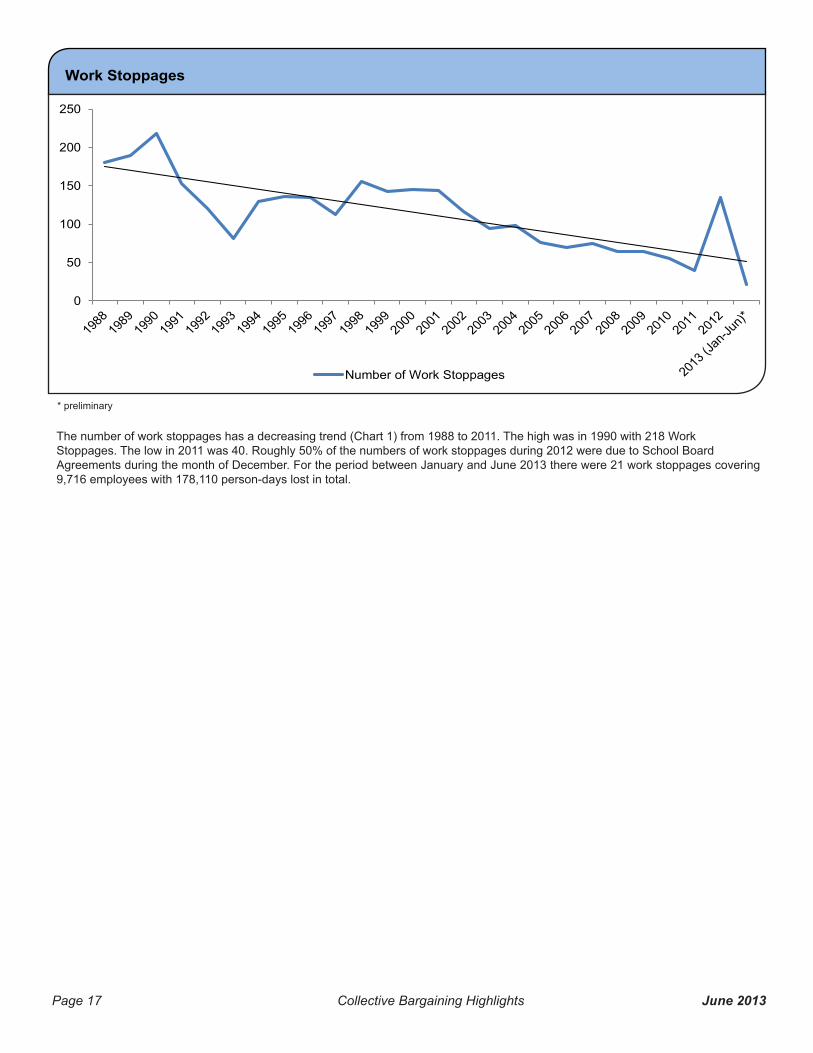
Work Stoppages
0
50
100
150
200
250
Number of Work Stoppages
The number of work stoppages has a decreasing trend (Chart 1) from 1988 to 2011. The high was in 1990 with 218 Work Stoppages. The low in 2011 was 40. Roughly 50% of the numbers of work stoppages during 2012 were due to School Board Agreements during the month of December. For the period between January and June 2013 there were 21 work stoppages covering 9,716 employees with 178,110 person-days lost in total.
* preliminary
Page 18 Collective Bargaining Highlights June 2013
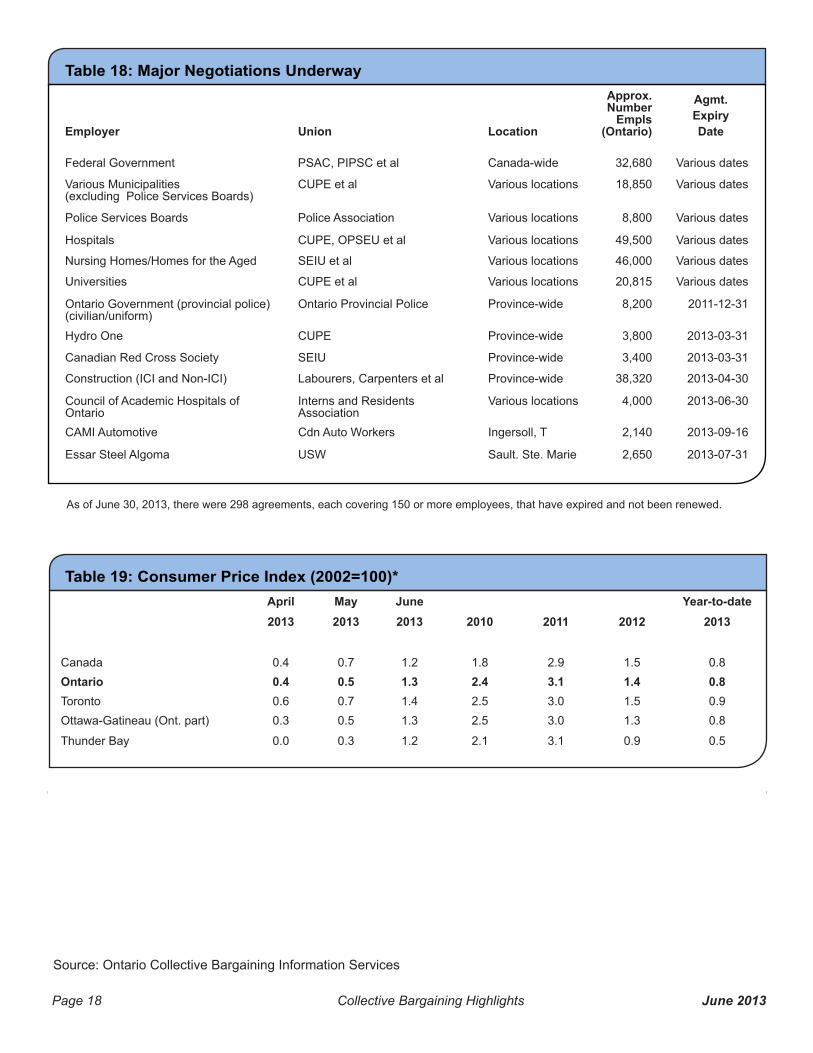
Table 19: Consumer Price Index (2002=100)*
Table 18: Major Negotiations Underway
April May June Year-to-date2013 2013 2013 2010 2011 2012 2013
Canada 0.4 0.7 1.2 1.8 2.9 1.5 0.8Ontario 0.4 0.5 1.3 2.4 3.1 1.4 0.8Toronto 0.6 0.7 1.4 2.5 3.0 1.5 0.9Ottawa-Gatineau (Ont. part) 0.3 0.5 1.3 2.5 3.0 1.3 0.8
Thunder Bay 0.0 0.3 1.2 2.1 3.1 0.9 0.5
* Percentage change from previous yearSource: Statistics Canada
Data for the months of March, June, September and March include quarterly information.
Information in this report is based on collective agreements covering 150 or more employees, a sample that represents 81% of unionized employees in Ontario. Wage data in this report are derived exclusively from information reported to Collective Bargaining Information Services. Data for the current month are preliminary. All percentage wage data are calculated on the base rate, weighted by the number of employees, and include cost-of-living adjustments
bargaining unit.
The Collective Bargaining Highlights may be reproduced and circulated freely. However, Collective Bargaining Information Services should be acknowledged as the source.
This document is available on the Ministry of Labour Website at http://www.labour.gov.on.ca/english/lr/pubs/index.php. For further information on this report or other services, please contact us at [email protected] or call 416-326-1260.
Cette publication est également disponible en français.
Employer Union Location
Approx. Number
Empls (Ontario)
Agmt. Expiry Date
Federal Government PSAC, PIPSC et al Canada-wide 32,680 Various dates
Various Municipalities (excluding Police Services Boards)
CUPE et al Various locations 18,850 Various dates
Police Services Boards Police Association Various locations 8,800 Various dates
Hospitals CUPE, OPSEU et al Various locations 49,500 Various dates
Nursing Homes/Homes for the Aged SEIU et al Various locations 46,000 Various dates
Universities CUPE et al Various locations 20,815 Various dates
Ontario Government (provincial police) (civilian/uniform)
Ontario Provincial Police Province-wide 8,200 2011-12-31
Hydro One CUPE Province-wide 3,800 2013-03-31
Canadian Red Cross Society SEIU Province-wide 3,400 2013-03-31
Construction (ICI and Non-ICI) Labourers, Carpenters et al Province-wide 38,320 2013-04-30
Council of Academic Hospitals of Ontario
Interns and Residents Association
Various locations 4,000 2013-06-30
CAMI Automotive Cdn Auto Workers Ingersoll, T 2,140 2013-09-16
Essar Steel Algoma USW Sault. Ste. Marie 2,650 2013-07-31
As of June 30, 2013, there were 298 agreements, each covering 150 or more employees, that have expired and not been renewed.
ISSN 1492-4323Source: Ontario Collective Bargaining Information Services