Embed Size (px)
Citation preview
Collecting back-reflected photons in
photoacoustic microscopy
Hao F. Zhang1,5
, Jing Wang1,3
, Qing Wei1, Tan Liu
1, Shuliang Jiao
2,4, and Carmen A.
Puliafito2
1Department of Electrical Engineering and Computer Science, University of Wisconsin-Milwaukee, Milwaukee WI
53201, USA 2Department of Ophthalmology, University of Southern California, Los Angeles, CA 90033, USA
3College of Electronic Science and Engineering, Jilin University, Changchun, 130012, China [email protected]
Abstract: Since the photoacoustic effect relies only on the absorbed optical
energy, the back-reflected photons from samples in optical-resolution
photoacoustic microscopy are usually discarded. By employing a 2 × 2
single-mode fiber optical coupler in a laser-scanning optical-resolution
photoacoustic microscope for delivering the illuminating laser light and
collecting the back reflected photons, a fiber-optic confocal microscope is
integrated with the photoacoustic microscope. Thus, simultaneous
multimodal imaging can be achieved with a single light source and images
from the two modalities are intrinsically registered. Such capabilities are
demonstrated in imaging both phantoms and small animals in vivo.
©2010 Optical Society of America
OCIS codes: (110.5120) Photoacoustic imaging; (170.1790) Confocal microscopy; (110.0180)
Microscopy.
References and Links
1. H. F. Zhang, K. Maslov, G. Stoica, and L. V. Wang, “Functional photoacoustic microscopy for high-resolution
and noninvasive in vivo imaging,” Nat. Biotechnol. 24(7), 848–851 (2006).
2. A. De La Zerda, C. Zavaleta, S. Keren, S. Vaithilingam, S. Bodapati, Z. Liu, J. Levi, B. R. Smith, T. J. Ma, O.
Oralkan, Z. Cheng, X. Y. Chen, H. J. Dai, B. T. Khuri-Yakub, and S. S. Gambhir, “Carbon nanotubes as
photoacoustic molecular imaging agents in living mice,” Nat. Nanotechnol. 3(9), 557–562 (2008).
3. E. Z. Zhang, J. G. Laufer, R. B. Pedley, and P. C. Beard, “In vivo high-resolution 3D photoacoustic imaging of
superficial vascular anatomy,” Phys. Med. Biol. 54(4), 1035–1046 (2009).
4. K. Maslov, H. F. Zhang, S. Hu, and L. V. Wang, “Optical-resolution photoacoustic microscopy for in vivo
imaging of single capillaries,” Opt. Lett. 33(9), 929–931 (2008).
5. Z. X. Xie, S. L. Jiao, H. F. Zhang, and C. A. Puliafito, “Laser-scanning optical-resolution photoacoustic
microscopy,” Opt. Lett. 34(12), 1771–1773 (2009).
6. L. V. Wang, “Multiscale photoacoustic microscopy and computed tomography,” Nat. Photonics 3(9), 503–509
(2009).
7. K. H. Song, C. H. Kim, C. M. Cobley, Y. N. Xia, and L. V. Wang, “Near-infrared gold nanocages as a new class
of tracers for photoacoustic sentinel lymph node mapping on a rat model,” Nano Lett. 9(1), 183–188 (2009).
8. J. Laufer, E. Zhang, G. Raivich, and P. Beard, “Three-dimensional noninvasive imaging of the vasculature in the
mouse brain using a high resolution photoacoustic scanner,” Appl. Opt. 48(10), D299–D306 (2009).
9. S. Jiao, R. Knighton, X. Huang, G. Gregori, and C. A. Puliafito, “Simultaneous acquisition of sectional and
fundus ophthalmic images with spectral-domain optical coherence tomography,” Opt. Express 13(2), 444–452
(2005).
10. S. L. Jiao, Z. X. Xie, H. F. Zhang, and C. A. Puliafito, “Simultaneous multimodal imaging with integrated
photoacoustic microscopy and optical coherence tomography,” Opt. Lett. 34(19), 2961–2963 (2009).
11. T. Dabbs, and M. Glass, “Fiber-optic confocal microscope: FOCON,” Appl. Opt. 31(16), 3030–3035 (1992).
12. M. Gu, Principles of three-dimensional imaging in confocal microscopes (Word Scientific, 1996).
13. E. Salomatina, B. Jiang, J. Novak, and A. N. Yaroslavsky, “Optical properties of normal and cancerous human
skin in the visible and near-infrared spectral range,” J. Biomed. Opt. 11(6), 064026 (2006).
14. R. H. Webb, G. W. Hughes, and F. C. Delori, “Confocal scanning laser ophthalmoscope,” Appl. Opt. 26(8),
1492–1499 (1987).
15. D. A. Atchison, and G. Smith, Optics of human eye (Butterworth-Heinemann, 2000).
#120567 - $15.00 USD Received 30 Nov 2009; revised 31 Dec 2009; accepted 4 Jan 2010; published 11 Jan 2010
(C) 2010 OSA 18 January 2010 / Vol. 18, No. 2 / OPTICS EXPRESS 1278
16. S. Schmitz-Valckenberg, M. Fleckenstein, A. P. Göbel, K. Sehmi, F. W. Fitzke, F. G. Holz, and A. Tufail,
“Evaluation of autofluorescence imaging with the scanning laser ophthalmoscope and the fundus camera in age-
related geographic atrophy,” Am. J. Ophthalmol. 146(2), 183–192 (2008).
1. Introduction
Photoacoustic microscopy (PAM) is one of the fastest-growing imaging technologies due to
its unique capability to achieve high-spatial resolution imaging of optical absorption contrast
in biological tissue. Two forms of PAM, ultrasonic-resolution PAM (UR-PAM) [1–3] and
optical-resolution PAM (OR-PAM) [4,5], have been developed for different targeted
applications.
UR-PAM depends on ultrasonic localization and usually has a spatial resolution from 15
µm to 100 µm, depending on the bandwidth and center frequency of the ultrasonic detector.
Since ultrasonic scattering is two orders of magnitude weaker than optical scattering in
biological tissue, UR-PAM exceeds the existing depth limit (~1 mm) of high-resolution
optical imaging and can probe deep (up to 30 mm) into tissue [1,3]. Although the spatial
resolution becomes worse, the depth-to-resolution ratio is usually kept around 100 [6]. Hence,
UR-PAM aims at deep-tissue applications such as imaging of the sentinel lymph node for
diagnosing breast cancer [7] and small animal brain imaging [8].
OR-PAM relies on optical focusing to provide lateral resolution (can be as high as a few
micrometers) and the ultrasonic detection can be either strongly focused [4] or unfocused [5].
OR-PAM has the potential to be integrated with existing optical microscopic imaging
modalities, such as optical coherence tomography (OCT) [9], confocal microscopy, and two-
photon microcopy, to provide multimodal imaging with complementary contrasts.
The development of laser-scanning optical-resolution PAM (LSOR-PAM) [5] solved the
incompatibility between OR-PAM and existing optical microscopy by eliminating the
mechanical scanning of the optical and ultrasonic components. LSOR-PAM has been
successfully fused with spectral-domain OCT [10] to achieve simultaneous imaging of the
microvasculature and micro-anatomy in small animals in vivo, which laid the foundation for
potential applications in ophthalmic imaging.
Here, we report on the integration of LSOR-PAM with a fiber-optic confocal microscope
(FOCON) [11] to achieve multimodal imaging of both optical absorption and optical
scattering contrasts. The axial resolution of the confocal microscopy was quantified both
theoretically and experimentally. The complementary contrast was demonstrated in both
phantoms and small animals in vivo.
2. Methods and materials
Fig. 1. Schematic of the fused laser-scanning confocal microscopy and photoacoustic
microscopy. PD: photodiode; 2×2: fiber coupler.
#120567 - $15.00 USD Received 30 Nov 2009; revised 31 Dec 2009; accepted 4 Jan 2010; published 11 Jan 2010
(C) 2010 OSA 18 January 2010 / Vol. 18, No. 2 / OPTICS EXPRESS 1279
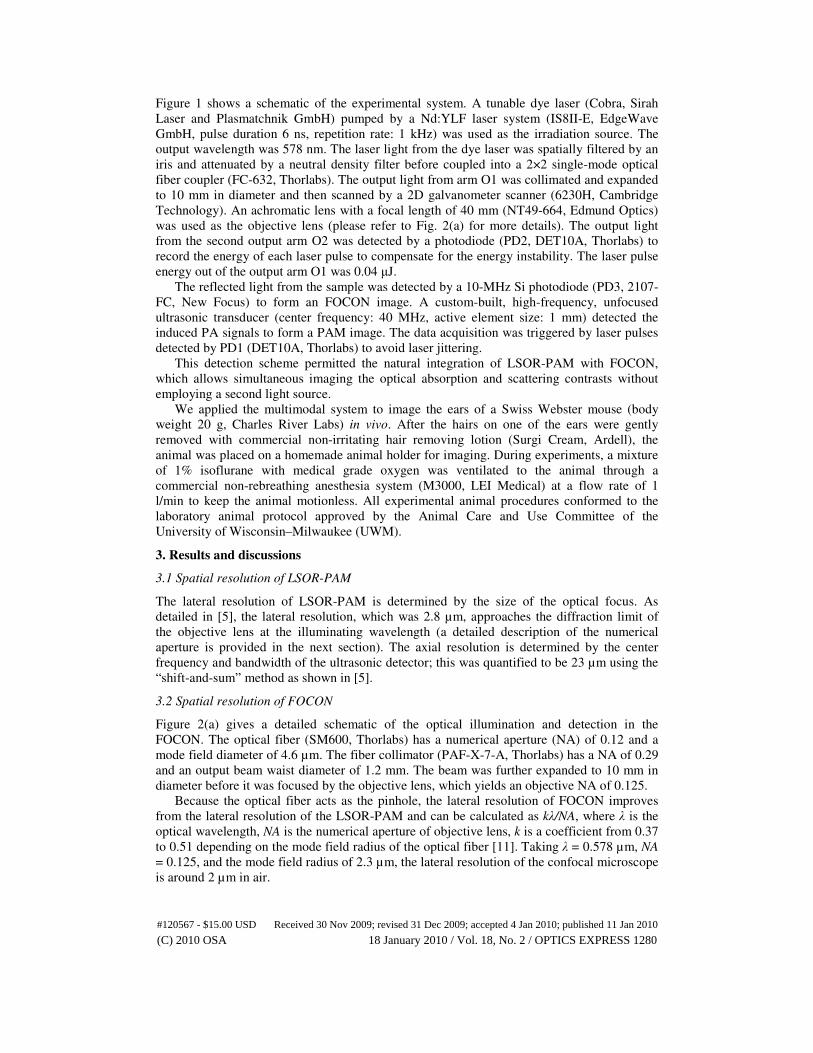
Figure 1 shows a schematic of the experimental system. A tunable dye laser (Cobra, Sirah
Laser and Plasmatchnik GmbH) pumped by a Nd:YLF laser system (IS8II-E, EdgeWave
GmbH, pulse duration 6 ns, repetition rate: 1 kHz) was used as the irradiation source. The
output wavelength was 578 nm. The laser light from the dye laser was spatially filtered by an
iris and attenuated by a neutral density filter before coupled into a 2×2 single-mode optical
fiber coupler (FC-632, Thorlabs). The output light from arm O1 was collimated and expanded
to 10 mm in diameter and then scanned by a 2D galvanometer scanner (6230H, Cambridge
Technology). An achromatic lens with a focal length of 40 mm (NT49-664, Edmund Optics)
was used as the objective lens (please refer to Fig. 2(a) for more details). The output light
from the second output arm O2 was detected by a photodiode (PD2, DET10A, Thorlabs) to
record the energy of each laser pulse to compensate for the energy instability. The laser pulse
energy out of the output arm O1 was 0.04 µJ.
The reflected light from the sample was detected by a 10-MHz Si photodiode (PD3, 2107-
FC, New Focus) to form an FOCON image. A custom-built, high-frequency, unfocused
ultrasonic transducer (center frequency: 40 MHz, active element size: 1 mm) detected the
induced PA signals to form a PAM image. The data acquisition was triggered by laser pulses
detected by PD1 (DET10A, Thorlabs) to avoid laser jittering.
This detection scheme permitted the natural integration of LSOR-PAM with FOCON,
which allows simultaneous imaging the optical absorption and scattering contrasts without
employing a second light source.
We applied the multimodal system to image the ears of a Swiss Webster mouse (body
weight 20 g, Charles River Labs) in vivo. After the hairs on one of the ears were gently
removed with commercial non-irritating hair removing lotion (Surgi Cream, Ardell), the
animal was placed on a homemade animal holder for imaging. During experiments, a mixture
of 1% isoflurane with medical grade oxygen was ventilated to the animal through a
commercial non-rebreathing anesthesia system (M3000, LEI Medical) at a flow rate of 1
l/min to keep the animal motionless. All experimental animal procedures conformed to the
laboratory animal protocol approved by the Animal Care and Use Committee of the
University of Wisconsin–Milwaukee (UWM).
3. Results and discussions
3.1 Spatial resolution of LSOR-PAM
The lateral resolution of LSOR-PAM is determined by the size of the optical focus. As
detailed in [5], the lateral resolution, which was 2.8 µm, approaches the diffraction limit of
the objective lens at the illuminating wavelength (a detailed description of the numerical
aperture is provided in the next section). The axial resolution is determined by the center
frequency and bandwidth of the ultrasonic detector; this was quantified to be 23 µm using the
“shift-and-sum” method as shown in [5].
3.2 Spatial resolution of FOCON
Figure 2(a) gives a detailed schematic of the optical illumination and detection in the
FOCON. The optical fiber (SM600, Thorlabs) has a numerical aperture (NA) of 0.12 and a
mode field diameter of 4.6 µm. The fiber collimator (PAF-X-7-A, Thorlabs) has a NA of 0.29
and an output beam waist diameter of 1.2 mm. The beam was further expanded to 10 mm in
diameter before it was focused by the objective lens, which yields an objective NA of 0.125.
Because the optical fiber acts as the pinhole, the lateral resolution of FOCON improves
from the lateral resolution of the LSOR-PAM and can be calculated as kλ/NA, where λ is the
optical wavelength, NA is the numerical aperture of objective lens, k is a coefficient from 0.37
to 0.51 depending on the mode field radius of the optical fiber [11]. Taking λ = 0.578 µm, NA
= 0.125, and the mode field radius of 2.3 µm, the lateral resolution of the confocal microscope
is around 2 µm in air.
#120567 - $15.00 USD Received 30 Nov 2009; revised 31 Dec 2009; accepted 4 Jan 2010; published 11 Jan 2010
(C) 2010 OSA 18 January 2010 / Vol. 18, No. 2 / OPTICS EXPRESS 1280
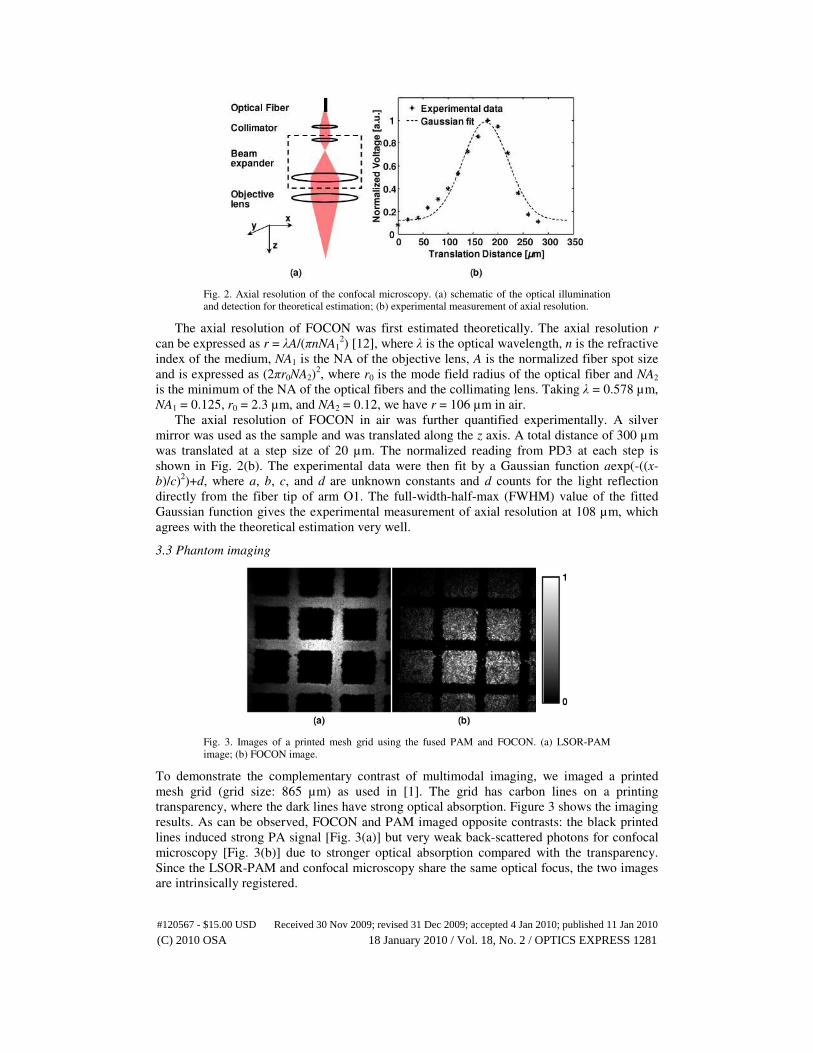
Fig. 2. Axial resolution of the confocal microscopy. (a) schematic of the optical illumination
and detection for theoretical estimation; (b) experimental measurement of axial resolution.
The axial resolution of FOCON was first estimated theoretically. The axial resolution r
can be expressed as r = λA/(πnNA12) [12], where λ is the optical wavelength, n is the refractive
index of the medium, NA1 is the NA of the objective lens, A is the normalized fiber spot size
and is expressed as (2πr0NA2)2, where r0 is the mode field radius of the optical fiber and NA2
is the minimum of the NA of the optical fibers and the collimating lens. Taking λ = 0.578 µm,
NA1 = 0.125, r0 = 2.3 µm, and NA2 = 0.12, we have r = 106 µm in air.
The axial resolution of FOCON in air was further quantified experimentally. A silver
mirror was used as the sample and was translated along the z axis. A total distance of 300 µm
was translated at a step size of 20 µm. The normalized reading from PD3 at each step is
shown in Fig. 2(b). The experimental data were then fit by a Gaussian function aexp(-((x-
b)/c)2)+d, where a, b, c, and d are unknown constants and d counts for the light reflection
directly from the fiber tip of arm O1. The full-width-half-max (FWHM) value of the fitted
Gaussian function gives the experimental measurement of axial resolution at 108 µm, which
agrees with the theoretical estimation very well.
3.3 Phantom imaging
Fig. 3. Images of a printed mesh grid using the fused PAM and FOCON. (a) LSOR-PAM
image; (b) FOCON image.
To demonstrate the complementary contrast of multimodal imaging, we imaged a printed
mesh grid (grid size: 865 µm) as used in [1]. The grid has carbon lines on a printing
transparency, where the dark lines have strong optical absorption. Figure 3 shows the imaging
results. As can be observed, FOCON and PAM imaged opposite contrasts: the black printed
lines induced strong PA signal [Fig. 3(a)] but very weak back-scattered photons for confocal
microscopy [Fig. 3(b)] due to stronger optical absorption compared with the transparency.
Since the LSOR-PAM and confocal microscopy share the same optical focus, the two images
are intrinsically registered.
#120567 - $15.00 USD Received 30 Nov 2009; revised 31 Dec 2009; accepted 4 Jan 2010; published 11 Jan 2010
(C) 2010 OSA 18 January 2010 / Vol. 18, No. 2 / OPTICS EXPRESS 1281
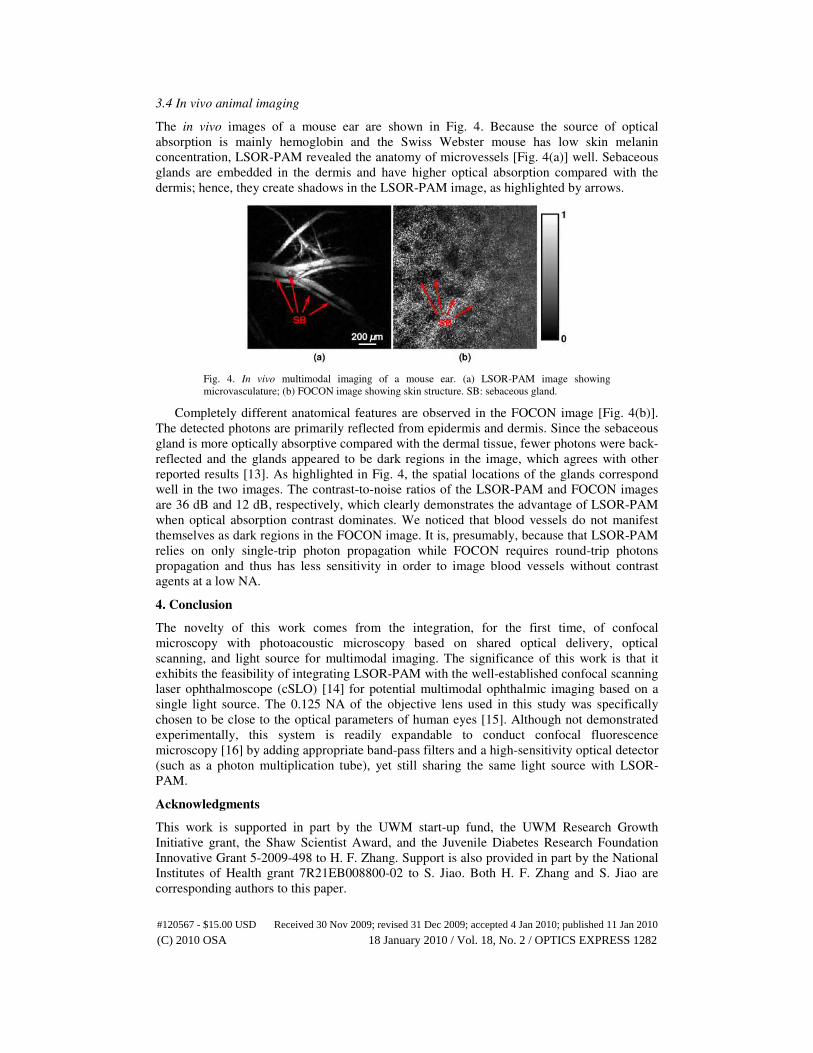
3.4 In vivo animal imaging
The in vivo images of a mouse ear are shown in Fig. 4. Because the source of optical
absorption is mainly hemoglobin and the Swiss Webster mouse has low skin melanin
concentration, LSOR-PAM revealed the anatomy of microvessels [Fig. 4(a)] well. Sebaceous
glands are embedded in the dermis and have higher optical absorption compared with the
dermis; hence, they create shadows in the LSOR-PAM image, as highlighted by arrows.
Fig. 4. In vivo multimodal imaging of a mouse ear. (a) LSOR-PAM image showing
microvasculature; (b) FOCON image showing skin structure. SB: sebaceous gland.
Completely different anatomical features are observed in the FOCON image [Fig. 4(b)].
The detected photons are primarily reflected from epidermis and dermis. Since the sebaceous
gland is more optically absorptive compared with the dermal tissue, fewer photons were back-
reflected and the glands appeared to be dark regions in the image, which agrees with other
reported results [13]. As highlighted in Fig. 4, the spatial locations of the glands correspond
well in the two images. The contrast-to-noise ratios of the LSOR-PAM and FOCON images
are 36 dB and 12 dB, respectively, which clearly demonstrates the advantage of LSOR-PAM
when optical absorption contrast dominates. We noticed that blood vessels do not manifest
themselves as dark regions in the FOCON image. It is, presumably, because that LSOR-PAM
relies on only single-trip photon propagation while FOCON requires round-trip photons
propagation and thus has less sensitivity in order to image blood vessels without contrast
agents at a low NA.
4. Conclusion
The novelty of this work comes from the integration, for the first time, of confocal
microscopy with photoacoustic microscopy based on shared optical delivery, optical
scanning, and light source for multimodal imaging. The significance of this work is that it
exhibits the feasibility of integrating LSOR-PAM with the well-established confocal scanning
laser ophthalmoscope (cSLO) [14] for potential multimodal ophthalmic imaging based on a
single light source. The 0.125 NA of the objective lens used in this study was specifically
chosen to be close to the optical parameters of human eyes [15]. Although not demonstrated
experimentally, this system is readily expandable to conduct confocal fluorescence
microscopy [16] by adding appropriate band-pass filters and a high-sensitivity optical detector
(such as a photon multiplication tube), yet still sharing the same light source with LSOR-
PAM.
Acknowledgments
This work is supported in part by the UWM start-up fund, the UWM Research Growth
Initiative grant, the Shaw Scientist Award, and the Juvenile Diabetes Research Foundation
Innovative Grant 5-2009-498 to H. F. Zhang. Support is also provided in part by the National
Institutes of Health grant 7R21EB008800-02 to S. Jiao. Both H. F. Zhang and S. Jiao are
corresponding authors to this paper.
#120567 - $15.00 USD Received 30 Nov 2009; revised 31 Dec 2009; accepted 4 Jan 2010; published 11 Jan 2010
(C) 2010 OSA 18 January 2010 / Vol. 18, No. 2 / OPTICS EXPRESS 1282