Embed Size (px)
Citation preview

UNIVERSITÀ DEGLI STUDI DI PADOVA
DIPARTIMENTO DI INGEGNERIA INDUSTRIALE
CORSO DI LAUREA
MAGISTRALE IN INGEGNERIA CHIMICA E DEI PROCESSI INDUSTRIALI
Tesi di Laurea Magistrale in Ingegneria Chimica e dei Processi Industriali
COLD PLASMA TREATMENT OF NYLON 6,6 TEXTILE TO
IMPROVE FLAME RETARDANCY
Relatore: Prof. Ing. Alessandra Lorenzetti Correlatore: Prof. Baljinder Kandola
Laureanda: Arianna Vendrame
ANNO ACCADEMICO 2017-2018

1

2
Abstract
The main objective of this work is to enhance the flame retardancy of Nylon 66 textile by
improving the effectiveness of the flame retardants treatment, i.e. the amount of flame retardant
uptake. One possible solution might be the usage of plasma to activate the fabric surface in
order to increase the add-on amount of flame retardants. Two types of cold plasma equipment
have been investigated: microwave atmospheric plasma using Ar and Ar/O2 gases and vacuum
plasma using He/O2 gas. First preliminary results have shown that better functionalisation can
be obtained by vacuum plasma machine, and therefore the study has proceeded analysing
deeply this kind of treatment .
The effect of several process parameters (power, time, ionized gas composition) on the
effectiveness of the subsequent flame retardant treatment (pad-mangle method) involving the
dipping into thiourea solution, has been analysed. The results showed that the add-on content
of thiourea can be improved by the vacuum plasma functionalisation of the textile, thanks to
the increase of the concentration of polar groups on the surface, as shown by FTIR analysis.
Because of the higher add-on content, it has also been shown that the limiting oxygen index of
functionalised fabrics was higher than that of unfunctionalised ones, thus proving the
effectiveness of plasma treatment in enhancing fire behaviour of Nylon textile. At the end, by
using a DOE methodology, after finding a suitable quadratic model, an optimized set of process
parameters has been identified and validated by experimental trial.

3
4
Riassunto
L’obiettivo principale di questo lavoro è di aumentare le prestazioni al fuoco del tessuto Nylon
66 migliorando l’efficacia del trattamento con i ritardanti di fiamma, come per esempio
l’assorbimento di ritardante. Una possibile soluzione può essere l’utilizzo del plasma per
attivare la superficie del tessuto in modo da aumentare l’assorbimento dei ritardanti di fiamma.
Due tipi di strumenti per il plasma a freddo sono stati presi in esame: il plasma atmosferico a
microonde usando come gas Ar e la miscela Ar/O2 e il plasma sottovuoto usando come gas la
miscela He/O2. Risultati preliminari hanno prima dimostrato che può essere ottenuta una
miglior funzionalizzazione con lo strumento sottovuoto, e quindi lo studio è proceduto
analizzando in maniera approfondita questo tipo di trattamento.
È stato studiato l’effetto di diverse variabili di processo (potenza, tempo, composizione del gas
ionizzato) sulla efficacia trattamento con il ritardante di fiamma (metodo pad-mangle), che
prevede l’immersione del tessuto nella soluzione di tiourea. I risultati hanno mostrato che il
contenuto di tiourea può essere migliorato con la funzionalizzazione del tessuto con il plasma
sottovuoto, grazie all’aumento della concentrazione di gruppi polari sulla superficie, come
dimostrato dall’analisi FTIR. Grazie all’aumento dell’assorbimento, è stato dimostrato anche
che l’indice di ossigeno dei tessuti funzionalizzati era più alto di quelli non funzionalizzati,
quindi provando l’efficacia del trattamento al plasma nel miglioramento del comportamento al
fuoco del tessuto di nylon. Alla fine, usando la metodologia DOE, dopo aver trovato un modello
quadratico appropriato, un set ottimizzato di parametri di processo è stato identificato con una
verifica sperimentale.

5
6
Index
INTRODUCTION............................................................................................................... .............1
CHAPTER 1 - POLYMERIC MATERIALS AND NYLON 66
FIBRES.............................................................................................................................................3
1.1 POLYMERIC MATERIALS……………………......................................................................... ..3
1.2 POLYAMIDES AND THEIR MAIN CHARACTERISTICS………………………………...........................................................................4
1.2.1 Classification of polyamides...................................................................................................5
1.3 STRUCTURE AND PROPERTIES OF NYLON 66…………………………………………....5
1.3.1 Synthesis of PA66…………………………………………………………………………...6
1.4 DEGRADATION MECHANISM OF NYLON 66…………………………………………………..6
1.4.1 Nonoxidative thermal degradation…………………………………………………………...7
1.4.2 Photo-oxidative degradation………………………………………………………………....8
1.5 NYLON FIBRES AND MELT SPINNING……………………………………………………10
1.6 FIELDS OF APPLICATION………………………………………………………………………….11
CHAPTER 2 - COLD PLASMA
TREATMENT...............................................................................................................................13
2.1 MAIN CHARACTERISTICS OF COLD PLASMA...........................................................................................................................................13
2.2 DIFFERENT PLASMA PRODUCTION USING ELECTRIC FIELDS………...................................................................................................................................14
2.2.1 Microwave plasma………………………………………………………………………..15
2.3 MODIFICATIONS PERFORMED FOR FIBRES AND POLYMER SURFACES…………..18
CHAPTER 3 - FLAME
RETARDANTS............................................................................... ..............................................21
3.1 COMBUSTION OF POLYMERS AND GENERIC FLMAE RETARDANTS……………………………...................................................................................... 21
7
3.2 EVOLUTION OF FLAME RETARDANTS FOR POLYAMIDES............................................................................................................................... .....24
3.2.1 Chlorinated and brominated compounds.........................................................................................................................................25
3.2.2 Phosphorous compounds.........................................................................................................................................25
3.2.3 Textile finishing....................................................................................................................26
3.2.4 Thiourea................................................................................................................................27
CHAPTER 4 - INSTRUMENTATION FOR THE
EXPERIMENTS.........................................................................................................................29
4.1 INFRARED SPECTROSCOPY IN FOURIER TRANSFORMED (FT-IR)....................................................................................................... .................................................29
4.1.1 Working principle of the spectrometer……………………………………………………..31
4.1.2 FTIR-ATR………………………………………………………………………………….32
4.2 THERMAL METHODS: THERMOGRAVIMETRIC ANALYSIS (TGA)..................................................................................................................................................33
4.3 LOI FOR FLAMMABILITY TEST.............................................................................................34
4.4 ULTRAVIOLET-VISIBLE SPECTROSCOPY (UV-Vis)...........................................................36
4.5 MORPHOLOGICAL CHARACTERISATION: SCANNING ELECTRON MISCROSCOPE……………………………………………………………………………………37
4.6 CAPILLARITY TEST………………………………………………………………………….39
CHAPTER 5 - EXPERIMENTS PERFORMED WITH ATMOSPHERIC AND
VACUUM PLASMA EQUIPMENT....................................................................................41
5.1 ATMOSPHERIC PLASMA TREATMENT.....................................................................................................................................42
5.1.1 SEM analyses: morphological information.........................................................................................................................................43
5.1.2 DPPH treatment: Ultraviolet-Visible Spectroscopy......................................................................................................................................46
5.1.2.1 Objective of DPPH study……………………………………………………………………..46
5.1.2.2 Procedure and materials……………………………………………………………………....48
5.1.2.3 Spectra results………………………………………………………………………………...49
5.1.3 FT-IR Spectra results……………………………………………………………………...51
8
5.1.3.1 Peak area normalisation…………………………………………………………………………… 52
5.2 FUNCTIONALISATION PROCESS AND PARAMETERS FOR VACUUM PLASMA.............................................................................................................................................54
5.2.1 Fixed and variable parameters……………………………………………………………..56
5.2.2 He/O2 ratio, power and time variation……………………………………………………..57
5.2.2.1 He/O2 volumetric ratio………………………………………………………………………..57
5.2.2.2 Activation of the surface versus plasma conditions……………………………………..……58
5.2.2.3 Treatment time………………………………………………………………………………..59
5.2.3 TGA Results………………………………………………………………………………..61
5.2.4 Impregnation in thiourea solution………………………………………………………….61
5.2.5 LOI Results…………………………………………………………………………..…….64
CHAPTER 6 - STATISTICAL
ANALYSIS....................................................................................................................................67
6.1 DESIGN OF EXPERIMENT…………………………………………………………………..67
6.1.1 Results analysed from the software…………………..........................................................68
6.1.2 Statistical analysis after ignoring first run………………………………………………....70
6.1.3 Optimisation……………………………………………………...………………………..73
6.1.4 FT-IR Spectra after soaking in thiourea solution…………………….…………………....74
6.1.5 SEM images for the optimised treatment………………………………………………….76
CONCLUSIONS.........................................................................................................................77
REFERENCES..............................................................................................................................79

9

1
Introduction
The particular hazard posed by burning textiles (like as clothing or textile for domestic
environment) is known since long. In many large-scale fires, the textiles present at each scene
have been the material ignited first by the relevant igniting source. It shall also be considered
that the fire behaviour of textile used in public environment (e.g. hotel, airport, public building)
is very important to guarantee the safety of the people staying inside. Finishing technologies
are a way to confer flame retardancy to textile when the fiber/fabric is impregnated by a solution
containing a flame retardant. However, flame retardants are costly and, in some cases, toxic and
therefore there is a need to reduce their use but still maintaining the same level of flame
retardancy. Plasma processing can be used to modify surface of textile by etching,
functionalization, plasma coating (grafting) and desizing. The modified surfaces can be made
either hydrophilic or hydrophobic depending on the selection of appropriate gas or precursors
to form plasma as well as plasma reactor conditions. Surface modification, as a sole process or
as a pre-treatment, can effectively be used for functional finishing of textile materials; for
example, special finishes such as antistatic and antisoiling finish for synthetics, flame retardant
and water-repellent finishes for cotton can be imparted using this treatment.
Therefore, in this work we’ll analyse the use of plasma processing to modify nylon textile
surface and improve the flame retardant uptake (in particular thiourea) during the finishing
process. The main aim is to be able to reduce the concentration of thiourea needed to reach a
certain degree of flame retardancy. Since the limiting oxygen index (LOI), has proved to be a
very effective indicator of ease of ignition, it will be used to assess the usefulness of plasma
treatment in promoting flame retardancy of Nylon 6,6 textile.
Now we present the structure of the thesis, in order to point out the main points. In the first
chapter we give some information regarding thermoplastic and thermosetting polymers, in
particularly about the polyamides. Then we proceed with the description of Nylon 6,6 synthesis
and its degradation process; fibres are formed through the melt spinning process. A general
view of their field of application is given in the following §. In chapter 2 we explain how plasma
works, focusing on the two microwave equipment used for this study. Later we illustrate the
modifications caused on surface polymers thanks to this type of treatment. In chapter 3 instead
Chapter 1 - Polymeric materials and Nylon 66 fibres
2
we present the main characteristics of flame retardants, the different modes of action and their
classification, with then more attention for thiourea compound, the favorite flame retardant for
Nylon 66. In chapter 4 we give an overview of the instruments used in the experimental part;
we use the FTIR and TGA instruments; then we explain how we obtain the LOI value to
evaluate the fire performances of the textile, that will be treated in different ways. We also show
the UV-Vis spectroscopy equipment to understand the DPPH analysis presented in the
following chapter. SEM operating principles are given, indeed morphological information is
needed to study Nylon surface; the last method is the capillarity test, to see if plasma can
increase liquid rise on the material. In chapter 5 and 6 we explain the experimental part of this
thesis. In chapter 5 we describe in detail the atmospheric and vacuum plasma instruments and
the related analyses performed on the fabric. For the atmospheric machine we analyse Nylon
exploiting DPPH analysis, SEM images, FTIR spectra. Concerning the vacuum plasma
equipment, we evaluate the best conditions to treat our woven thanks to capillarity test and
FTIR spectra; in this way we choose the values for time, power and the gas ratio of He/O2
mixture. TGA plots of nylon and of the processed one are reported as well. In chapter 6 we
present the results concerning the DOE study, to find the values for time and power that can
guarantee the highest improvement of LOI with respect unfunctionalized nylon, using the
vacuum plasma equipment. Considerations will be done to assess if plasma is effectively
working in improving LOI values, and if it happens, we should justify this behaviour.

3
Chapter 1
Polymeric materials and Nylon 66 fibres
In this chapter we deal with a generic explanation about polymeric materials and, particularly,
about polyamides, since the topic of this dissertation concerns PA 66. Then we proceed focusing
only on Nylon 66 fibres. First we illustrate the principal characteristics and the degradation
process of this material, then the process to obtain these fibres. At the end we introduce the
field of application of this thermoplastic polymer.
1.1 Polymeric materials
Polymeric materials, in other words plastics, are formed by monomeric units bounded together
to form a linear chain or macromolecule. Usually polymers are constituted by organic
macromolecules. They are divided into natural (cotton, cellulose, proteins) and synthetic
polymers (nylon, PE, polyesters, polyisoprene). Their properties can be defined from the
number of the structural units that form the macromolecule and from the weak interactions
between macromolecules.
The degree of polymerisation, that is the total number of monomeric units of one
macromolecule, and the molecular weight are two important parameters related to polymers.
They can be distinguished in two big groups: thermoplastic and thermosetting polymers.
Thermoplastic polymers can be easily re-formed, by increasing temperature we obtain a viscous
liquid, and by cooling they are solid again. So, their formation process is reversible. For
example, nylon is a thermoplastic polymer.
Instead thermosetting polymers are formed in presence of a cross-linking agent, and irreversible
chemical bonds are formed; this is called curing process (hardening of a polymer). They are
insoluble, infusible cross-linked polymers, that do not soften after further heating, actually they

Chapter 1 - Polymeric materials and Nylon 66 fibres
4
decompose; this means that the transition from solid to liquid state is irreversible. For rubber,
the curing process is called vulcanisation.
Increasing the number of reticulations, the rigidity increases, they are stronger than the previous
ones; because of the three-dimensional crosslinking and covalent bonds they cannot easily
break. They are characterised by a fragile behaviour as opposed to thermoplastic polymers.
They are used for their thermal and dimensional stability when heated.
To conclude, thanks to their easy processability, low cost, and the many fields of application,
polymers are so important nowadays in our life.
1.2 Polyamides and their main characteristics
Polyamides are thermoplastic polymers that belong to the Engineering Plastics
(tecnopolymers), therefore they are characterised by high performances; these polymers can
support high temperatures, bending, vibration, friction tests, and so on.
These polymers are produced either by reaction of a diacid with a diamine or by ring-opening
polymerisation of lactams. They contain the characteristic amide group CO-NH. Both N-H and
C=O are polar groups, hence secondary bonds between adjacent macromolecules are formed
(Fig. 1.1). Thanks to these hydrogen bonds, these polymers have high tensile strength, very
good hardness, high wear resistance; since the molecules absorb water, they are able to deform
and to resist the impact, in fact water acts as plasticiser.
Moreover, their structure determines the high degree of crystallisation, and this is responsible
for the good mechanical properties of polyamides. These features are useful in the field of
fibres, automotive parts, industrial valves and other industry uses.
Fig. 1.1: Hydrogen bonds and characteristic group in polyamides
In the following paragraph we discuss about the different structures that polyamide can have.
Chapter 1 - Polymeric materials and Nylon 66 fibres
5
1.2.1 Classification of polyamides
Polyamide polymers can be subdivided into three groups: aliphatic, semi-aromatic, fully
aromatic thermoplastics.
• Aliphatic polyamides or Nylon: the most important are Nylon 66 and Nylon 6. They
have good mechanical performances, given that they have high melting temperature
and glass transition temperature. The main limitations are the moisture sensitivity and
the resulting change in mechanical properties.
• Aromatic polyamides or aramids: they include an aromatic functional group in the
monomer structure. This class of polymers has unique properties, indeed the aromatic
content reinforces the material; they do not burn, they are resistant to solvents at room
and elevated temperatures and they melt at high temperatures, thanks to the strong
bonds between aramid chains. The most known aramid is Kevlar®, which is used to do
bulletproof vest. Compared to Nylon, Kevlar and Nomex fibres are much more
crystallised and rigid. Moreover, aramidic fibres can undergo deformation before
breaking, indeed they are more tough than carbon or glass fibres.
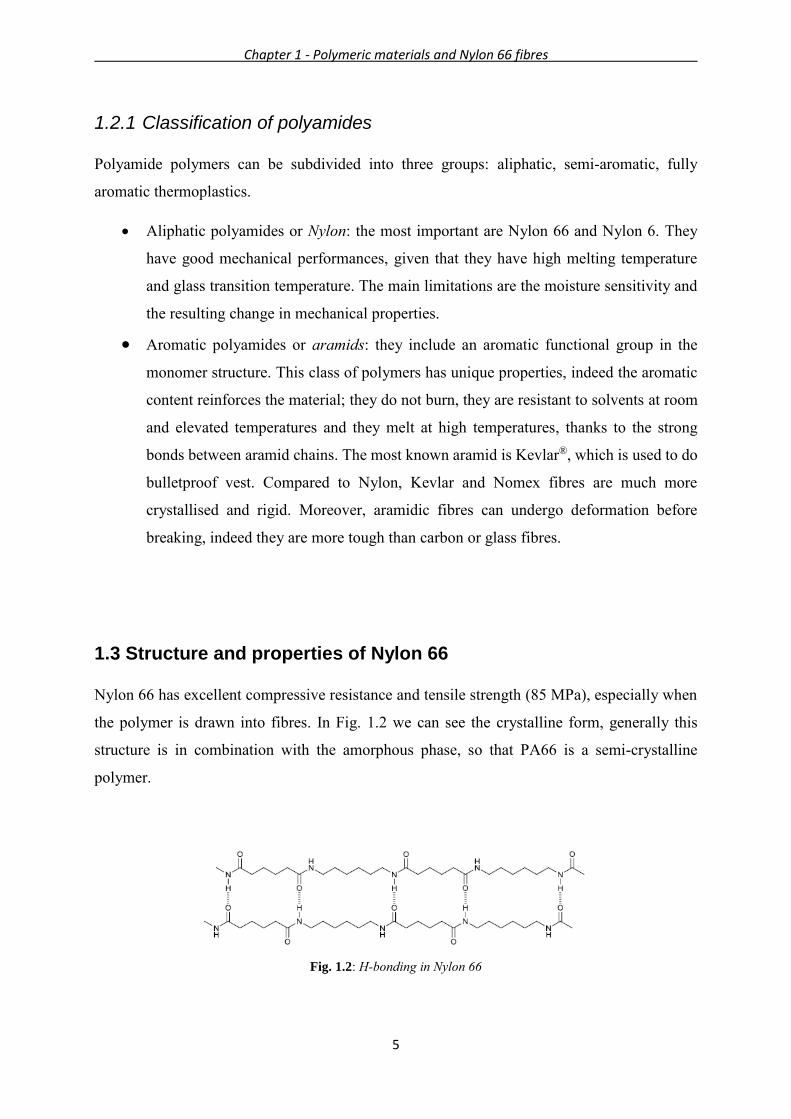
1.3 Structure and properties of Nylon 66
Nylon 66 has excellent compressive resistance and tensile strength (85 MPa), especially when
the polymer is drawn into fibres. In Fig. 1.2 we can see the crystalline form, generally this
structure is in combination with the amorphous phase, so that PA66 is a semi-crystalline
polymer.
Fig. 1.2: H-bonding in Nylon 66
Chapter 1 - Polymeric materials and Nylon 66 fibres
6
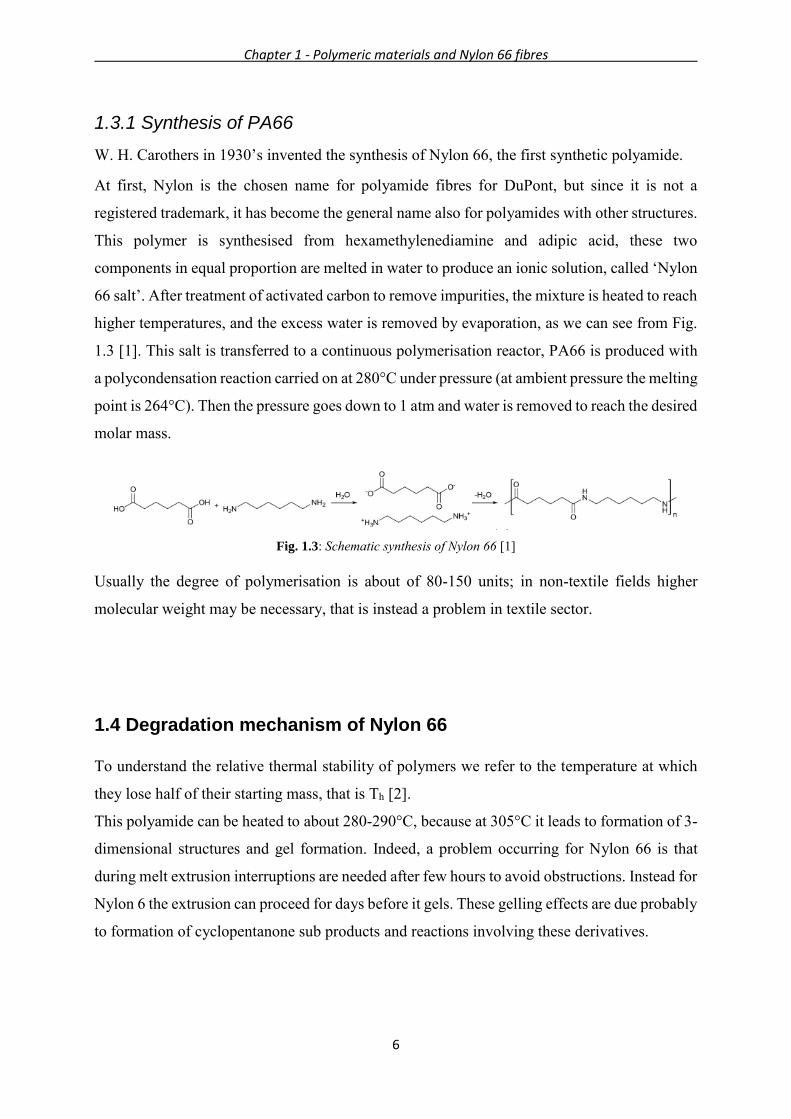
1.3.1 Synthesis of PA66
W. H. Carothers in 1930’s invented the synthesis of Nylon 66, the first synthetic polyamide.
At first, Nylon is the chosen name for polyamide fibres for DuPont, but since it is not a
registered trademark, it has become the general name also for polyamides with other structures.
This polymer is synthesised from hexamethylenediamine and adipic acid, these two
components in equal proportion are melted in water to produce an ionic solution, called ‘Nylon
66 salt’. After treatment of activated carbon to remove impurities, the mixture is heated to reach
higher temperatures, and the excess water is removed by evaporation, as we can see from Fig.
1.3 [1]. This salt is transferred to a continuous polymerisation reactor, PA66 is produced with
a polycondensation reaction carried on at 280°C under pressure (at ambient pressure the melting
point is 264°C). Then the pressure goes down to 1 atm and water is removed to reach the desired
molar mass.
Fig. 1.3: Schematic synthesis of Nylon 66 [1]
Usually the degree of polymerisation is about of 80-150 units; in non-textile fields higher
molecular weight may be necessary, that is instead a problem in textile sector.
1.4 Degradation mechanism of Nylon 66
To understand the relative thermal stability of polymers we refer to the temperature at which
they lose half of their starting mass, that is Th [2].
This polyamide can be heated to about 280-290°C, because at 305°C it leads to formation of 3-
dimensional structures and gel formation. Indeed, a problem occurring for Nylon 66 is that
during melt extrusion interruptions are needed after few hours to avoid obstructions. Instead for
Nylon 6 the extrusion can proceed for days before it gels. These gelling effects are due probably
to formation of cyclopentanone sub products and reactions involving these derivatives.

Chapter 1 - Polymeric materials and Nylon 66 fibres
7
Now we present the nonoxidative thermal degradation, that occurs in an oxygen-free
environment, and the photo-oxidative degradation, in presence of oxygen and light.
1.4.1 Nonoxidative thermal degradation
Random chain scission is the principal decomposition process of polyamides, illustrated in
Fig. 1.4 [1].
Fig. 1.4: General reaction for random chain scission for an aliphatic polymer
A lot of products, like the monomer, are the result of this process; breaks at random points leads
to different species.
End chain scission, called also depolymerisation, is in addition to the random chain scission
(illustrated in Fig. 1.5). In this case there is a break at the end of the chain, leading to the loss
of monomer units.
Fig. 1.5: General reaction for end chain scission for an aliphatic polymer
Breakings occur at -NH-CH2- bond, to give ammonia, carbon dioxide, carbon monoxide,
cyclopentanone and its derivatives, cyclohexane, indeed during degradation ring-forming is
very common to be observed.
Also isocyanate groups have been reported in thermal degradation of Nylon 66, and not for
Nylon 6, as we can see from Fig. 1.6 [3]:
Fig. 1.6: Mechanism of thermal degradation for Nylon 66 with intra-molecular end-biting

Chapter 1 - Polymeric materials and Nylon 66 fibres
8
Now we want to address this topic more specifically showing the reactions leading to these
compounds, by referring to model compounds studied in the last 60 years.
• Formation of cyclopentanone and isocyanate is shown in Fig. 1.7 [1]:
Fig. 1.7: Intramolecular reaction in PA66
• In Fig. 1.8, instead, we report the one that is commonly accepted as the primary chain
scission, that leads to production of free amide and C=C bond.
Fig. 1.8: Degradation of model PA66 hexamethylene diamide
• Cross-linking causes condensation mechanisms, leading to ammonia; secondary amines
derive from primary amines, and then we obtain tertiary amines from cross-linking of
secondary and primary amines. So, we can allocate the formation of ammonia to cross-
linking that occurs in Nylon 66, as we can see from Fig. 1.9.
Fig. 1.9: Cross-linking in PA66
1.4.2 Photo-oxidative degradation
In presence of oxygen the decomposition process proceeds faster, because it can react with
carbon present along the chain; first we observe the formation of polymer alkyl radicals thanks
to thermic energy, then the degradation goes further and leads to the formation of peroxide
radicals caused by the presence of oxygen. In turn, ROOH catalyses other degradation reactions
at T higher than 120°C. We can see the general mechanism that involves also polyamides in
Fig. 1.10.

Chapter 1 - Polymeric materials and Nylon 66 fibres
9
Fig. 1.10: The general Bolland and Gee reaction scheme for a polymer oxidation
When photo-oxidation occurs, the radical reactions are analogous to those reported in Fig. 1.10.
As the mechanism suggestes for photo-oxidation of polyamides [4], the decomposition of
hydroperoxides leads to the production of carbonyl groups, as we can see in Fig. 1.11:
Fig. 1.11: Photo-oxidative degradation mechanism for polyamides proposed by Do et al. [4]
According to those studies, there is a single photo-oxidation mechanism during the process,
that leads to an increase in carbonyl group concentration. For polyamides the primary photo-
oxidation involves the oxidation of methylene group adjacent to -NH- group. Moreover, the
diffusion of oxygen is related to the structure of the polymer: its presence involves mainly the
amorphous phase, it decomposes continuously with exposure time. Oxygen has difficulties in
diffusing in the crystalline phase, indeed the structure is more rigid and more packed.
In the following paragraph we explain the process to obtain Nylon 66 fibres, starting from
Nylon chips.

Chapter 1 - Polymeric materials and Nylon 66 fibres
10
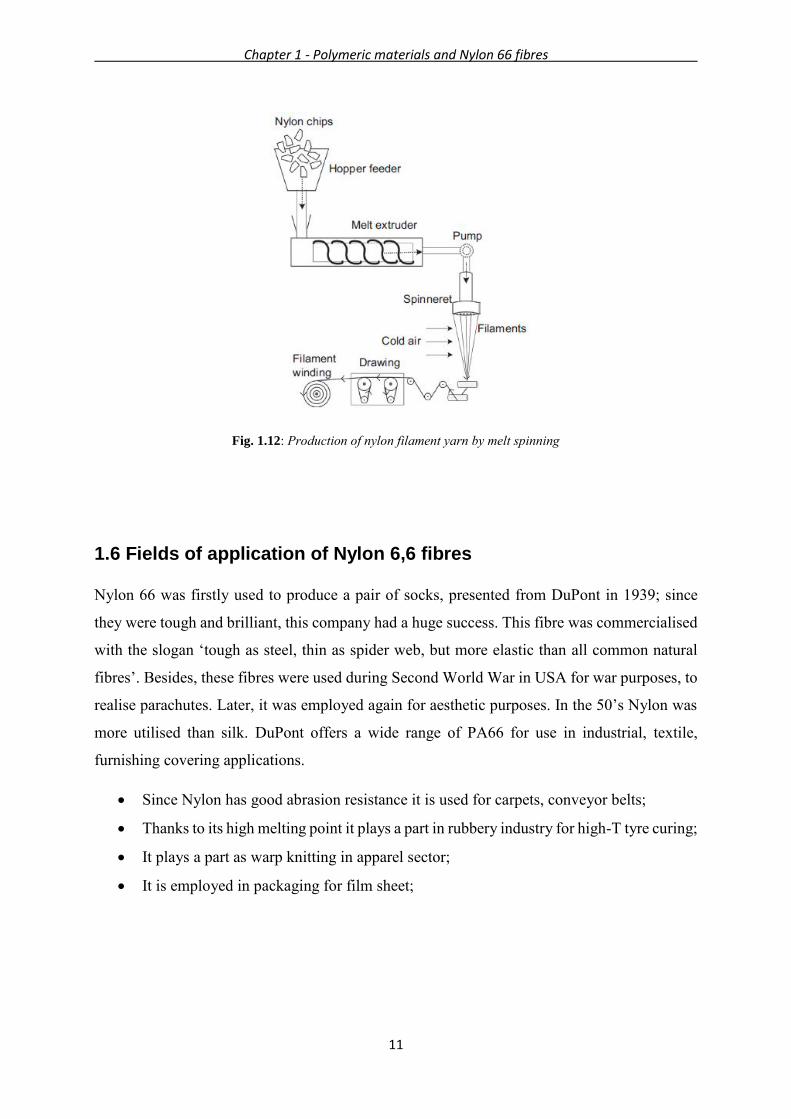
1.5 Nylon fibres and melt spinning
In the textile industry Nylon 66 is most diffused in Nord America, compared to Nylon 6 fibres
that are instead more common in Europe.
For the fabrication of Nylon fibres (see Fig. 1.12), we start from chips, or pellets (3-5 mm) that
are melted at a temperature of around 300°C; then the polymer is extruded through a spinneret,
a die composed of multiple orifices; the molten polymer is pumped at a constant pressure to
form fine filaments. The application of optimum shear rates and frequent mixing of the melt
are necessary. The molten material must be continuously cleaned and purified to avoid
obstructions (they cause weak points), so it goes through a filter called screen pack. The fibres
are drawn to their final diameter, stretched to the required diameter and solidified in a water
bath or by forced convection. The drawing procedure is required to enhance fibre properties,
like tensile strength and stiffness. This process is called melt spinning, in particular normal
spinning. This is possible because Nylon can melt without degrading. As follows we list the
principal moments of this process [5]:
• Feed: after the melting of chips in the extruder, the material passes through the spinneret
at a controlled pressure and temperature. There are some pumps that control the polymer
flux. Before the stretching, the polymer reaches a T higher than the glass transition T,
so that there is mobility of the macromolecules.
• Spinneret: these dies are realised in metal alloy, which can resist high P and corrosive
materials.
• Collection: after the cooling, the yarn is collected in control rolls and drive rolls, and
then the drawn yarn is wounded up in the bobbin and strained to have partial orientation.
The product of spinning process is called P.O.Y., or Pre-Oriented Yarn, which can have
different shapes of section. This is further subjected to other processing techniques, from an
aesthetic, functional and tactile point of view. Then it is necessary to stretch and extend the
yarn, so the molecular chains are parallel.
Chapter 1 - Polymeric materials and Nylon 66 fibres
11
Fig. 1.12: Production of nylon filament yarn by melt spinning
1.6 Fields of application of Nylon 6,6 fibres
Nylon 66 was firstly used to produce a pair of socks, presented from DuPont in 1939; since
they were tough and brilliant, this company had a huge success. This fibre was commercialised
with the slogan ‘tough as steel, thin as spider web, but more elastic than all common natural
fibres’. Besides, these fibres were used during Second World War in USA for war purposes, to
realise parachutes. Later, it was employed again for aesthetic purposes. In the 50’s Nylon was
more utilised than silk. DuPont offers a wide range of PA66 for use in industrial, textile,
furnishing covering applications.
• Since Nylon has good abrasion resistance it is used for carpets, conveyor belts;
• Thanks to its high melting point it plays a part in rubbery industry for high-T tyre curing;
• It plays a part as warp knitting in apparel sector;
• It is employed in packaging for film sheet;
Chapter 1 - Polymeric materials and Nylon 66 fibres
12
In particular we want to focus on textile industry. Nylon fabrics are used for hosiery products
when they are made of 15 denier monofilaments, indeed they are characterised by good elastic
recovery. In general, Nylon filament is widely used in dress sector, for example wool is blended
to improve its durability, especially in the case of overclothes or floor coverings. In addition,
this technical textile is used for tyre cords for trucks, airplanes, then also for sail clothes, canvas
for luggage.
For this project it is important to highlight another application of this polymer. From 1940s
military world has employed Nylon 66 in different components of soldier equipment: military
wear can be light and can have high tearing strength, then backpack, stay cord, military
footwear.

13
Chapter 2
Cold plasma treatment
In this chapter we want to explain in detail what cold plasma is, why it is used, and to highlight
its applications in textile sector. First of all, it is a dry, environmental, worker-friendly method
that can be divided into atmospheric and vacuum plasma; both of them have advantages and
disadvantages that we are going to list. We are interested in the equipment employed in textile
sector, since we deal with Nylon 66 fabric.
2.1 Main characteristics of cold plasma
Plasma is an ionised gas, electrically neutral because the positive and negative charges offset
each other; it is an electrically conducting medium.
Increasing the temperature, we pass from solid state, to liquid state, then to gaseous phase, and
finally to plasma condition; it is composed by excited atomic, molecular, ionic and radical
species with free electrons and photons. It is required to provide enough additional energy to
gases; if energy is sufficient, a bond electron may be excited, and it becomes a free electron,
hence the atom is ionised. The minimum required energy to free an electron is called ionisation
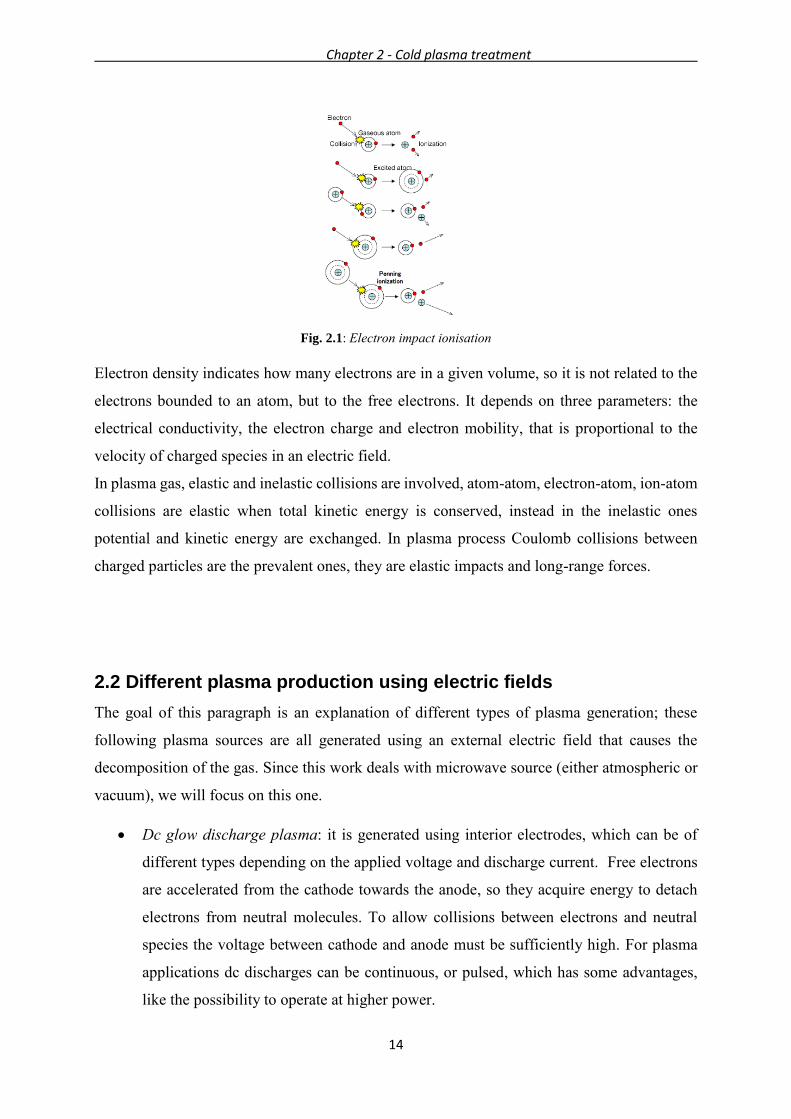
energy. As we can notice in Fig. 2.1, charged particles are emitted when electrons bump into
neutral particles of the gas. One possibility to generate plasma is thermal energy, another one
is the application of an electric field to a neutral gas.
In cold plasma temperature of electrons can reach also 30000 K, but the bulk temperature is
approximately equal to the ambient one.
The interactions between particles are at long radius; every charged particle is influenced by all
other ones, so it means that plasma behaves like a unitary fluid.
Chapter 2 - Cold plasma treatment
14
Fig. 2.1: Electron impact ionisation
Electron density indicates how many electrons are in a given volume, so it is not related to the
electrons bounded to an atom, but to the free electrons. It depends on three parameters: the
electrical conductivity, the electron charge and electron mobility, that is proportional to the
velocity of charged species in an electric field.
In plasma gas, elastic and inelastic collisions are involved, atom-atom, electron-atom, ion-atom
collisions are elastic when total kinetic energy is conserved, instead in the inelastic ones
potential and kinetic energy are exchanged. In plasma process Coulomb collisions between
charged particles are the prevalent ones, they are elastic impacts and long-range forces.
2.2 Different plasma production using electric fields
The goal of this paragraph is an explanation of different types of plasma generation; these
following plasma sources are all generated using an external electric field that causes the
decomposition of the gas. Since this work deals with microwave source (either atmospheric or
vacuum), we will focus on this one.
• Dc glow discharge plasma: it is generated using interior electrodes, which can be of
different types depending on the applied voltage and discharge current. Free electrons
are accelerated from the cathode towards the anode, so they acquire energy to detach
electrons from neutral molecules. To allow collisions between electrons and neutral
species the voltage between cathode and anode must be sufficiently high. For plasma
applications dc discharges can be continuous, or pulsed, which has some advantages,
like the possibility to operate at higher power.
Chapter 2 - Cold plasma treatment
15
• Radio frequency plasma: it is necessary to apply a radio frequency field to a gas. The
selected frequency range is 1-100 MHz, with wavelengths of 300-3 m. It can operate
over a high interval of pressures.
• Microwave plasma: the excitation is different from the previous case, sources’
frequency value is higher than 300 MHz, normally the selected one is 2450 MHz.
Microwave discharge can work either under vacuum or at atmospheric pressure.
• Dielectric barrier discharge: it operates at atmospheric pressure; for example there is a
plasma equipment in Huddersfield, UK, that aims to treat and functionalise textiles at
atmospheric pressure and at an industrial scale. The advantage is that the vacuum
equipment is not needed, reducing the operating costs.
We can distinguish between the power absorption and the power reflection, and of course the
objective is to minimize the second one, indeed it indicates the lost power during the generation
plasma process. The power absorption can be calculated using Eq. 2.1 [6]:
𝑃𝑎𝑏𝑠
𝑉=
1
2𝑛𝑒
𝑒2
𝑚𝑒𝜈
𝜈2
𝜈2 + 𝜔2𝐸0
2 (𝐸𝑞. 2.1)
where 𝑛𝑒 is electron density, 𝑒 and 𝑚𝑒 are respectively electron charge and mass, 𝜈 electron
collision frequency, 𝜔 the angular frequency of electromagnetic.
2.2.1 Microwave plasma
The principal components of microwave plasma are power supply, a circulator, the applicator
and the plasma load; the applicator has the goal to minimise power reflection and therefore to
maximise the transferred energy into plasma gas.
Plasma density depends on microwave power and pressure, microwave plasmas are
characterised by high density, especially at a pressure of 0.1 mbar; they work up to the
atmospheric pressure; moreover a higher number of electrons that can cause ionisation is
generated with this source.
First, we list the process parameters of the microwave atmospheric plasma used for this
experimental part; the structure is simple and costs are lower because no equipment for vacuum
generation is needed.
Chapter 2 - Cold plasma treatment
16
• Number of scans: number of forward and backward paths of the flame over the material.
The flame passes on the surface with a certain distance and the switch from forward to
backward path is automatic;
• Distance of the material from the nozzle: it depends on the treated material, decreasing
the distance the treatment is more efficient, but we must be careful not to damage or
burn the sample;
• Type of gas used for the ionisation and its flow-rate [cm3/min]: flowmeter is present
for the regulation;
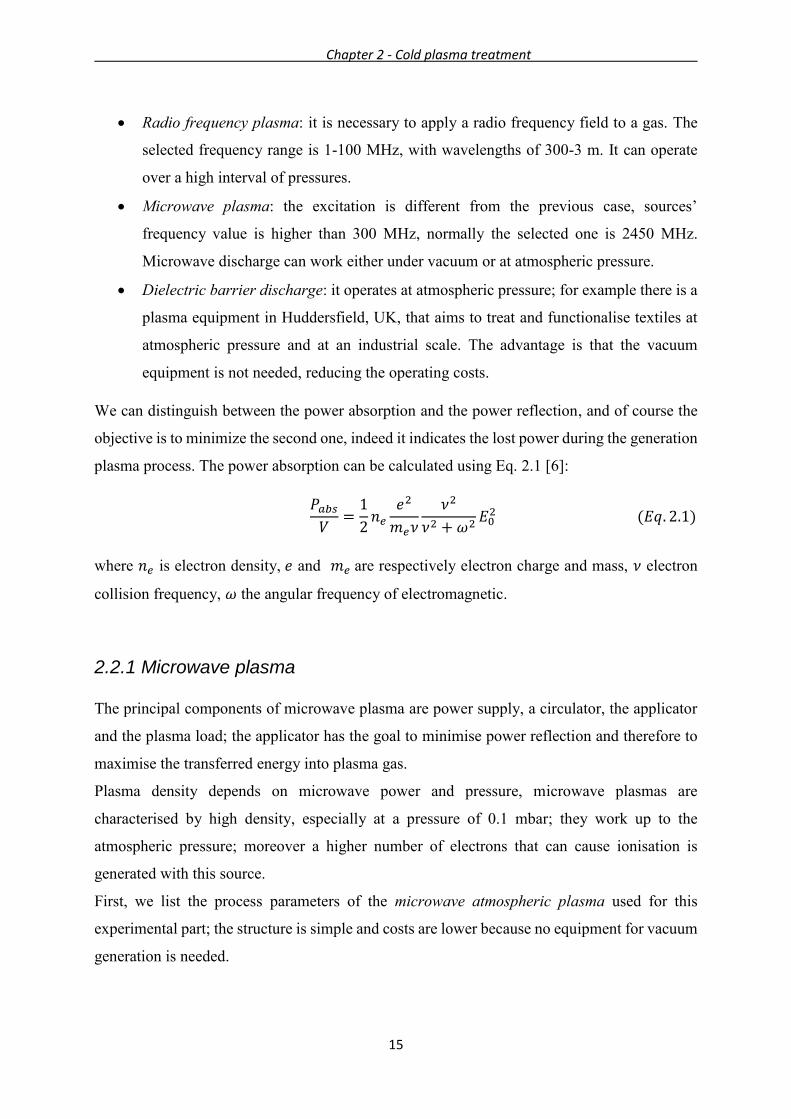
• Forward power [W]: increasing the power also the electron density grows. The
maximum forward power that we can apply in the equipment used for this study is 300
W. In Fig. 2.2 we can notice how the regulation occurs;
Fig. 2.2: Microwave power supply to regulate the power
Concerning the vacuum microwave plasma, the processing parameters are the following:
• Pressure [mbar]: we regulate the flow of gas entering the reactor to control the pressure.
At low pressure collisions between particles are fewer than using high pressure, so the
gas is less reactive. In this case the costs are more relevant;
• Power [W]: the density of the plasma increases with power;
• Distance of the sample from the lamp;
• Time of treatment [s]: it depends on the material inside the chamber, on the power and
on the gas used. For example, it is possible to establish the necessary time to increase
Chapter 2 - Cold plasma treatment
17
wettability on textiles measuring the contact angle, the time that guarantees the
maximum contact angle is the one needed for that fabric;
• Type of gas and flow-rate [cc/min]. As explained later, depending on the project target
a proper gas has to been selected;
• Frequency [MHz]: usually it is selected between the range 2450-2470 MHz.
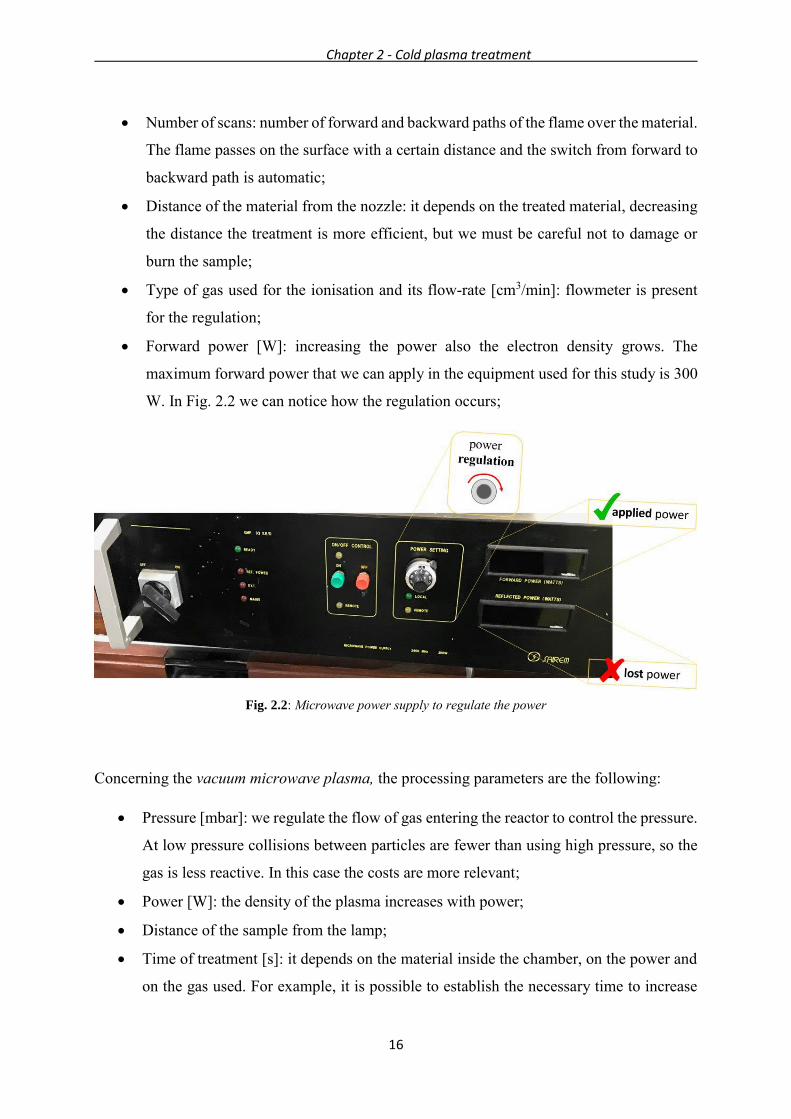
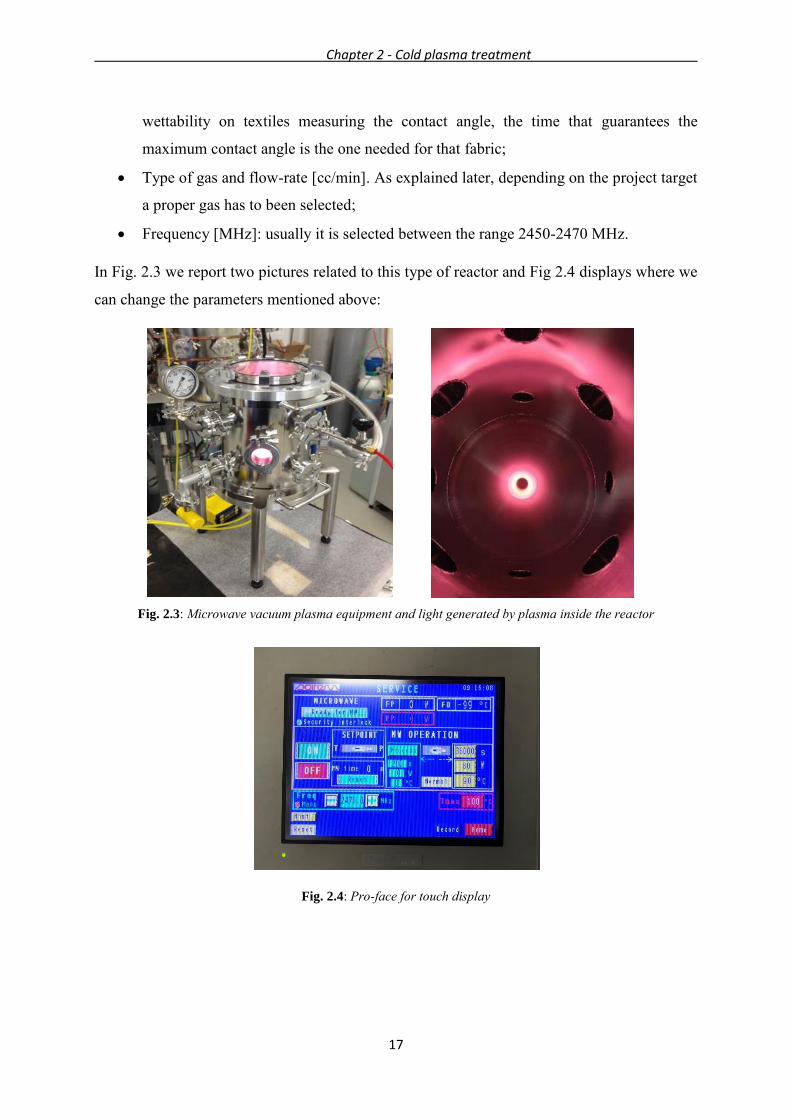
In Fig. 2.3 we report two pictures related to this type of reactor and Fig 2.4 displays where we
can change the parameters mentioned above:
Fig. 2.3: Microwave vacuum plasma equipment and light generated by plasma inside the reactor
Fig. 2.4: Pro-face for touch display
Chapter 2 - Cold plasma treatment
18
2.3 Four modifications performed for fibres and polymer surfaces
In textile industry plasma device is useful to modify the polymeric fibres and their properties
avoiding high water usage and limiting their damage.
We can distinguish between three main categories for plasma gases: inert gas plasmas, oxygen
plasmas and nitrogen-containing plasmas.
In general, the principal aim is to change the surface to a high-energy state and to generate polar
groups.
Below we report some general information about the main effects of plasma on textile surfaces:
• Cleaning and etching (ablation): thanks to the ablation of the treated material volatile
products are formed, oxygen containing plasma removes organic contaminants from
polymer surfaces, producing volatile species. Indeed, contaminants like oils withstand
hydrogen abstraction caused by radicals, ions, electrons present in the plasma.
As regards the etching process, along polyamide structure C-H, C-N, C-C, N-H groups
are subjected to chain breaking. In presence of air or oxygen methylene carbons adjacent
to the amide carbonyls are oxidised.
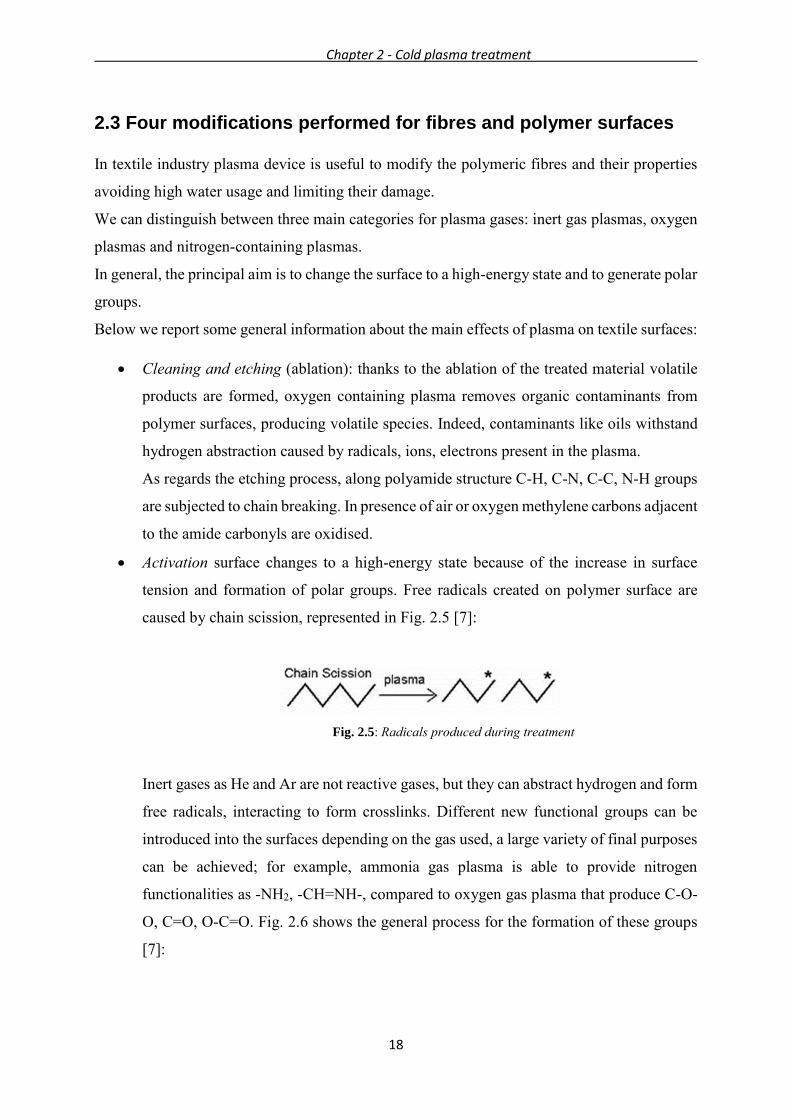
• Activation surface changes to a high-energy state because of the increase in surface
tension and formation of polar groups. Free radicals created on polymer surface are
caused by chain scission, represented in Fig. 2.5 [7]:
Fig. 2.5: Radicals produced during treatment
Inert gases as He and Ar are not reactive gases, but they can abstract hydrogen and form
free radicals, interacting to form crosslinks. Different new functional groups can be
introduced into the surfaces depending on the gas used, a large variety of final purposes
can be achieved; for example, ammonia gas plasma is able to provide nitrogen
functionalities as -NH2, -CH=NH-, compared to oxygen gas plasma that produce C-O-
O, C=O, O-C=O. Fig. 2.6 shows the general process for the formation of these groups
[7]:

Chapter 2 - Cold plasma treatment
19
Fig. 2.6: Surface activation of a general polymeric surface
For instance, the goal of the activation of technical polymers is the adhesion of coatings.
• Grafting: one possible advantage of using plasma technique is to bond a monomer on
the textile structure with covalent bonds; in this case the monomer (usually acrylic acid,
amine) is introduced inside the chamber where the plasma is generated. The monomer
can react with the radicals produced on the material and is grafted to the surface. In this
way it is possible to change the properties of the polymer, and for example its wettability
is enhanced. Usually bond permanency is achieved, and the adhesion is not damaged by
external factors.
• Dyeing and printing: thanks to oxygen plasma treatment the capillarity of some
materials increases [8]. Below we show Eq. 2.2-2.7 ion and electron generation,
radicals’ formation, and final products of heat and light occurring with oxygen plasma.
This plasma can increase wettability of textile, dyeing, thanks to the excited state of O2
and O (O2*, O*).
𝑒− + 𝑂2 → 𝑂2+ + 2𝑒− (𝐸𝑞. 2.2)
𝑒− + 𝑂2 → 𝑂 + 𝑂 (𝐸𝑞. 2.3)
𝑒− + 𝑂2 → 𝑂2∗ + 2𝑒− (𝐸𝑞. 2.4)
𝑂2∗ → ℎ𝜗 (𝐸𝑞. 2.5)
𝑒− + 𝑂 → 𝑂∗ (𝐸𝑞. 2.6)
𝑂∗ → ℎ𝜗 (𝐸𝑞. 2.7)

Chapter 2 - Cold plasma treatment
20

21
Chapter 3
Flame retardants
In this chapter we will face a general view of the combustion cycle of polymers, and the
principal steps of Nylon 66 burning mechanism; then we will focus on the main features of
flame retardants and their mechanisms of action, their use for textiles, and especially
polyamides. Finally, a separate explanation about thiourea is necessary, since this work deals
with this compound.
3.1 Combustion of polymers and generic flame retardants
Combustion is a chemical reaction of oxidation, generating light and heat.
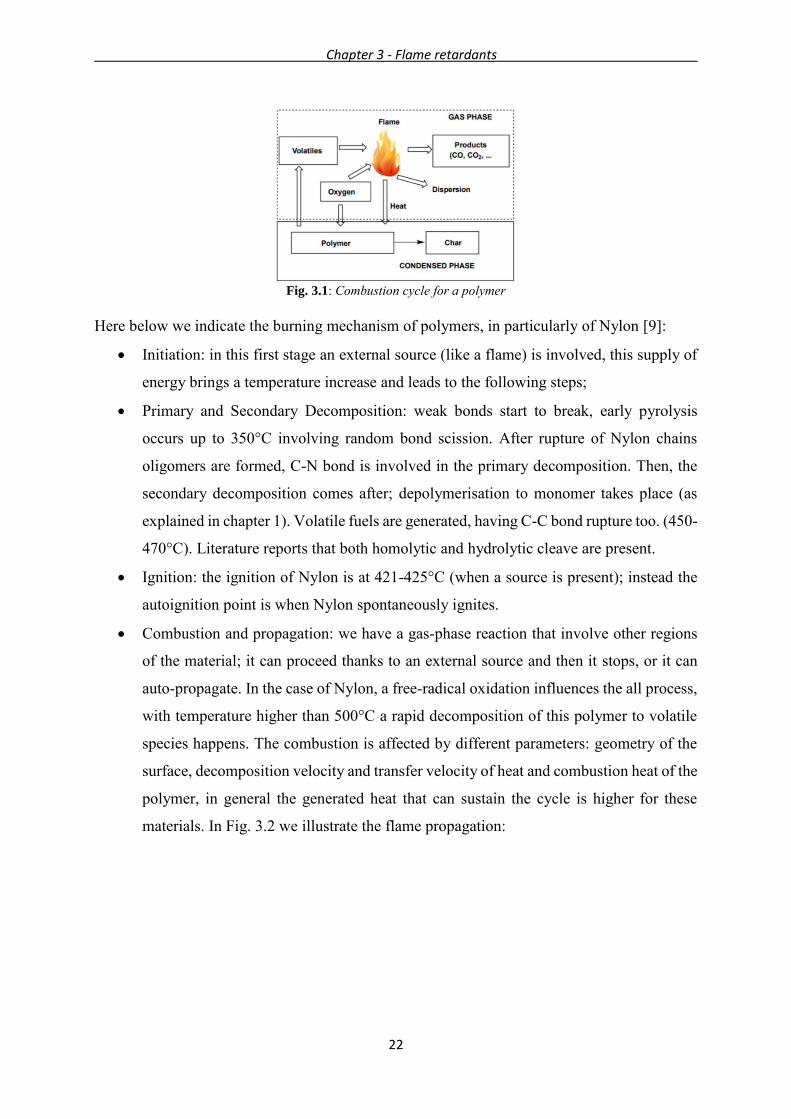
As follow we want to explain the combustion cycle of polymers, indicated in Fig. 3.1. When
the polymer is degrading products are in gas phase, heat is released and in this way the
combustion is self-sustaining. To have combustion the gas mixture must stay within
flammability limits. The combustion is based on 4 stages: pre-heating, ignition, combustion
and propagation. So, when these passages occur, the released heat is very high and it is partially
transferred to the polymer; if decomposition velocity is sufficiently high and the concentration
of volatile components stays within combustion range the cycle is self-sustaining and so the
polymer still burns.
Chapter 3 - Flame retardants
22
Fig. 3.1: Combustion cycle for a polymer
Here below we indicate the burning mechanism of polymers, in particularly of Nylon [9]:
• Initiation: in this first stage an external source (like a flame) is involved, this supply of
energy brings a temperature increase and leads to the following steps;
• Primary and Secondary Decomposition: weak bonds start to break, early pyrolysis
occurs up to 350°C involving random bond scission. After rupture of Nylon chains
oligomers are formed, C-N bond is involved in the primary decomposition. Then, the
secondary decomposition comes after; depolymerisation to monomer takes place (as
explained in chapter 1). Volatile fuels are generated, having C-C bond rupture too. (450-
470°C). Literature reports that both homolytic and hydrolytic cleave are present.
• Ignition: the ignition of Nylon is at 421-425°C (when a source is present); instead the
autoignition point is when Nylon spontaneously ignites.
• Combustion and propagation: we have a gas-phase reaction that involve other regions
of the material; it can proceed thanks to an external source and then it stops, or it can
auto-propagate. In the case of Nylon, a free-radical oxidation influences the all process,
with temperature higher than 500°C a rapid decomposition of this polymer to volatile
species happens. The combustion is affected by different parameters: geometry of the
surface, decomposition velocity and transfer velocity of heat and combustion heat of the
polymer, in general the generated heat that can sustain the cycle is higher for these
materials. In Fig. 3.2 we illustrate the flame propagation:

Chapter 3 - Flame retardants
23
Fig. 3.2: Schematic representation of propagation of the flame
The mechanism of combustion is a free radical process, as we can see from Eq. 3.1 - 3.3, the
propagation is highly exothermic:
𝐻𝑂. + 𝐶𝑂 ↔ 𝐶𝑂2 + 𝐻. (𝐸𝑞. 3.1)
𝐻. + 𝑂2 ↔ 𝑂𝐻. + 𝑂. (𝐸𝑞. 3.2)
𝐻𝑂. + 𝐻. → 𝐻2𝑂 (𝐸𝑞. 3.3)
Polymeric materials are highly inflammable, therefore flame retardants are required to spread
their use also in sectors where the risk for fire is relevant. They must be stable at the melting
temperature of the polymer and their smokes must be not corrosive or dark.
In general, flame retardants can slow down or stop combustion cycle of polymers. All of them
can decrease the velocity of heat transferred to the polymer, reaching a value lower than the
one required for the self-combustion. We can identify different mechanisms of action:
• Halogen compounds, as brominated and chlorinated additives, can inhibit propagation
reactions of combustion by reacting with OH. and H., generating X. radicals that are
more stable; they act via chemical method by promoting termination reactions. Then,
halogen acids are re-generated extracting hydrogen atoms from hydrocarbon species.
Usually they are used at 10-20%.
Their mechanism is indicated in Eq. 3.4 - Eq. 3.7:
𝐻𝑋 + 𝐻. → 𝐻2 + 𝑋 . (𝐸𝑞. 3.4)
𝐻𝑋 + 𝑂𝐻. → 𝐻2𝑂 + 𝑋 . (𝐸𝑞. 3.5)
𝑋 . + 𝑅𝐻 → 𝑅. + 𝐻𝑋 (𝐸𝑞. 3.6)
𝑋 . + 𝐻. ↔ 𝐻𝑋 (𝐸𝑞. 3.7)

Chapter 3 - Flame retardants
24
• Phosphorous derivatives (DMPP, TCEP, etc.) that act on two fronts: they react with
radicals inhibiting gas phase, and furthermore promoting char formation acting on solid
phase. If condensate phase is promoted, few gaseous products are formed. Char
formation does not permit the diffusion of volatile species to the surface generating a
charred barrier that protects the underlying polymer and stops the thermo-oxidation of
the polymer. For example, ammonium and melamine polyphosphates support char
formation in polymer as polyamides, in addition to the dilution of vapor phase.
In the condensate phase phosphoric compounds are converted in phosphoric and then
metaphosphoric acid, which polymerises at high temperatures. With dehydration of the
polymer carbonaceous layer is formed.
Also inorganic compounds like silica or nanoclays inside the polymer promote
generation of char, other co-additives favour reticulation of char, that in this way is more
isolating. (Both chemical and physical actions are present).
• Metallic inorganic hydroxides, as trihydrate alumina (Al2O3∙3H2O) or magnesium
hydroxide (Mg(OH)2), are characterised by endothermic decomposition, so they absorb
heat, cooling the solid phase; since a cooling occurs, the burning velocity decreases. At
T higher than 200°C alumina generates steam and, in addition, the products of these
reactions dilute the products of the gas phase reducing the optic density; a further
advantage is that gaseous species are not anymore within flammability limits. They act
with a physical method.
They are not corrosive, not expensive, but they should be used at high concentrations.
• Flame retardants that contain expandable graphite: when it is exposed to fire its volume
increases by 100 times because of the expansion of its layered structure. So, the material
becomes incandescent, but it does not burn (chemical method).
3.2 Evolution of flame retardants for polyamides
Now we focus on flame retardants for this group of thermoplastic polymers; thermic
conductivity of polyamides is 0.23 − 0.27 𝑊𝐾 ∙ 𝑚⁄ , after burning they produce high amount
of heat. Aramide textiles have flame retardant characteristics because of the aromatic structure,
usually they are finished with other coatings to improve this property. We will focus on flame
Chapter 3 - Flame retardants
25
retardants for aliphatic polyamides, like Nylon 66, indicating the most common flame
retardants and their features.
3.2.1 Chlorinated and brominated compounds
The most common chlorinated additive used for many years is a polycyclic polychlorinated
compound, in combination with zinc borate allows lower smoke production and UV stability,
but thermal stability is not satisfied [10].
One of the significant brominate additive for polyamides is decabromodiphenyl oxide, but for
Nylon 66 negative aspects are discoloration and slight blooming; usually it is applied for textiles
with a synergist, but other less expensive flame retardants are available, so it is not anymore
commercially used. Alternatively, there are polymeric brominated flame retardants like
brominated polystyrenes with higher thermal stability.
Nowadays they have been substituted because of environmental issue and another problem is
that they are less effective for polyamides since, according to a study, hydrohalic acids that are
formed cause chemical degradation of these synthetic polymers. A consequence is the
decreasing of activation energy and the decomposition species do not change with bromo flame
retardants [10].
3.2.2 Phosphorous compounds
Most important phosphorous flame retardants are red phosphorous, melamine polyphosphate,
aluminium phosphonates; this typology of additives, as said before, act on both phases.
Red phosphorous, compared to other P-additives, resists to high temperatures and so it is
perfectly appropriate for PA66 that has a high melting point; RP produces P4 that later burns to
give P2O5, it can enhance char formation. It can be used in combination with flame retardants
based on nitrogen, therefore most efficient additives are those containing both phosphorous and
nitrogen.
Aluminium diethylphosphonates can be used with melamine polyphosphate, indeed they have a
synergistic behaviour for Nylon 66; the first one generates 𝑃𝑂. radicals acting on gas phase,
instead the second one can work on condensate phase improving cross-linking between hetero
atoms in amide groups. Another improvement can be obtained adding for example zinc borate,
that enhance the formation of char barrier [1] for this polymer; flame retardants that can form
strong bonds and increase cross-linking are necessary, for example three-dimensional structure
Chapter 3 - Flame retardants
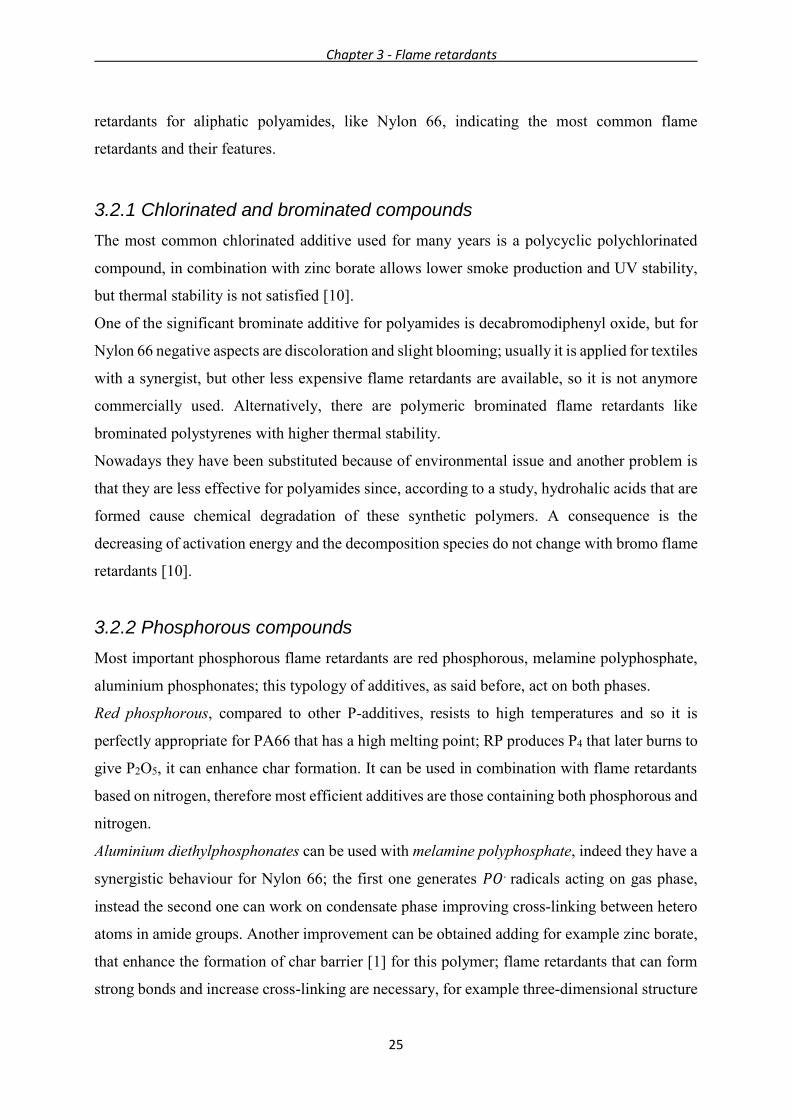
26
from the polymerisation of metaphosphoric acid can be employed to retard the combustion of
the polymer, shown in Fig. 3.3.
Fig. 3.3: Polymerisation of metaphosphoric acid
Alternatives to the previous examples without halogens or P are glass fibres, polymer cannot
be damaged by heat thanks to expandable char formed on its surface. They behave like
intumescent systems because they can increase in volume when exposed to temperature.
3.2.3 Textile finishing
The relevant problem connected to fire retardants for PA66 is the high processing temperature
(above 280°C), indeed the majority of additives is not thermally stable. Moreover, they can
reduce the strength of these fibres obtained by melt spinning. Monsanto and Solutia companies
have proposed two solutions: the former a phosphine dicarboxylic acid, but it is too expensive,
the latter a compound called Phosgard® that can add a phosphinate unit into Nylon structure,
but it is still being developing.
To introduce flame retardants in the fabric different possibilities are available:
• Reactive method or copolymerisation: they react with molecular structure of the
polymer becoming a permanent modification; the advantages are the durability of this
treatment during washings and the homogeneity of the flame retardant in the material.
It is more expensive and it is necessary to modify the synthesis process of the polymer;
• Use of compounds that are mixed with the polymer during polymerisation procedure;
• Padding or spraying of an aqueous solution: flame retardants are impregnated to
polymer surface with a padder; in this case they have to be soluble in water or in alcohol
because the textile with this procedure is dipped inside the solution.

Chapter 3 - Flame retardants
27
3.2.4 Thiourea
For this work thiourea has been used to treat Nylon 66 textile, so in this paragraph we will
provide some information about it.
According to literature review, thiourea (H2NCSNH2) has always been a proper flame retardant
for Nylon, probably because of the synergistic effect of nitrogen and sulphur. Its use is
appropriate for fabric coating, specially for fabric we are dealing with and cotton. It works by
enhancing dripping in Nylon textile, by decreasing melt viscosity and the melting point of this
polyamide. Usually this flame retardant is dissolved in water and applied using a laboratory pad
mangle to eliminate the excess of the solution; then fabrics are dried in the oven.
According to DSC curve studied by Gilleo [9] the decomposition mechanism of Nylon changes
after thiourea impregnation: an endothermic peak at 270°C occurs, this shows a reaction
between Nylon and thiourea; he also observes an exothermic peak at 420°C occurs, it is not due
to the decomposition of this flame retardant, indeed its decomposition temperature has not been
defined; so it must be attributed to something different that is occurring in Nylon breakdown.
Therefore, thiourea is capable of promoting dripping and of modifying mechanism degradation
as well, highlighting difficulty in understanding how it really acts on this polymer. Melting
point of control Nylon 66 is 250°C, after applying thiourea it is around 200°C.
Different possible ways with which it acts are list here below [9]:
• Interaction with carboxylic groups;
• Reaction with amide groups;
• Nucleophilic attack by sulphur atom on polyamide bond;
• Deactivation of free radicals present in both phases;
• Reactions with species formed after homolytic cleavage in the condensed phase.
Now issues for human health and environmental safety regarding the use of thiourea are present,
since it is a suspected carcinogen; it decomposes producing toxic fumes of nitrogen oxides and
sulphur oxides, and it is toxic to aquatic organisms.
To improve durability of this treatment formulations of thiourea-formaldehyde are
applicated to technical fabrics, treatment based on 1950-1980 chemistry. For Nylon finishing
the structure of thiourea-formaldehyde oligomer with an acid catalyst is available to obtain a
durable treatment because of the bonds between the amide groups of this polyamide and the
finishing; its formula is NH2C(=S)NH[CH2-NH-C(=S)NH]nCH2OH. The reason why this
mixture works is connected to the chemical processes that are involved, indeed cross-linking

Chapter 3 - Flame retardants
28
reactions are enhanced after its application. In Fig. 3.4 we represent the structure of urea-
formaldehyde resin as flame retardant.
However, formaldehyde is a human cancerogenic compound, a highly reactive and flammable
gas and it can react violently with other substances as acids. For these reasons its use should be
avoided, when it is possible.
Fig. 3.4: Urea-formaldehyde resin as flame retardant
To conclude, we can say that in general inherently flame retardants have not been a success for
polyamide fabrics, but only for aramids. Flame retardants must resist to PA66 processing
temperature and be not dangerous for human and environmental health. Polyamides when
heated show the inclination to gel and form cross-linking, but flame retardants are
unsatisfactory [11]. Novel flame retardants and innovatory solutions to treat fibres must be
found to guarantee good performances and costs, replacing formaldehyde-based structures.
29
Chapter 4
Instrumentation for the experiments
In this chapter we will analyse the four instruments that are used for the experimental part of
this thesis: infrared spectroscopy in Fourier transformed FT-IR, thermogravic analysis TGA,
LOI for flammability test, ultraviolet-visible spectroscopy UV-Vis and SEM machine. These
tools are used to analyse PA 66 fabric after plasma treatment to determine what kind of changes
are involved, and after soaking in thiourea solution to study the changes in flame retardancy.
The objective is to comprehend if there are improvements compared to samples that are not
exposed to plasma gas in the reaction chamber. Moreover, even if the polyamides are already
hydrophilic polymers, another point of interest is the increase in wettability of Nylon 66 textile,
reason why we perform also capillarity test. Hence, we will give the standard rules to study this
aspect.
4.1 Infrared spectroscopy in Fourier Transformed (FT-IR)
This technique is based on the molecular absorption in infrared range (0.78-1000 µm), it is also
called vibration spectroscopy: a molecule must have dipole moment to be visible with FT-IR,
when molecules are exposed to infrared radiations, the energy given by the ray is converted in
vibrational energy and molecular distance and bond angle vary thanks to this energy. Dipole
moment µ changes (only with polar molecules), so the molecule vibrates and produce an
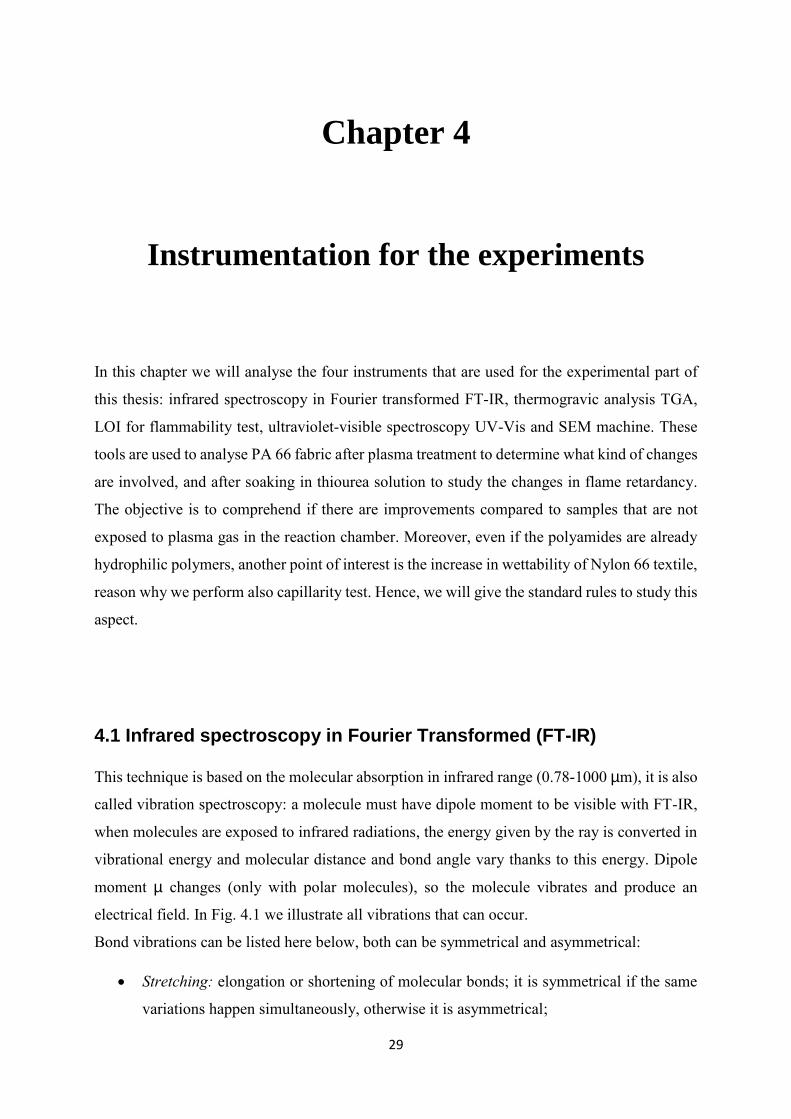
electrical field. In Fig. 4.1 we illustrate all vibrations that can occur.
Bond vibrations can be listed here below, both can be symmetrical and asymmetrical:
• Stretching: elongation or shortening of molecular bonds; it is symmetrical if the same
variations happen simultaneously, otherwise it is asymmetrical;
Chapter 4 - Instrumentation for the experiments
30
• Bending: deformations that can be on the plane (rocking and scissoring: angle
modification) or out of the plane (wagging and twisting).
Degrees of freedom of a species with N atoms are 3N-5 for a linear molecule and 3N-6 for a
non-linear one.
Fig. 4.1: Bond variations
Spectrum at wavenumbers lower than 1600 cm-1 is called the finger print region, here all
characteristic absorptions for that molecule are present; instead for wavenumbers higher than
1600 cm-1 all functional groups are present at the same wavenumber, no matter what the
structure of the molecule is.
Assuming vibration bonds behave as harmonic oscillator, we calculate vibration frequency with
Eq. 4.1:
𝜈 =1
2𝜋𝑐√
𝑘
𝑚 (𝐸𝑞. 4.1)
where 𝜈 is wave number [cm-1], 𝑐 light speed, 𝑘 the constant of force [N/m] and 𝑚 the reduced
mass of the two atoms [𝑚1 ∙ 𝑚2𝑚1 + 𝑚2
⁄ ].
According to the model of quantum mechanics, only certain values of energy are allowed, ∆𝐸
is the right energy to provide to the molecule, so that it can jump to another energy level, bearing
in mind that ∆𝐸 = ℎ ∙ 𝜈, where ℎ is the Planck constant.
Thanks to FT-IR spectra both quantitative and qualitative analyses can be done: the former
when spectra are registered in absorbance, using the Lambert-Beer law (Eq. 4.2) we can find
concentration, instead the latter it is performed when spectra are in transmittance.
𝐴 = 𝜀 ∙ 𝑐 ∙ 𝜆 = ln𝐼0
𝐼 (𝐸𝑞. 4.2)
Chapter 4 - Instrumentation for the experiments
31
where 𝐴 is the absorbance, 𝐼0 is the intensity of the radiation sent towards the sample, 𝐼 the one
emitted, 𝜀 coefficient of molar extinction, 𝑐 the concentration and 𝜆 is the length of the optical
path (the reciprocal of 𝜈).
𝜀 is constant for a substance at a precise 𝜆. So, it is possible to calculate the concentration of
that species after knowing its absorbance. Infrared radiations with frequency in the range 4000-
400 cm-1 are sent to the sample and the spectra shows the absorbed peaks, from which we can
understand what bonds are present.
Normalisation of peak area method is a way to calculate the normalised intensity of a specific
peak to understand the amount of that functional group in the sample. The normalisation is
considered with respect to a reference peak. Same peaks must be analysed using always the
same coordinates of the region and of the baseline.
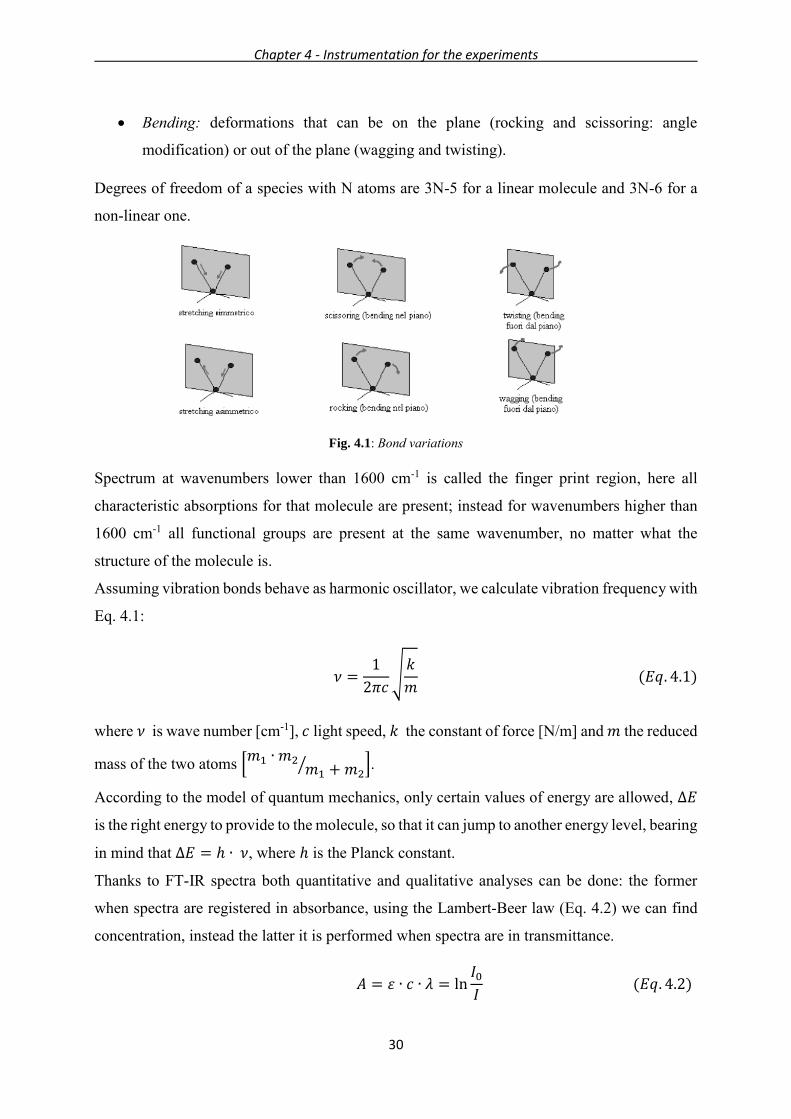
4.1.1 Working principle of the spectrometer
FTIR spectrometers are different from dispersive spectrometers, indeed they are based on
Michelson Interferometer and they do not have monochromator; what we obtain is an
interferogram, where intensity is plotted with time, then the Fourier Transformed calculates the
plot source intensity - frequency. There are three mirrors: the fixed one, the moving one and
the beamsplitter (in Fig. 4.2).
Fig. 4.2: Scheme and equipment of FTIR spectrometer with Michelson interferometer
The radiation is sent towards the beam-splitter, where it is divided in two parts thanks to the
semi-transparent mirror: one goes to the moving mirror, the other one to the fixed mirror. Then
Chapter 4 - Instrumentation for the experiments
32
after being recombined they are direct to the sample and to the detector, generating the
interferogram. At the detector we have the intensity that varies with time, indeed time domain
is connected to the position of the moving mirror (and so the transmittance of the sample). The
interferometer converts the time domain into the frequency one.
Before collecting the spectra of the sample, it is necessary to collect the one referred to the
background.
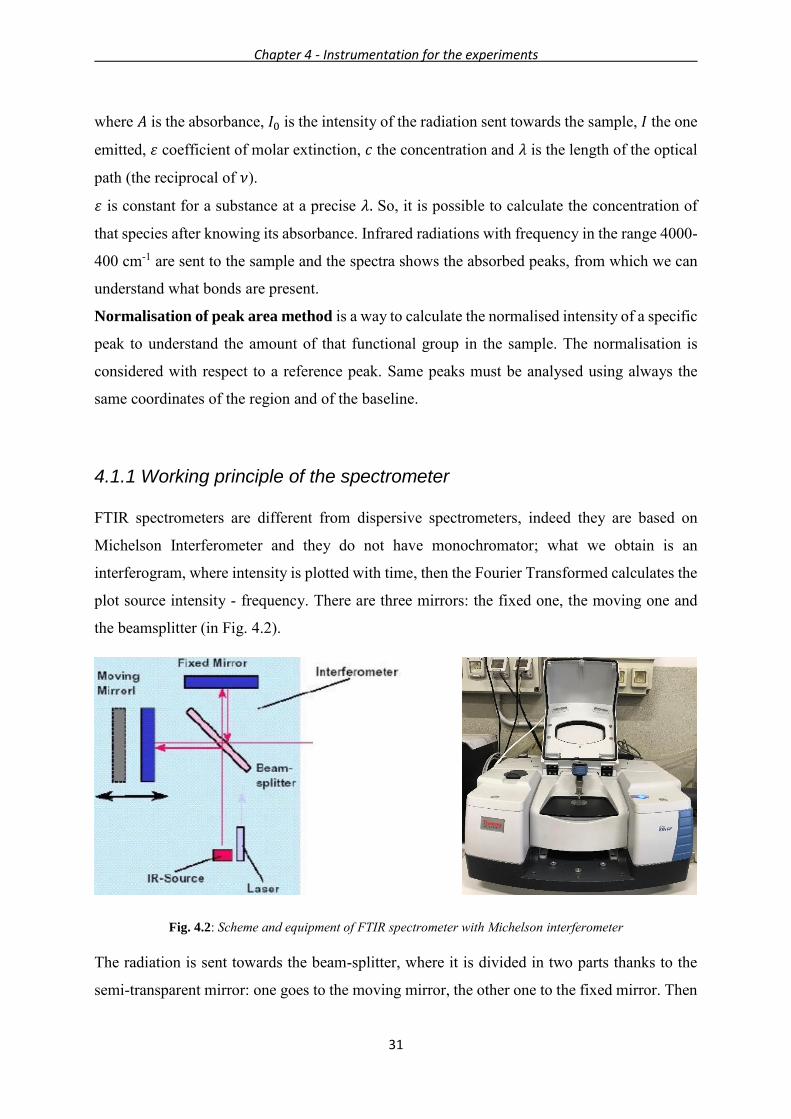
4.1.2 FTIR-ATR
Attenuated total reflectance technique is specially applied to solid samples, it is utilised for
superficial analyses, for dark or with high thickness samples that cannot be characterised by IR
spectroscopy in transmittance. The sample is pressed on the superior side of a crystal (ZnSe or
GeSe). The radiation penetrates inside the sample for some angstrom, then there is a reflected
component (it depends on degree of inclination) that goes towards the ATR crystal and after
that it goes again towards the sample; this path is repeated many times. In Fig. 4.3 it is shown
how this technique works.
If the sample is solid, it is positioned inside the instrument as a tablet with some KBr, for
example, that does not absorb infrared radiation. It is necessary to mix some KBr with the
interest material and then they are pressed at high pressure.
Also here spectra can be read either in absorbance or transmittance.
Fig. 4.3: How ATR-FTIR works
In Tab. 4.1 we report the wavenumber absorptions for the principal functional groups that can
be found in FTIR spectra:

Chapter 4 - Instrumentation for the experiments
33
Tab. 4.1: Characteristic absorptions in cm-1 for the most important functional groups
4.2 Thermal methods: thermogravimetric analysis (TGA)
The mass sample is recorded and it is plotted against temperature (thermogram) after a precise
heating program; for this study we use SDT-Q600, TA Instruments, shown in Fig. 4.4.
Fig. 4.4: SDT-Q600 TGA

Chapter 4 - Instrumentation for the experiments
34
Inside the chamber two sensitive analytical balances are present, on these two alumina pans are
positioned: one is empty and is the reference, instead inside the other one the sample (solid or
liquid) is positioned, its mass is in the range 5-15 mg. We can run the experiment under nitrogen
(inert atmosphere) or under air (oxidising atmosphere). From the computer heating rate and
heating program are chosen; for the dynamic analysis we choose a certain heating rate, for the
isothermal one instead the temperature is constant.
From the percent weight versus time, we can calculate for example the amount of organic and
inorganic species inside the sample, the decomposition temperature, etc.
Depending on different factors the plot changes:
• Gas flow should not be too high to avoid problems for the degradation process;
• Mass of the sample: if it weights too much, the heat cannot diffuse homogeneously
inside the material;
• Heating rate: we should avoid high heating rates because increasing this parameter also
decomposition temperature raises, hence we obtain incorrected results.
4.3 LOI for flammability test
Many flammability tests are possible to evaluate performances of the studied material after fire
exposure: UL 94 Vertical Flame Test, Cone Calorimeter, Hot Wire Index (UL 746C), Glow
Wire Test, and finally Limiting Oxygen Index. Different criteria are adopted depending on the
observed response: time of extinguishment, smoke formation, etc.
LOI test is performed to evaluate flammability behaviour of Nylon 66 according to ISO 4589-
2 standard; the apparatus creates a mixture of oxygen and nitrogen with a constant flow rate of
about 500 cm3/s, the desired concentration is chosen by the operator. On the base a glass tube
with open top is present, inside the textile material is kept in a metal clamp (80 mm by 15 cm).
After the gas fills the cylinder, we perform the analysis. We should apply the flame for 30 s
checking every 5 s if there is ignition [12].
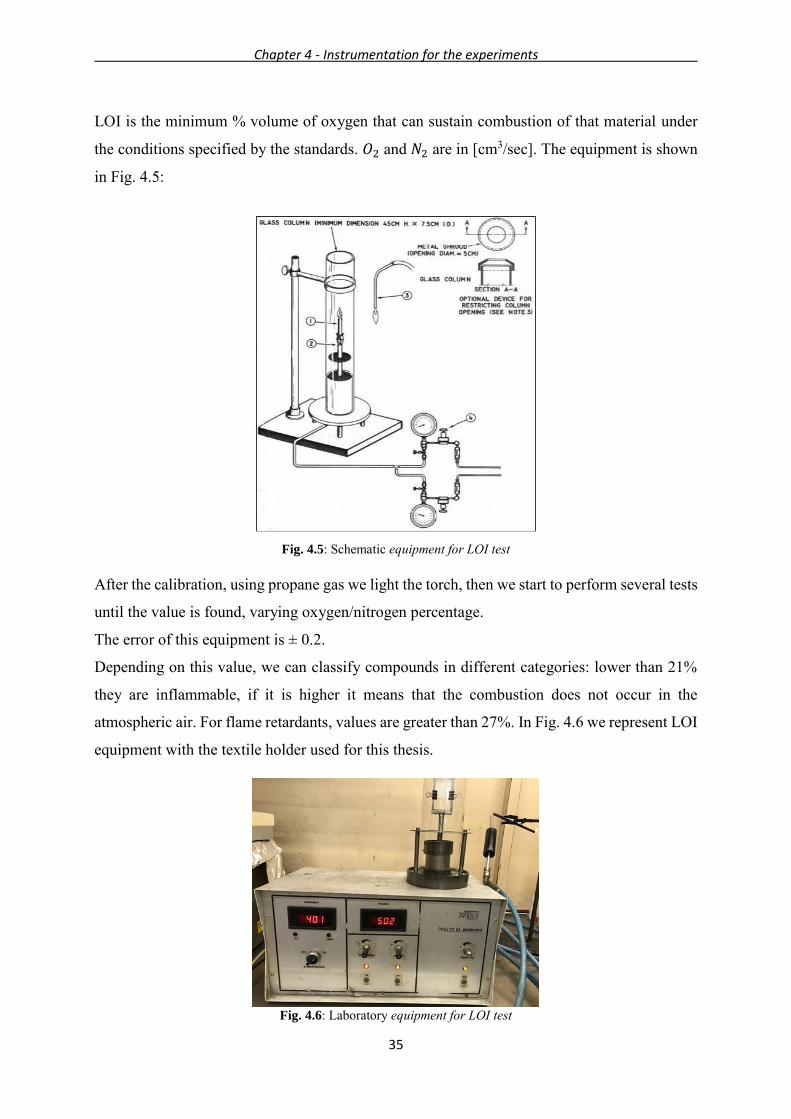
LOI value is indicated in Eq. 4.3, units are in percentage:
𝐿𝑂𝐼 =100 ∙ 𝑂2
(𝑂2 + 𝑁2) [%] (𝐸𝑞. 4.3)
Chapter 4 - Instrumentation for the experiments
35
LOI is the minimum % volume of oxygen that can sustain combustion of that material under
the conditions specified by the standards. 𝑂2 and 𝑁2 are in [cm3/sec]. The equipment is shown
in Fig. 4.5:
Fig. 4.5: Schematic equipment for LOI test
After the calibration, using propane gas we light the torch, then we start to perform several tests
until the value is found, varying oxygen/nitrogen percentage.
The error of this equipment is ± 0.2.
Depending on this value, we can classify compounds in different categories: lower than 21%
they are inflammable, if it is higher it means that the combustion does not occur in the
atmospheric air. For flame retardants, values are greater than 27%. In Fig. 4.6 we represent LOI
equipment with the textile holder used for this thesis.
Fig. 4.6: Laboratory equipment for LOI test

Chapter 4 - Instrumentation for the experiments
36
4.4 Ultraviolet-Visible spectroscopy (UV-Vis)
We perform this analysis with the Spectronic Camspec M501 in the visible light range 340-700
nm using a tungsten lamp (using the deuterium lamp the UV range 200-350 nm is emitted).
This equipment is employed to carry out the DPPH treatment, that will be explained in chapter
5. The spectrum represents the trend of absorption as function of wavelength [nm]. In Fig. 4.7
we represent the equipment and a general scheme of a UV-Vis spectroscopy.
This technique uses the molecular absorbance, a group in the molecule that can absorbs the
radiation is called cromophore; when atoms share electrons, from the linear combination of
atomic orbitals we find the molecular ones. Absorptions deal with transitions from the ground
state to the excited state, in a molecule the excitation of bond electrons is involved, so high
energies are required. Different transitions are possible: 𝜎 − 𝜎∗, 𝜋 − 𝜋∗ (they are not possible
between different symmetries). If the radiation is in the UV-Vis region, the electrons go to the
excited electronic state, after that a band spectrum is obtained; in fact we have a lot of transitions
(vibrational state are divided in rotational states), from a rotational state electrons pass to the
upper one. Qualitative analysis is difficult to perform, but the quantitative one is very fast and
cheap.
Fig. 4.7: Spectronic Camspec M501 equipment and general scheme of the spectrometer
The source generates a polychromatic beam, and it is followed by monochromator, which
selects just one wavelength, after this hits the sample; the detector registers the corresponding
absorption. The other wavelengths are instead dispersed.
Before registering the spectrum of the sample, the calibration is needed. At the beginning both
of the cuvettes are filled with solvent (for example methanol) and we register this spectrum.
Chapter 4 - Instrumentation for the experiments
37
Then we start our analysis and in one of the cuvettes we put our solution, in the other one the
solvent that was used for the calibration.
We define absorbance as 𝐴 = ln1
𝑇, where T is the transmittance: 𝑇 =
𝐼
𝐼0. 𝐼0 is the intensity of
the radiation that heat the sample, instead 𝐼 is the intensity of the exit radiation from the cuvette;
clearly 𝐼 < 𝐼0.
As described in § 4.1, also here Lambert Beer is valid: according to Eq. 4.4 absorption is
proportionate to the concentration:
𝐴 = 𝛼𝐶𝑖𝑙 (𝐸𝑞. 4.4)
Where 𝛼 is coefficient of molar extinction that depends on the solution and the wavelength; 𝐶𝑖
is the molar concentration of the sample, and 𝑙 the geometrical length (the width of the cuvette).
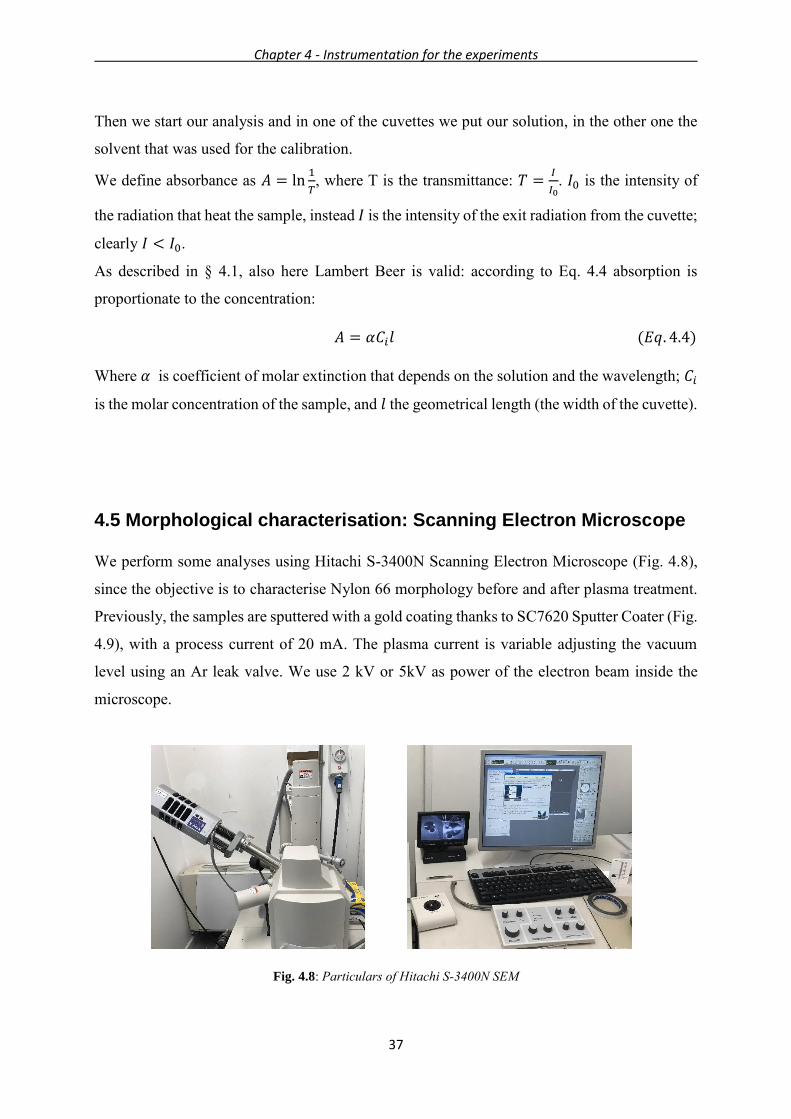
4.5 Morphological characterisation: Scanning Electron Microscope
We perform some analyses using Hitachi S-3400N Scanning Electron Microscope (Fig. 4.8),
since the objective is to characterise Nylon 66 morphology before and after plasma treatment.
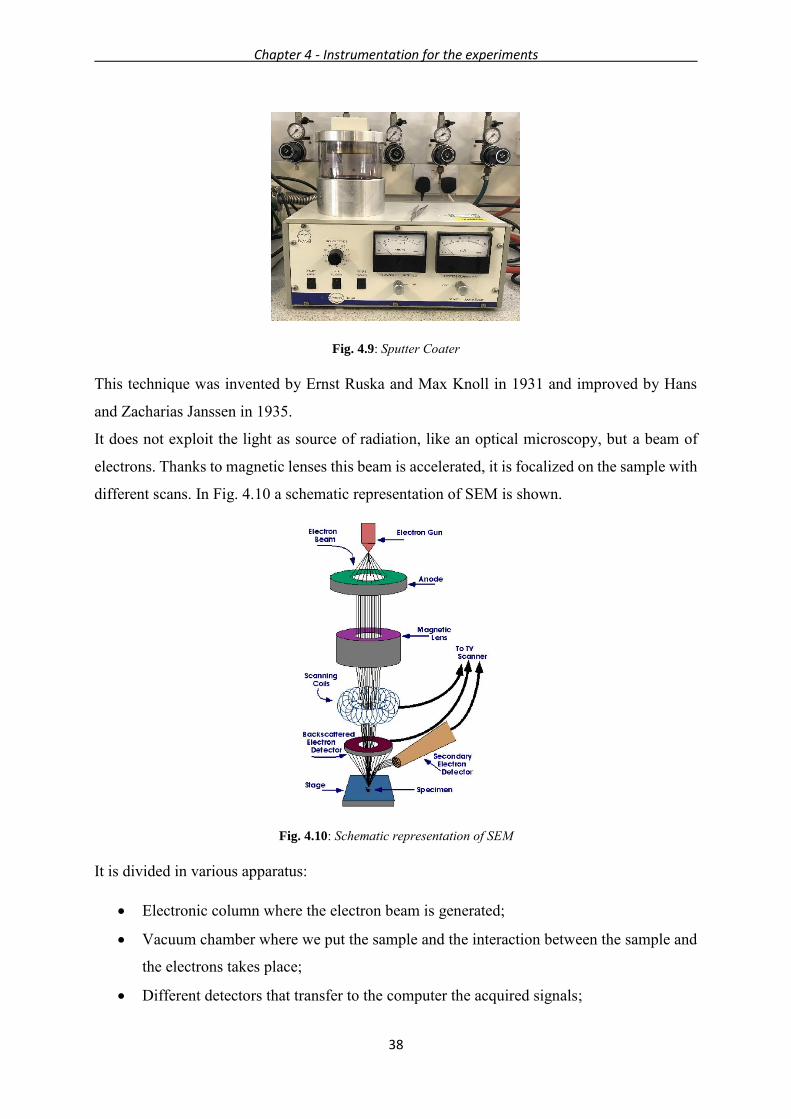
Previously, the samples are sputtered with a gold coating thanks to SC7620 Sputter Coater (Fig.
4.9), with a process current of 20 mA. The plasma current is variable adjusting the vacuum
level using an Ar leak valve. We use 2 kV or 5kV as power of the electron beam inside the
microscope.
Fig. 4.8: Particulars of Hitachi S-3400N SEM
Chapter 4 - Instrumentation for the experiments
38
Fig. 4.9: Sputter Coater
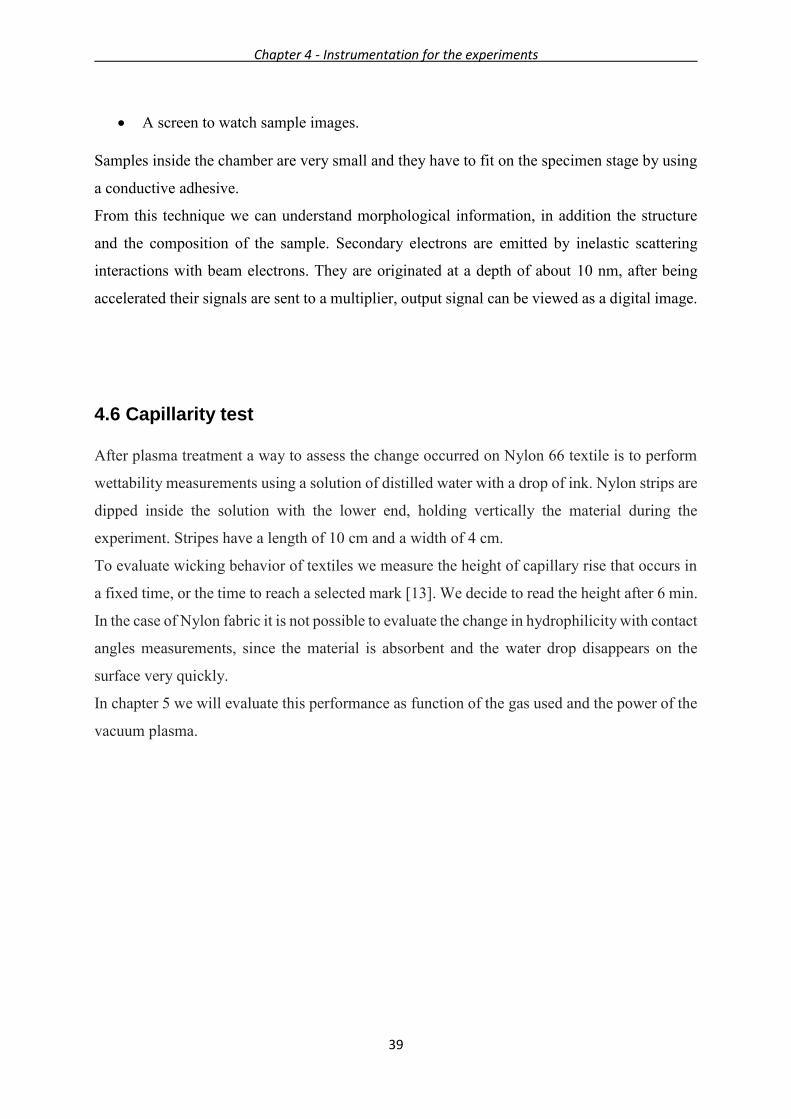
This technique was invented by Ernst Ruska and Max Knoll in 1931 and improved by Hans
and Zacharias Janssen in 1935.
It does not exploit the light as source of radiation, like an optical microscopy, but a beam of
electrons. Thanks to magnetic lenses this beam is accelerated, it is focalized on the sample with
different scans. In Fig. 4.10 a schematic representation of SEM is shown.
Fig. 4.10: Schematic representation of SEM
It is divided in various apparatus:
• Electronic column where the electron beam is generated;
• Vacuum chamber where we put the sample and the interaction between the sample and
the electrons takes place;
• Different detectors that transfer to the computer the acquired signals;
Chapter 4 - Instrumentation for the experiments
39
• A screen to watch sample images.
Samples inside the chamber are very small and they have to fit on the specimen stage by using
a conductive adhesive.
From this technique we can understand morphological information, in addition the structure
and the composition of the sample. Secondary electrons are emitted by inelastic scattering
interactions with beam electrons. They are originated at a depth of about 10 nm, after being
accelerated their signals are sent to a multiplier, output signal can be viewed as a digital image.
4.6 Capillarity test
After plasma treatment a way to assess the change occurred on Nylon 66 textile is to perform
wettability measurements using a solution of distilled water with a drop of ink. Nylon strips are
dipped inside the solution with the lower end, holding vertically the material during the
experiment. Stripes have a length of 10 cm and a width of 4 cm.
To evaluate wicking behavior of textiles we measure the height of capillary rise that occurs in
a fixed time, or the time to reach a selected mark [13]. We decide to read the height after 6 min.
In the case of Nylon fabric it is not possible to evaluate the change in hydrophilicity with contact
angles measurements, since the material is absorbent and the water drop disappears on the
surface very quickly.
In chapter 5 we will evaluate this performance as function of the gas used and the power of the
vacuum plasma.

Chapter 4 - Instrumentation for the experiments
40
41
Chapter 5
Experiments performed with atmospheric
and vacuum plasma equipment
In this chapter we explain how we treated nylon fabric with atmospheric plasma (with the
equipment present in the Fire Laboratory at the University of Bolton), followed by three
analyses: SEM analysis, to see if any morphological change occurs, DPPH treatment, to
understand if radicals were formed on the surface, and FTIR spectroscopy, to analyse the
intensity peaks of some functional groups.
Besides, we focus on the processing with the vacuum plasma equipment at University of
Padova, whose principles are explained in § 2.2.1. Here we show the optimisation of the process
parameters to obtain the best treatment for nylon textile to maximise the functionalisation. We
exploit FTIR spectra and the capillarity test to understand if it is possible to increase activation
of Nylon surface.
Nylon used for this thesis was purchased from Aquafil S.P.A, whose area density is of 149.6
g/cm2. The fabric exposed to plasma and flame retardant treatment has always been washed
before treatment: the scouring is obtained soaking the textile in a 1% Triton X-100 detergent
solution at 90°C for 1 h, and to follow the fabrics are dried in the oven at 70-80°C for 2 hours.
The first point of the study concerns textile treatment with plasma, but the final purpose is to
add a flame retardant and understand which improvements on fire performances can be
achieved introducing the plasma technique; so the second step will deal with the addition of
thiourea to the textile, and with LOI test we will assess if flame retardancy properties improve
after plasma treatment.

Chapter 5 - Experiments performed with atmospheric and vacuum plasma equipment
42
5.1 Atmospheric plasma treatment
We perform plasma treatment on Nylon 66 textile. The operative parameters used with torch
plasma Microwave Power Supply SAIREM (§ 2.2.1) are reported in Tab. 5.1, and in Fig. 5.1
we see where the fabric is collocated. The ionized gases used are Ar and a mixture Ar/O2 with
a ratio equal to 4:1.
Observing the image below (Fig. 5.1) we can immediately say that this torch can cover only
very small pieces of fabric, otherwise we should move the fabric on the wood support to allow
the flame to pass over the all piece, leading to a non-homogeneous treatment. Therefore, we cut
textile into pieces with a length of 10 cm and a width of 2.5 cm and we treat them forward and
backward for 10 and 50 times, to understand what kind of changes affects the textile.
Tab. 5.1: Operative parameters used with atmospheric plasma
Fig. 5.1: Nylon stripes treated with atmospheric plasma
Scan speed 1.25 cm/s
Applied power 300 W
Length of the flame 2 cm
Distance from the fabric to the nozzle 5 cm
Diameter of the nozzle 0.5 cm
100% Ar flow 30 cc/min
Ar-oxygen gas 80% Ar - 20% O2

Chapter 5 - Experiments performed with atmospheric and vacuum plasma equipment
43
5.1.1 SEM analysis: morphological information
In Fig. 5.2 we show some images related to pure Nylon to obtain generic information about our
textile, then the ones of the Nylon treated with Ar and Ar-oxygen plasma gases for 50 times.
a
c
b
d
e f
Chapter 5 - Experiments performed with atmospheric and vacuum plasma equipment
44
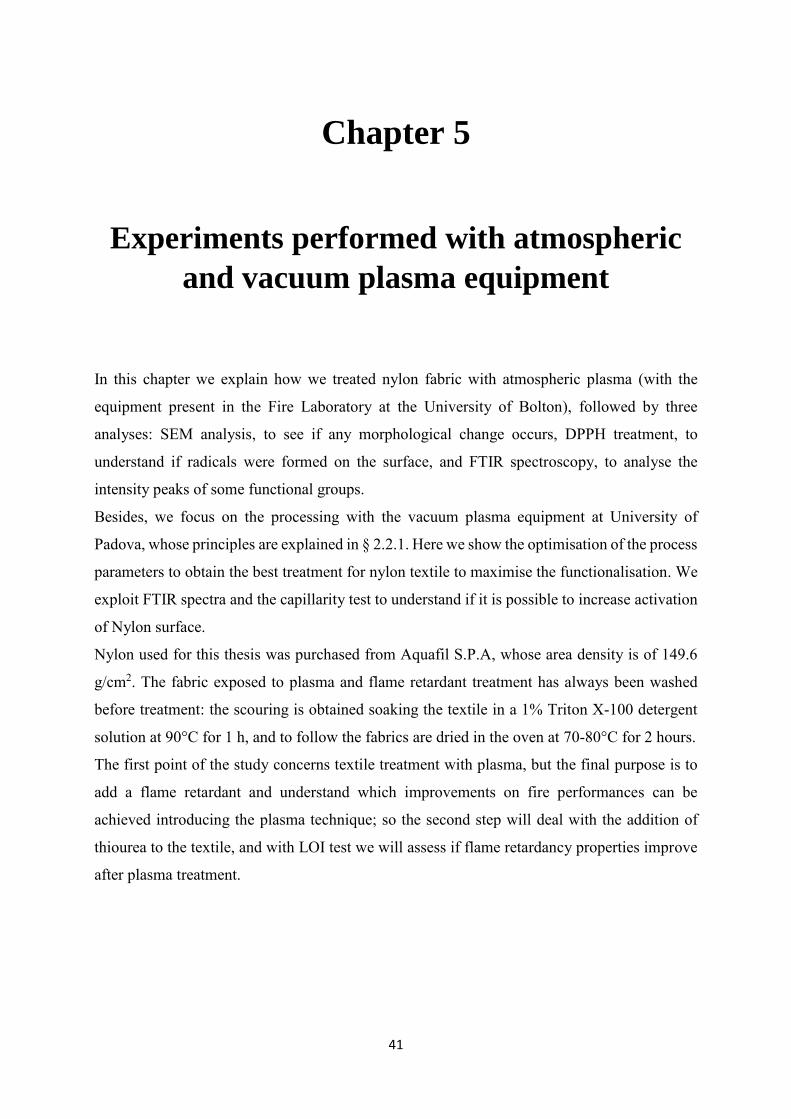
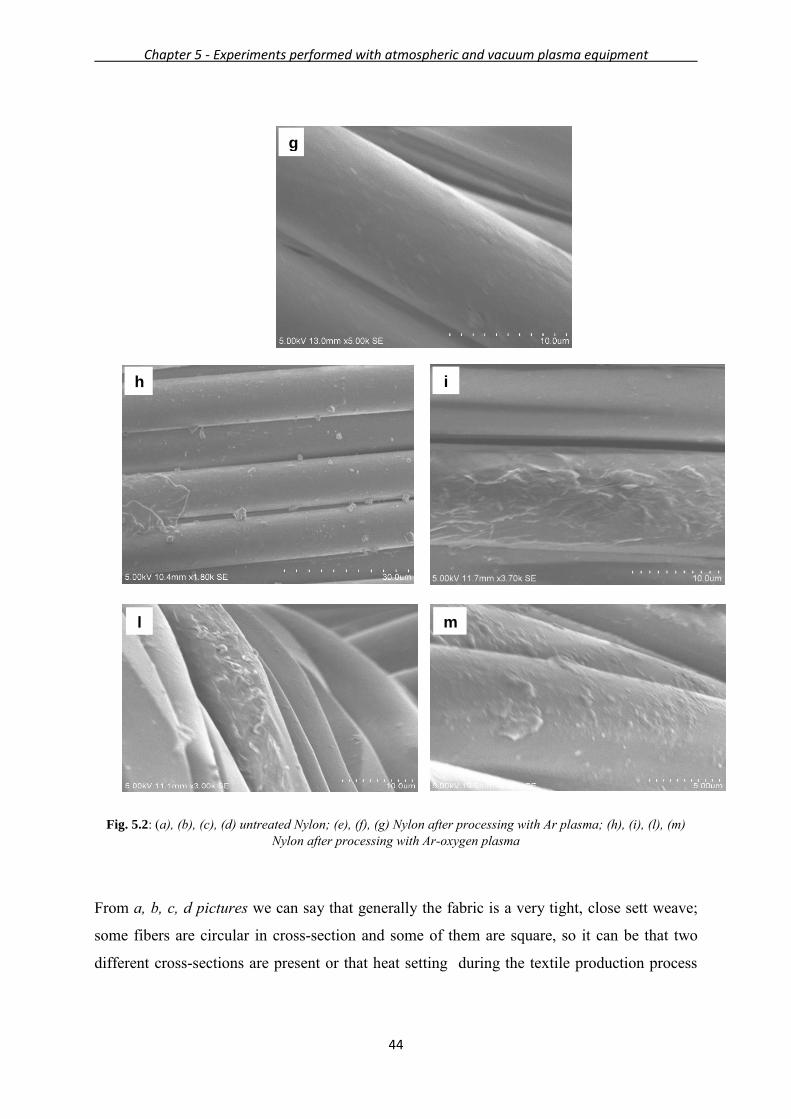
Fig. 5.2: (a), (b), (c), (d) untreated Nylon; (e), (f), (g) Nylon after processing with Ar plasma; (h), (i), (l), (m) Nylon after processing with Ar-oxygen plasma
From a, b, c, d pictures we can say that generally the fabric is a very tight, close sett weave;
some fibers are circular in cross-section and some of them are square, so it can be that two
different cross-sections are present or that heat setting during the textile production process
g
i
l
h
m
Chapter 5 - Experiments performed with atmospheric and vacuum plasma equipment
45
(about 180°C) has deformed the fibres, indeed yarns are pushed close together. It is made by
weaving yarns.
For Nylon treated with Ar plasma shown in e, f, g pictures we state that thanks to the peeling
effect plasma starts to etch the immediate fibre surfaces. Ar-O2 gas plasma has roughened fibre
surfaces, as we can notice from h, i, l, m images, and further promote the release of surface
coating species. Here we can see that probably scouring is not able to completely remove
surface impurities present within the yarn structure, especially if this comprises a post finishing
coating (nothing is specified by the company). We can notice modifications on the surface of
the textile, small bubbles, some swelling and white spots, maybe because of the etching caused
by the plasma.
P. S. Das, A. Bansode et al. report SEM images of Nylon 6 fabric after O2, Ar plasma gases
[14]; they notice that untreated film of Nylon is smooth, instead after Ar plasma treatment on
the surface small globules appear, indicating an increase of surface etching. With O2 plasma a
higher amount of etching is seen, a more evident change in the morphology appears, producing
globules with larger diameter; oxygen is indeed more reactive, as regards polymer surface. But
in this case Nylon film is processed in vacuum condition (pressure of 10-3 mbar) with
microwave assisted Electron Cyclotron Resonance plasma system; this is specific for surface
modification of polymers. Instead our atmospheric plasma machine seems to be not able to
introduce a significant morphological change.
In another study by C. Kan and W. Man on cotton textiles using an APPJ, Atomflo™ 400
machine for atmospheric pressure plasma treatment [8], using oxygen as reactive gas, at 130-
140 W slits and grooves are present on the surface, and when power is 160-170 W the plasma
is able to cause deep breakings, leading to etching; a surface-volume ratio is higher at these
powers (Fig. 5.3).
Instead in our study, even at 300 W, modification is not so pronounced, revealing small effects.
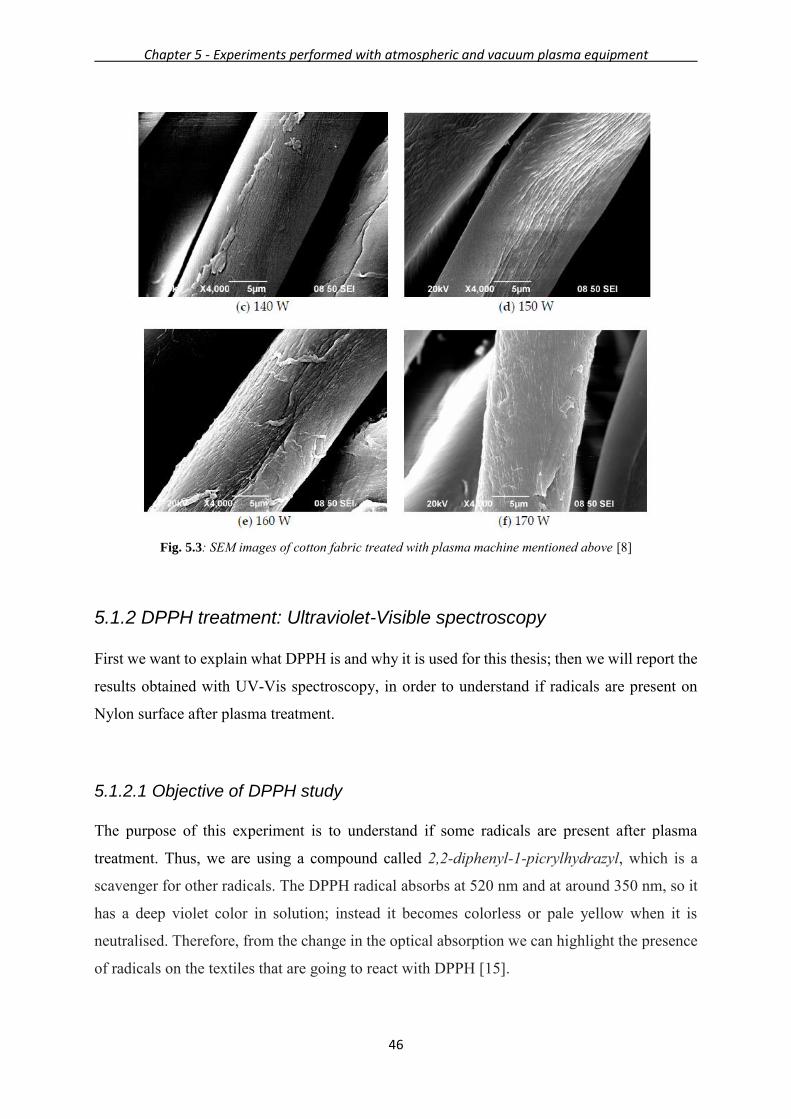
Chapter 5 - Experiments performed with atmospheric and vacuum plasma equipment
46
Fig. 5.3: SEM images of cotton fabric treated with plasma machine mentioned above [8]
5.1.2 DPPH treatment: Ultraviolet-Visible spectroscopy
First we want to explain what DPPH is and why it is used for this thesis; then we will report the
results obtained with UV-Vis spectroscopy, in order to understand if radicals are present on
Nylon surface after plasma treatment.
5.1.2.1 Objective of DPPH study
The purpose of this experiment is to understand if some radicals are present after plasma
treatment. Thus, we are using a compound called 2,2-diphenyl-1-picrylhydrazyl, which is a
scavenger for other radicals. The DPPH radical absorbs at 520 nm and at around 350 nm, so it
has a deep violet color in solution; instead it becomes colorless or pale yellow when it is
neutralised. Therefore, from the change in the optical absorption we can highlight the presence
of radicals on the textiles that are going to react with DPPH [15].
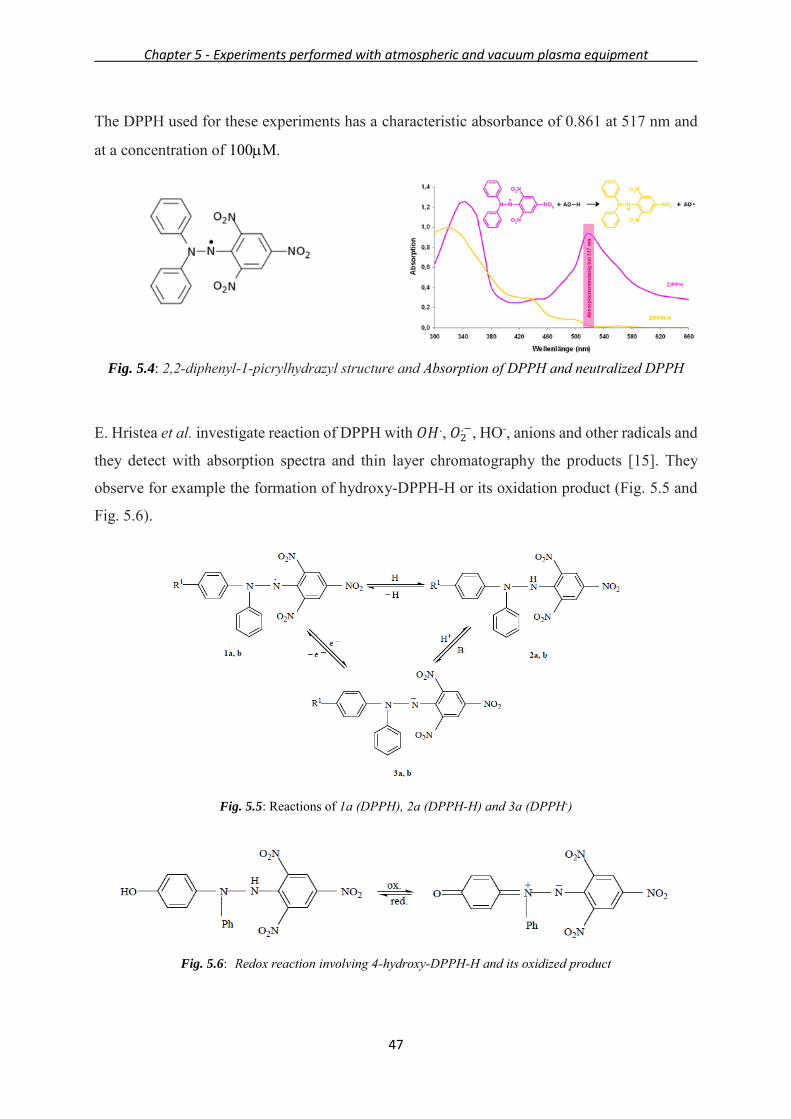
Chapter 5 - Experiments performed with atmospheric and vacuum plasma equipment
47
The DPPH used for these experiments has a characteristic absorbance of 0.861 at 517 nm and
at a concentration of 100M.
Fig. 5.4: 2,2-diphenyl-1-picrylhydrazyl structure and Absorption of DPPH and neutralized DPPH
E. Hristea et al. investigate reaction of DPPH with 𝑂𝐻., 𝑂2.−, HO-, anions and other radicals and
they detect with absorption spectra and thin layer chromatography the products [15]. They
observe for example the formation of hydroxy-DPPH-H or its oxidation product (Fig. 5.5 and
Fig. 5.6).
Fig. 5.5: Reactions of 1a (DPPH), 2a (DPPH-H) and 3a (DPPH-)
Fig. 5.6: Redox reaction involving 4-hydroxy-DPPH-H and its oxidized product

Chapter 5 - Experiments performed with atmospheric and vacuum plasma equipment
48
Reactions are rather difficult to understand, probably protolytic equilibria and redox processes
are involved, in addition to molecular fragmentations.
5.1.2.2 Procedure and materials
We prepare a solution of DPPH of 100M in methanol in the glovebox under nitrogen
atmosphere (Fig. 5.7); the glovebox is a container where the operator can manipulate
compounds using long gloves, avoiding the contact with the surrounding atmosphere. We
introduce the materials through a system of double seals.
We pour 10 ml of the solution into five different holders, in each of them we dip a piece of pure
nylon or one of the four treated samples (2 cm by 2 cm). All the holders are covered with
aluminum foil to protect the sample from light and oxygen since DPPH is a stable radical, but
it is sensitive to some solvents, oxygen, some Lewis basis, pH of the solution and light [16].
Indeed, B. Ozcelik et al. put DPPH in acetone or methanol solutions and keep the bottles under
light source or enveloped with aluminum foil to see the differences in absorption at 517 nm.
They show also the oxygen effect, both under dark and light conditions.
The stability of DPPH in methanol is higher than acetone, so this is the reason why we opt for
this solvent. The absorption of DPPH in methanol decreases by 20% under light after 120 min,
probably because photochemical decomposition occurs in presence of a light source. Sample
with 21% presence of oxygen under light is causing DPPH absorption to decrease significantly.
These effects are pronounced after 150 min, and, in general, the lowering of the absorption is
more evident with time.
Fig. 5.7: Glovebox under nitrogen to prepare DPPH solution and to preserve the cuvettes
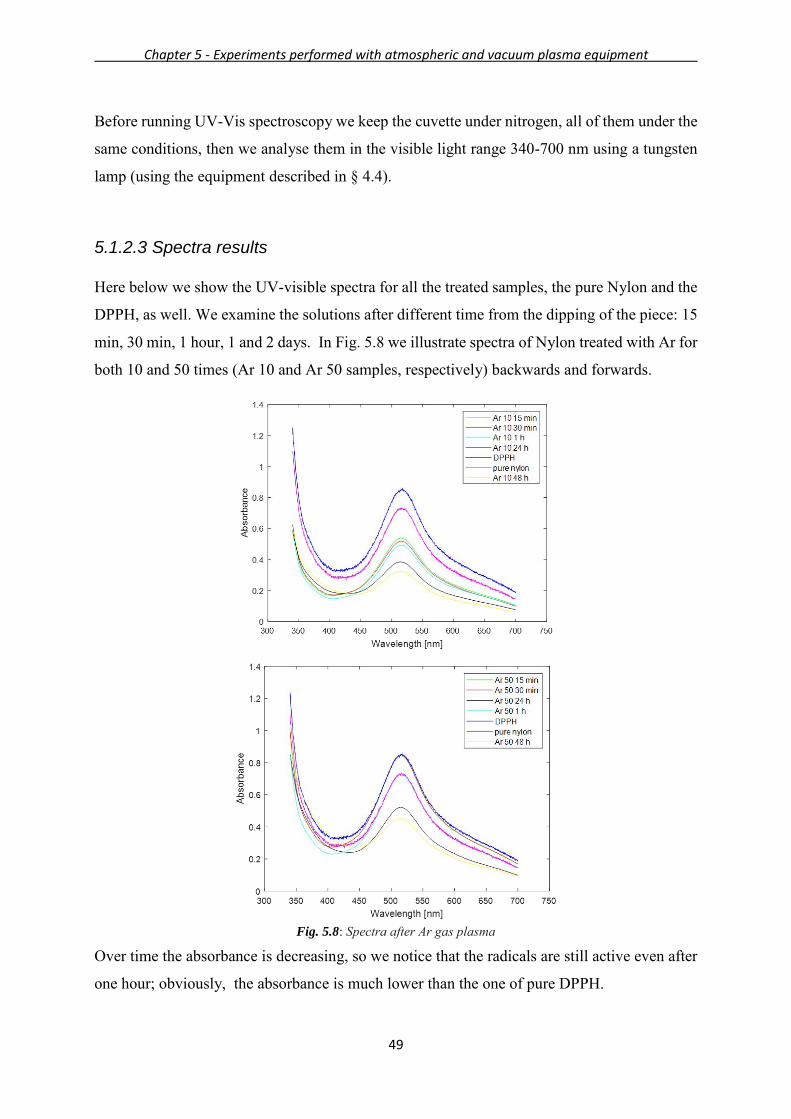
Chapter 5 - Experiments performed with atmospheric and vacuum plasma equipment
49
Before running UV-Vis spectroscopy we keep the cuvette under nitrogen, all of them under the
same conditions, then we analyse them in the visible light range 340-700 nm using a tungsten
lamp (using the equipment described in § 4.4).
5.1.2.3 Spectra results
Here below we show the UV-visible spectra for all the treated samples, the pure Nylon and the
DPPH, as well. We examine the solutions after different time from the dipping of the piece: 15
min, 30 min, 1 hour, 1 and 2 days. In Fig. 5.8 we illustrate spectra of Nylon treated with Ar for
both 10 and 50 times (Ar 10 and Ar 50 samples, respectively) backwards and forwards.
Fig. 5.8: Spectra after Ar gas plasma
Over time the absorbance is decreasing, so we notice that the radicals are still active even after
one hour; obviously, the absorbance is much lower than the one of pure DPPH.
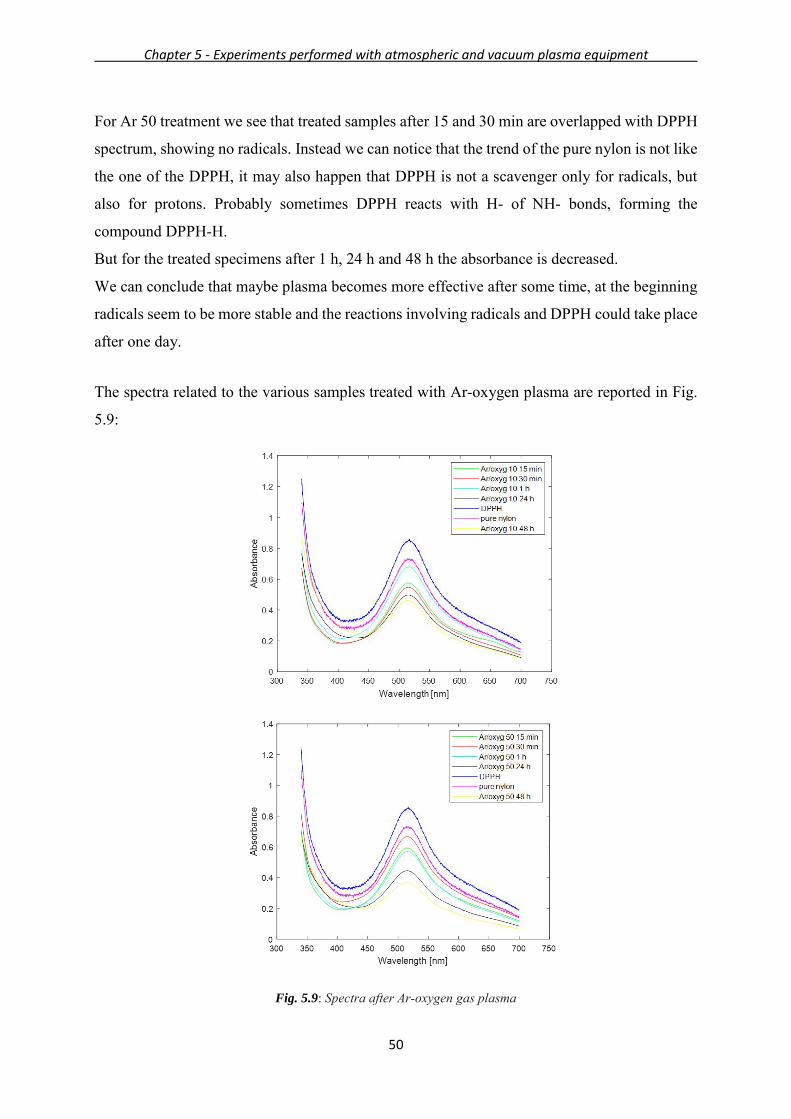
Chapter 5 - Experiments performed with atmospheric and vacuum plasma equipment
50
For Ar 50 treatment we see that treated samples after 15 and 30 min are overlapped with DPPH
spectrum, showing no radicals. Instead we can notice that the trend of the pure nylon is not like
the one of the DPPH, it may also happen that DPPH is not a scavenger only for radicals, but
also for protons. Probably sometimes DPPH reacts with H- of NH- bonds, forming the
compound DPPH-H.
But for the treated specimens after 1 h, 24 h and 48 h the absorbance is decreased.
We can conclude that maybe plasma becomes more effective after some time, at the beginning
radicals seem to be more stable and the reactions involving radicals and DPPH could take place
after one day.
The spectra related to the various samples treated with Ar-oxygen plasma are reported in Fig.
5.9:
Fig. 5.9: Spectra after Ar-oxygen gas plasma
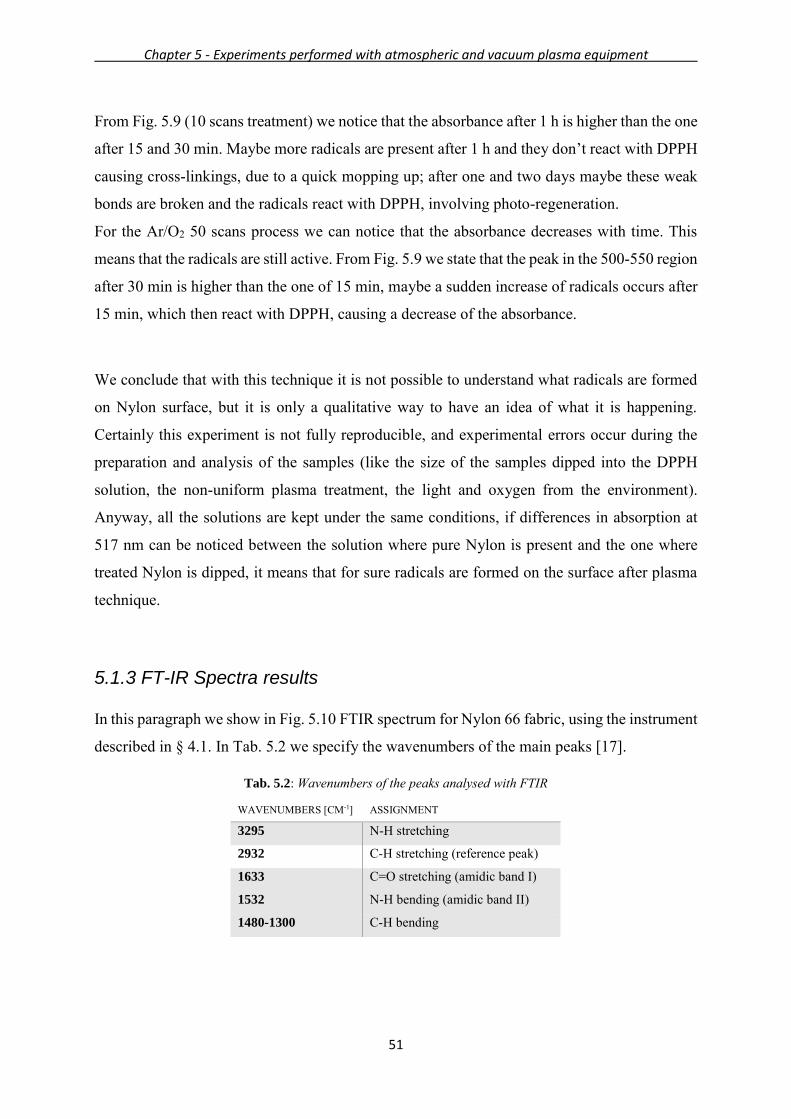
Chapter 5 - Experiments performed with atmospheric and vacuum plasma equipment
51
From Fig. 5.9 (10 scans treatment) we notice that the absorbance after 1 h is higher than the one
after 15 and 30 min. Maybe more radicals are present after 1 h and they don’t react with DPPH
causing cross-linkings, due to a quick mopping up; after one and two days maybe these weak
bonds are broken and the radicals react with DPPH, involving photo-regeneration.
For the Ar/O2 50 scans process we can notice that the absorbance decreases with time. This
means that the radicals are still active. From Fig. 5.9 we state that the peak in the 500-550 region
after 30 min is higher than the one of 15 min, maybe a sudden increase of radicals occurs after
15 min, which then react with DPPH, causing a decrease of the absorbance.
We conclude that with this technique it is not possible to understand what radicals are formed
on Nylon surface, but it is only a qualitative way to have an idea of what it is happening.
Certainly this experiment is not fully reproducible, and experimental errors occur during the
preparation and analysis of the samples (like the size of the samples dipped into the DPPH
solution, the non-uniform plasma treatment, the light and oxygen from the environment).
Anyway, all the solutions are kept under the same conditions, if differences in absorption at
517 nm can be noticed between the solution where pure Nylon is present and the one where
treated Nylon is dipped, it means that for sure radicals are formed on the surface after plasma
technique.
5.1.3 FT-IR Spectra results
In this paragraph we show in Fig. 5.10 FTIR spectrum for Nylon 66 fabric, using the instrument
described in § 4.1. In Tab. 5.2 we specify the wavenumbers of the main peaks [17].
Tab. 5.2: Wavenumbers of the peaks analysed with FTIR
WAVENUMBERS [CM-1] ASSIGNMENT
3295 N-H stretching
2932 C-H stretching (reference peak)
1633
1532
C=O stretching (amidic band I)
N-H bending (amidic band II)
1480-1300 C-H bending

Chapter 5 - Experiments performed with atmospheric and vacuum plasma equipment
52
Fig. 5.10: FTIR spectrum of Nylon 66
5.1.3.1 Peak area normalisation
Using the peak area tool in FTIR software we analyse the area below some peaks, to see
variation in the content of some functional groups after plasma treatment happens. Although
the spectra are obtained by ATR, and therefore the optical path is almost constant, we prefer to
normalize the results by using as reference peak the C-H stretching [18], i.e. a group which is
not affected by the plasma treatment and which content is constant in treated and untreated
samples. We will focus on the absorption peaks of -NH2, -CONH- and -NH, indeed after
atmospheric plasma oxygen can react with radicals formed on the surface to lead to the
formation of -COOH groups, contributing to incorporate oxygen functionalities on surfaces;
also amide groups can be formed [18], [19]. In order to analyse the surface in two different
point (at the center of the sample, and laterally, 1.5 cm from the edge of the fabric), we cut a
piece of nylon of 12 cm by 13 cm, the same size of the sample that will be treated with vacuum
plasma. So it will be possible the comparison between the two different treatments. The FTIR
analysis is carried out immediately after the plasma treatment.
Now we treat the textile for a fixed time, instead of deciding the number of paths; we choose 2,
5 and 10 min, moving the textile using the wood support and allowing the torch to cover the
0,00
0,02
0,04
0,06
0,08
0,10
0,12
0,14
0,16
0,18
0,20
0,22
0,24
0,26
0,28
Ab
so
rba
nce
1000 2000 3000 4000
Wavenumbers (cm-1)
32
95
29
32
16
33
15
32
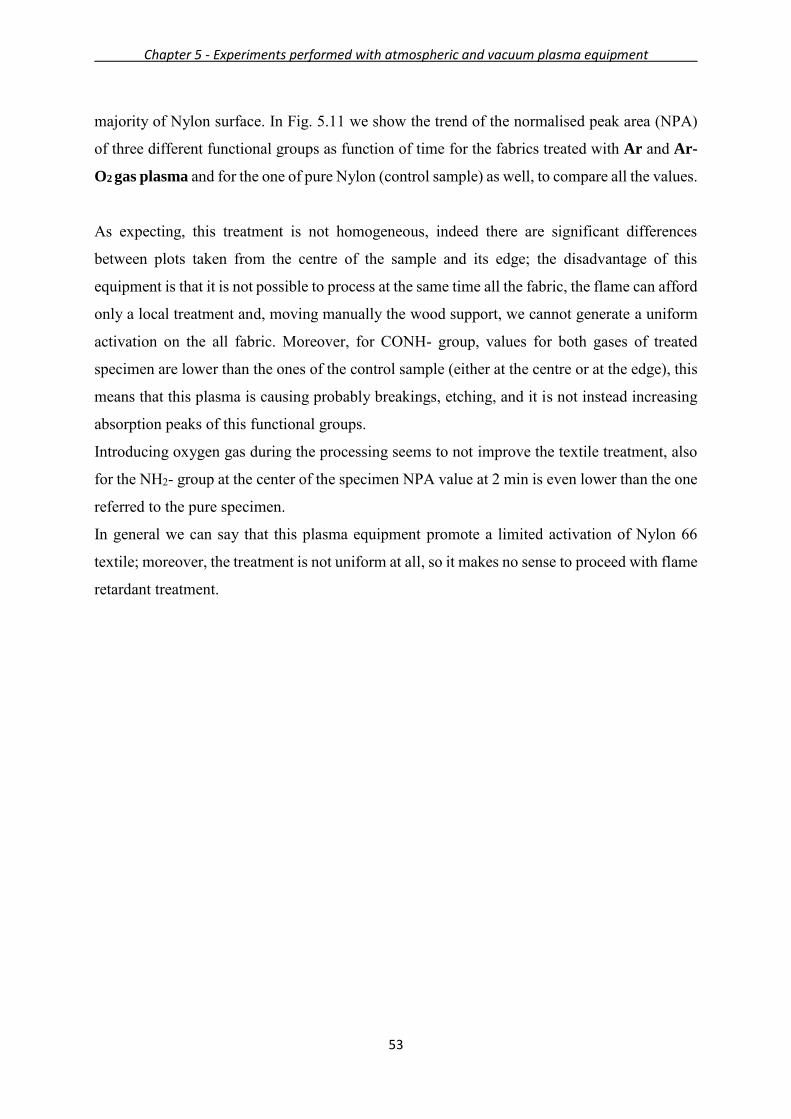
Chapter 5 - Experiments performed with atmospheric and vacuum plasma equipment
53
majority of Nylon surface. In Fig. 5.11 we show the trend of the normalised peak area (NPA)
of three different functional groups as function of time for the fabrics treated with Ar and Ar-
O2 gas plasma and for the one of pure Nylon (control sample) as well, to compare all the values.
As expecting, this treatment is not homogeneous, indeed there are significant differences
between plots taken from the centre of the sample and its edge; the disadvantage of this
equipment is that it is not possible to process at the same time all the fabric, the flame can afford
only a local treatment and, moving manually the wood support, we cannot generate a uniform
activation on the all fabric. Moreover, for CONH- group, values for both gases of treated
specimen are lower than the ones of the control sample (either at the centre or at the edge), this
means that this plasma is causing probably breakings, etching, and it is not instead increasing
absorption peaks of this functional groups.
Introducing oxygen gas during the processing seems to not improve the textile treatment, also
for the NH2- group at the center of the specimen NPA value at 2 min is even lower than the one
referred to the pure specimen.
In general we can say that this plasma equipment promote a limited activation of Nylon 66
textile; moreover, the treatment is not uniform at all, so it makes no sense to proceed with flame
retardant treatment.
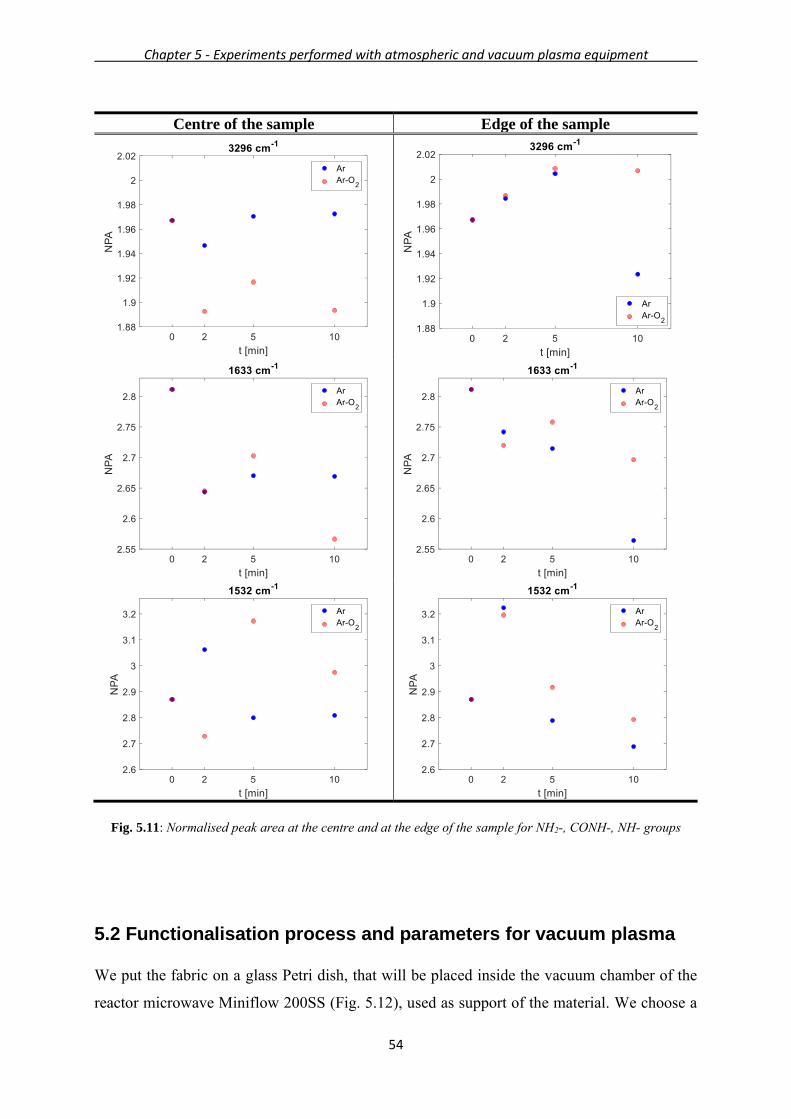
Chapter 5 - Experiments performed with atmospheric and vacuum plasma equipment
54
Centre of the sample Edge of the sample
Fig. 5.11: Normalised peak area at the centre and at the edge of the sample for NH2-, CONH-, NH- groups
5.2 Functionalisation process and parameters for vacuum plasma
We put the fabric on a glass Petri dish, that will be placed inside the vacuum chamber of the
reactor microwave Miniflow 200SS (Fig. 5.12), used as support of the material. We choose a

Chapter 5 - Experiments performed with atmospheric and vacuum plasma equipment
55
precise distance from the surface and the torch, trying to minimise the distance, but at the same
time avoiding any damage on Nylon fibres. For this purpose we use the Thermo Scientific
Nicolet Centaurµs FT-IR Microscope (Contact Alert™), reported in Fig. 5.13, examining the
sample with a Triton 10x Objective. The treated textile is a piece of 12 cm by 13 cm.
One of the main disadvantage of this equipment under vacuum is the size of the material that
can be treated per batch since it is limited by the chamber dimensions; moreover, it is a batch
system, so the productivity is not very high; finally, the use of vacuum equipment is much more
expensive than atmospheric plasma.
Inside the chamber we create the vacuum first closing the gas leak valve, then slowly closing
the high vacuum valve, and turning on the vacuum diaphragm pump, reaching about 6 mbar.
Finally we switch on the turbomolecular pump, connected in series, to reach high degree of
vacuum.
We regulate the flow of the gases entering the reactor thanks to digital flowmeters and we
maintain the chosen pressure with a regulator valve, working on the total percentage of gas that
is going inside the chamber. We see the % of total gas from FlowDDE (Bronkhorst®) server,
that handles all communication data to the instruments. It allows an interprocess access between
the computer and the digital flowmeters. From this software it is also possible to decide the
exact flow rate of oxygen.
The functionalisation is then activated pressing the button ON present in the touchscreen when
all the chosen conditions are reached.
Fig. 5.12: Microwave Miniflow 200SS Plasma Equipment

Chapter 5 - Experiments performed with atmospheric and vacuum plasma equipment
56
Fig. 5.13: Thermo Scientific Microscope to observe Nylon fibres
The goal of this technique is to see if flame performances, evaluated by LOI test, are increased,
because of a higher amount of thiourea attached on the surface thanks to the activation of the
surface and/or the formation of strong bonds between the flame retardant and the functional
group generated on Nylon.
5.2.1 Fixed and variable parameters
Now we list the parameters that are kept constant during the various experiments:
• Pressure: we keep inside the chamber a value of about 6∙10-2 mbar. This reactor usually
should work at a pressure of the order of 10-3 mbar, but we want to guarantee a total gas
entering the reactor at least of 0.3-0.5% of the total volumetric flow entering the reactor,
that is 30 cm3/min. Indeed the flow is necessary for the activation, so we remain at
higher pressure values.
• Distance from the torch: we set this parameter at 30 mm, finding a compromise between
a better functionalisation of the textile being closer to the torch, and no damage on the
fibres, observing the textile with the microscope after the treatment.
Instead the parameters that are changed for these studies are the following:
• Time of treatment: we decide to vary this parameter choosing 2, 5, 10 min, according
to conditions performed in other experiments using vacuum plasma [19]. We evaluate
the best time treatment using FTIR spectra evaluating the increase in the concentration

Chapter 5 - Experiments performed with atmospheric and vacuum plasma equipment
57
of the functional groups mentioned in § 5.1.3. In this case we keep constant the power
at 80 W.
• Power: maintaining fixed the time treatment, we modify power values: we set values
between 40-200 W, with step of 40 W.
• Gas plasma: we carry out all these experiments using He/oxygen gas, so a mixture of
the inert gas and the reactive gas; for a fixed time and power, we change the gas ratio
(He/O2 5:1, 1:1, 10:1). The benefits in terms of functionalization have been assessed by
FTIR spectra and capillarity test. Trials using neat helium or oxygen have also been
carried out.
According to literature review [20], inert gas plasmas as Ar or He, can abstract hydrogen
atoms from polymer chains, generating free radicals, clean the surface removing low
MW species. Instead oxygen gas plasma can increase the presence of oxygen functional
groups thanks to the reactions between the active molecules of the plasma and the
molecules on the surface (as explained in § 2.3). So, usually, to have an increase of
wettability and a stability of the treatment, a mixture of these two types of gases should
be used.
5.2.2 Effect of He/O2 ratio, power and time
To analyse which He/O2 ratio guarantees a better functionalisation of PA66 textile we analyse
FTIR spectra and perform the capillarity test. First we want to decide at which proportion we
have to work, and then at which power and time.
5.2.2.1 He/O2 volumetric ratio
In the following plots we show NPA values for the three peaks, as before, changing He/O2
proportions: 1 to 1, 5 to 1, 10 to 1. We treat the fabric at 80 W and for 5 min. FTIR spectra at
the center of the sample have been collected after plasma treatment. Moreover we add results
of capillarity test for each of them, following the procedure explained in § 4.6. In Tab. 5.3 we
report all the results.
For 10:1 ratio we obtain the worst results, with two values of NPA even lower that the
corresponding ones of pure Nylon; we also notice the lowest value of liquid rise, NPA values
for all the peaks are lower than the ones of the other two ratios, as well. We decide to proceed

Chapter 5 - Experiments performed with atmospheric and vacuum plasma equipment
58
for all the future analyses with 5:1 ratio since all NPA values, in particular the one related to
CO-NH group, are higher, like also the capillarity rise.
Tab. 5.3: Normalised peak area for the three functional groups and capillarity test at different volumetric ratios
Wavenumbers [cm-1] NPA height [cm]
3296 2.031
1632 2.855 5.2 ± 0.34
1532 3.31
Wavenumbers [cm-1] NPA height [cm]
3296 1.952
1632 2.721 4.6 ± 0.47
1532 3.165
5.2.2.2 Microwave source power
In this paragraph we represent the trend of NPA values for the three peaks as function of the
power used to activate the plasma inside the chamber. For this experiment we treated the
samples for a fixed time, 5 min. We collect the FTIR spectra at the centre of the sample for all
the treated fabrics. In Fig. 5.15 we show these plots, instead in Fig. 5.14 we represent capillarity
rise versus power, including the value related to the control sample to assess at which power is
better to functionalise the textile.
Fig. 5.14: Capillarity height [cm] versus power [W]
Wavenumbers [cm-1] NPA height [cm]
3296 2.156
1632 3.054 5.5 ± 0.42
1532 3.429
Wavenumbers [cm-1] NPA height [cm]
3296 1.967
1632 2.812 4.6 ± 0.43
1532 2.87
1 to 1 5 to 1
10 to 1 Pure nylon
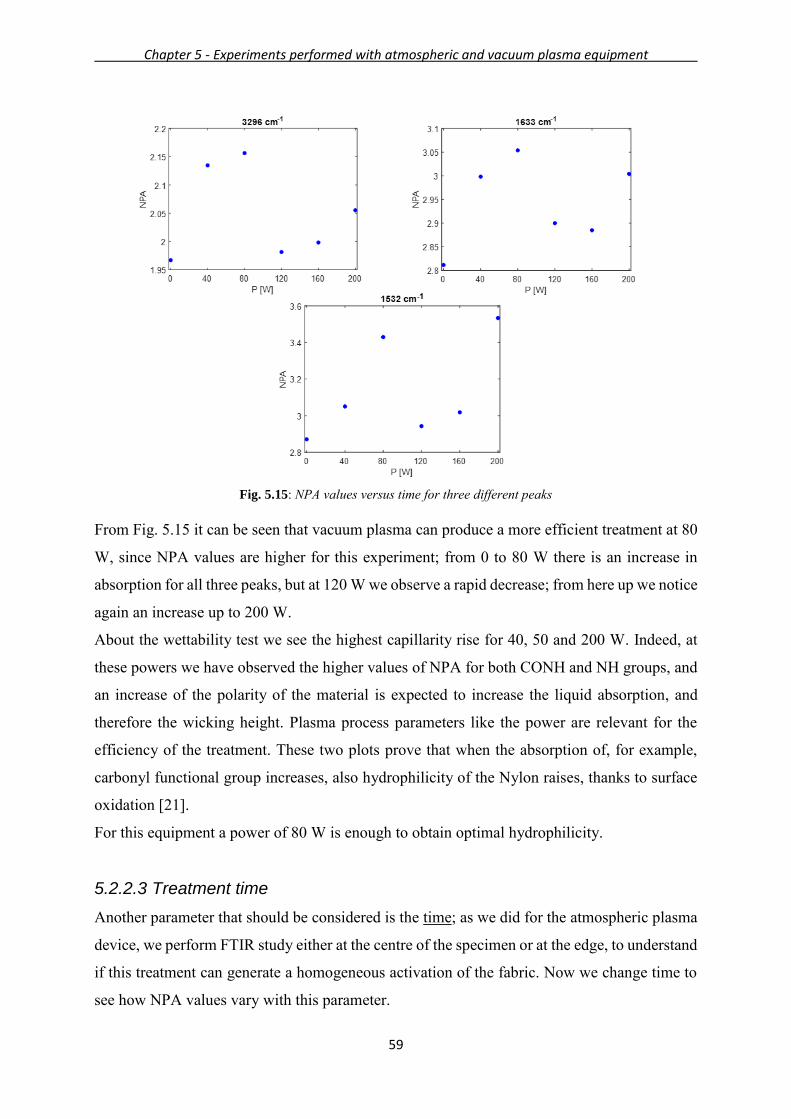
Chapter 5 - Experiments performed with atmospheric and vacuum plasma equipment
59
Fig. 5.15: NPA values versus time for three different peaks
From Fig. 5.15 it can be seen that vacuum plasma can produce a more efficient treatment at 80
W, since NPA values are higher for this experiment; from 0 to 80 W there is an increase in
absorption for all three peaks, but at 120 W we observe a rapid decrease; from here up we notice
again an increase up to 200 W.
About the wettability test we see the highest capillarity rise for 40, 50 and 200 W. Indeed, at
these powers we have observed the higher values of NPA for both CONH and NH groups, and
an increase of the polarity of the material is expected to increase the liquid absorption, and
therefore the wicking height. Plasma process parameters like the power are relevant for the
efficiency of the treatment. These two plots prove that when the absorption of, for example,
carbonyl functional group increases, also hydrophilicity of the Nylon raises, thanks to surface
oxidation [21].
For this equipment a power of 80 W is enough to obtain optimal hydrophilicity.
5.2.2.3 Treatment time
Another parameter that should be considered is the time; as we did for the atmospheric plasma
device, we perform FTIR study either at the centre of the specimen or at the edge, to understand
if this treatment can generate a homogeneous activation of the fabric. Now we change time to
see how NPA values vary with this parameter.

Chapter 5 - Experiments performed with atmospheric and vacuum plasma equipment
60
From Fig. 5.16 we see that treating the Nylon inside the chamber of the vacuum reactor a
uniform processing is allowed, the plasma torch is able to generate over the whole surface a
similar increase of NH and CONH peak areas with respect to the control sample.
Considering NH bond, NPA values are approximately similar for the three different times, since
all of them are around 2.15; instead for CONH bond 5 min is the best time treatment.
Centre of the sample Edge of the sample
Fig. 5.16: Normalised peak area at the centre and at the edge of the sample for NH2-, CONH- groups
To conclude, for the following studies about the addition of thiourea after plasma treatment and
the LOI test we will select the following parameters: 80 W, 2 min, 5 to 1 for He/O2 gases.
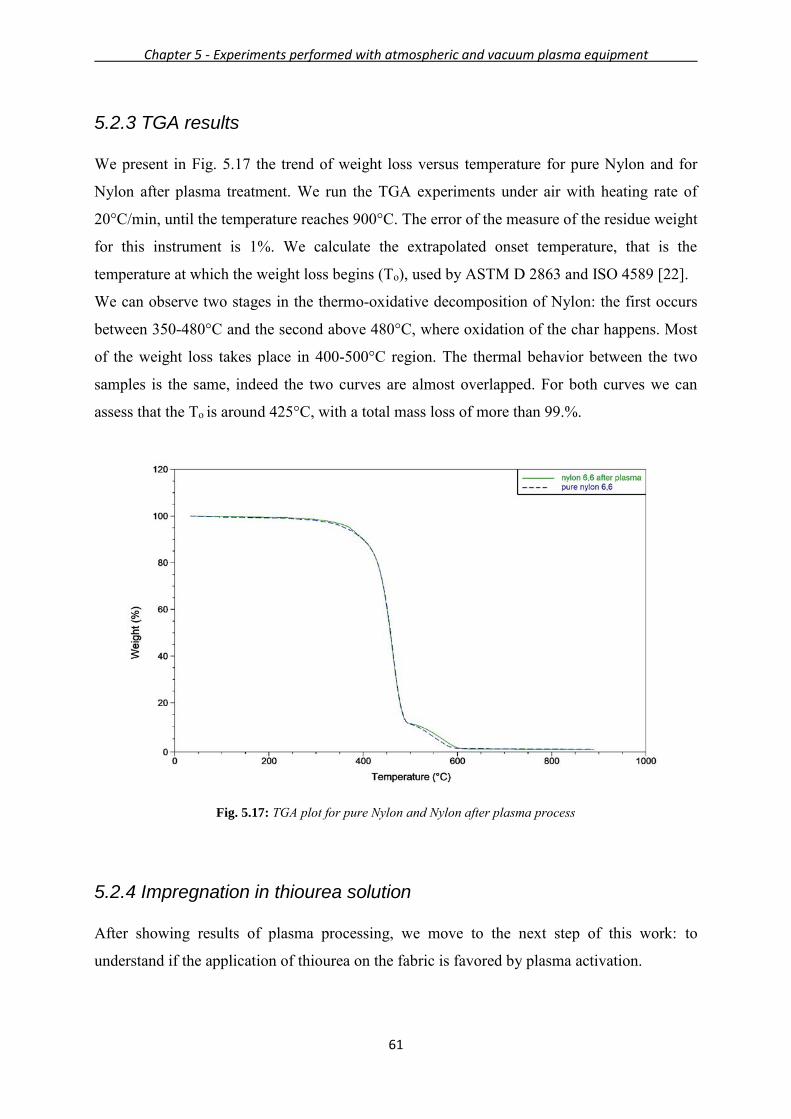
Chapter 5 - Experiments performed with atmospheric and vacuum plasma equipment
61
5.2.3 TGA results
We present in Fig. 5.17 the trend of weight loss versus temperature for pure Nylon and for
Nylon after plasma treatment. We run the TGA experiments under air with heating rate of
20°C/min, until the temperature reaches 900°C. The error of the measure of the residue weight
for this instrument is 1%. We calculate the extrapolated onset temperature, that is the
temperature at which the weight loss begins (To), used by ASTM D 2863 and ISO 4589 [22].
We can observe two stages in the thermo-oxidative decomposition of Nylon: the first occurs
between 350-480°C and the second above 480°C, where oxidation of the char happens. Most
of the weight loss takes place in 400-500°C region. The thermal behavior between the two
samples is the same, indeed the two curves are almost overlapped. For both curves we can
assess that the To is around 425°C, with a total mass loss of more than 99.%.
Fig. 5.17: TGA plot for pure Nylon and Nylon after plasma process
5.2.4 Impregnation in thiourea solution
After showing results of plasma processing, we move to the next step of this work: to
understand if the application of thiourea on the fabric is favored by plasma activation.

Chapter 5 - Experiments performed with atmospheric and vacuum plasma equipment
62
We prepare a solution with distilled water and thiourea, so that we can achieve 80-90% of wet
add on. We dip the fabric in the solution for 15 min (impregnation), and then we pad it twice
using a pad mangle; the padder is made up of two horizontal rollers were the fabric is guided
vertically (nipping) to squeeze the solution (Fig. 5.18); so, in total, we deal with two dippings
and two nippings. Then the samples are dried in the oven at 70-80° [23].
The treated samples with ionized gas are dipped into the solution immediately after the
treatment, so that we can maximise the add on % of the flame retardant.
Fig.5.18: Nipping through two rollers after dipping in thiourea solution
We want to compare the untreated samples with specimens treated with He/O2 gas; we use two
methods to calculate the amount of flame retardant present on the fabric: the first one is the
calculation of the dry add on % with Eq. 5.1 using Mettler AE 240 balance.
𝐷𝑟𝑦 𝑎𝑑𝑑 𝑜𝑛 % =𝑤𝑒𝑖𝑔ℎ𝑡 𝑎𝑓𝑡𝑒𝑟 𝑑𝑟𝑦 − 𝑤𝑒𝑖𝑔ℎ𝑡 𝑏𝑒𝑓𝑜𝑟𝑒 𝐹𝑅 𝑎𝑝𝑝𝑙𝑖𝑐𝑎𝑡𝑖𝑜𝑛
𝑤𝑒𝑖𝑔ℎ𝑡 𝑏𝑒𝑓𝑜𝑟𝑒 𝐹𝑅 𝑎𝑝𝑝𝑙𝑖𝑐𝑎𝑡𝑖𝑜𝑛 (𝐸𝑞. 5.1)
The second method instead deals with TGA equipment, using the instrument described in § 4.2.
We show in Fig. 5.19 the trend of pure Nylon, pure thiourea, Nylon treated with plasma and
thiourea (red curve) and Nylon treated with thiourea only (blue curve). Since thiourea loses
most of its weight (around 80%) up to 330°C while nylon weight is almost constant, the amount
of thiourea in treated samples can be calculated by considering the weight loss up to 330°C.
We observe immediately that at the same temperature (330°C) the sample processed with
plasma loses more weight, so it contains more thiourea. We perform different runs with
different samples to have the standard deviation values. Plasma conditions are mentioned
earlier.
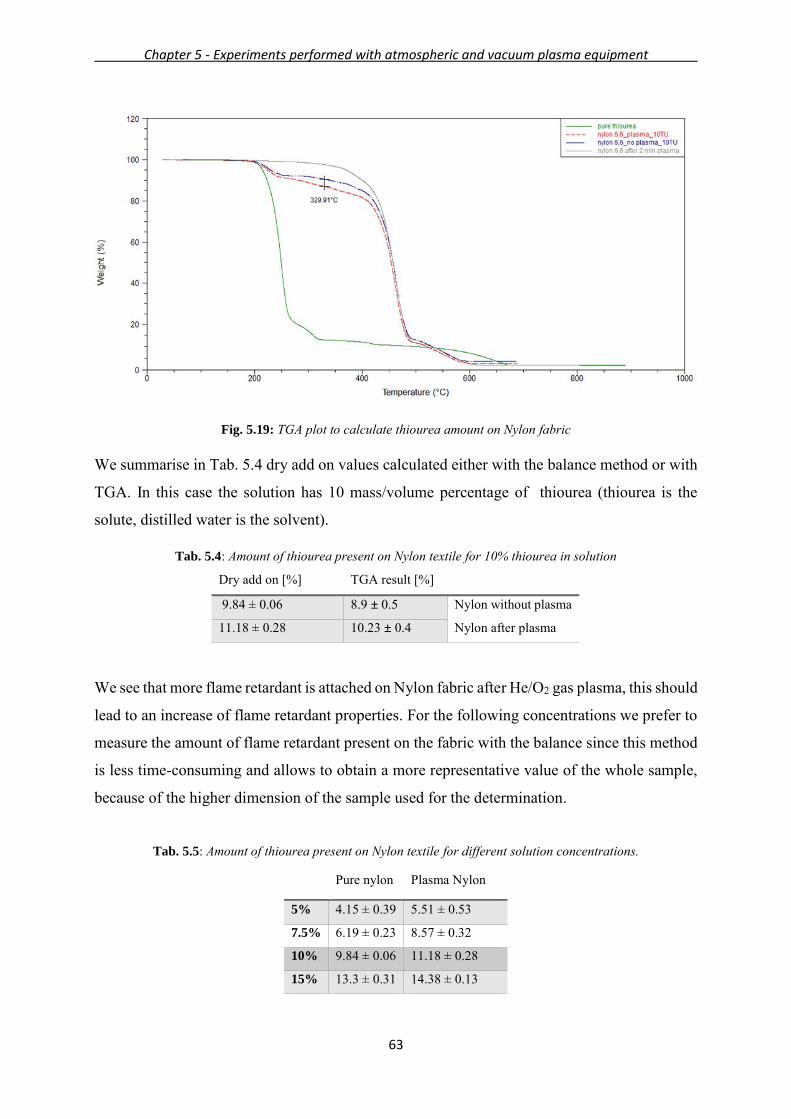
Chapter 5 - Experiments performed with atmospheric and vacuum plasma equipment
63
Fig. 5.19: TGA plot to calculate thiourea amount on Nylon fabric
We summarise in Tab. 5.4 dry add on values calculated either with the balance method or with
TGA. In this case the solution has 10 mass/volume percentage of thiourea (thiourea is the
solute, distilled water is the solvent).
Tab. 5.4: Amount of thiourea present on Nylon textile for 10% thiourea in solution
We see that more flame retardant is attached on Nylon fabric after He/O2 gas plasma, this should
lead to an increase of flame retardant properties. For the following concentrations we prefer to
measure the amount of flame retardant present on the fabric with the balance since this method
is less time-consuming and allows to obtain a more representative value of the whole sample,
because of the higher dimension of the sample used for the determination.
Tab. 5.5: Amount of thiourea present on Nylon textile for different solution concentrations.
Dry add on [%] TGA result [%]
9.84 ± 0.06 8.9 ± 0.5 Nylon without plasma
11.18 ± 0.28 10.23 ± 0.4 Nylon after plasma
Pure nylon Plasma Nylon
5% 4.15 ± 0.39 5.51 ± 0.53
7.5% 6.19 ± 0.23 8.57 ± 0.32 10% 9.84 ± 0.06 11.18 ± 0.28
15% 13.3 ± 0.31 14.38 ± 0.13

Chapter 5 - Experiments performed with atmospheric and vacuum plasma equipment
64
Also for the other concentrations we observe that the % of flame retardant pick-up after plasma
exposition is higher than Nylon samples that are not subjected to He/O2 gases, i.e. plasma
activation leads to a higher absorption of thiourea on the fabric due to the increase content of
functional polar groups. Thanks to LOI equipment we will study the flame retardancy properties
for all these concentrations and we will evaluate when we can reach the best performances.
5.2.5 LOI Results
In this paragraph we will focus on the LOI test, as explained in § 4.3. In Tab. 5.6 we present
LOI values for pure Nylon and for Nylon treated with plasma gases; no thiourea is present on
these samples. This test can give information mainly about the initial step of the fire, that is the
ignition; a higher LOI value indicates that the specimen does not lead easily to a fire spread.
Tab. 5.6: LOI values [%], standard deviations ± 0.2
From these values we conclude that plasma alone does not lead to better fire performances; now
we present Tab. 5.7, where we summarise all LOI values for samples treated with thiourea only
and for the corresponding samples treated with plasma and then thiourea. Observing the burning
of Nylon 66 samples, in general we can say that it degrades by a dripping mode, adding thiourea
what changes is drip color (Fig. 5.20), since they become much darker after impregnation in
the flame retardant solution.
Tab. 5.7: LOI values [%], standard deviation ± 0.2
Name of the sample LOI [%]
Control sample 35.6
Nylon 66 after plasma 35.3
Thiourea treatment No plasma Plasma treatm.
5 % 37.5 38.5
7.5% 40.1 41.7
10% 40.9 42.7
15% 41.5 42.4

Chapter 5 - Experiments performed with atmospheric and vacuum plasma equipment
65
Fig. 5.20: samples after LOI test
For the specimen impregnated with 10% thiourea solution, we measured the LOI test for the
sample treated with plasma and soaked in the flame retardant solution, but now the difference
is that in this case the piece of fabric is not washed as the others with the detergent. LOI value
in this case is 42.5 % ± 0.2, almost equal to the washed specimen that is 42.7 ± 0.2. So we can
state that it is possible to treat the textile avoiding waste water that derives from the scouring.
Indeed plasma is also capable of removing impurities and organic contamination, this effect is
called surface cleaning. In particular oxygen gas is important for the plasma-clean process [24].
Ablation (or plasma etching) is essential for the elimination of possible weak bond substances
present on the surface; the principal advantage of cleaning with plasma is that liquid rinse is not
necessary, since it is a dry process.
From Tab. 5.7 we see that LOI values increases when samples are exposed to plasma treatment
for all the concentrations, this result agrees with the dry pick-up values reported above; since
more flame retardant is attached on samples that are processed in the reactor, LOI increases in
the same way. To understand for which concentration we can obtain the best result in this test
we show the plot ∆LOI (difference between the LOI of the treated sample and the one of the
corresponding fabric not processed in the chamber) versus % of thiourea in Fig. 5.21.
We notice that until 10% increasing the concentration of thiourea, ∆LOI raises, but then at 15%
we observe a sudden decrease in ∆LOI, showing the presence of an optimal point for the
concentration of this flame retardant, that is 10%. This value leads to the highest fire retardancy
performance of Nylon 66, recalling that the parameters used for this study are 2 min for the
time treatment, 80 W for the power, and 5 to 1 for the gas ratio.

Chapter 5 - Experiments performed with atmospheric and vacuum plasma equipment
66
Fig. 5.21: ∆LOI versus % thiourea in solution
For this reason we will perform a DOE experiment to understand the best plasma parameters to
work with, using a concentration of thiourea equal to 10%. The relative results will be explained
in the next chapter.
We have also measured the LOI values using plasma treatment with pure gases: oxygen and
helium. In Tab. 5.8 we report the obtained results; we adopt the same parameters for the plasma
equipment and a solution of 10% thiourea.
Tab. 5.8: LOI values [%], standard deviations ± 0.2
We state that for these conditions the best LOI value is obtained with the mixture He/oxygen,
and not with single gas. Indeed oxygen generates functional groups that have temporary
stability; instead inert gas causes the presence of radicals, but not of functional groups [20], as
said in § 5.2.1. To increase surface energy and allow a major adhesion of flame retardant on the
fabric it is better to functionalise the material with the mixture.
Gas plasma LOI [%]
Helium 41.6
Oxygen 30.7
He/O2 42.7

67
Chapter 6
Statistical analysis
In this chapter we perform a DOE (Design of Experiment) using statistic software, to find the
model, if there is, which can describe the relation between the LOI response and two
parameters, time and power, considering the vacuum plasma equipment. Secondly, if a model
will be found, an optimisation step is required.
6.1 Design of experiment
We want to run a DOE using Design-Expert® software, a statistical program produced by Stat-
Ease company. We build a New Design defining the parameters involved in our work. We
choose a Response Surface as Study Type, Randomized as Subtype, I-optimal Design Type; in
this way we have the possibility to design an experiment where both time and power variables
can have discrete values. The Response variable is ∆LOI, indeed we consider the difference of
LOI value between the untreated Nylon samples (𝐿𝑂𝐼 = 40.9% ± 0.2%) and the samples
treated with different conditions of gas plasma, both dipped in 10% solution of thiourea. Our
purpose is to understand in which conditions we can maximise this variable, obtaining in this
way higher fire test performances for our fabric.
We define the minimum, medium and maximum values (3 Levels) of the two discrete factors,
as we can see in Fig. 6.1, producing 9 final runs that must be performed (Fig. 6.2). We select
120 and 300 s for time variable because for them we observed higher NPA values, and we
choose 30 as the minimum time to perform the study; concerning power values, we opt for 40,
80 and 200 W for the same reason.
After these 9 experiments, we insert the 9 ∆LOI and the program analyses the response.
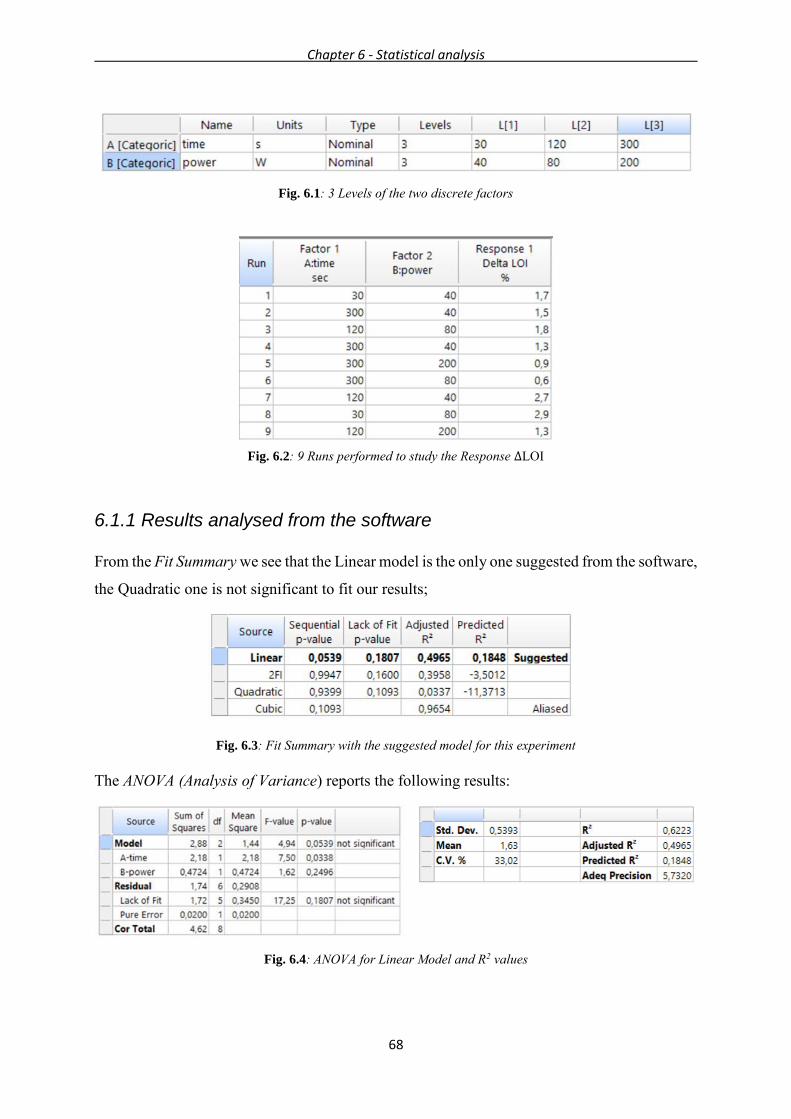
Chapter 6 - Statistical analysis
68
Fig. 6.1: 3 Levels of the two discrete factors
Fig. 6.2: 9 Runs performed to study the Response ∆LOI
6.1.1 Results analysed from the software
From the Fit Summary we see that the Linear model is the only one suggested from the software,
the Quadratic one is not significant to fit our results;
Fig. 6.3: Fit Summary with the suggested model for this experiment
The ANOVA (Analysis of Variance) reports the following results:
Fig. 6.4: ANOVA for Linear Model and R2 values

Chapter 6 - Statistical analysis
69
R2 has a value of 0.6223, so less than 1, it means that the observed response variable is different
from the one expected. Moreover, the Predicted R2 is not close to the Adjusted, they should be
within 0.20 of each other; this may indicate a possible problem with the model, we should
consider the presence of outliers for example.
P-values less than 0.05 (confidence interval of 95% is chosen by default) indicate model terms
that are significant, values higher than 0.1 instead are not significant; in this case A (i.e. time)
is significant, not B (i.e. power). Significant model terms probably have a real effect on the
response.
We identify the relative impact of time factor higher than power factor.
The final equation in terms of actual factors, that can be used to make prediction about the
response for given levels of each factor, is the following:
∆𝐿𝑂𝐼 = 2.757 − 0.004 ∗ 𝑡𝑖𝑚𝑒 − 0.004 ∗ 𝑝𝑜𝑤𝑒𝑟 (𝐸𝑞. 6.1)
Now we focus on the Diagnostic Report and its graphs; we show in Fig. 6.5 two plots, the first
has on y-axis the predicted values (generated using the prediction equation), on x-axis instead
the actual ones (measured for that particular run); on the line predicted values are equal to the
actual ones, so for the points that lie on the line we can say that the model is well predicting our
experimental points. Otherwise this represents how far points are from this line, and so the
degree of accuracy of the model.
Regarding the DFFITS index as function of Run number, it measures the influence the ith
observation has on the predicted value; it takes into account the Leverage: this number can vary
from 0 to 1, if it is 1 the predicted value in that case will exactly equal the observed value of
the experiment, and the residual will be 0.
Fig. 6.5: Diagnostics graphs

Chapter 6 - Statistical analysis
70
We notice that the linear model does not fit the actual values, as expected from the R2 value.
Moreover, we notice an outlier that exceeds limits [-1.73205, 1.73205], that is the first run. So,
what we can do is to perform another statistical analysis ignoring the first experimental value,
to understand if the software finds a better regression.
6.1.2 Statistical analysis after ignoring the first Run
From the Fit Summary (Fig. 6.6) the suggested model is either Linear or Quadratic; we should
focus on the model that maximises the Adjusted R2, so the Quadratic one. Now AB, A2, B2
terms will be included as well.
Fig. 6.6: Fit Summary with the suggested model for this experiment
The ANOVA (Analysis of Variance) displays the following results, collected in Fig. 6.7:
Fig. 6.7: ANOVA for Quadratic Model and R2 values
All terms, checking the p-values, are significant, only A2 is a border line term with a p-value of
0.071, but it is less than 0.1, so still acceptable. Here we notice that R2 is rather close to 1,
moreover the Predicted R2 is not defined, indeed in this case the Leverage is 1.
The final equation in terms of actual factors is indicated in Eq. 6.2:
∆𝐿𝑂𝐼 = 6.036 − 0.019 ∗ 𝑡 − 0.044 ∗ 𝑃 + 3.2 ∗ 10−5 ∗ 𝑡 ∗ 𝑃 + 2.4 ∗ 10−5 ∗ 𝑡2
+ 12.9 ∗ 10−5 ∗ 𝑃2 (𝐸𝑞. 6.2)

Chapter 6 - Statistical analysis
71
In Fig. 6.8 we show the plot of predicted values of the response versus the actual ones. In this
situation we see that the model can fit very well the experimental data since almost all the points
are on the line.
Fig. 6.8: Diagnostics graph
In Model Graphs we can observe the 2D Surface Response and the 3D one (Fig. 6.9 and 6.10);
from Contour we select the 2D surface, where we study the time-power dependence and the
behaviour of the process. Black bends are parametric with ∆LOI values: for example at a fixed
value of power, increasing the treatment time, the response parameter decreases; for a fixed
value of time, increasing the power, the response variable decreases as well. To have the same
LOI value, when increasing the time it is necessary to decrease the power, and vice versa.
From a physical point of view this means that the Nylon 66 fabric has to be treated at low time
and power, indeed higher values of ∆LOI are observed in the red region. The reason could be
that, for a prolonged treatment period, etching effects due to superficial interactions can occur,
and these cause an increasing of the fabric temperature, destroying the formed functional
groups.
Also increasing the power of the plasma more radicals are present, their high concentration can
lead to reactions, crosslinking that can produce an opposite effect to the functionalisation [25].

Chapter 6 - Statistical analysis
72
Fig. 6.9: Contour representation of the process behaviour
The 3D surface (Fig. 6.10) that displays the relation between these 3 factors is not flat, its
curving is due to the relation between time and power, the model indeed does not consider these
two factors independent, also their product is involved in the final equation.

Chapter 6 - Statistical analysis
73
Fig. 6.10: 3D representation of the process behaviour
6.1.3 Optimisation
In the Optimization box we select Numerical, in Criteria window we maximise the response
variable ∆LOI, since this is our goal. To obtain a ∆LOI of about 2.9% we have to perform a last
experiment: the software tells us to use a power of 50 W, with a time of 80 s (Fig. 6.11). If this
happens, it means that the model is predicting well the behaviour of the response parameter.

Chapter 6 - Statistical analysis
74
Fig. 6.11: Optimisation graphical representation
After performing this last experiment, we state that the obtained value for LOI is 44 ± 0.2, with
a ∆LOI of 3.1; considering the standard deviation related to LOI equipment (± 0.2) and the
rounding of the power and time parameters, we conclude that the model can well predict LOI
values.
Measuring the amount of thiourea present on the samples, these specimens treated with plasma
have 11.92 % ± 0.23 of dry pick-up, instead, as mentioned in § 5.2.4, specimens that are not
treated with He/O2 have a LOI of 9.84% ± 0.06.
6.1.4 FTIR Spectra after soaking in thiourea solution
The optimized sample has also been characterized by FTIR. In Fig. 6.12 we show FTIR
spectrum of Nylon fabric soaked in 10% solution of thiourea compared to the spectrum of pure
Nylon 66; the goal is to show the new peaks that appear after dipping the textile into flame
retardant solution.
We observe a new peak at 1083 cm-1, it represents the C=S stretching that is the bond present
in thiourea molecule. A more accentuated peak is the one at around 727 cm-1, that probably
indicates the presence of C-N single bond, present in thiourea structure [26]. Also we notice
different intensities of the peaks that appear in the region 1475-1370 cm-1, area that belongs to
C-H bending.

Chapter 6 - Statistical analysis
75
Fig. 6.12: Comparison between pure Nylon and dipped Nylon spectra
As follows we report two FTIR spectra, where we compare the spectrum of Nylon dipped in
15% solution of thiourea without plasma treatment, and the one soaked in the solution after
plasma treatment. Plasma conditions are 80 s and 50 W, as suggested by the Optimisation. Here
we choose a concentration of 15% because it is more evident from these FTIR results the
distinction between the two spectra, compared to 10% analyses.
Fig. 6.13: Comparison between the sample treated with plasma and TU and the one with just TU
73
3
10
84
727
108
3

Chapter 6 - Statistical analysis
76
Since N-H bending has a peak present on Nylon 66 spectrum but not in the thiourea one, we
consider it as a reference peak for the calculation of NPA value for samples soaked in thiourea
solution. In Tab. 6.1 we compare these values for the two samples analysed in Fig. 6.13.
Tab. 6.1: NPA values for samples soaked in 15% thiourea solution
We conclude that, according to the results presented in the previous chapter, more flame
retardant is attached on Nylon surface after plasma treatment; this can be seen from dry add on
results, LOI values and in addition, from FT-IR spectra reported above. NPA values calculated
in Tab. 6.1 show that C=S bond has a higher absorption after plasma treatment.
DOE experiment has allowed us to find the best conditions to process this textile in order to
increase flame retardancy performances, and this can be seen from the final LOI value that is
obtained with 80 s and 50 W. Then we have proved that also in this case the increase of LOI
after plasma process is due to a higher amount of thiourea attached on the fabric.
6.1.5 SEM images for the optimised treatment
Fig. 6.14 shows the SEM images of Nylon treated for 80 s and at 50 W. We see that at low
power and for a short treatment time slits and grooves are not observed on the fibres, we do not
observe pronounced modifications on the morphological structure, but rather a regular surface.
Fig. 6.14: SEM images of sample treated for 80 s at 50 W
Absorbance [cm-1] No plasma Plasma treatm.
1084 (C=S) 0.27 0.32
733 (C-N) 0.23 0.24

77
Conclusions
The main objective of this work has been the enhancement of the flame retardancy of Nylon 66
textile by improving the effectiveness of the flame retardants treatment, i.e. the amount of flame
retardant uptake, by using plasma functionalization, both atmospheric and vacuum one.
Regarding the atmospheric instrument we can assess that this type of plasma, for both gases
tested (Ar and O2), is not working well on this fabric, since the treatment is not homogenous
and leads to no variation in the surface composition. Also from the SEM images we can
conclude that not pronounced grooves are detected, while the plasma should lead to a rougher
surface, that in this case is not observed. For this reason we have decided to proceed analysing
deeply the vacuum plasma instrument, which though has higher costs and this is its main
limitation.
From preliminary test, based on the capillarity test and the FT-IR spectra results, we have
decided to treat the fabric with the microwave vacuum plasma for 2 min, at 80 W and with a
gas ratio for the mixture He/O2 equal to 5:1. These results have also proved that vacuum plasma
caused a more homogeneous treatment, with respect to the atmospheric instrument.
Then it has been shown that, whatever the thiourea concentration used in the finishing solution,
plasma treated textile exhibited a higher thiourea uptake and, therefore, a higher limiting
oxygen index. The greatest difference between functionalized and un-functionalized samples
has been obtained for 10% thiourea solution, for which the dry add-on increased from 9.84%
for the control sample (no plasma,) to 11.18% for the sample treated by plasma. The resulting
LOI is 40.9 ± 0.2 for the control specimen and 42.7 ± 0.2 for the treated one.
Finally, DOE investigation was performed varying time and power variables, where the
response parameter is ∆LOI, i.e. the difference in LOI between control and plasma-treated
sample. A quadratic model fit the data in a good way, with the R2 equal to 0.9945. Using the
model, from the contour representation and the 3D graph, it can be seen that treating the fabric
at low times and powers improved the performance, since in this way we can avoid etching
effects or the cross-linking of radicals. The optimisation suggested by the software was
experimentally verified and treating nylon textile for 80 s and 50 W, with a 5:1 He/O2 mixture
a LOI of 44 ± 0.2 was obtained.
78
In conclusion, we affirm that the goal is reached, fire retardancy performances after plasma
treatment can increase, thanks to a major uptake of thiourea on the surface.
Future studies should be done to find an atmospheric machine that can generate an efficient
treatment on the fabric, so that more flame retardant can be add on Nylon surface, decreasing
the costs related to this procedure. A further improvement should be obtained avoiding
completely the wet finishing process, thus avoiding the generation of wastewater. A new mode
of applying the flame retardant on textiles is its vaporisation simultaneously with the plasma
process. In this way it may create free radicals on the surface, which may form covalent bonds
with the flame retardant introduced in the same equipment. In Huddersfield (UK) it is present
a patented apparatus that can treat at atmospheric pressure the material and dispense the
finishing right after the plasma activation; future work is needed to understand if it can actually
work.

79
References
[1] A. F. Holdsworth, “Novel Metal Complex Fire Retardants for Engineering Polymers,”
Ph.D. thesis, University of Bolton, 2015.
[2] C. A. Wilkie, and A. B. Morgan, “Fire Retardancy of polymeric Materials: 2nd Edition,”
ch. 2, pp. 15-42, CRC Press, Boca Raton, 2010.
[3] L. H. Peebles, JR., and M. W. Huffman, “Thermal Degradation of Nylon 66,” J. Polym.
Sci., vol. 9, no. 7, pp. 1807–1822, 1971.
[4] P. N. Thanki, and R. P. Singh, “Photo-oxidative degradation of nylon 66 under
accelerated weathering,” Polymer, vol. 39, no. 25, pp. 6363–6367, 1998.
[5] D. Zavattini, “I filati di nylon 6,6: lavorazioni e caratteristiche principali, applicazioni e
valutazione ambientale del ciclo produttivo,” tesi di laurea in Ingegneria dei Materiali,
Università degli Studi di Padova, 2011.
[6] H. Conrads, and M. Schmidt, “Plasma generation and plasma sources,” Plasma Sources
Sci. Technol., vol. 9, no. 4, pp. 441–454, 2000.
[7] A. Sparavigna, “Plasma treatment advantages for textiles,” arXiv:0801.3727, 2008.
[8] C. W. Kan, and W. S. Man, “Surface characterisation of atmospheric pressure plasma
treated cotton fabric-Effect of operation parameters,” Polymers, vol. 10, no. 3, pp. 250-
264, 2018.
[9] K. B. Gilleo, “Nylon Flammability-Effects of Thiourea, Ammonium Sulfamate, and
Halogen Compounds,” Ind. Eng. Chem. Prod. Res. Develop., vol. 13, pp. 139-143, 1974.
[10] E. D. Weil, and S. V. Levchik, “Flame Retardants for Plastics and Textiles,” Hanser
Publications, Ohio, 2009.
[11] A. R. Horrocks, “Flame retardant challenges for textiles and fibres: New chemistry
versus innovatory solutions,” Polym. Degrad. Stab., vol. 96, no. 3, pp. 377–392, 2011.
[12] “BS EN ISO 4589 ‑ 2 : 2017 BSI Standards Publication Plastics — Determination of

80
burning behaviour by oxygen index,” 2017.
[13] K. H. Kale, and A. N. Desaia, “Atmospheric pressure plasma treatment of textiles using
non-polymerising gases,” Indian J. Fibre Text. Res., vol. 36, no. 3, pp. 289–299, 2011.
[14] S. E. More, P. S. Das, A. Bansode et. al., “Diagnostics of microwave assisted electron
cyclotron resonance plasma source for surface modification of nylon 6,” Rev. Sci.
Instrum., vol. 89, no. 1, 2018.
[15] E. N. Hristea, M. T. Caproiu, G. Pencu, and M. Hillebrand, “and HOO – Radicals and
Anions,” Int. J. Mol. Sci., vol. 7, pp. 130–143, 2006.
[16] B. Ozcelik, J. H. Lee, and D. B. Min, “Effects of Light , Oxygen , and pH on the Effects
of Light , Oxygen , and pH on the Absorbance of 2 , 2-Diphenyl-1-picrylhydrazyl,” J. of
Food Chem. and Techn., vol. 68, no. July 2006, pp. 487–490, 2014.
[17] A. G. J. Ghadam, and H. Karimi, “Synthesis and Characterization of Polyamide-
66/Calcium Carbonate Composites, ” J. of Chem. and Petr. Engin., vol. 49, no. 1, pp.
63-78, 2015.
[18] A. Haji, A. Mousavi Shoushtari, and M. Mirafshar, “Natural dyeing and antibacterial
activity of atmospheric-plasma-treated nylon 6 fabric,” Color. Technol., vol. 130, no. 1,
pp. 37–42, 2014.
[19] W. Zhang, L. Johnson, S. R. P. Silva, and M. K. Lei, “The effect of plasma modification
on the sheet resistance of nylon fabrics coated with carbon nanotubes, ” Appl. Surf. Sci.,
vol. 258, pp. 8209-8213, 2012.
[20] C. M. Chan, T. M. Ko, and H. Hiraoka, “Polymer surface modification by plasmas and
photons,” Surf. Sci. Rep., vol. 24, no. 1–2, pp. 1–54, 1996.
[21] G. Rosace, and R. Canton, “Influence of Low-Temperature Plasma Conditions on
Wicking Properties of PA/PU Knitted Fabric, ” J. Appl. Sci., vol. 107, pp. 3702-3706,
2007.
[22] W. J. Sichina, “Characterization of Polymers Using TGA,” Therm. Anal., pp. 1–4, 2011.
[23] K. R. Millington, G. Maurdev, and M. J. Jones, “Mechanism of photoprotection of wool
with formaldehyde and thiol derivatives,” Color. Technol., vol. 125, no. 2, pp. 117–122,
2009.

81
[24] M. Strobel, C.S. Lyons, and K. L. Mittal, “Plasma Surface Modifications of Polymers:
Relevance to Adhesion,” CRC Press, New York, 2018.
[25] U. Cvelbar, “Interaction of non-equilibrium oxygen plasma with sintered graphite,”
Appl. Surf. Sci., vol. 269, pp. 33–36, 2013.
[26] C. Hampton, and D. Demoin, “Vibrational Spectroscopy Tutorial: Sulfur and
Phosphorous” https://faculty.missouri.edu/~glaserr/8160f10/A03_Silver.pdf, accessed
on 15th September 2018.

82

83
Acknowledgments
First of all, I would like to thank Prof. Lorenzetti for her support and her precious advices
within these months. Also, I thank her for the opportunity to work abroad at University of
Bolton.
Here I had the possibility to meet Prof. Kandola and Prof. Horrocks, that have explained me
the principles of plasma equipment and of flame retardants. Moreover, another important
person was my patient and sweet tutor Maram, that has always reassured me in the difficult
moments. Then, I would like to thank all the PhD students and the technician John of the fire
office, with which I have spent happy moments.
Thank you also to my flat mates Zhishi and Maira, I will miss you.
Proseguo con il ringraziare le persone che ho incontrato nel laboratorio di polimeri
all’Università di Padova; ringrazio Elena per la sua disponibilità e il tempo dedicatomi, Romeo
per avermi insegnato ad usare i vari strumenti, Carlo e Martina per la loro gentilezza nel
risolvere i problemi incontrati durante questo percorso. Inoltre ringrazio Lorenza che con le
sue schiume mi ha fatto compagnia nelle giornate di laboratorio, tutti i tesisti e dottorandi
dell’ufficio per i momenti spensierati e i mega pranzi trascorsi insieme.
Dei ringraziamenti speciali vanno ai miei genitori e mio fratello Michele, senza il loro aiuto
economico e soprattutto emotivo non avrei mai raggiunto questo importante traguardo.
Questo percorso è stato più spensierato grazie ai compagni di corso che in questi anni sono
diventati anche degli amici. In particolare grazie Deborah, insieme a te tutti i pomeriggi di
studio, i lavori di gruppo sono stati più divertenti, e grazie per le ore di chiacchierata su Skype
quando avevo bisogno di una parola di conforto.
Grazie ai miei pazzi coinquilini Martina, Chiara e Leonardo e alle nostre ‘serate pizza’.
Vorrei poi ringraziare le mie amiche Vanessa, Sara, Valentina, Gioia, Bonnie per aver tollerato
i miei momenti di assenza ed esserci da sempre.
Per ultimo, ma più importante, ringrazio Filippo, solo tu e mamma Daniela potevate
sopportare tutte le mie ansie e spingermi sempre ad andare avanti con entusiasmo.

84