Embed Size (px)
Citation preview
Journal of Mechanical Engineering and Sciences (JMES)
ISSN (Print): 2289-4659; e-ISSN: 2231-8380
Volume 11, Issue 1, pp. 2526-2538, March 2017
© Universiti Malaysia Pahang, Malaysia
DOI: https://doi.org/10.15282/jmes.11.1.2017.11.0232
2526
Cohesive zone modelling of Mode III delamination using the edge crack torsion
test
H.A. Israr, K.J. Wong* and M.N. Tamin
Centre for Composites, Faculty of Mechanical Engineering,
Universiti Teknologi Malaysia,
81310 UTM, Johor Bahru, Malaysia *Email: [email protected]
Phone: +6075534637; Fax: +6075566159
ABSTRACT
In the experimental studies of mode III delamination using the edge crack torsion test, the
crack initiation and propagation measurement are always difficult. This information could
be obtained through numerical modelling. The objective of this study is to propose a
guideline to model mode III delamination behaviour using cohesive elements. Finite
element models of an edge crack torsion specimen were developed based on the data from
the literature. The delamination behaviour of the specimen along the pre-crack, which
was located at the mid-thickness location, was modelled using cohesive elements.
Through parametric studies, it was found that for reliable numerical modelling, a mesh
size of 0.5 mm was suggested, which provided three elements in the cohesive zone. As
for the interface strength, it was recommended to choose 80 MPa. In addition, a viscosity
parameter of 110-3 was found to be a good choice for reasonable computational time and
converged numerical results. Besides, the interface stiffness was suggested to be 4106
MPa/mm. Furthermore, the fracture process zone contour revealed that the delamination
was started at a normalised location of approximately 0.7. Not only that, the fracture
energy and strain distribution plots have shown the delamination was mode III dominated
within the normalised distance of 0.34-0.86. The results from this study suggested that
cohesive zone modelling is a useful method for the detailed analysis of the mode III
delamination of an ECT specimen. The numerical modelling approach suggested from
this study could be applied to ECT specimens at various different initial crack lengths. It
also has the potential to be used to simulate the mode III delamination of other various
types of laminated composites.
Keywords: Interlaminar fracture; Mode III; edge crack torsion; cohesive zone modelling.
INTRODUCTION
In the studies of the delamination of composite laminates, mode III delamination has been
recognised to be important due to its contribution to edge delamination [1]. The recent
testing methods on mode III delamination include the modified split cantilever beam
(MSCB) [2, 3], modified edge crack torsion (MECT) (which is still commonly known as
edge crack torsion (ECT)) [4, 5], six ECT (6ECT) [6], modified shear torsion bending
(MSTB) [7], which was initially designed for mixed-mode I+II+III delamination [8],
split-shear torsion (SST) [9] and newly designed torsional tests [10]. Among the above
Israr et al. / Journal of Mechanical Engineering and Sciences 11(1) 2017 2426-2438
2527
mentioned tests, the edge crack torsion test is currently under evaluation by the American
Society for Testing and Materials (ASTM) to be standardised [11]. The advantages of the
edge crack torsion test include pure mode III delamination in the middle region of the
specimen and negligible friction between the delaminated surfaces [12]. However, during
the experimental testing, the initiation and propagation of the crack of the edge crack
torsion specimen are not easily captured from the edges. This information could be
obtained through numerical analyses.
The common numerical modelling approaches for the delamination of composite
laminates are the virtual crack closure technique (VCCT) and the cohesive zone model
(CZM) [13]. The VCCT has been commonly employed by various researchers to simulate
the mode III delamination of carbon/epoxy [6, 14-16] and glass/epoxy [3, 5, 17-20]
composite laminates. Nevertheless, in recent years, the CZM has gained its popularity in
simulating the delamination behaviour of laminated composites. Its major advantage over
the VCCT is the ability to predict both the onset and non-self-similar propagation of
delamination without needing a pre-crack [21]. However, the CZM has been used more
widely encountered in simulating mode I, mode II and mixed-mode I+II delamination
behaviour [22-24]. It is comparatively less common to be employed in mode III
delamination [6, 25, 26]. Furthermore, in the above mentioned three references, the choice
of the cohesive parameters (element size, interface strength, viscosity parameter and
interface stiffness) was not described. In this respect, there is a need to conduct a detailed
parametric study of the cohesive parameters on mode III delamination of the edge crack
torsion (ECT) specimen. The objective of this study is to suggest guidelines to select a
suitable range for the cohesive parameters to simulate the delamination behaviour of the
ECT specimens. The experimental result from the literature [15] was used. Through
parametric studies, guidelines for the parameter selection for mode III delamination using
the ECT test were proposed. Subsequently, the damage initiation and propagation profiles
were also plotted and compared with the fracture energy distribution. Finally, the strain
distributions in the ECT specimen were presented.
NUMERICAL MODELLING
Cohesive Zone Model for Pure Tearing Mode Failure
In this study, a cohesive element [27] was employed to simulate the delamination between
the plies adjacent to the pre-crack. This type of element considers only out-of-plane stress
components, and is generally known as the interface element. Since the present study
focused on the mode III interlaminar fracture, only the formulation for delamination in
the tearing mode is discussed. Consider an eight-node three-dimensional cohesive
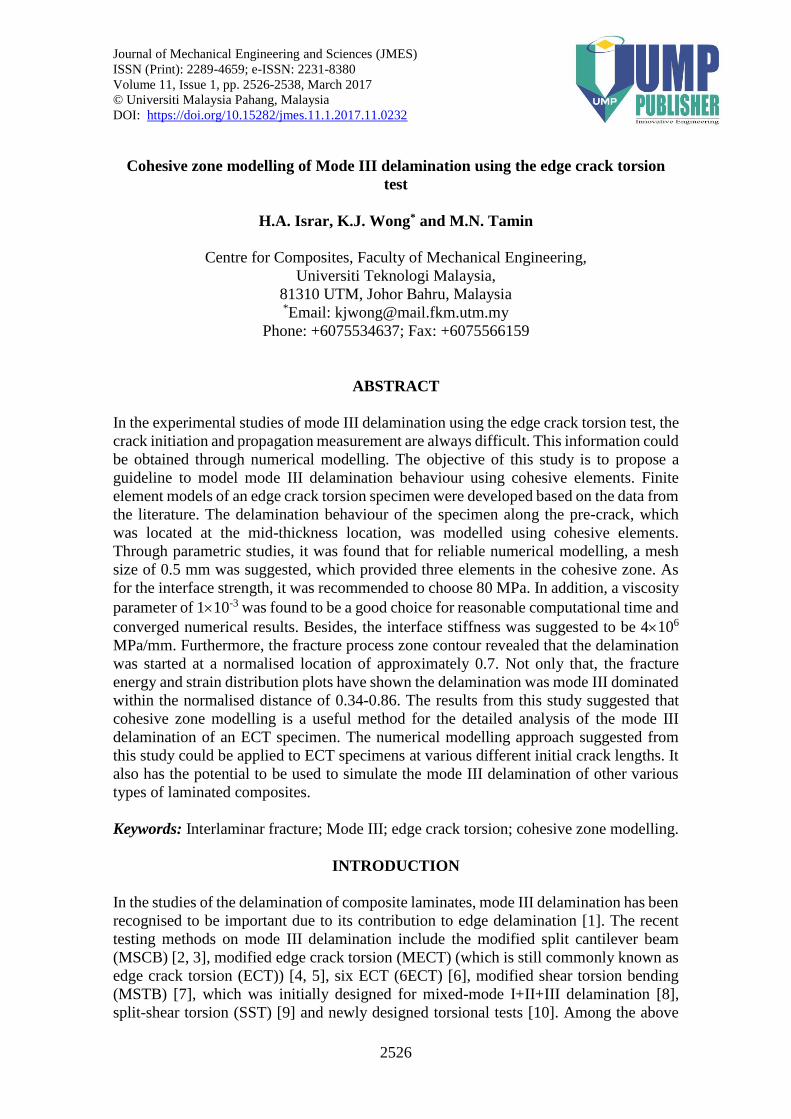
element that is subjected to loading as shown in Figure 1. Before any delamination
damage occurs, the traction separation behaviour is assumed to be linear elastic. At any
instant, the element is experiencing a relative displacement between the upper, uIII,up and
lower, uIII,low nodes, which is denoted as δIII and is stored as the corresponding
displacement at the integration point. For uncoupled shear traction, the constitutive
behaviour is given as:
(1)
where tIII is the traction (stress) and kIII is the interface stiffness (stiffness per unit
thickness of the cohesive element). The subscript III refers to the tearing mode.
III III IIIt k
Cohesive zone modelling of Mode III delamination using the edge crack torsion test
2528
Figure 1. Schematic diagram of a three-dimensional cohesive element.
Interface damage initiation is governed by a quadratic nominal stress criterion.
For pure mode III, it is written as:
(2)
where tu,III is the interlaminar strength in the tearing direction, which could be reduced to
the maximum nominal stress criterion for this particular case, where the traction ratio on
the left is not squared.
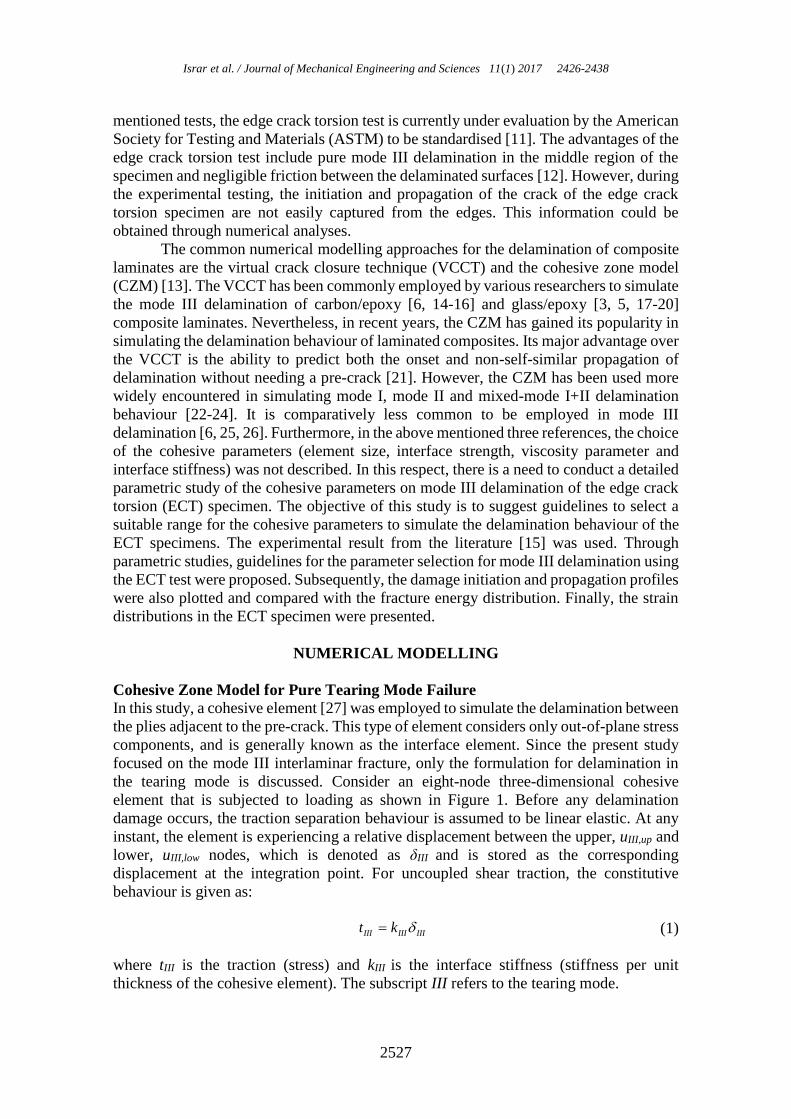
Delamination starts to occur at a material point of the interface when the quotient
of the nominal stress ratio reaches unity. Subsequently, damage evolution occurs. In this
study, the linear damage evolution law was used as described in Figure 2.
Figure 2. Schematic diagram of the bilinear traction separation law.
2
,
1III
u III
t
t
Israr et al. / Journal of Mechanical Engineering and Sciences 11(1) 2017 2426-2438
2529
The damage parameter, D for the linear softening behaviour is written as:
(3)
where δo,III and δf,III refer to the relative displacement at damage onset and total failure.
Linear softening was adopted due to its simplicity and accuracy compared to other
traction-separation laws such as the exponential law [27].
During damage evolution, the constitutive behaviour of the interface is then
calculated based on the following equation:
(4)
The damage evolution zone is governed by the dissipated energy due to damage,
which is represented by the area under the curve of traction-separation. With the
computed relative displacement δIII at each iteration, D could be calculated. The damage
variable, D is then updated into the stiffness matrix in Equation (4) and the traction, tIII is
updated. Subsequently, the corresponding mode III fracture energy, GIII could be
calculated and compared with GIIIC. When the total fracture energy is equivalent to the
fracture toughness (GIII = GIIIC), D = 1 and the material point is completely damaged.
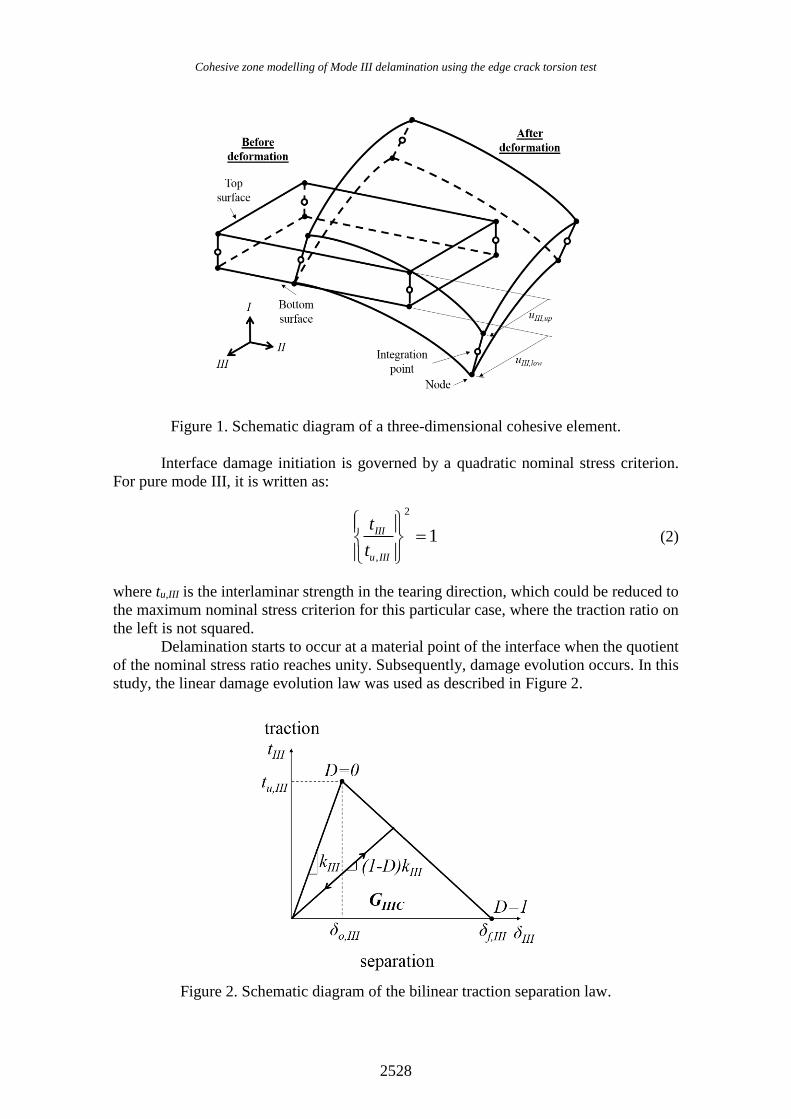
(a)
(b)
Figure 3. Finite element model of the ECT specimen: (a) top view; (b) front view.
, ,
, ,
( )
( )
f III III o III
III f III o III
D
(1 )III III IIIt D k
Cohesive zone modelling of Mode III delamination using the edge crack torsion test
2530
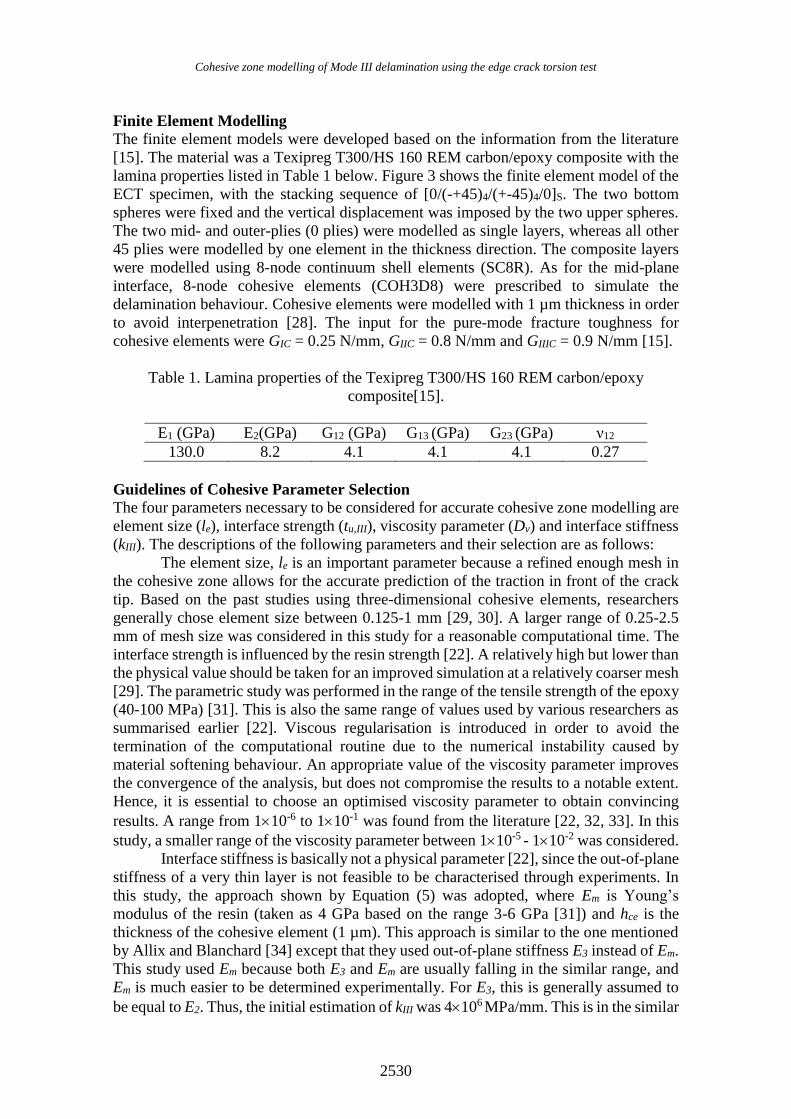
Finite Element Modelling
The finite element models were developed based on the information from the literature
[15]. The material was a Texipreg T300/HS 160 REM carbon/epoxy composite with the
lamina properties listed in Table 1 below. Figure 3 shows the finite element model of the
ECT specimen, with the stacking sequence of [0/(-+45)4/(+-45)4/0]S. The two bottom
spheres were fixed and the vertical displacement was imposed by the two upper spheres.
The two mid- and outer-plies (0 plies) were modelled as single layers, whereas all other
45 plies were modelled by one element in the thickness direction. The composite layers
were modelled using 8-node continuum shell elements (SC8R). As for the mid-plane
interface, 8-node cohesive elements (COH3D8) were prescribed to simulate the
delamination behaviour. Cohesive elements were modelled with 1 µm thickness in order
to avoid interpenetration [28]. The input for the pure-mode fracture toughness for
cohesive elements were GIC = 0.25 N/mm, GIIC = 0.8 N/mm and GIIIC = 0.9 N/mm [15].
Table 1. Lamina properties of the Texipreg T300/HS 160 REM carbon/epoxy
composite[15].
E1 (GPa) E2(GPa) G12 (GPa) G13 (GPa) G23 (GPa) ν12
130.0 8.2 4.1 4.1 4.1 0.27
Guidelines of Cohesive Parameter Selection
The four parameters necessary to be considered for accurate cohesive zone modelling are
element size (le), interface strength (tu,III), viscosity parameter (Dv) and interface stiffness
(kIII). The descriptions of the following parameters and their selection are as follows:
The element size, le is an important parameter because a refined enough mesh in
the cohesive zone allows for the accurate prediction of the traction in front of the crack
tip. Based on the past studies using three-dimensional cohesive elements, researchers
generally chose element size between 0.125-1 mm [29, 30]. A larger range of 0.25-2.5
mm of mesh size was considered in this study for a reasonable computational time. The
interface strength is influenced by the resin strength [22]. A relatively high but lower than
the physical value should be taken for an improved simulation at a relatively coarser mesh
[29]. The parametric study was performed in the range of the tensile strength of the epoxy
(40-100 MPa) [31]. This is also the same range of values used by various researchers as
summarised earlier [22]. Viscous regularisation is introduced in order to avoid the
termination of the computational routine due to the numerical instability caused by
material softening behaviour. An appropriate value of the viscosity parameter improves
the convergence of the analysis, but does not compromise the results to a notable extent.
Hence, it is essential to choose an optimised viscosity parameter to obtain convincing
results. A range from 110-6 to 110-1 was found from the literature [22, 32, 33]. In this
study, a smaller range of the viscosity parameter between 110-5 - 110-2 was considered.
Interface stiffness is basically not a physical parameter [22], since the out-of-plane
stiffness of a very thin layer is not feasible to be characterised through experiments. In
this study, the approach shown by Equation (5) was adopted, where Em is Young’s
modulus of the resin (taken as 4 GPa based on the range 3-6 GPa [31]) and hce is the
thickness of the cohesive element (1 µm). This approach is similar to the one mentioned
by Allix and Blanchard [34] except that they used out-of-plane stiffness E3 instead of Em.
This study used Em because both E3 and Em are usually falling in the similar range, and
Em is much easier to be determined experimentally. For E3, this is generally assumed to
be equal to E2. Thus, the initial estimation of kIII was 4106 MPa/mm. This is in the similar
Israr et al. / Journal of Mechanical Engineering and Sciences 11(1) 2017 2426-2438
2531
range of the values generally used by researchers [22, 29, 30, 35]. To study the effects of
interface stiffness on the numerical force-displacement response, the range between
4105 - 4108 MPa/mm was considered. Table 2 summarises the range of the cohesive
parameters considered in this study.
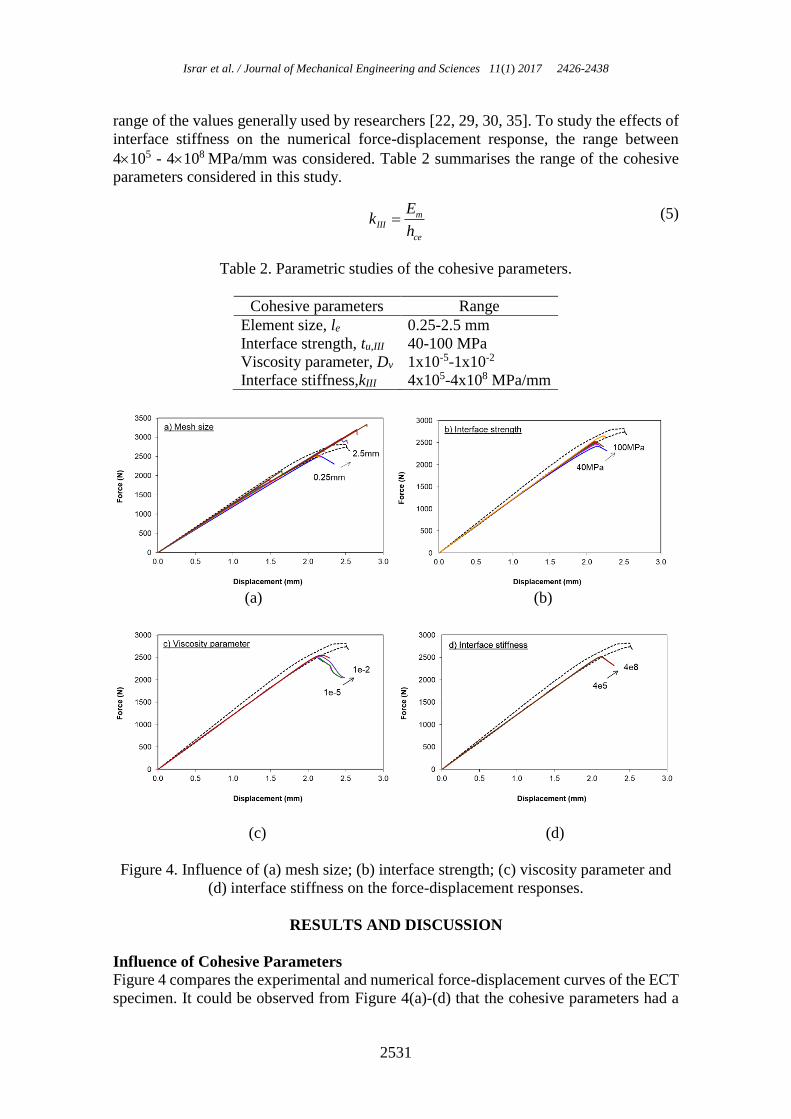
(5)
Table 2. Parametric studies of the cohesive parameters.
Cohesive parameters Range
Element size, le 0.25-2.5 mm
Interface strength, tu,III 40-100 MPa
Viscosity parameter, Dv 1x10⁻⁵-1x10⁻²
Interface stiffness,kIII 4x10⁵-4x10⁸ MPa/mm
(a) (b)
(c) (d)
Figure 4. Influence of (a) mesh size; (b) interface strength; (c) viscosity parameter and
(d) interface stiffness on the force-displacement responses.
RESULTS AND DISCUSSION
Influence of Cohesive Parameters
Figure 4 compares the experimental and numerical force-displacement curves of the ECT
specimen. It could be observed from Figure 4(a)-(d) that the cohesive parameters had a
mIII
ce
Ek
h
Cohesive zone modelling of Mode III delamination using the edge crack torsion test
2532
negligible effect on the slope of the force-displacement curves. Nevertheless, a certain
variation was found in the peak load. Figure 4(a) illustrates that the peak load increased
with the mesh size. Specifically, when the mesh size was 1.5 mm and above, the
numerical peak loads have exceeded the experimental ones. As for the interface strength,
this was also reported to follow an increasing trend (Figure 4(b)). Up to 100 MPa, the
numerical to experimental peak load ratio was 0.94. In addition, Figure 4(c) indicates that
the increasing viscosity parameter has increased the numerical peak load as well. Similar
to the interface strength, the numerical peak loads were always lower compared to the
experimental values. A slight increment in the numerical peak load was noticed with the
increment in the interface stiffness (Figure 4(d)). However, the difference was negligible.
The detailed comparison among the numerical peak loads was therefore carried out in the
following.
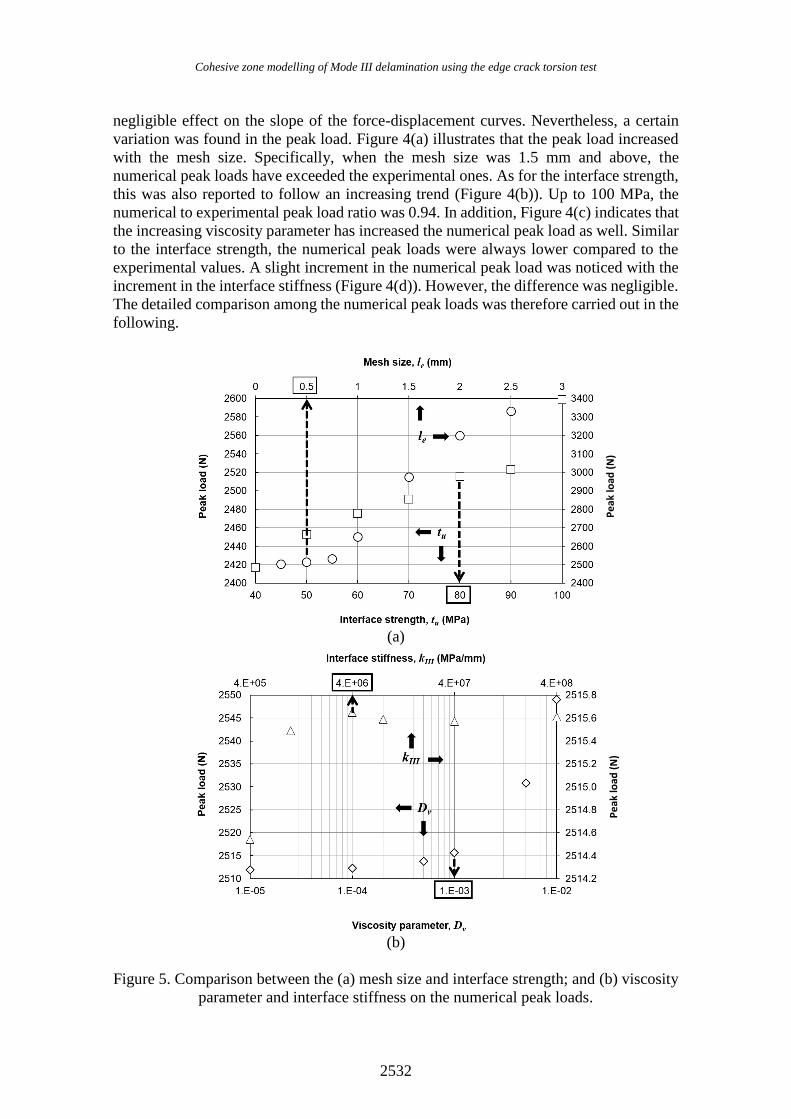
(a)
(b)
Figure 5. Comparison between the (a) mesh size and interface strength; and (b) viscosity
parameter and interface stiffness on the numerical peak loads.
Pe
ak lo
ad (
N)
Pe
ak lo
ad (
N)
Israr et al. / Journal of Mechanical Engineering and Sciences 11(1) 2017 2426-2438
2533
From Figure 5(a), it was found that a mesh size of 0.5 mm and below is
recommended. In addition, the interface strength was noticed to converge up to 80 MPa.
As for the viscosity parameter, Figure 5(b) depicts that a value of 1×10⁻³ and below was
a good choice for the converged result. A further decrement in the viscosity parameter
did not vary the numerical peak load for more than 1%; however, it would significantly
increase the computation time. This was similar to a recent study on the three-dimensional
modelling of mode II delamination using the CZM [36]. Furthermore, the interface
stiffness did not seem to be sensitive within the studied range. This was because the initial
linear elastic region of the traction-separation response was relatively small compared to
the damage propagation region. Hence, the value of 4106 MPa/mm was a good choice
because it could be easily estimated using Equation (5). This was also in the similar range
of the values generally used by researchers [22, 29, 30, 35]. From the above parametric
studies, the suggested cohesive parameters for accurate simulation with reasonable
computational time were le = 0.5 mm, tu,III = 80 MPa, Dv = 110-3 and kIII = 4106
MPa/mm. This set of cohesive parameters was found to be within the similar range as
suggested by other researchers on mode I, mode II and mixed-mode I+II loadings [22, 29,
36]. Nevertheless, it should be noted that this set of cohesive parameters was particularly
suggested for the T300/HS 160 REM carbon/epoxy composite. For different types of
composite systems such as kenaf [37, 38], napier [39, 40], jute and hemp [41], the
cohesive parameters are necessary to be evaluated again.
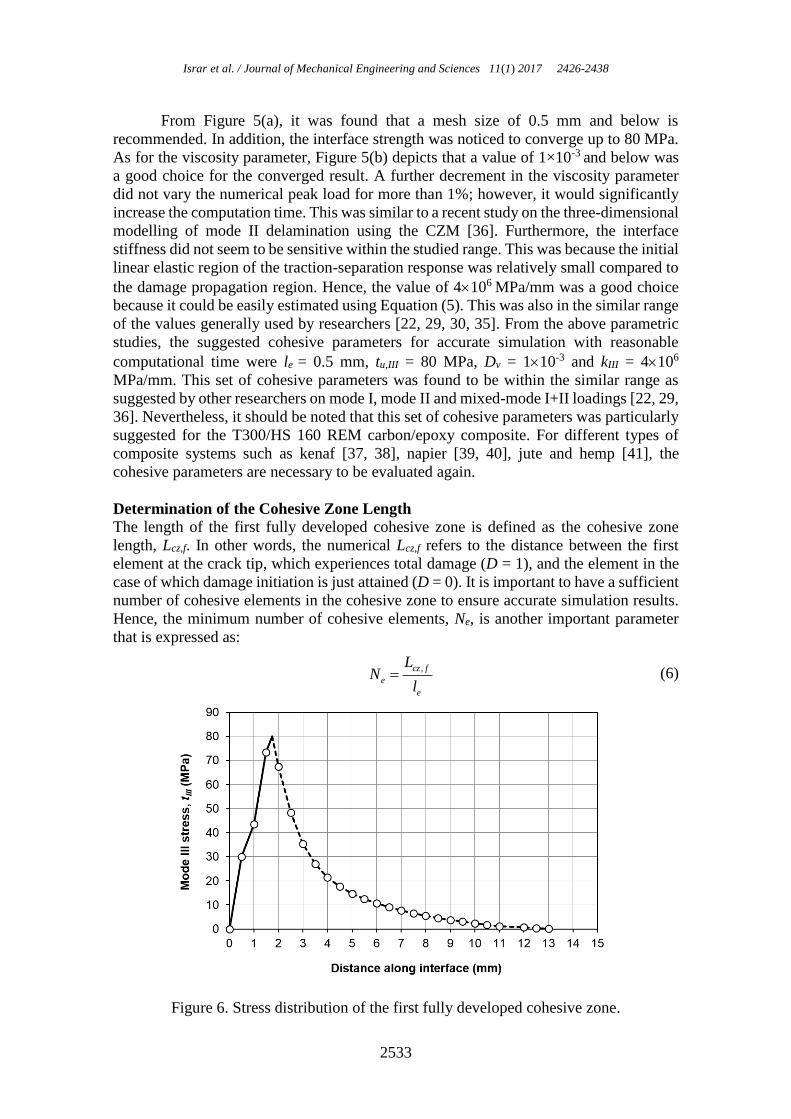
Determination of the Cohesive Zone Length
The length of the first fully developed cohesive zone is defined as the cohesive zone
length, Lcz,f. In other words, the numerical Lcz,f refers to the distance between the first
element at the crack tip, which experiences total damage (D = 1), and the element in the
case of which damage initiation is just attained (D = 0). It is important to have a sufficient
number of cohesive elements in the cohesive zone to ensure accurate simulation results.
Hence, the minimum number of cohesive elements, Ne, is another important parameter
that is expressed as:
(6)
Figure 6. Stress distribution of the first fully developed cohesive zone.
,cz f
e
e
LN
l
Cohesive zone modelling of Mode III delamination using the edge crack torsion test
2534
Figure 6 plots the stress distribution of the first fully developed cohesive zone
from the results obtained using the suggested cohesive parameters. The peak stress was
reasonable to be slightly extrapolated to 80 MPa, which was the interface strength input
to the model. It was also the instant where the damage was initiated (Equation (2)). Before
the peak load was attained, the element behaved linear elastically according to Equation
(1). Beyond that, the damage propagation occurred and the stress decreased progressively
according to Equation (4). It is observed that Lcz,f was 1.5 mm, which means that there
were 3 cohesive elements within the cohesive zone. This is consistent with the
recommendations by other researchers, where at least 2-3 cohesive elements are needed
in the cohesive zone for accurate simulations [13, 29].
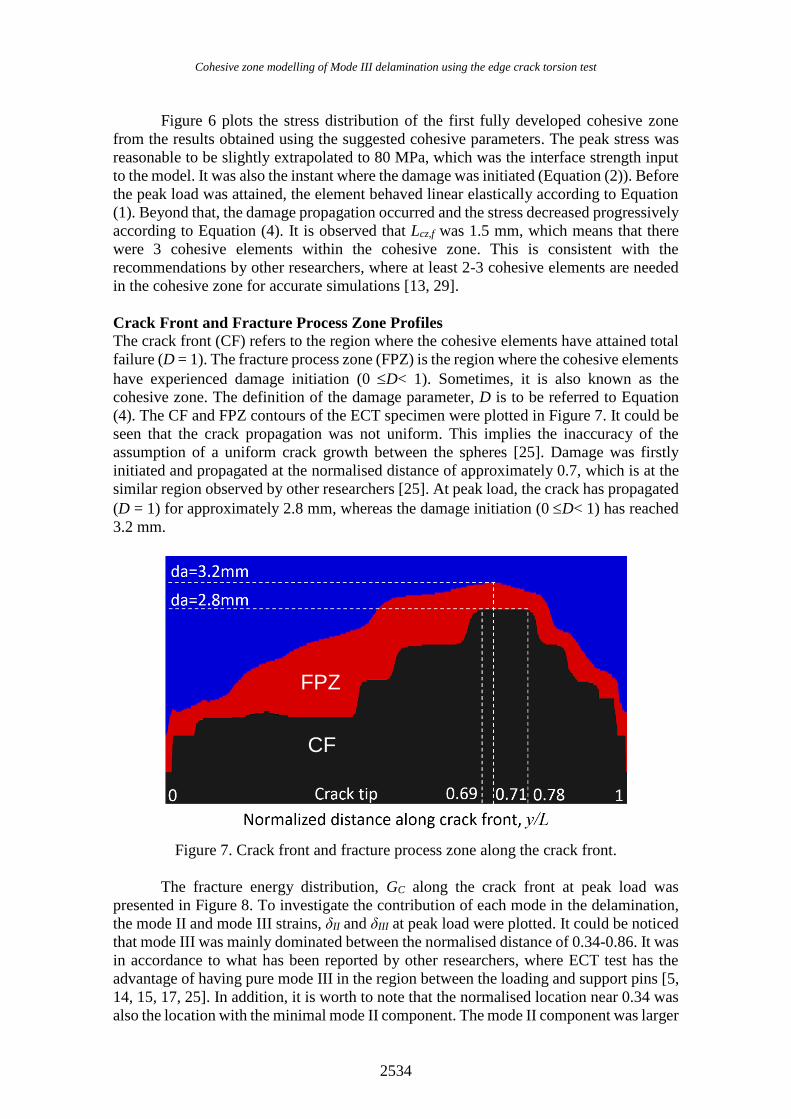
Crack Front and Fracture Process Zone Profiles
The crack front (CF) refers to the region where the cohesive elements have attained total
failure (D = 1). The fracture process zone (FPZ) is the region where the cohesive elements
have experienced damage initiation (0 D< 1). Sometimes, it is also known as the
cohesive zone. The definition of the damage parameter, D is to be referred to Equation
(4). The CF and FPZ contours of the ECT specimen were plotted in Figure 7. It could be
seen that the crack propagation was not uniform. This implies the inaccuracy of the
assumption of a uniform crack growth between the spheres [25]. Damage was firstly
initiated and propagated at the normalised distance of approximately 0.7, which is at the
similar region observed by other researchers [25]. At peak load, the crack has propagated
(D = 1) for approximately 2.8 mm, whereas the damage initiation (0 D< 1) has reached
3.2 mm.
Figure 7. Crack front and fracture process zone along the crack front.
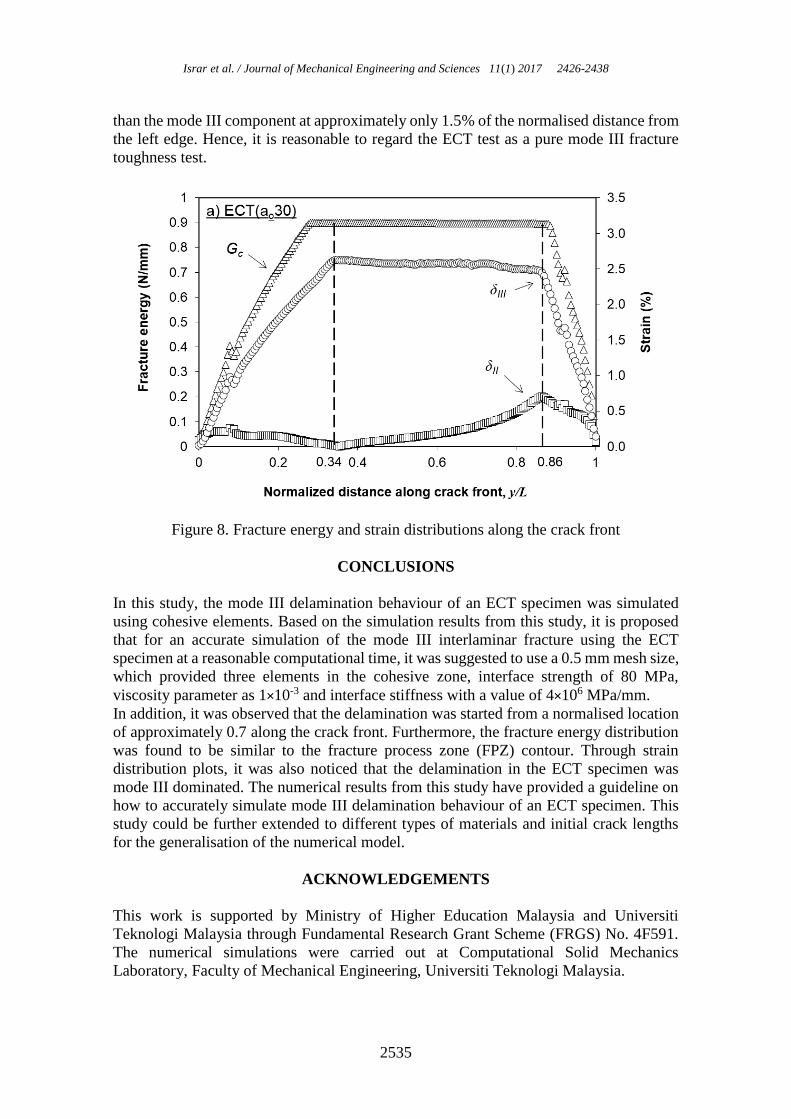
The fracture energy distribution, GC along the crack front at peak load was
presented in Figure 8. To investigate the contribution of each mode in the delamination,
the mode II and mode III strains, δII and δIII at peak load were plotted. It could be noticed
that mode III was mainly dominated between the normalised distance of 0.34-0.86. It was
in accordance to what has been reported by other researchers, where ECT test has the
advantage of having pure mode III in the region between the loading and support pins [5,
14, 15, 17, 25]. In addition, it is worth to note that the normalised location near 0.34 was
also the location with the minimal mode II component. The mode II component was larger
CF
FPZ
Israr et al. / Journal of Mechanical Engineering and Sciences 11(1) 2017 2426-2438
2535
than the mode III component at approximately only 1.5% of the normalised distance from
the left edge. Hence, it is reasonable to regard the ECT test as a pure mode III fracture
toughness test.
Figure 8. Fracture energy and strain distributions along the crack front
CONCLUSIONS
In this study, the mode III delamination behaviour of an ECT specimen was simulated
using cohesive elements. Based on the simulation results from this study, it is proposed
that for an accurate simulation of the mode III interlaminar fracture using the ECT
specimen at a reasonable computational time, it was suggested to use a 0.5 mm mesh size,
which provided three elements in the cohesive zone, interface strength of 80 MPa,
viscosity parameter as 1×10⁻³ and interface stiffness with a value of 4×10⁶ MPa/mm.
In addition, it was observed that the delamination was started from a normalised location
of approximately 0.7 along the crack front. Furthermore, the fracture energy distribution
was found to be similar to the fracture process zone (FPZ) contour. Through strain
distribution plots, it was also noticed that the delamination in the ECT specimen was
mode III dominated. The numerical results from this study have provided a guideline on
how to accurately simulate mode III delamination behaviour of an ECT specimen. This
study could be further extended to different types of materials and initial crack lengths
for the generalisation of the numerical model.
ACKNOWLEDGEMENTS
This work is supported by Ministry of Higher Education Malaysia and Universiti
Teknologi Malaysia through Fundamental Research Grant Scheme (FRGS) No. 4F591.
The numerical simulations were carried out at Computational Solid Mechanics
Laboratory, Faculty of Mechanical Engineering, Universiti Teknologi Malaysia.
Cohesive zone modelling of Mode III delamination using the edge crack torsion test
2536
REFERENCES
[1] Wang SS. Fracture mechanics for delamination problems in composite materials.
Journal of Composite Materials. 1983;17:210-23.
[2] Szekrényes A. The influence of crack length and delamination width on the mode-
iii energy release rate of laminated composites. Journal of Composite Materials.
2011;45:279-94.
[3] Khoshravan MR, Moslemi M. Investigation on mode iii interlaminar fracture of
glass/epoxy laminates using a modified split cantilever beam test. Engineering
Fracture Mechanics. 2014;127:267-79.
[4] Browning G, Carlsson LA, Ratcliffe JG. Modification of the edge crack torsion
specimen for mode iii delamination testing. Part ii – experimental study. Journal
of Composite Materials. 2011;45:2633-40.
[5] Mehrabadi FA, Khoshravan M. Mode iii interlaminar fracture and damage
characterization in woven fabric-reinforced glass/epoxy composite laminates.
Journal of Composite Materials. 2013;47:1583-92.
[6] Pereira AB, de Morais AB, de Moura MFSF. Design and analysis of a new six-
point edge crack torsion (6ect) specimen for mode iii interlaminar fracture
characterisation. Composites Part A: Applied Science and Manufacturing.
2011;42:131-9.
[7] Johnston AL, Davidson BD, Simon KK. Assessment of split-beam-type tests for
mode iii delamination toughness determination. International Journal of Fracture.
2014;185:31-48.
[8] Davidson BD, Sediles FO. Mixed-mode i–ii–iii delamination toughness
determination via a shear–torsion-bending test. Composites Part A: Applied
Science and Manufacturing. 2011;42:589-603.
[9] Johnston AL, Davidson BD. Intrinsic coupling of near-tip matrix crack formation
to mode iii delamination advance in laminated polymeric matrix composites.
International Journal of Solids and Structures. 2014;51:2360-9.
[10] López-Menéndez A, Viña J, Argüelles A, Rubiera S, Mollón V. A new method
for testing composite materials under mode iii fracture. Journal of Composite
Materials. 2016;50:3973-80.
[11] Reeder JR. 3d mixed mode delamination fracture criteria - an experimentalist's
perspective. Proceedings of American Society for Composites, 21st Annual
Tehnical Conference. Dearborn, MI, US2006.
[12] Zhao D, Wang Y. Mode iii fracture behavior of laminated composite with edge
crack in torsion. Theoretical and Applied Fracture Mechanics. 1998;29:109-23.
[13] Turon A, Dávila CG, Camanho PP, Costa J. An engineering solution for mesh size
effects in the simulation of delamination using cohesive zone models. Engineering
Fracture Mechanics. 2007;74:1665-82.
[14] Ratcliffe JG. Characterization of the edge crack torsion (ect) test for mode iii
fracture toughness measurement of laminated composites. 2004.
[15] de Morais AB, Pereira AB, de Moura MFSF, Magalhães AG. Mode iii
interlaminar fracture of carbon/epoxy laminates using the edge crack torsion (ect)
test. Composites Science and Technology. 2009;69:670-6.
[16] Salleh Z, Yusop MYM, Rosdi MS. Mechanical properties of activated carbon (ac)
coir fibers reinforced with epoxy resin. Journal of Mechanical Engineering and
Sciences. 2013;5:631-8.
Israr et al. / Journal of Mechanical Engineering and Sciences 11(1) 2017 2426-2438
2537
[17] Asgari Mehrabadi F. Analysis of pure mode iii and mixed mode (iii + ii)
interlaminar crack growth in polymeric woven fabrics. Materials & Design.
2013;44:429-37.
[18] Nazirah ZS, Abdul Majid MS, Daud R. Effects of elevated temperatures on glass-
reinforced epoxy pipes under multi-axial loadings. Journal of Mechanical
Engineering and Sciences. 2016;10:1846-56.
[19] Ravi Sankar H, Srikant RR, Vamsi Krishna P, Bhujanga Rao V, Bangaru Babu P.
Estimation of the dynamic properties of epoxy glass fabric composites with
natural rubber particle inclusions. International Journal of Automotive and
Mechanical Engineering. 2013;7:968-80.
[20] Jeffrey KJT, Tarlochan F, Rahman MM. Residual strength of chop strand mats
glass fiber/epoxy composite structures: Effect of temperature and water
absorption. International Journal of Automotive and Mechanical Engineering.
2011;4:504-19.
[21] Xie D, Waas AM. Discrete cohesive zone model for mixed-mode fracture using
finite element analysis. Engineering Fracture Mechanics. 2006;73:1783-96.
[22] Zhao L, Gong Y, Zhang J, Chen Y, Fei B. Simulation of delamination growth in
multidirectional laminates under mode i and mixed mode i/ii loadings using
cohesive elements. Composite structures. 2014;116:509-22.
[23] LeBlanc LR, LaPlante G. Experimental investigation and finite element modeling
of mixed-mode delamination in a moisture-exposed carbon/epoxy composite.
Composites Part A: Applied Science and Manufacturing. 2016;81:202-13.
[24] Nguyen N, Waas AM. A novel mixed-mode cohesive formulation for crack
growth analysis. Composite structures. 2016;156:253-62.
[25] de Moura MFSF, Fernandez MVC, de Morais AB, Campilho RDSG. Numerical
analysis of the edge crack torsion test for mode iii interlaminar fracture of
composite laminates. Engineering Fracture Mechanics. 2009;76:469-78.
[26] de Morais AB, Pereira AB. Mode iii interlaminar fracture of carbon/epoxy
laminates using a four-point bending plate test. Composites Part A: Applied
Science and Manufacturing. 2009;40:1741-6.
[27] Camanho PP, Davila CG, de Moura MFSF. Numerical simulation of mixed-mode
progressive delamination in composite materials. Journal of Composite Materials.
2003;37:1415-38.
[28] Sørensen BF, Goutianos S, Jacobsen TK. Strength scaling of adhesive joints in
polymer–matrix composites. International Journal of Solids and Structures.
2009;46:741-61.
[29] Harper PW, Sun L, Hallett SR. A study on the influence of cohesive zone interface
element strength parameters on mixed mode behaviour. Composites Part A:
Applied Science and Manufacturing. 2012;43:722-34.
[30] Mollón V, Bonhomme J, Elmarakbi AM, Argüelles A, Viña J. Finite element
modelling of mode i delamination specimens by means of implicit and explicit
solvers. Polymer Testing. 2012;31:404-10.
[31] Daniel IM, Ishai O. Engineering mechanics of composite materials. 2nd ed. New
York: Oxford University Press; 2006.
[32] Krueger R. Development and application of benchmark examples for mode ii
static delamination propagation and fatigue growth predictions. 2011.
[33] Chen J, Ravey E, Hallett S, Wisnom M, Grassi M. Prediction of delamination in
braided composite t-piece specimens. Composites Science and Technology.
2009;69:2363-7.
Cohesive zone modelling of Mode III delamination using the edge crack torsion test
2538
[34] Allix O, Blanchard L. Mesomodeling of delamination: Towards industrial
applications. Composites Science and Technology. 2006;66:731-44.
[35] Zhao L, Gong Y, Qin T, Mehmood S, Zhang J. Failure prediction of out-of-plane
woven composite joints using cohesive element. Composite Structures.
2013;106:407-16.
[36] Johar M, Israr HA, Low KO, Wong KJ. Numerical simulation methodology for
mode ii delamination of quasi-isotropic quasi-homogeneous composite laminates.
Journal of Composite Materials. 2017:0021998317695414.
[37] Islam MR, Beg MDH. Effects of reinforcing arrangement of kenaf fibres into
unsaturated polyester for improved properties. Journal of Mechanical Engineering
and Sciences. 2016;10:2020-30.
[38] Ismail AE, Che Abdul Aziz MA. Tensile strength of woven yarn kenaf fiber
reinforced polyester composites. Journal of Mechanical Engineering and
Sciences. 2015;9:1695-704.
[39] Fahmi I, Abdul Majid MS, Afendi M, Helmi EA, M Haameem JA. Low-velocity
impact responses of napier fibre/polyester composites. International Journal of
Automotive and Mechanical Engineering. 2016;13:3226-37.
[40] M Haameem JA, Abdul Majid MS, Afendi M, Haslan M, Fahmi I. Alkali
treatment and thermal properties of napier grass fibres. International Journal of
Automotive and Mechanical Engineering. 2016;13:3238-47.
[41] Fajrin J, Zhuge Y, Bullen F, Wang H. Flexural behaviour of hybrid sandwich
panel with natural fiber composites as the intermediate layer. Journal of
Mechanical Engineering and Sciences. 2016;10:1968-83.