Embed Size (px)
Citation preview

COGENERATION PRINCIPLES©
Henk van Ballegooyen, P.Eng.
Gryphon International Engineering Services Inc. St. Catharines, Ontario, Canada
www.gryphoneng.com

COGENERATION PRINCIPLES © Gryphon International Engineering Services Inc. St. Catharines, Ontario, Canada CognPrnc_0900
GRYPHON INTERNATIONAL ENGINEERING SERVICES INC. ST. CATHARINES, ONTARIO, CANADA
www.gryphoneng.com
GRYPHON is a Canadian multi-discipline, full-service engineering design firm
specializing in cogeneration, combined-cycle and thermal power plants and related
equipment and systems, including level I, II and III feasibility studies,
conceptual/schematic design, project development assistance, detail-design
engineering, commissioning and startup, testing & project management.
GRYPHON clients include Lake Superior Power, Northland Power, Cornell
University, Florida Power Corporation, PB Power, TransCanada Pipelines /
Energy, Union Gas Power, Kimberly-Clark Forest Products, Great Lakes Power,
3M Canada, Potter Station Power, NRC, AECL, Ontario Hydro / Ontario Power
Generation, EnWave/Toronto District Heating Corporation, ICS-State, R. V.
Anderson, Wascana Energy, Bayer Inc., NOVA Pipelines Ventures, NOVA
Corporation, West Windsor Power, Orenda Aerospace, Henderson Hospital, BFC
Industrial and Nicholls-Radtke Ltd., Gas Energy Development Corporation, ConEd
Development Corporation, KeySpan Energy Development Corporation, Innovative
Steam Technologies, Acres International, ABGS Inc., Bowater Pulp and Paper
Canada, Ormat Industries, Consorcio Skanska Conciviles, Donohue Inc. / QUNO.

COGENERATION PRINCIPLES © Gryphon International Engineering Services Inc. St. Catharines, Ontario, Canada CognPrnc_0900 ABSTRACT
COGENERATION PRINCIPLES©
ABSTRACT
This paper outlines the fundamental principles of Cogeneration, with illustrations
of Topping and Bottoming cycles, a number of common cogeneration cycles that
can be employed in industrial applications and for developer applications,
demonstrations of the application of Heat-to-Power Ratios, and tabulations of the
performance of typical prime movers in a number of cycles.
This information taken together will permit the reader to evaluate which
cogeneration system may best serve a given application.

COGENERATION PRINCIPLES © Gryphon International Engineering Services Inc. St. Catharines, Ontario, Canada CognPrnc_0900 TOC
COGENERATION PRINCIPLES©
TABLE OF CONTENTS
1.0 THE CASE FOR COGENERATION ....................................................... 1 2.0 BASIC COGENERATION CYCLES ....................................................... 2 2.1 Topping Cycle ............................................................................................... 2 2.2 Bottoming Cycle ............................................................................................ 4 2.3 Combined-Cycle Cogeneration ..................................................................... 5 2.4 Cheng Cycle ................................................................................................... 6 3.0 HEAT-TO-POWER RATIOS .................................................................... 7 4.0 COGENERATION CYCLE EFFICIENCY ............................................. 8 4.1 General ........................................................................................................... 8 4.2 Class 43 .......................................................................................................... 8 4.3 Ontario Hydro ................................................................................................ 9 4.4 PURPA ......................................................................................................... 11 5.0 PRIME MOVER PERFORMANCE ....................................................... 12 6.0 TYPICAL APPLICATIONS .................................................................... 13 6.1 Steam Generator/Back-Pressure Steam Turbine ......................................... 13 6.2 Steam Generator/Condensing Steam Turbine ............................................. 13 6.3 Combined-Cycle Cogeneration ................................................................... 14 6.4 Gas Turbine/HRSG ...................................................................................... 14 7.0 SUMMARY ................................................................................................ 15

COGENERATION PRINCIPLES © Gryphon International Engineering Services Inc. St. Catharines, Ontario, Canada CognPrnc_0900 Page 1
1.0 THE CASE FOR COGENERATION Cogeneration is the simultaneous production of two or more forms of useful energy, usually electricity and heat, from a single fuel source. In Europe and other countries, this concept is often referred to as Combined Heat and Power (CHP). In the early 1900's, many small and large industries employed Cogeneration for the simultaneous production of process heat and electricity, in the absence of economically viable alternatives. With the subsequent development of large central electrical power generating stations, and with the creation of highly reliable electrical transmission and distribution systems, this initial interest in Cogeneration and CHP waned, as industries found it more economical to produce only their own process heat, while simply purchasing electricity from the Utility. Today in a world of global competition, with increasing costs of purchased power and with concern for the environment, many industries are once again turning to Cogeneration. The waste heat associated with many processes is being harnessed and used to generate electricity either for self generation (load displacement) or for sale to a utility. Conversely, many industries are using a waste product as a fuel or are increasing their current fuel usage for the purpose of generating electricity. The waste heat associated with this operation is then harnessed to provide process heat. The net effect of either approach has been a new source of revenue from the sale of electricity, or the lowering of operating costs (i.e. savings) by the displacement of process heat or the reduction of electricity purchases. The economic incentive in some instances has been so great as to promote large electrical generating installations, even in excess of the industrial user's own requirements. Also in recent years, there is a growing concern for the environment and the production of "greenhouse gases". For a cogeneration system, the production of electricity is at a much higher efficiency than can be generated by conventional central generating stations. Therefore, if North America is to meet the objectives of the Kyoto Protocol, the generation of electrical power using cogeneration systems must be encouraged.

COGENERATION PRINCIPLES © Gryphon International Engineering Services Inc. St. Catharines, Ontario, Canada CognPrnc_0900 Page 2
2.0 BASIC COGENERATION CYCLES The major equipment traditionally associated with a cogeneration cycle includes one or more of the following: a) Steam generator or boiler. b) Gas turbine generator (GTG). c) Reciprocating spark-ignited Gas, Dual-Fuel or Diesel engine generator. d) Steam turbine generator (STG). e) Heat recovery steam generator (HRSG). The manner in which this equipment is combined and employed will define the type of cogeneration cycle.
2.1 Topping Cycle A Topping Cycle is one in which the primary purpose of the input fuel is to generate electricity, and the waste heat exhausted by this process is captured, and used in industrial processes or for district heating or cooling. Thus, the hierarchy of energy flow in a Topping Cycle is Fuel to Electricity to Process. Exhibit #1 illustrates the two most common topping cycles currently being employed in cogeneration installations. The First Case shown on Exhibit #1 is a Steam Generator / Steam Turbine Generator installation. Here the fuel is fired in a steam generator and is used to produce steam. The steam in turn is expanded in a steam turbine which is used to rotate a generator and generate electricity. In this process, of the 100% energy in the input fuel*: a) Some 15% of the fuel energy is converted to electrical Power. b) Some 65% can be diverted to process uses (Heat). c) Some 15% is exhausted to atmosphere (i.e. lost) through the stack of the
steam generator. d) A further 5% is lost in the form of auxiliary power uses in the cycle and
friction and radiated losses. * In the examples and Exhibits that follow, the energy content or heat value of
the referenced input fuel will always be based upon the fuel's Higher Heating Value (HHV).

COGENERATION PRINCIPLES © Gryphon International Engineering Services Inc. St. Catharines, Ontario, Canada CognPrnc_0900 Page 3
The Thermal Efficiency of this particular Topping Cycle, indicating the amount of useful energy forms provided by the input energy, is:
Thermal Efficiency = 65% + 15% 100%
= 80%
The amount of Process Heat compared to the amount of electrical Power produced can be expressed as a Heat-to-Power ratio. In this case the ratio is:
Heat-to-Power Ratio = 65% / 15% = 4.3
The Second Case shown on Exhibit #1 is that of a Gas Turbine/HRSG installation. Here, the fuel is fired in the combustor of the gas turbine and used to generate electricity directly. The exhaust gas from the gas turbine is then captured and used to supply the fundamental heat to a heat recovery steam generator. The HRSG generates steam which in turn is used to provide process heat. In this process, of the 100% energy in the input fuel: a) Up to 28% is converted to electrical Power. b) Nearly 50% provides process Heat. c) Some 17% is ultimately exhausted to the atmosphere. d) A further 5% is utilized in auxiliary loads and friction and radiated losses. The net Thermal Efficiency [ 28% + 50% ] / 100% = 78% of this Second Case is about the same as the First Case steam generator/steam turbine cycle. The Heat-to-Power Ratio of this Second Case is significantly reduced however, to only 50% / 28% = 1.8.
It should be pointed out that in these Topping Cycle examples, the input fuel could have been used to operate other prime movers, such as a gas or diesel reciprocating engines. Unlike the gas turbine, the waste heat in the engine jackets is captured through ebullient coolers which provides low grade steam or hot water to process. For this equipment, the overall Thermal Efficiency is in the order of 68% and the Heat-to-Power ratio is usually less than 1.0.
COGENERATION PRINCIPLES © Gryphon International Engineering Services Inc. St. Catharines, Ontario, Canada CognPrnc_0900 Page 4
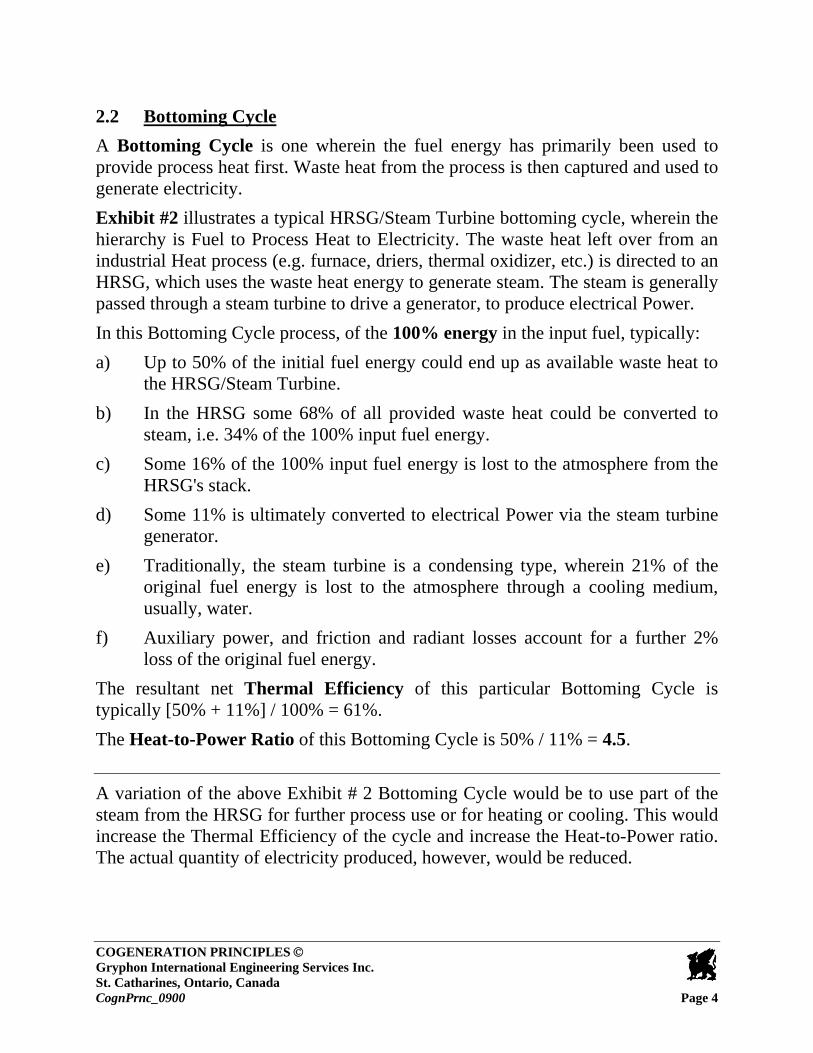
2.2 Bottoming Cycle A Bottoming Cycle is one wherein the fuel energy has primarily been used to provide process heat first. Waste heat from the process is then captured and used to generate electricity. Exhibit #2 illustrates a typical HRSG/Steam Turbine bottoming cycle, wherein the hierarchy is Fuel to Process Heat to Electricity. The waste heat left over from an industrial Heat process (e.g. furnace, driers, thermal oxidizer, etc.) is directed to an HRSG, which uses the waste heat energy to generate steam. The steam is generally passed through a steam turbine to drive a generator, to produce electrical Power. In this Bottoming Cycle process, of the 100% energy in the input fuel, typically: a) Up to 50% of the initial fuel energy could end up as available waste heat to
the HRSG/Steam Turbine. b) In the HRSG some 68% of all provided waste heat could be converted to
steam, i.e. 34% of the 100% input fuel energy. c) Some 16% of the 100% input fuel energy is lost to the atmosphere from the
HRSG's stack. d) Some 11% is ultimately converted to electrical Power via the steam turbine
generator. e) Traditionally, the steam turbine is a condensing type, wherein 21% of the
original fuel energy is lost to the atmosphere through a cooling medium, usually, water.
f) Auxiliary power, and friction and radiant losses account for a further 2% loss of the original fuel energy.
The resultant net Thermal Efficiency of this particular Bottoming Cycle is typically [50% + 11%] / 100% = 61%. The Heat-to-Power Ratio of this Bottoming Cycle is 50% / 11% = 4.5.
A variation of the above Exhibit # 2 Bottoming Cycle would be to use part of the steam from the HRSG for further process use or for heating or cooling. This would increase the Thermal Efficiency of the cycle and increase the Heat-to-Power ratio. The actual quantity of electricity produced, however, would be reduced.
COGENERATION PRINCIPLES © Gryphon International Engineering Services Inc. St. Catharines, Ontario, Canada CognPrnc_0900 Page 5
2.3 Combined-Cycle Cogeneration A Combined-Cycle Cogeneration plant is illustrated in Exhibit #3. This cycle combines in tandem, the gas turbine topping cycle with the steam turbine bottoming cycle. The energy flow hierarchy of this cycle is Fuel to Electricity to Process to Electricity. In this typical example, of the 100% energy in the input fuel, typically: a) The gas turbine part of the cycle converts some 28% of the original fuel
energy into electrical Power. b) GTG auxiliary power uses, and friction and radiant losses account for 5%. c) The HRSG converts some 50% of the input fuel energy to steam. d) The HRSG exhausts some 17% of the input fuel energy to the atmosphere. The steam turbine part of the cycle is used both to generate electricity, and to provide steam to process via an internal "tap-off" (extraction). The resultant distribution of the 50% HRSG steam is: e) Some 14% to electrical Power via the steam turbine generator. f) Some 15% to process Heat use via the steam turbine's extraction. g) A further 20% loss to the atmosphere via the condenser cooling medium. h) A further 1% or so in auxiliaries and friction and radiant losses. The net Thermal Efficiency of the illustrated cycle is about [28% + 14% + 15%] / 100% = 57%. The Heat-to-Power Ratio is about 15% / [28% + 14%] = 0.36.
Both the efficiency and Heat-to-Power ratio can be varied, by altering the amount of steam to process. The more steam to process, then the less to the condenser and more efficient the cycle. More process steam (Heat) and electrical Power could also be produced by burning additional fuel through duct (supplemental) firing in the gas turbine exhaust to the HRSG. This additional fuel energy boosts all of the downstream outputs associated with the steam turbine.

COGENERATION PRINCIPLES © Gryphon International Engineering Services Inc. St. Catharines, Ontario, Canada CognPrnc_0900 Page 6
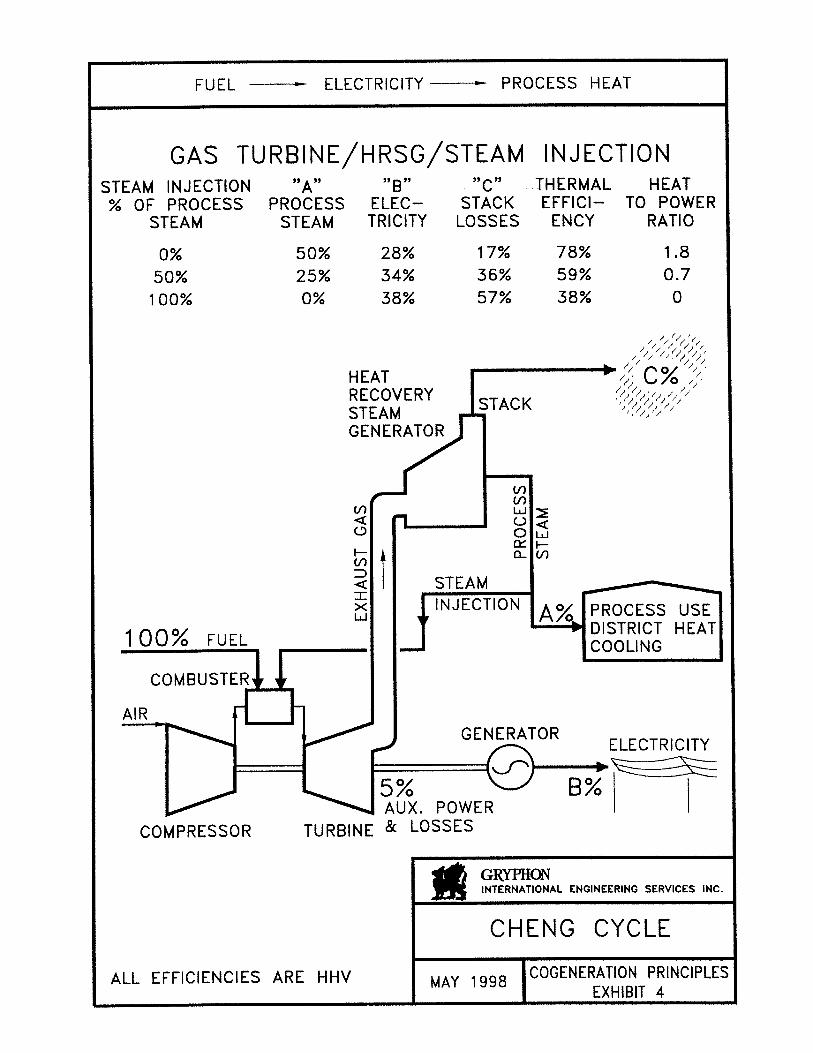
2.4 Cheng Cycle The Cheng Cycle is similar to the Gas Turbine/HRSG topping cycle, except that varying amounts of the superheated steam from the HRSG can be injected directly into the combustor of the gas turbine. This feed-back of steam increases the output of the gas turbine and impacts the thermal efficiency of the cycle. Exhibit #4 illustrates this cycle wherein the hierarchy is from the Fuel to Electricity to Process, which is the same as the topping cycle case. Exhibit #4 provides a measure of the impact of increasing steam injection on the production of electricity and the resultant thermal efficiency of the cycle, with an illustration of the Heat-to-Power ratio. The amount of steam injected into the gas turbine can vary from 0% to 100%, depending upon the relative need for process steam or electrical Power. With all the steam diverted to the process (i.e. 0% GTG injection), the scheme represents the typical gas turbine topping cycle. By diverting 50% of the process steam to the GTG combustor, the electrical Power production is increased to the point wherein it accounts for 34% of the input fuel energy. However, a greater portion of the original fuel energy is exhausted up the stack i.e. 36%. In the extreme, with 100% of the HRSG steam production diverted to GTG injection, the maximum electricity production corresponds to about 38% of the fuel input energy. Stack losses, however, increase to about 57%. Although electrical production is increased, the thermal efficiency of the cycle decreases.
In practice, there are only a few gas turbines which can operate in a Cheng Cycle manner. These select units have a turbine section design flow margin which is sufficient enough to accept significant amounts of steam, in addition to the normal flow of combustion air.

COGENERATION PRINCIPLES © Gryphon International Engineering Services Inc. St. Catharines, Ontario, Canada CognPrnc_0900 Page 7
3.0 PROCESS HEAT-TO-POWER RATIOS To assist in determining the most efficient cogeneration cycle for a given application, the Process Heat requirements and the Electrical Power requirements can be determined, and matched to a set of guidelines. Thus, the Process Heat-to-Power Ratio can provide an indication of which cycle to employ. Optimization and equipment selection can then be undertaken. Exhibit #5 summarizes the Heat-to-Power ratios for various process steam pressures and for various types of Topping Cycles*. With the Steam Generator/Steam Turbine topping cycle, a Heat-to-Power Ratio as low as 4, or as high as 25 or above is possible. This large variation is primarily caused by the steam pressure requirements of the steam generator, i.e. the higher the operating pressure, the lower the ratio, since more electricity is produced per pound of steam generated. The Gas Turbine/HRSG topping cycle is applicable in Heat-to-Power ratios of about 1.5 (unfired HRSG) to 10 (full supplementary fired HRSG). The large fluctuation in this range is caused by the firing of additional fuel in the exhaust duct prior to the turbine's exhaust gas entry into the HRSG. The additional heat added in this manner can boost the process heat output, to match swings in the process load. It is apparent that there is an overlap between these two types of topping cycles, and other factors are usually involved in the selection of one cycle over the other. The Combined-Cycle Cogeneration scheme and the Cheng Cycle scheme both have the production of electrical Power as the primary objective. As such, much lower Heat-to-Power Ratios are encountered, often in the range of 0.2 to 2.0. In the extreme, the Heat-to-Power Ratio of either could become zero, when only electrical Power is produced. In practice, however, a lower regulatory limit is usually encountered first. * The Bottoming Cycle is not included in this Exhibit, as the design will be
relatively straight-forward, generally dictated by the type and amount of available waste heat which can captured from the process.
COGENERATION PRINCIPLES © Gryphon International Engineering Services Inc. St. Catharines, Ontario, Canada CognPrnc_0900 Page 8
4.0 COGENERATION CYCLE EFFICIENCY 4.1 General The Industrial User usually sets out to displace purchased electricity, avoiding a portion or all of his energy and demand charges, sometimes with the added benefit of an additional or replacement process heat source. By comparison, the primary goal of a Developer will be to generate electricity for sale to the Industrial User and/or to a Utility, from which their most significant revenues will be obtained. From their perspective, the process Heat use provides the legitimacy for the powerplant. In many cases, this has presented Industrial Users with conflicting objectives. The plant's process heat use and electrical consumption may dictate a small scale cogeneration facility, that may be unjustifiable economically for them. On the other hand, for the same process heat and electrical load, a Developer may propose a much larger-scale generating plant, with the sale of significant amounts of electrical Power to a Utility being his primary objective, and with the Industrial User being the steam host and providing other considerations. This arrangement can frequently prove beneficial to both parties. Unfortunately, some Industrial Users may instead attempt to achieve the gains of the Developer, and suddenly realize that their dominant business is no longer their product and what they know, but the generation and sale of electricity. Hence, one must always review the cycle being proposed and remember its driving function. For the reader to evaluate these concerns, reviewing the efficiency criteria set by various governing and regulatory bodies is helpful.
4.2 Class 43 In Canada, the applicable tax classification for cogeneration facilities and equipment was Class 34, which defined a minimum efficiency target which was required to allow accelerated depreciation of portions of the equipment. However, for new projects after February 22, 1994, this tax classification was changed to Class 43, and the required Efficiency or Heat Rate hurdle was lowered from 7,000 to 6,000 btu/kw.hr, based on the higher heating value (HHV) of the fuel.

COGENERATION PRINCIPLES © Gryphon International Engineering Services Inc. St. Catharines, Ontario, Canada CognPrnc_0900 Page 9
The Class 43 Heat Rate for non-renewable fuels has been defined as: [ (K) x (2) x (4) ] [ (1) - (2) ] - [ (2) + (3T) ] Class 43 Heat Rate
(btu/kw.hr-HHV) = (3E)
The terms in the above equation are defined as follows: (1) = Non-Renewable Fuel Input, in btu/hrHHV. (2) = Useful Thermal Output, in btu/hr. (3E) = Electrical Gross Output, in kW. (3T) = Electrical Output converted to btu/hr (using a conversion factor of
3,413 btu/kw.hr). (4) = Plant Losses, in btu/hr, derived by the following equation: (4) = (1) - [(2) + (3T)] (K) = Unity. Thus, the above initial equation reduces to:
Fuel Heat Input (btu/hr-HHV) Net Process Heat (btu/hr) Class 43 Heat Rate
(btu/kw.hrHHV) = Gross Electrical Output (kW) + 3,413 (btu/kw.hr)
For steam being sent for process use, the Net Process Heat would be the total heat content (in btu/lb) of the steam being sent to the process, minus, the total heat in the condensate return (in btu/lb). Cogeneration plants which qualify for Class 43, whether constructed by an approved Industrial User or a Developer, may depreciate a portion of the plant based on a 30% declining balance, thus enhancing the plants economic return.
4.3 Ontario Hydro Ontario Hydro, over the past four years has been in a state of considerable flux in regard to their view point to Non-Utility Generators (NUGS). When the Ontario economy was growing, both large and small scale NUG projects were an integral part of Ontario Hydro's Demand/Supply Plan for the future. As the impact of the current recession and consequent plant closures has deepened, Ontario Hydro has become a Utility with a huge surplus of power capacity. In addition, in 1997, the Ontario Provincial Government announced plans to deregulate the power supply industry in Ontario. This situation was further

COGENERATION PRINCIPLES © Gryphon International Engineering Services Inc. St. Catharines, Ontario, Canada CognPrnc_0900 Page 10
complicated with the 1997 announcement by Ontario Hydro that several of their nuclear generating stations will be shutdown. As a result, no large scale NUG projects have been approved recently (other than special projects), and the exact situation for the future is unknown. It is anticipated that deregulation may make self-generation by Industrial Users, and medium and large-scale IPP and Merchant Power Plants by Developers feasible.
In the past, small scale NUG projects with a net output to Ontario Hydro less than 5 MW, could negotiate and contract for either of several power purchase rates, including 10 or 20 year terms, with fixed or indexed rates. In some instances, Ontario Hydro would have bought power at lower "Occasional Purchase Rates". For those projects over 5 MW in Ontario, Ontario Hydro would have negotiated the purchase rates based upon avoided costs, considering the following two Components. Component 1 would be for the Basic Avoided Cost, considering the expected plant's power and energy deliveries. Component 2 would be an Efficiency Adder. For plants using renewable energy sources or waste product fuels, an Efficiency Adder of 10% would be allowed. For plants using non-renewable energy sources the allowable Efficiency Adder would be based upon the annual Fuel Chargeable to Power heat rate, defined as:
PFE (HHV) - FES (HHV) Fuel Chargeable to Power (btu/kw.hr-HHV) = TEE
The terms in the above equation are defined as follows: PFE = Plant non-renewable Fuel Energy per annum, in btuHHV. FES = Fuel Energy Saved per annum, including the fuel saved from the
production of process heat as a result of cogeneration (i.e. FES = 0, for electricity only plants), in btuHHV.
TEE = Total net Electrical Energy per annum, kw.hr. Non-renewable fueled powerplants with a Fuel Chargeable to Power Heat Rate of less than 10,000 btu/kw.hr, would qualify for a portion of the Component 2 Efficiency Adder. In the future, projects over 5 MW will be required to achieve a Fuel Chargeable to Power heat rate better than 6,600 btu/kw.hr.
COGENERATION PRINCIPLES © Gryphon International Engineering Services Inc. St. Catharines, Ontario, Canada CognPrnc_0900 Page 11
4.4 PURPA In the late 1980's and early 1990's in the United States, the Public Utility Regulatory Policies Act (PURPA) dictated the minimum efficiency standards for non-utility power plants. For natural gas or oil-burning cogeneration plants to qualify under PURPA regulations, the thermal output must be greater than 5% and the PURPA efficiency must be not less than 42.5% for a topping cycle. However, if the thermal output is less than 15%, the PURPA efficiency must then be not less than 45%. The PURPA efficiency of a bottoming cycle plant must be at least 45%. The PURPA Thermal Output and Efficiency were defined as follows:
ATO Thermal Output (%) = ATO + APO x 3,412 X 100
[ (0.5 x ATO) + (APO x 3,412) ] PURPA Efficiency (%) = FEI (LHV) X 100
The terms in the above equations were defined as follows: ATO = Annual useful Thermal Output, the net heat to process, in btu. APO = Annual useful Power Output, in kw.hr. FEI (LHV) = Annual Fuel Energy Input, in btuLHV, i.e. based upon lower
heating value (LHV) of fuel.
COGENERATION PRINCIPLES © Gryphon International Engineering Services Inc. St. Catharines, Ontario, Canada CognPrnc_0900 Page 12
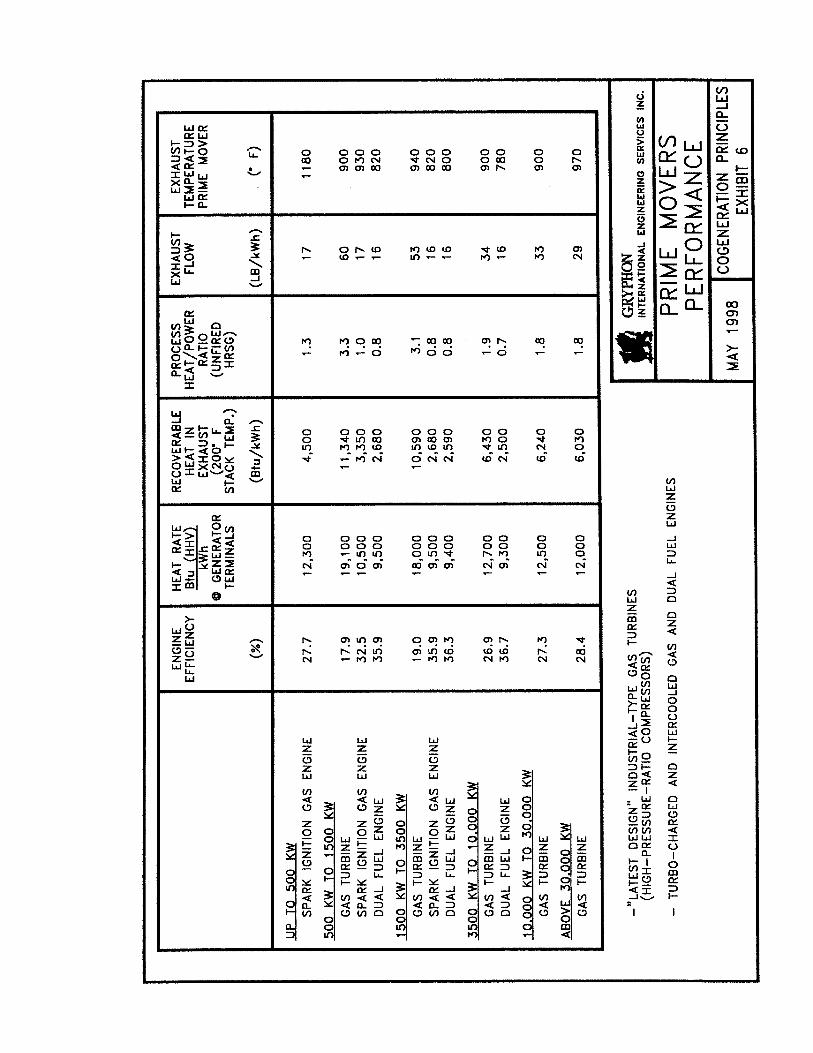
5.0 PRIME MOVER PERFORMANCE The previous exhibits dealing with cogeneration cycles have illustrated the use of a gas turbine as the prime mover in the cycle. In reality, subject to the size of the facility, the prime mover could be either a gas turbine or a spark ignition gas engine or a dual fuel engine or a diesel fuel engine. Each of these devices are manufactured in discrete sizes, and one may be more applicable than the others for a given application. Exhibit #6 summarizes some pertinent data on each of these types of prime movers, for a range of facility sizes. It is important to note that below 500 kW, the manufacturers typically only produce a spark ignited gas engine. Between 500 kW and 5,000 kW, all three types of engines are available and should be considered for the given application. Between 3,500 kW and 10,000 kW, the spark ignition gas reciprocating engine. Above 10,000 kW, only the gas turbine is available. In the mid-range between 500 kW and up to 10,000 kW the selection of the prime mover will be based on capital costs and maintenance costs versus fuel costs. Although the gas turbine would be the least fuel efficient and have a higher operating cost, bids from vendors combined with the higher reliability may offset the advantages of an engine and resultant use of the gas turbine.

COGENERATION PRINCIPLES © Gryphon International Engineering Services Inc. St. Catharines, Ontario, Canada CognPrnc_0900 Page 13
6.0 TYPICAL APPLICATIONS The use of Cogeneration has become common place in the United States and is quickly gaining favour within Canada. Experience has shown that certain cycles are best suited to certain industries and applications. Following are some typical heat balances of cogeneration facilities currently employed in major industry sectors.
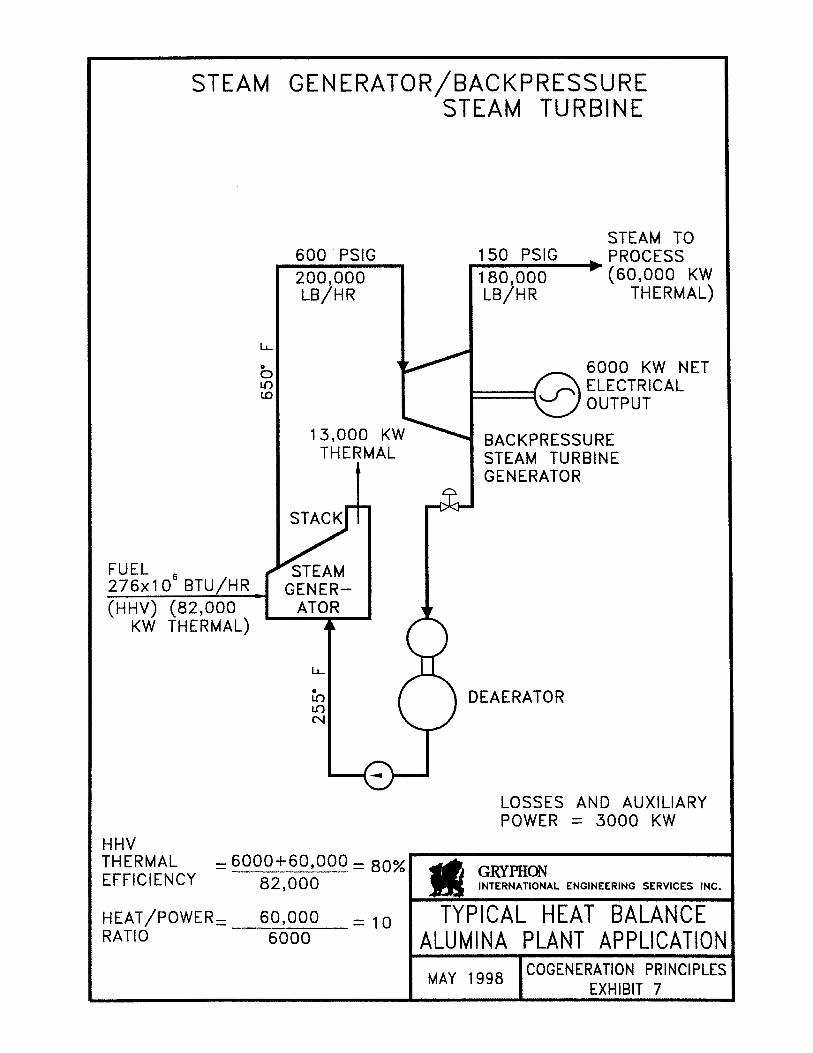
6.1 Steam Generator/Back-Pressure Steam Turbine Exhibit #7 illustrates a Steam Generator & Back-Pressure Steam Turbine cogeneration scheme that has been employed in alumina plants, pulp and paper applications and small industrial installations. This system has an extremely high thermal efficiency, since all of the steam that has been expanded through the steam turbine has subsequently been usefully employed as Heat in the process. Some production of electrical Power has also occurred providing the system with an overall thermal power efficiency of 80% and a Heat-to-Power Ratio of 10. This particular scheme is particularly attractive when existing steam generators exist, which produce steam at a high enough pressure.
6.2 Steam Generator/Condensing Steam Turbine Exhibit #8 illustrates a Steam Generator & Condensing Steam Turbine cogeneration scheme that has the same process Heat requirements (180,000 lb/hr at 150 psig) as the previous case, only the electrical Power output has been increased from 6,000 kW to 13,000 kW. To increase the electricity production, the amount of fuel energy input to the system was increased, thus raising the steam output of the steam generator. A portion of the steam is now expanded in the steam turbine to sub-atmospheric pressure and condensed. The maximum overall thermal efficiency of this condensing cycle is reduced to 66%, since the latent heat contained in the steam passing through to the condenser is essentially wasted. The Heat-to-Power Ratio is correspondingly lower, at 4.6. This particular scheme has found application in the petrochemical and the pulp and paper industries, again particularly when existing steam generators exist.

COGENERATION PRINCIPLES © Gryphon International Engineering Services Inc. St. Catharines, Ontario, Canada CognPrnc_0900 Page 14
6.3 Combined-Cycle Cogeneration Exhibit #9 illustrates a typical Combined-Cycle Cogeneration heat balance for the cogeneration application generally promoted by developers for use at industrial sites. This scheme is intended to maximize the electrical output for the developer with a relatively small process steam requirement. The limitations on this size of installation, in the United States, is governed by PURPA and as such this application is viewed as a PURPA machine. In Canada, the Class 43 and Ontario Hydro (when applicable) requirements also limit the size of the cogeneration facilities for a given steam host size. The thermal efficiency of this scheme is in the order of 48% and the Heat-to-Power Ratio is about 0.4.
6.4 Gas Turbine/HRSG Exhibit #10 illustrates a typical Gas Turbine/HRSG cogeneration application suitable for a small to medium process plant applications such as a food or material processing plants, or a brewery. These plants have a very high overall thermal efficiency, and by the addition of supplementary firing in the exhaust gas duct between the gas turbine and the HRSG, can also have a high Heat-to-Power Ratio. The thermal efficiency for this particular application is in the order of 80% and the Heat-to-Power Ratio is about 4.4.

COGENERATION PRINCIPLES © Gryphon International Engineering Services Inc. St. Catharines, Ontario, Canada CognPrnc_0900 Page 15
7.0 SUMMARY Based on the preceding illustrations, a potential Industrial User of cogeneration can define the cycle that is most applicable to their use. Once decisions are taken on the hierarchy of the cycle and process heat production, cogeneration facilities can be sized to either meet average or peak process heat requirements or peak or average electrical requirements An Industrial User must determine if the primary objective of his cogeneration facility will be the production of process Heat or of electrical Power. A second consideration is the responsibility for process heat production, i.e. does he wish to be the recipient of process heat from a third-party, or does he wish to control it himself? A very significant variable in any industrial user's analysis will be whether or not a third-party may be involved in the development of the cogeneration facility. Once this path is followed, electricity production for sale to a utility becomes paramount to the Developer. The production of process steam for the industrial user becomes a mandated necessity to justify that the maximum size facility that can be developed. The net result of either of the above approaches from an Industrial User's point of view is that he can direct a project that meets his process steam and/or electricity requirements more cost effectively. For him, this translates into lower operating and production costs, and a more competitive product.