Embed Size (px)
Citation preview

Cogeneration
Rangan Banerjee
Department of Energy Science and Engineering
IIT Bombay
Lecture in KIC-TEQIP programme on Energy Management and Energy Efficiency - IITG - 24th May 2016

Utility options
PROCESSHeat
Electricity
BOILER
Power Plant
Fuel
Fuel
Cogen Plant
Fuel
Electricity
Electricity
HeatHeat
CogenerationSHP
2
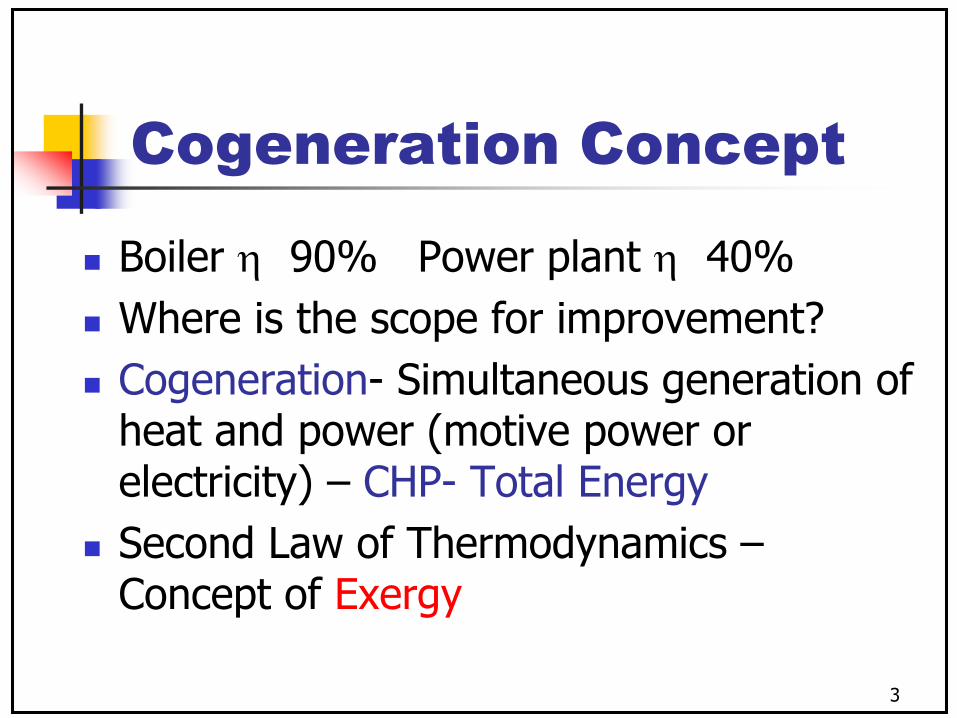
Cogeneration Concept
Boiler 90% Power plant 40%
Where is the scope for improvement?
Cogeneration- Simultaneous generation of heat and power (motive power or electricity) – CHP- Total Energy
Second Law of Thermodynamics –Concept of Exergy
3

Exergy
Quality of energy- 100 kJ of heat equivalent?
27 °C ambient, 127 °C, 227 °C, 327 °C
Available energy/ Exergy – The exergy of a substance is the maximum work that can be obtained by interacting with the environment and bringing it into complete reversible equilibrium with the environment
ex = v2/2+ g(z-z0)+(h-h0)-T0(s-s0)+exch
4

Cogeneration Concept
Process boiler , sat steam at 180 °C 90% (1st law eff)
Tu= 180+273 =453 K, T0 = 300 K
II=Qu(1- T0 / Tu)/ Qin (for fuel 1.0)=0.9(1-300/453) =0.3 (30%)
Increase generation temperature to 400 °C and pass through an expansion turbine
5

Early 19th century Cogeneration plant
Source: Dryden Efficient use of steam6
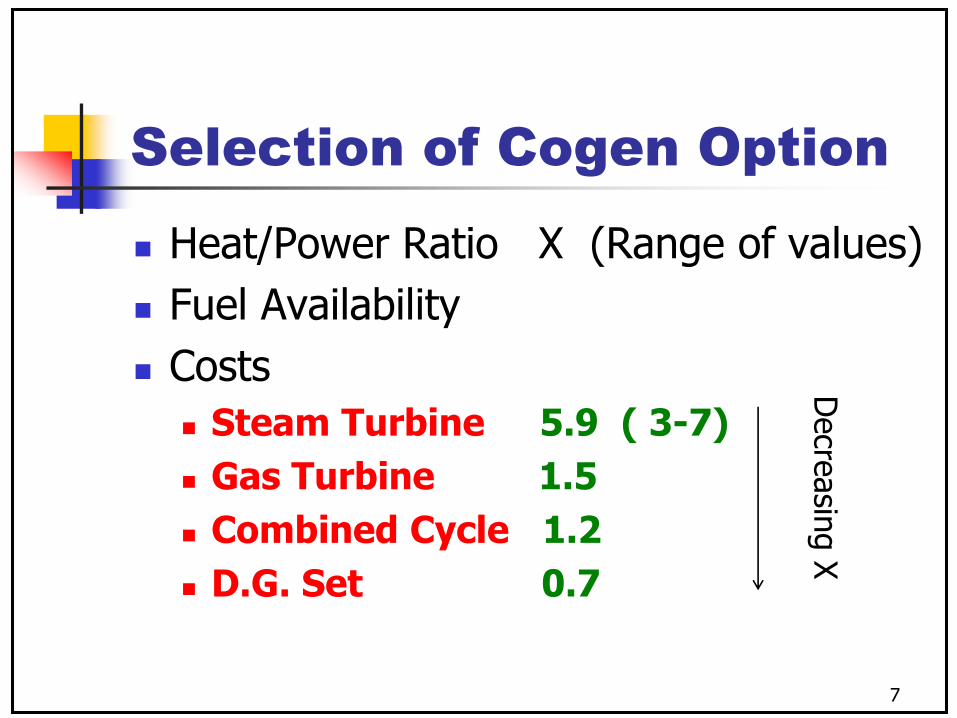
Selection of Cogen Option
Heat/Power Ratio X (Range of values)
Fuel Availability
Costs
Steam Turbine 5.9 ( 3-7)
Gas Turbine 1.5
Combined Cycle 1.2
D.G. Set 0.7
Decre
asin
g X
7
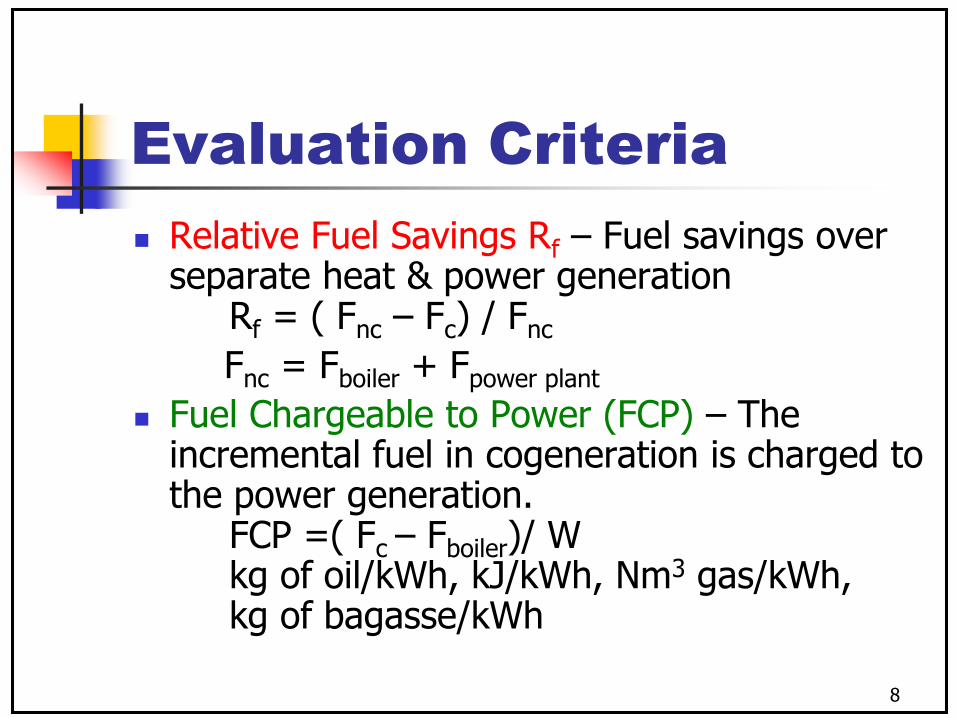
Evaluation Criteria
Relative Fuel Savings Rf – Fuel savings over separate heat & power generation
Rf = ( Fnc – Fc) / Fnc
Fnc = Fboiler + Fpower plant
Fuel Chargeable to Power (FCP) – The incremental fuel in cogeneration is charged to the power generation.
FCP =( Fc – Fboiler)/ W kg of oil/kWh, kJ/kWh, Nm3 gas/kWh, kg of bagasse/kWh
8

LP Steam to Process
ST
HP Steam
Fuel
Air
Water
BOILER
Electricity
Back Pressure Steam Turbine System
9
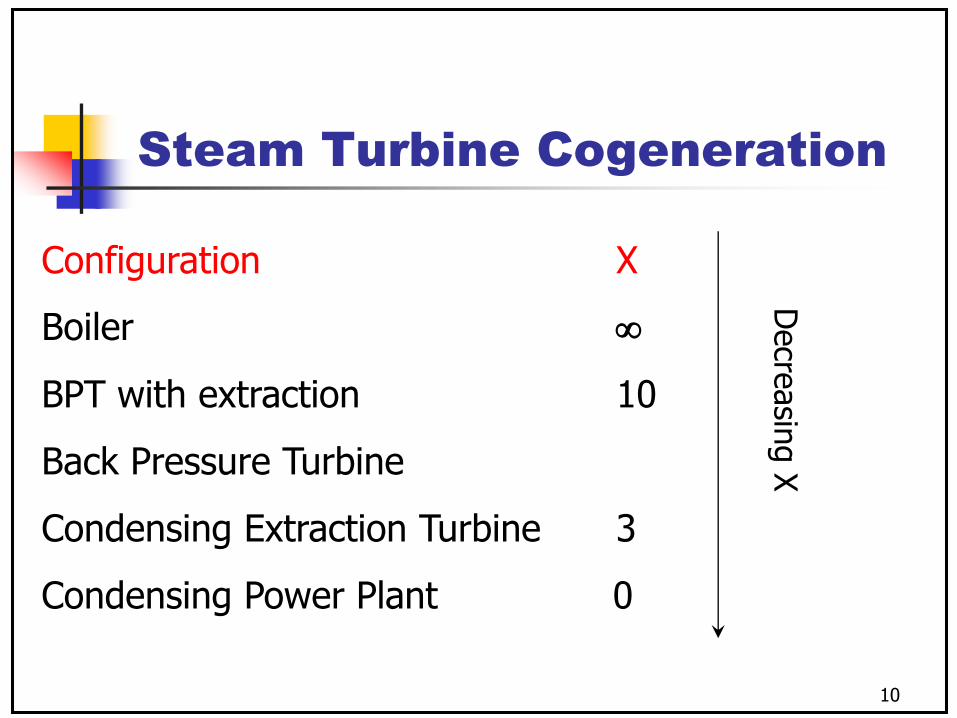
Steam Turbine Cogeneration
Configuration X
Boiler
BPT with extraction 10
Back Pressure Turbine
Condensing Extraction Turbine 3
Condensing Power Plant 0
Decre
asin
g X
10

Steam Turbine
Calculations
1
2i
2
h1
h2
h2i
Specific Entropy s
Specific
Enthalpy
is = h1-h2
h1-h2i
11

Back-Pressure with extraction turbine HP
MP
LP
12

C GT
GAS TURBINE BASED COGEN
CC
WHRB
Steam to Process
Suppl Fuel
Fuel
Stack
Air
Feed water
Power
13
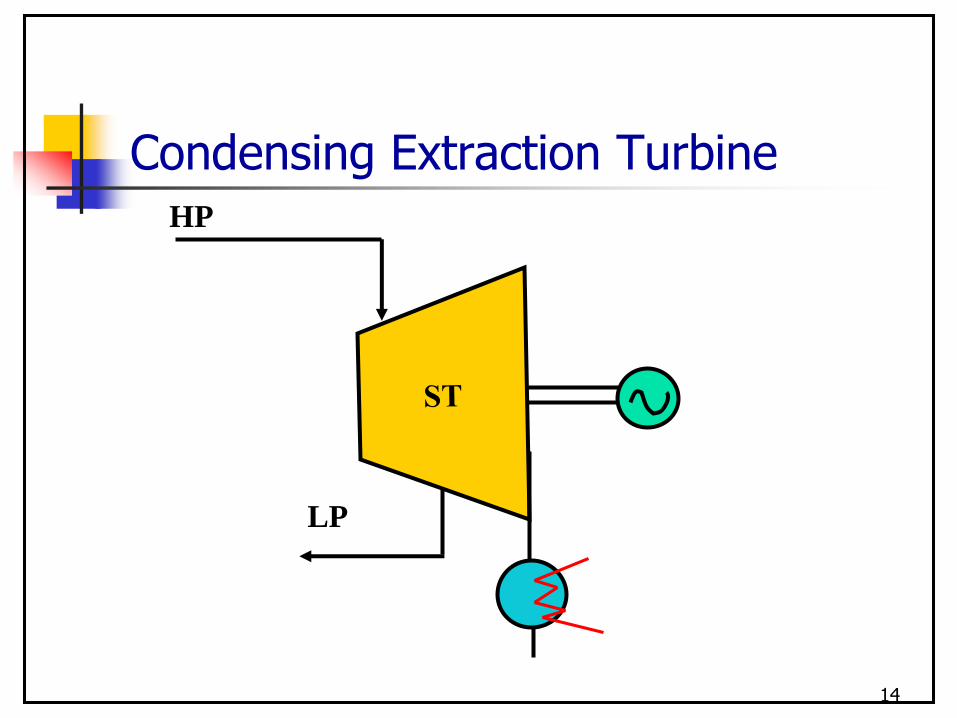
Condensing Extraction Turbine HP
LP
14
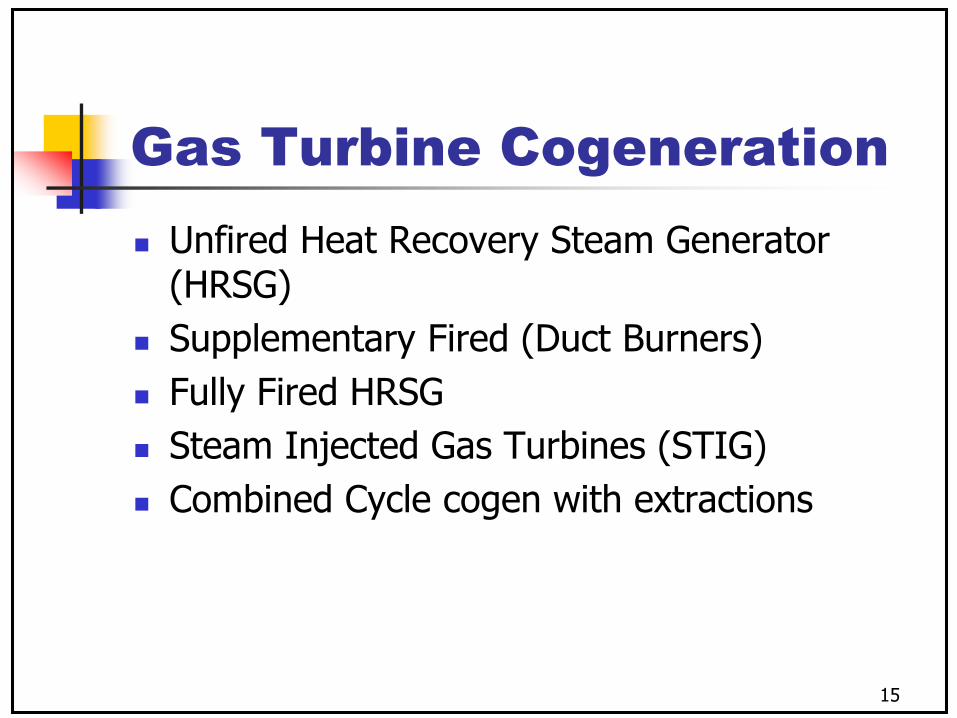
Gas Turbine Cogeneration
Unfired Heat Recovery Steam Generator (HRSG)
Supplementary Fired (Duct Burners)
Fully Fired HRSG
Steam Injected Gas Turbines (STIG)
Combined Cycle cogen with extractions
15
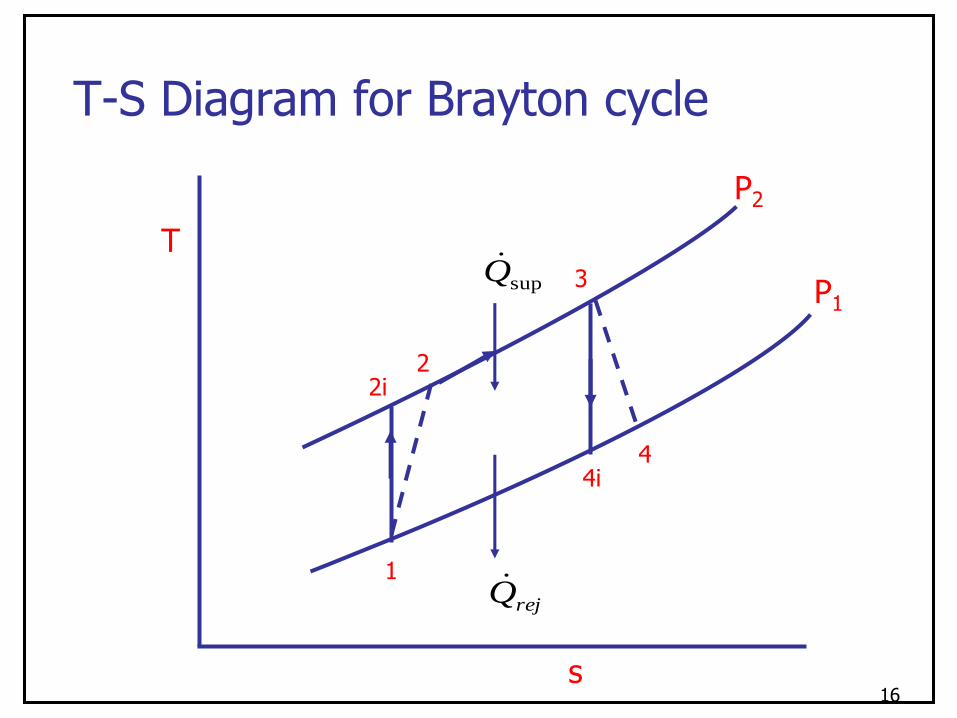
T-S Diagram for Brayton cycle
3
2i2
T
s
4i4
P1
P2
supQ
rejQ1
16

Brayton cycle calculations
)( 23sup TTCmQ P
)( 14 TTCmQ Prej
1
sup
sup 11
p
rej
rQ
iT
T
pr
T
iT
4
31
1
2
1
2
P
Prp
17

12
12)(
TT
TT icompis
i
TisTT
TT
43
43)(
Component efficiencies
18
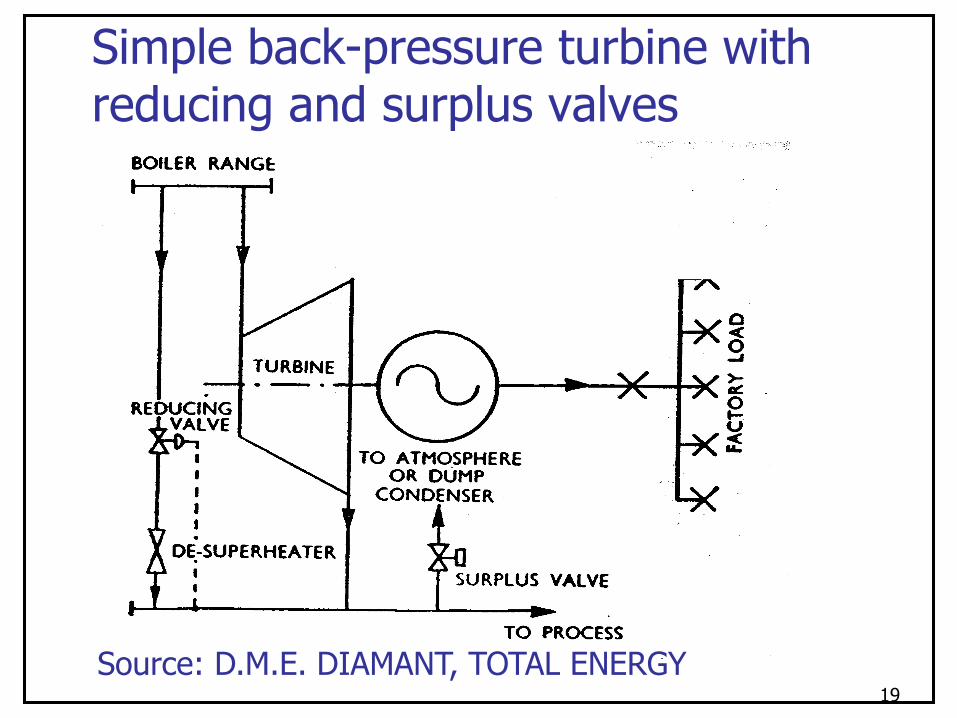
Simple back-pressure turbine with reducing and surplus valves
Source: D.M.E. DIAMANT, TOTAL ENERGY 19

C GT
GAS TURBINE BASED COGEN
CC
WHRB
Steam to Process
Suppl Fuel
Fuel
Stack
Air
Feed water
Power
20

Schematic of a recuperated micro-turbine based cogeneration unit
(Oniovwona and Ugursal)21

Electrical output
Energy InputDiesel
engine
Stack loss
Coolant loss
Surface heat
loss
Alternator
4%
24%
34%
3%
35%
Sankey diagram for diesel engine
22
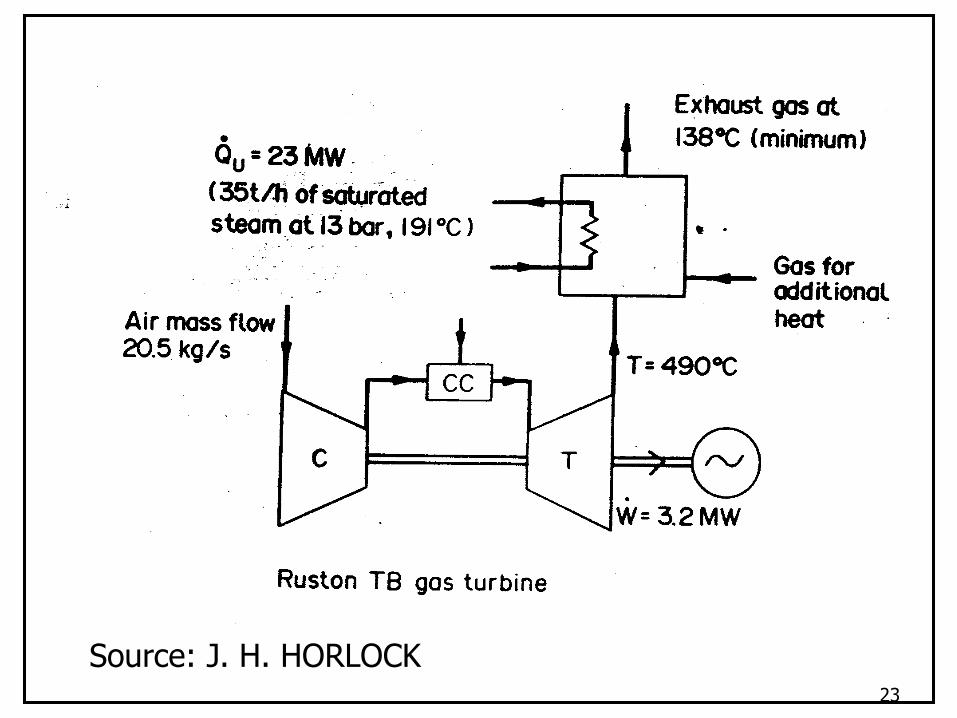
Source: J. H. HORLOCK 23
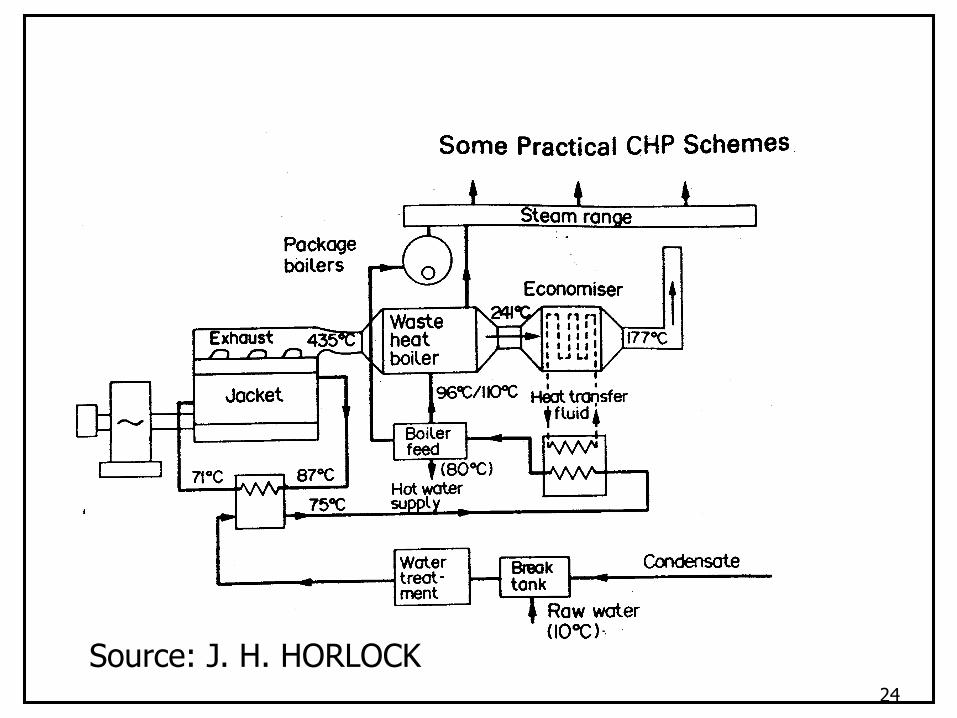
Source: J. H. HORLOCK 24

Typical packaged internal combustion engine based (spark
ignited)
cogeneration system (Oniovwona and Ugursal)25

Indian Installation: 1 MRPL, Mangalore
45 MW Cogen plant
3 Boilers-Each 40 TPH @ 103 kg/cm2g, 510C, oil fired
2 STG -Each 22.5 MW Condensing
Fuel: LSHS/ Visbreaker oil/LDO
Steam: HP40kg/cm2, MP
16kg/cm2, LP 4kg/cm2
26

Indian Installation: 2
RPL, Hazira
60 MW Cogen plant
2 GTGs
2 Fired HRSG - Each 125 TPH @ 115 kg/cm2g, 515C
Fuel: Natural Gas / HSD
Power: 60 MW
Steam: 115 kg/cm2g, 515 C
27
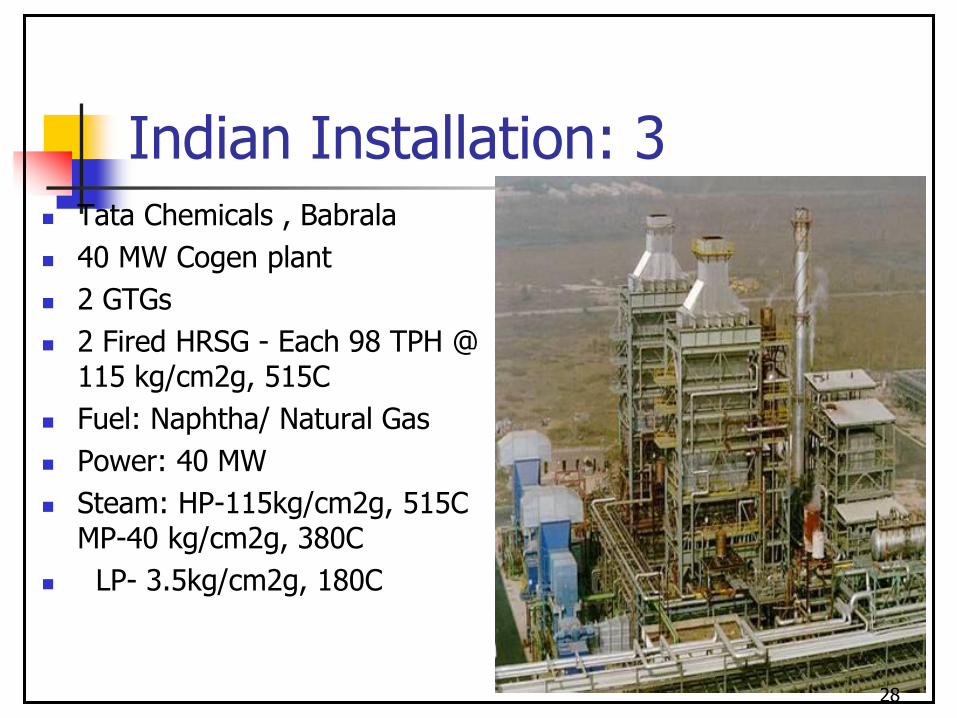
Indian Installation: 3 Tata Chemicals , Babrala
40 MW Cogen plant
2 GTGs
2 Fired HRSG - Each 98 TPH @ 115 kg/cm2g, 515C
Fuel: Naphtha/ Natural Gas
Power: 40 MW
Steam: HP-115kg/cm2g, 515C MP-40 kg/cm2g, 380C
LP- 3.5kg/cm2g, 180C
28

Source: J. H. HORLOCK 29

Costa et al (2007)
30
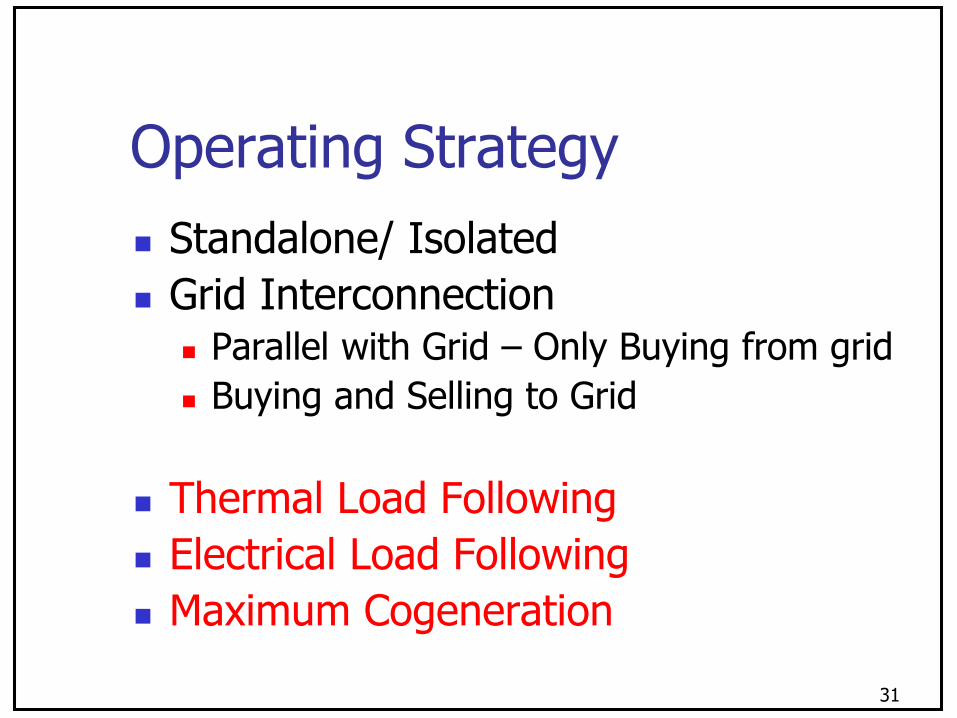
Operating Strategy
Standalone/ Isolated
Grid Interconnection Parallel with Grid – Only Buying from grid
Buying and Selling to Grid
Thermal Load Following
Electrical Load Following
Maximum Cogeneration
31

Part-load Characteristics
32

33

0.5T/hr
Feed water
Process
Process
2 ata
~
STEAM
TURBINE
2.5 MW
6 ata
BAGASSE
58 T/hr 22 ata
330o C
4.5T/hr 27T/hr
26T/hr
Schematic of typical 2500 tcd Sugar factory
Flashed
Condensate
PRDS
PRDS
MILLING
0.5T/hr
FEED
WATER
BOILER
34

Options
A- Replace mill turbines by motors + power turbine by efficient power turbine
B- New Boiler 43 ata 480 C + additional TG
C- HP Boiler 65 ata 480 C + additional TG
D – C+ replace mill turbines with TG
E – similar to D but with condensing extraction turbine
35

Feed water
Con
dens
er
2 ata
PROCESS
75 TPH, 65
ata, 480O
C
Process
Process
4.5 TPH
~
6 ata
BAGASSE (Alternate fuel)
2 ata
BFP
13 MW
BOILER
1.0 MW
Mill
drives
9.5 MW
Power export
2.5 MW
Captive
load
PROCESS
PROPOSED PLANT CONFIGURATION: OPTION 2
STEAM
TURBINE
CONDENSER
ESS
36

Comparison of Options
Case Output Export kWh export /tc
A 5.4 MW 1.9 MW 18
B 7.5 MW+M 5.0 MW 48
C 6.8 MW+M 4.3 MW 41
D 10.7 MW 7.2 MW 69
E 13 MW 9.5 MW 91
37

Optimal Cogeneration Strategy
Decisions Grid Electricity Bought/Sold
Equipment Mass Flow rates
Electric/Steam Drive
Constraints Equipment Characteristics – Min/Max
Process Steam & Electricity Loads
Grid Interconnection
Objective Function Minimise annual operating cost (Maximise
revenue)38

Cogeneration
Process Steam, Electricity load vary with time
Optimal Strategy depends on grid interconnection(parallel- only buying, buying/selling) and electricity,fuel prices
For given equipment configuration, optimal operating strategy can be determined
GT/ST/Diesel Engine – Part load characteristics – Non Linear
Illustrative example for petrochemical plant- shows variation in flat/TOU optimal.
39

LP Steam 5. 5 b, 180 oC
Gas turbine -1
Boiler
ST
PRDS-1
PRDS-3
Condenser
Deaerator
Process Load
Process Load
40 T/h
G
1
G
4
Process Load,
60 MW
BUS
Grid
7.52 MW
SHP Steam 100 bar,500o C
HP Steam 41b,400 oC
Fuel, LSHS
9.64 T/h
WHRB-1
Supp. Firing
LSHS 5.6 T/h
Stack
20 MW
Process Load,125 T/h
Process Load,150 T/h
MP Steam 20b, 300 oC
PRDS-2
Gas turbine -2
G
1
WHRB-2
Supp. Firing
LSHS 5.6 T/h
20 MW
Fuel, HSD
5.9 T/h
136 T/h
136 T/h
131.7 T/h12.5
MW
76.2 T/h60.6 T/h
117.1
T/h
40 T/h 49.5 T/h 16.2 T/h
20 T/h
40 T/h
53.4 T/h
Make up water,357 T/h40

Import Power from Grid with Cogeneration for a Petrochemical Plant
11 MW
17.6
21.6
00
5
10
15
20
25
1 2 3 4 5 6 7 8 9 10 11 12 13 14 15 16 17 18 19 20 21 22 23 24
Time hours
Imp
ort p
ow
er M
W
flat tariff TOU tariff
peak
period
demand
41

Export power to the grid with Cogeneration for a Petrochemical Plant
0
10
20
30
40
1 2 3 4 5 6 7 8 9 10 11 12 13 14 15 16 17 18 19 20 21 22 23 24
Time hours
Exp
ort P
ow
er M
W
flat tariff TOU tariff
9.7 MW
Peak
period
demand
42
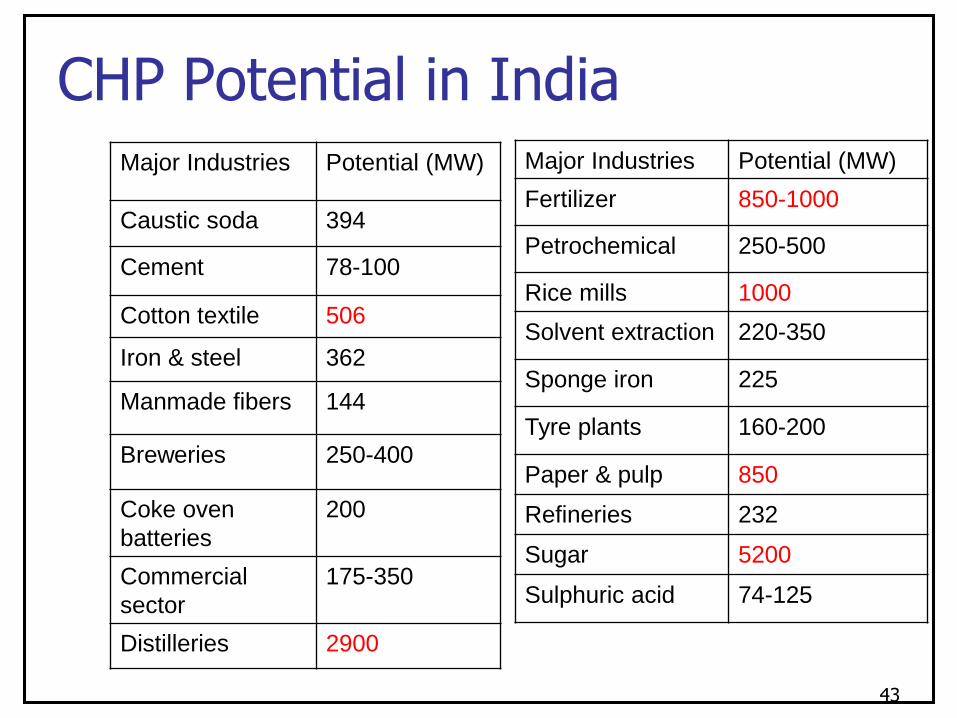
CHP Potential in IndiaMajor Industries Potential (MW)
Caustic soda 394
Cement 78-100
Cotton textile 506
Iron & steel 362
Manmade fibers 144
Breweries 250-400
Coke oven
batteries
200
Commercial
sector
175-350
Distilleries 2900
Major Industries Potential (MW)
Fertilizer 850-1000
Petrochemical 250-500
Rice mills 1000
Solvent extraction 220-350
Sponge iron 225
Tyre plants 160-200
Paper & pulp 850
Refineries 232
Sugar 5200
Sulphuric acid 74-125
43

Summing Up
Cogeneration, Tri-generation, Polygeneration –more efficient than separate heat and power
Even in industries with cogen – Retrofits for additional power generation
Grid Agreement –Parallel, Buying/Selling
Optimal operating strategy – can result in significant savings
Significant potential in process industries
44

References J Raghu Ram, R.Banerjee, Applied Thermal Engineering, Vol 23, p 1567-
1575, 2003
S. Khurana, R.Banerjee, U.N.Gaitonde, Applied Thermal Engineering, Vol 22, p 485-494, 2002
S.Ashok, R.Banerjee, IEEE Trans on Power Systems, Vol 18, May 2003, p931-937
Horlock, Cogeneration-CHP-thermodynamics and economics, PergamonPress, 1997
R.M.E. Diamant, Total Energy, 1970
YP Abbi,R K Bhogra,TERI Env Monitor,v10, 1994
p19-25
Onovwiona, Ugursal, ‘Residential Cogeneration systems: review of the current technology’, Applied Thermal Engineering, Vol 27, Issues 5-6,p 848-861, 2007.
A. Costa,J . Paris, M.Towers, T.Browne, Energy, 32, 2007, pp 474-481
Dryden Efficient Use of Steam, Butterworths, 1982
45