Embed Size (px)
Citation preview
FOCUS
Central and Eastern Europe: Less business insolvencies despite temporary headwinds in the construction sector
COFACE ECONOMIC PUBLICATIONS
SEPTEMBER 2017
By Grzegorz SielewiczEconomist - Warsaw
ALL OTHER GROUP ECONOMIC PUBLICATIONS ARE AVAILABLE ON: http://www.coface.com/Economic-Studies
Despite some slowdown last year, average GDP growth remained at a solid level
of 2.9% in Central and Eastern Europe. Economies have been benefi ting from the
favourable situation on the labour market, with contracting unemployment rates
and rising wages. The improving macroeconomic environment has had positive
effects on business. Company insolvencies dropped by 14% in 2015 and a further
6% in 2016. Over the course of last year, 6 entities per 1,000 became insolvent. The regional
breakdown reveals a wide variety of dynamics, ranging from a fall of 35.6% in proceedings in
Bulgaria, through to a minor increase of 2.6% in Poland and a surge of 56.9% in Hungary. Region-
wide however, the downturn in construction activities led to companies within this sector being
widely represented in insolvency statistics. Construction consequently took fi rst place in the
ranking of fl op sectors in the CEE region.
Coface forecasts that company insolvencies in the CEE region will decrease by 3.9% in 2017
and by 2.3% in 2018. The acceleration in GDP growth and the rebound in investment activity
bring further positive signals for businesses. A new fl ow of infrastructural projects, stable
contributions from household consumption and the exploration of foreign markets will all be
economic supporters. Nevertheless, businesses could experience some challenges, subject to
the whims of the global economy and political uncertainties. The latter include the eventual
negative consequences of Brexit and uncertainties in Western Europe, with unclear election
results in Italy. In addition, there have been local political issues, as seen in the Czech Republic,
Poland and Romania. The rebound in investments should be particularly benefi cial for sectors
such as construction, transport and the manufacturing of machinery, construction equipment
and construction materials. Nevertheless, labour shortages will remain an obstacle for many
expanding businesses.
2 COFACE ECONOMIC PUBLICATIONS
FOCUS
CENTRAL AND EASTERN EUROPE: LESS
BUSINESS INSOLVENCIES DESPITE TEMPORARY
HEADWINDS IN THE CONSTRUCTION SECTOR
1 - As the country’s economy is nearly as big as the entire rest of CEE countries analysed in the past, the regional GDP-weighted average is incomparable with previous statistics2 - http://www.telegram.hr/politika-kriminal/10-promjena-u-stecajnom-zakonu-koji-ce-neke-tvrtke-automatski-slati-u-stecaj/3 3 - Baker McKenzie, Global Restructuring & Insolvency Guide, Hungary
Despite a general improvement, insolvencies still remain above the pre-crisis levels of 2008 in most countries. Only Romania and Slovakia enjoy lower levels of company insolvencies than before 2008. Nominal insolvency figures vary between countries, as they were not only affected by their economic situations but also by the definitions of insolvency in specific countries (with amendments to insolvency laws, or more widespread use of insolvency procedures). This edition of the Coface insolvency report1 also includes Russia for the first time.
Diversified dynamics of company insolvencies among CEE countries
Insolvency figures varied between countries, as they were not only affected by their economic situations but also by the definitions of insolvency in specific countries (with amendments to insolvency laws, or more widespread use of insolvency procedures). This was the case in Croatia, where a significant increase in insolvency proceedings was recorded last year. This trend began at the end of 2012, when a new legal form entitled “pre-insolvency settlement procedure” (a judicial composition) was introduced. A new Bankruptcy Law then entered into force in September 2015 which strongly affected the 2016 insolvency figures. Under the new law, the National Financial Agency (FINA) is obliged to start bankruptcy proceedings for any company whose accounts have been blocked for more than 120 days. Before introducing this crucial law, there were around 14,000 companies in Croatia with no employees, which owed almost HRK 15 billion. Since the entry into force of the new law, all of these companies with accounts blocked for 120 days or more automatically become bankrupt, with the FINA opening the procedure within 8 days. More precisely, the requirement to start bankruptcy proceedings is not only a blockage of more than 120 days, but also the fact that a company has not paid its workers for three consecutive months. Bankruptcy proceedings are also initiated in cases of companies having claims higher than debts2. As a result of ‘cleaning’ registers of these dormant companies, the level of bankruptcies in Croatia surged by 6.7% last year - the highest ratio in the entire CEE region.
An increased number of company insolvencies was recorded in 6 out of the 14 CEE countries covered by the study. In Hungary they more than doubled in 2016 compared to the previous year. This was mainly due to a higher number of ex officio company cancellations, which were hardly covered by the 2015 statistics. Under Hungary’s insolvency laws, if the parties fail to conclude a debt restructuring agreement, or if the arrangement is not in compliance with the statutory requirements, the ex officio tribunal will dismiss the bankruptcy proceedings and consequently declare the debtor insolvent in liquidation proceedings (during which time the tribunal is obliged to order the liquidation of the debtor3). In 2016 the number of ex officio cancellations was comparable to the number of winding-up processes announced in Hungary. Winding-up as a procedure for company liquidation is highly formalised. The process usually lasts for between 6 to 12 months, in order to ensure that the company is closed in the correct manner. A surge in company insolvencies was also experienced in Lithuania last year. Similar to as in 2015, the statistics were further affected by the State Tax Inspectorate and Social Fund’s process of “cleaning” the market of companies which were theoretically insolvent long ago. Contrary to the above-mentioned countries, the challenging situation of the Ukrainian economy and the war conflict in Eastern part of the country have
Despite the slowdown, the economic environment remains supportive for corporates
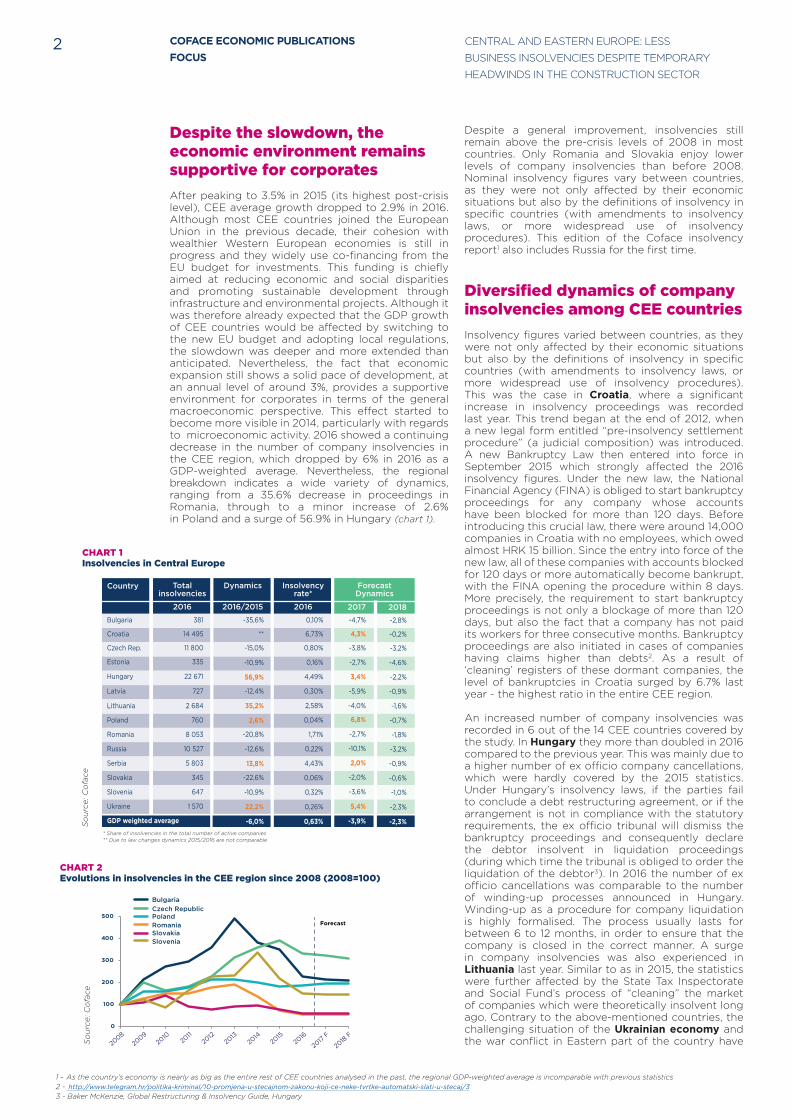
After peaking to 3.5% in 2015 (its highest post-crisis level), CEE average growth dropped to 2.9% in 2016. Although most CEE countries joined the European Union in the previous decade, their cohesion with wealthier Western European economies is still in progress and they widely use co-financing from the EU budget for investments. This funding is chiefly aimed at reducing economic and social disparities and promoting sustainable development through infrastructure and environmental projects. Although it was therefore already expected that the GDP growth of CEE countries would be affected by switching to the new EU budget and adopting local regulations, the slowdown was deeper and more extended than anticipated. Nevertheless, the fact that economic expansion still shows a solid pace of development, at an annual level of around 3%, provides a supportive environment for corporates in terms of the general macroeconomic perspective. This effect started to become more visible in 2014, particularly with regards to microeconomic activity. 2016 showed a continuing decrease in the number of company insolvencies in the CEE region, which dropped by 6% in 2016 as a GDP-weighted average. Nevertheless, the regional breakdown indicates a wide variety of dynamics, ranging from a 35.6% decrease in proceedings in Romania, through to a minor increase of 2.6% in Poland and a surge of 56.9% in Hungary (chart 1).
CHART 2Evolutions in insolvencies in the CEE region since 2008 (2008=100)
So
urc
e: C
ofa
ce
CHART 1Insolvencies in Central Europe
So
urc
e: C
ofa
ce
0
100
200
300
400
500 PolandCzech Republic
Romania
Bulgaria
SloveniaSlovakia
2008
2009
2010
2011
2012
2013
2014
2015
2016
2017
F
2018
F
61
4037
3533 33 32
3027 26
0
10
20
30
40
50
60
70
Manufacture of textile products, clothing and footwear
Construction
Hotels and restaurants
Waste draining and removal; sanitation
Food and beverage industry
Recreational, cultural and sports activities
Manufacture and chemical substances and products
Metallurgic industry
Wholesale and distribution
-40
-30
-20
-10
0
10
20
30
40
JAN 15
JUNE 15
NOV 15
APRIL 16
SEPT 16
FEB 17
Slovakia
Poland
Czech RepublicHungary
EU 28
Romania
Agriculture
Forecast
Country
Bulgaria
Croatia
Czech Rep.
Estonia
Hungary
Latvia
Lithuania
Poland
Romania
Russia
Serbia
Slovakia
Slovenia
Ukraine
GDP weighted average
Total insolvencies
2016
381
14 495
11 800
335
22 671
727
2 684
760
8 053
10 527
5 803
345
647
1 570
Dynamics
2016/2015
Insolvencyrate*
2016
ForecastDynamics
2017 2018
-35,6%
**
-15,0%
-10,9%
56,9%
-12,4%
35,2%
2,6%
-20,8%
-12,6%
13,8%
-22,6%
-10,9%
22,2%
-6,0%
0,10%
6,73%
0,80%
0,16%
4,49%
0,30%
2,58%
0,04%
1,71%
0,22%
4,43%
0,06%
0,32%
0,26%
0,63%
-4,7%
4,3%
-3,8%
-2,7%
3,4%
-5,9%
-4,0%
6,8%
-2,7%
-10,1%
2,0%
-2,0%
-3,6%
5,4%
-3,9%
-2,8%
-0,2%
-3,2%
-4,6%
-2,2%
-0,9%
-1,6%
-0,7%
-1,8%
-3,2%
-0,9%
-0,6%
-1,0%
-2,3%
-2,3%
* Share of insolvencies in the total number of active companies** Due to law changes dynamics 2015/2016 are not comparable
CENTRAL AND EASTERN EUROPE: LESS
BUSINESS INSOLVENCIES DESPITE TEMPORARY
HEADWINDS IN THE CONSTRUCTION SECTOR
COFACE ECONOMIC PUBLICATIONS
FOCUS3
4 - The analysis covers the initial stage of bankruptcies in Russia i.e. ‘supervision’ which is analogous to preliminary insolvency proceedings under German law (Beiten Burkhardt, Bankruptcy in Russia)5 - Insolvencies in Romania 2016, Coface
entitled to use various proceedings for restructuring. These include the procedure of approval of a plan after creditors’ votes, accelerated arrangement procedures, ordinary arrangement procedures and rehabilitation proceedings. Over the last year, restructuring procedures have gained popularity with companies suffering from liquidity problems. Whereas during the initial months of 2016, businesses were only just becoming familiar with the new regulations, restructuration procedures started to become more frequent over the rest of the year. The number of restructuration proceedings has been rising and reached a 27% share in total proceedings at the end of 2016. The number of insolvencies, on the other hand, has been decreasing. At the same time, although changes in legislation made the total number of proceedings higher than a year before, Poland still recorded the lowest insolvency rate in the CEE region.
led to a difficult environment for businesses. Although the economy recorded a positive growth rate last year, company insolvencies jumped by 20.2% in 2016.
Russia, which is covered by our study for the first time, recorded a 12.6% fall in insolvencies4. The economy has already rebounded from a recession, with positive signs shown by various economic indicators. The macroeconomic improvement transferred relatively quickly to the business side, which previously suffered from an increase of nearly 9% in bankruptcies in 2015. Nevertheless, the process of economic recovery has been gradual and businesses still face challenges. Last year over 2 active companies per 1,000 became bankrupt. The main reasons were the decline in consumption following the decrease in real household income, a rise in loan arrears of large and medium enterprises, the stagnation of fixed investments and relatively high interest rates (although these have somewhat stabilised compared to previous levels).
Among the 14 CEE countries covered by our analysis, eight recorded a slump in insolvencies last year. The strongest fall, of 35.6%, was experienced in Bulgaria where the pharmaceuticals, IT and education sectors hardly recorded any insolvencies. Nevertheless, although company insolvencies dropped last year, company indebtedness remained high. Non-performing loans are a concern for Bulgarian banks and for companies suffering from difficulties in collecting receivables from some of their counterparties.Companies from the trade sector account for nearly a fifth of all cases of insolvencies, followed by construction and real estate firms with 15%. The main reasons for these financial difficulties include high levels of indebtedness, poor liquidity management and fewer funding opportunities.
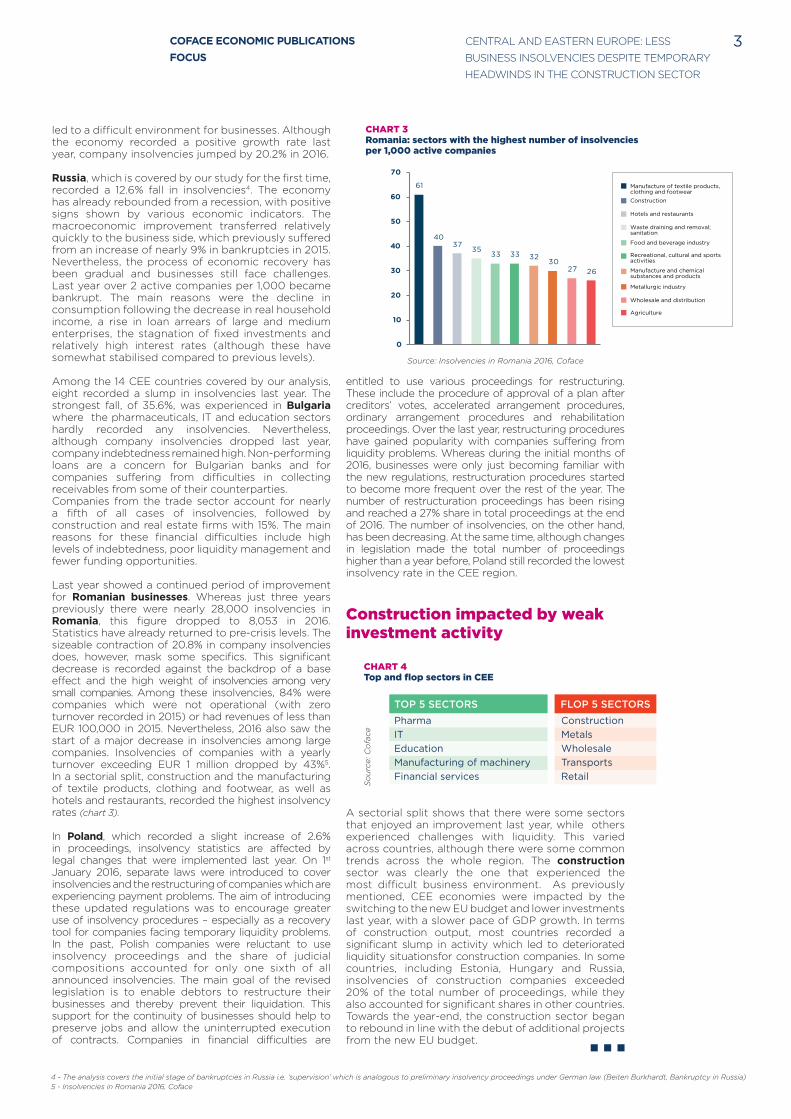
Last year showed a continued period of improvement for Romanian businesses. Whereas just three years previously there were nearly 28,000 insolvencies in Romania, this figure dropped to 8,053 in 2016. Statistics have already returned to pre-crisis levels. The sizeable contraction of 20.8% in company insolvencies does, however, mask some specifics. This significant decrease is recorded against the backdrop of a base effect and the high weight of insolvencies among very small companies. Among these insolvencies, 84% were companies which were not operational (with zero turnover recorded in 2015) or had revenues of less than EUR 100,000 in 2015. Nevertheless, 2016 also saw the start of a major decrease in insolvencies among large companies. Insolvencies of companies with a yearly turnover exceeding EUR 1 million dropped by 43%5. In a sectorial split, construction and the manufacturing of textile products, clothing and footwear, as well as hotels and restaurants, recorded the highest insolvency rates (chart 3).
In Poland, which recorded a slight increase of 2.6% in proceedings, insolvency statistics are affected by legal changes that were implemented last year. On 1st
January 2016, separate laws were introduced to cover insolvencies and the restructuring of companies which are experiencing payment problems. The aim of introducing these updated regulations was to encourage greater use of insolvency procedures – especially as a recovery tool for companies facing temporary liquidity problems. In the past, Polish companies were reluctant to use insolvency proceedings and the share of judicial compositions accounted for only one sixth of all announced insolvencies. The main goal of the revised legislation is to enable debtors to restructure their businesses and thereby prevent their liquidation. This support for the continuity of businesses should help to preserve jobs and allow the uninterrupted execution of contracts. Companies in financial difficulties are
CHART 3Romania: sectors with the highest number of insolvencies per 1,000 active companies
Source: Insolvencies in Romania 2016, Coface
0
100
200
300
400
500 PolandCzech Republic
Romania
Bulgaria
SloveniaSlovakia
2008
2009
2010
2011
2012
2013
2014
2015
2016
2017
F
2018
F
61
4037
3533 33 32
3027 26
0
10
20
30
40
50
60
70
Manufacture of textile products, clothing and footwear
Construction
Hotels and restaurants
Waste draining and removal; sanitation
Food and beverage industry
Recreational, cultural and sports activities
Manufacture and chemical substances and products
Metallurgic industry
Wholesale and distribution
-40
-30
-20
-10
0
10
20
30
40
JAN 15
JUNE 15
NOV 15
APRIL 16
SEPT 16
FEB 17
Slovakia
Poland
Czech RepublicHungary
EU 28
Romania
Agriculture
Forecast
CHART 4Top and flop sectors in CEE
So
urc
e: C
ofa
ce
TOP 5 SECTORS FLOP 5 SECTORS
Pharma
IT
Education
Manufacturing of machinery
Financial services
Construction
Metals
Wholesale
Transports
Retail
Construction impacted by weak investment activity
A sectorial split shows that there were some sectors that enjoyed an improvement last year, while others experienced challenges with liquidity. This varied across countries, although there were some common trends across the whole region. The construction sector was clearly the one that experienced the most difficult business environment. As previously mentioned, CEE economies were impacted by the switching to the new EU budget and lower investments last year, with a slower pace of GDP growth. In terms of construction output, most countries recorded a significant slump in activity which led to deteriorated liquidity situationsfor construction companies. In some countries, including Estonia, Hungary and Russia, insolvencies of construction companies exceeded 20% of the total number of proceedings, while they also accounted for significant shares in other countries. Towards the year-end, the construction sector began to rebound in line with the debut of additional projects from the new EU budget.
n n n
COFACE SA1, place Costes et Bellonte92270 Bois-ColombesFrance
www.coface.com
RÉSERVELe présent document reflète l’opinion de la direction de la recherche économique de Coface, à la
date de sa rédaction et en fonction des informations disponibles ; il pourra être modifié à tout
moment. Les informations, analyses et opinions qu’il contient ont été établies sur la base de
multiples sources jugées fiables et sérieuses ; toutefois, Coface ne garantit en aucun cas l’exactitude,
l’exhaustivité ou la réalité des données contenues dans le présent document. Les informations,
analyses et opinions sont communiquées à titre d’information et ne constituent qu’un complément
aux renseignements dont le lecteur dispose par ailleurs. Coface n’a aucune obligation de résultat
mais une obligation de moyens et n’assumera aucune responsabilité pour les éventuelles pertes
subies par le lecteur découlant de l’utilisation des informations, analyses et opinions contenues
dans le présent document. Ce document ainsi que les analyses et opinions qui y sont exprimées
appartiennent exclusivement à Coface ; le lecteur est autorisé à les consulter ou les reproduire à
des fins d’utilisation interne uniquement sous réserve de porter la mention apparente de Coface
et de ne pas altérer ou modifier les données. Toute utilisation, extraction, reproduction à des fins
d’utilisation publique ou commerciale est interdite sans l’accord préalable de Coface. Le lecteur est
invité à se reporter aux mentions légales présentes sur le site de Coface.
Ph
oto
© F
oto
lia
COFACE ECONOMIC PUBLICATIONS
FOCUS
CENTRAL AND EASTERN EUROPE: LESS
BUSINESS INSOLVENCIES DESPITE TEMPORARY
HEADWINDS IN THE CONSTRUCTION SECTOR
4
Further improvements on the cards
Growth in CEE economies is expected to regain strength following last year’s slowdown. Coface forecasts that the average Central Europe GDP growth rate will increase from 2.9% in 2016, to 3.4% in 2017 and 3.3% next year. Both 2017 and 2018 will be fueled by stable growth in private consumption, supported by continued improvements on the labour market. Households have already experienced an increase in prices. This shows a reversal of the deflationary period recorded in many economies over previous quarters. As a result of weaker real growth of wages, consumers could become more cautious on spending. Despite this, Coface does not anticipate that an increase in inflation (which will remain low anyway – mostly in line with central banks’ inflation targets) will have a diminishing effect on household consumption, but it will probably not grow as rapidly as previously. The rebound in fixed asset investments will stimulate the construction sector. Coface consequently anticipates less insolvencies in the construction sector in 2017 and 2018. The corporate side will also benefit from an increase in exports – particularly with the stable recovery in Western Europe (which remains the region’s main trading partner); along with rising exports to emerging markets. If CEE countries are efficient in the absorption of EU funds and/or household consumption strengthens significantly, economic activity will achieve even better momentum. Improvements on the macroeconomic side have been spreading over quite rapidly to the corporate sector. Coface forecasts that company insolvency proceedings will fall by 3.9% in 2017 and a further 2.3% in 2018. This would not constitute a major change, as growth last year was already relatively balanced – even with the exemption of contributions from fixed asset investments. With these investments now returning, growth will strengthen to the benefit of several sectors, including construction, transport and the manufacturing of machinery, construction equipment and construction materials.Many companies in other sectors will operate in a similar business environment to last year, benefiting from the growth in private consumption which remains the biggest component of nominal GDP for CEE countries. Nevertheless, labour shortages are a growing barrier to business operations and company expansions. Chart 1 illustrates Coface’s forecast for company insolvencies in 2017 and 2018. Increases in insolvency proceedings will mainly stem from changes in legislation that will affect statistics. In Croatia and Poland, amendments to insolvency laws that have already been implemented will continue to trigger a rise in proceedings. In Hungary legislation has already increased the number of situations where ex officio cancellations can be used by courts instead of a more costly and time-consuming winding-up (most notably when there are not enough assets to cover the costs of winding-up). Moreover, the Hungarian Parliament has approved legislation to extend the mandatory capital increase requirement for limited liability companies operating in Hungary. Both of these factors will lead to an increase in insolvency proceedings in Hungary until the end of this year.
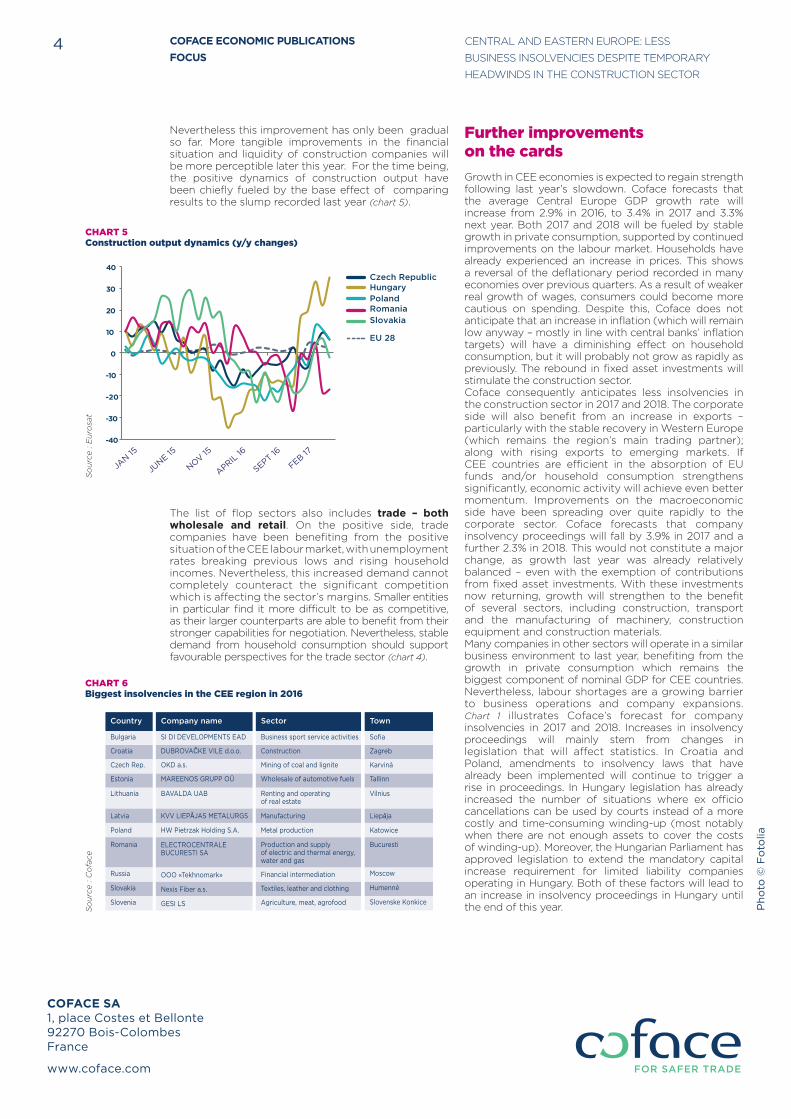
Nevertheless this improvement has only been gradual so far. More tangible improvements in the financial situation and liquidity of construction companies will be more perceptible later this year. For the time being, the positive dynamics of construction output have been chiefly fueled by the base effect of comparing results to the slump recorded last year (chart 5).
The list of flop sectors also includes trade – both wholesale and retail. On the positive side, trade companies have been benefiting from the positive situation of the CEE labour market, with unemployment rates breaking previous lows and rising household incomes. Nevertheless, this increased demand cannot completely counteract the significant competition which is affecting the sector’s margins. Smaller entities in particular find it more difficult to be as competitive, as their larger counterparts are able to benefit from their stronger capabilities for negotiation. Nevertheless, stable demand from household consumption should support favourable perspectives for the trade sector (chart 4).
CHART 5Construction output dynamics (y/y changes)
So
urc
e :
Eu
rosa
t0
100
200
300
400
500 PolandCzech Republic
Romania
Bulgaria
SloveniaSlovakia
2008
2009
2010
2011
2012
2013
2014
2015
2016
2017
F
2018
F
61
4037
3533 33 32
3027 26
0
10
20
30
40
50
60
70
Manufacture of textile products, clothing and footwear
Construction
Hotels and restaurants
Waste draining and removal; sanitation
Food and beverage industry
Recreational, cultural and sports activities
Manufacture and chemical substances and products
Metallurgic industry
Wholesale and distribution
-40
-30
-20
-10
0
10
20
30
40
JAN 15
JUNE 15
NOV 15
APRIL 16
SEPT 16
FEB 17
Slovakia
Poland
Czech RepublicHungary
EU 28
Romania
Agriculture
Forecast
CHART 6Biggest insolvencies in the CEE region in 2016
So
urc
e :
Co
face
Country
Bulgaria
Croatia
Czech Rep.
Estonia
Lithuania
Latvia
Poland
Romania
Russia
Slovakia
Slovenia
Company name
SI DI DEVELOPMENTS EAD
DUBROVAĈKE VILE d.o.o.
OKD a.s.
MAREENOS GRUPP OÜ
BAVALDA UAB
KVV LIEPĂJAS METALURGS
HW Pietrzak Holding S.A.
ELECTROCENTRALE BUCURESTI SA
OOO «Tekhnomark»
Nexis Fiber a.s.
GESI LS
Sector
Business sport service activities
Construction
Mining of coal and lignite
Wholesale of automotive fuels
Renting and operating of real estate
Manufacturing
Metal production
Production and supply of electric and thermal energy, water and gas
Financial intermediation
Textiles, leather and clothing
Agriculture, meat, agrofood
Town
Sofia
Zagreb
Karviná
Tallinn
Vilnius
Liepăja
Katowice
Bucuresti
Moscow
Humenné
Slovenske Konkice