Embed Size (px)
Citation preview

CodeWarrior Development Studio CommonFeatures Guide
Freescale Semiconductor, Inc. Document Number: CWCFUGReference Manual 10.x


Contents
Chapter 1 Introduction.....................................................................................111.1 Release notes...................................................................................................................................111.2 Documentation structure.................................................................................................................. 11
1.2.1 Documentation formats.......................................................................................................111.3 Manual conventions..........................................................................................................................12
1.3.1 Figure conventions............................................................................................................. 121.3.2 Keyboard conventions........................................................................................................ 12
1.4 CodeWarrior IDE overview...............................................................................................................121.4.1 Development cycle............................................................................................................. 121.4.2 CodeWarrior IDE advantages.............................................................................................13
Chapter 2 IDE Extensions............................................................................... 152.1 CodeWarrior Projects view...............................................................................................................16
2.1.1 Active configuration............................................................................................................ 162.1.2 Tree and list view................................................................................................................172.1.3 Column headers................................................................................................................. 182.1.4 Quick search.......................................................................................................................192.1.5 Filtering...............................................................................................................................20
2.2 Command line interface....................................................................................................................212.2.1 build.................................................................................................................................... 222.2.2 getOptions.......................................................................................................................... 232.2.3 generateMakefiles.............................................................................................................. 242.2.4 references...........................................................................................................................242.2.5 setOptions...........................................................................................................................252.2.6 updateWorkspace...............................................................................................................27
2.3 Commander view..............................................................................................................................272.3.1 Customizing Commander view........................................................................................... 292.3.2 Pinning Commander view...................................................................................................30
2.4 Concurrent compilation.....................................................................................................................302.5 Console view.................................................................................................................................... 322.6 Shortcut menus................................................................................................................................ 322.7 Diagnostic Information export...........................................................................................................33
2.7.1 General settings for Diagnostic Information........................................................................332.7.2 Export Diagnostic Information.............................................................................................35
2.8 Extracting CodeWarrior configuration details................................................................................... 392.9 Find and Open File...........................................................................................................................412.10 Importing files................................................................................................................................. 41
2.10.1 CodeWarrior drag and drop support................................................................................. 422.10.2 Using Import wizard.......................................................................................................... 42
2.10.2.1 Import existing project.........................................................................................422.10.2.2 Import example project....................................................................................... 45
2.11 Key mappings.................................................................................................................................472.12 Linker Command File navigation....................................................................................................482.13 Multiple compiler support................................................................................................................502.14 New External File........................................................................................................................... 512.15 Exporting and importing macros.....................................................................................................52
2.15.1 Add macro to a project......................................................................................................532.15.2 Export macros for a project...............................................................................................53
Contents
CodeWarrior Development Studio Common Features Guide, Rev. 10.x, 01/2016Freescale Semiconductor, Inc. 3

2.15.3 Import macros into a new project......................................................................................542.16 Problems view................................................................................................................................ 542.17 Referenced projects....................................................................................................................... 55
2.17.1 Create Referenced project................................................................................................552.17.2 Displaying referenced projects in CodeWarrior Projects view.......................................... 572.17.3 Automatic linking with referenced project build artifact.....................................................582.17.4 Circular build dependencies............................................................................................. 59
2.18 Target management via Remote System Explorer.........................................................................592.18.1 Creating remote system....................................................................................................592.18.2 Creating hardware or simulator connection configuration................................................ 622.18.3 Creating hardware or simulator target configuration.........................................................632.18.4 Creating TRK target configuration.................................................................................... 672.18.5 Remote Systems view...................................................................................................... 68
2.18.5.1 Modifying target or connection configuration...................................................... 682.18.5.2 Exporting target or connection configuration...................................................... 692.18.5.3 Importing target or connection configuration.......................................................702.18.5.4 Apply to Project...................................................................................................702.18.5.5 Apply to Connection............................................................................................712.18.5.6 Automatic removal of unreferenced remote system........................................... 71
2.18.6 Automatic project remote system setting cache............................................................... 722.18.6.1 Remote System Missing..................................................................................... 732.18.6.2 Remote System Changed dialog........................................................................ 74
2.18.7 Compatibility with older products...................................................................................... 752.18.7.1 Display of launch configurations needing migration............................................752.18.7.2 Migrating launch configurations.......................................................................... 78
2.19 Viewing CodeWarrior plug-ins........................................................................................................852.20 Editing cwide-env file......................................................................................................................882.21 Handling message alerts................................................................................................................89
Chapter 3 Debugger........................................................................................913.1 About debugger................................................................................................................................923.2 Breakpoints.......................................................................................................................................92
3.2.1 Breakpoints view.................................................................................................................933.2.2 Breakpoint annotations.......................................................................................................943.2.3 Regular breakpoints............................................................................................................94
3.2.3.1 Setting line breakpoint.......................................................................................... 953.2.3.2 Setting method breakpoint.................................................................................... 95
3.2.4 Special breakpoints............................................................................................................ 963.2.4.1 Setting special breakpoint using IDE.................................................................... 96
3.2.5 Breakpoint persistence....................................................................................................... 973.2.6 Breakpoint preferences.......................................................................................................973.2.7 Working with breakpoints....................................................................................................99
3.2.7.1 Modify breakpoint properties.................................................................................993.2.7.2 Restricting breakpoints to selected targets and threads..................................... 1013.2.7.3 Limiting new breakpoints to active debug context.............................................. 1023.2.7.4 Grouping breakpoints..........................................................................................1033.2.7.5 Disabling breakpoints..........................................................................................1033.2.7.6 Enabling breakpoints.......................................................................................... 1043.2.7.7 Removing breakpoints........................................................................................ 1043.2.7.8 Removing all breakpoints....................................................................................1043.2.7.9 Undo delete breakpoint.......................................................................................1043.2.7.10 Redo delete breakpoint.....................................................................................1053.2.7.11 Skipping all breakpoints.................................................................................... 105
3.2.8 Breakpoint actions............................................................................................................ 105
Contents
CodeWarrior Development Studio Common Features Guide, Rev. 10.x, 01/20164 Freescale Semiconductor, Inc.

3.2.8.1 Breakpoint Actions preferences page................................................................. 1063.2.8.2 Adding breakpoint action.................................................................................... 1073.2.8.3 Attaching breakpoint actions to breakpoints....................................................... 108
3.2.9 Selecting breakpoint template.......................................................................................... 1093.3 Build while debugging.....................................................................................................................1103.4 Cache view.....................................................................................................................................111
3.4.1 Opening Cache view.........................................................................................................1123.4.2 Preserving sorting.............................................................................................................1133.4.3 Cache view pop-up menu.................................................................................................114
3.5 CodeWarrior debugger settings......................................................................................................1163.5.1 Modifying debugger settings.............................................................................................1163.5.2 Reverting debugger settings.............................................................................................1173.5.3 Stopping debugger at program entry point....................................................................... 117
3.6 Core index indicators in homogeneous multicore environment......................................................1183.6.1 System Browser view....................................................................................................... 118
3.6.1.1 Kernel Awareness...............................................................................................1183.6.1.2 OS application.....................................................................................................119
3.6.2 Console View....................................................................................................................1193.7 Debug perspective..........................................................................................................................1203.8 Debug view.....................................................................................................................................121
3.8.1 Common debugging actions.............................................................................................1223.8.1.1 Starting debugger............................................................................................... 1233.8.1.2 Stepping into routine call.....................................................................................1233.8.1.3 Stepping out of routine call................................................................................. 1233.8.1.4 Stepping over routine call................................................................................... 1233.8.1.5 Stopping program execution............................................................................... 1243.8.1.6 Resuming program execution............................................................................. 1243.8.1.7 Running program................................................................................................ 1243.8.1.8 Disconnecting core............................................................................................. 1243.8.1.9 Restarting debugger........................................................................................... 1243.8.1.10 Debugging in Instruction Stepping mode.......................................................... 1253.8.1.11 Changing program counter value......................................................................125
3.9 Disassembly view...........................................................................................................................1253.10 Environment variables in launch configuration.............................................................................1263.11 Flash programmer........................................................................................................................ 127
3.11.1 Create a flash programmer target task........................................................................... 1283.11.2 Configure flash programmer target task......................................................................... 130
3.11.2.1 Add flash device................................................................................................1303.11.2.2 Specify target RAM settings..............................................................................1303.11.2.3 Add flash programmer actions.......................................................................... 131
3.11.3 Execute flash programmer target task............................................................................1363.12 Flash File to Target.......................................................................................................................137
3.12.1 Erasing flash device........................................................................................................1383.12.2 Programming a file..........................................................................................................138
3.13 Hardware diagnostics...................................................................................................................1393.13.1 Creating hardware diagnostics task................................................................................1393.13.2 Working with Hardware Diagnostic Action editor............................................................140
3.13.2.1 Action Type....................................................................................................... 1403.13.2.2 Memory Access................................................................................................ 1413.13.2.3 Loop Speed.......................................................................................................1413.13.2.4 Memory Tests................................................................................................... 142
3.13.3 Memory test use cases...................................................................................................1453.13.3.1 Use Case 1: Execute host-based Scope Loop on target.................................. 1453.13.3.2 Use Case 2: Execute target-based Memory Tests on target............................ 146
3.14 Import/Export/Fill memory............................................................................................................ 146
Contents
CodeWarrior Development Studio Common Features Guide, Rev. 10.x, 01/2016Freescale Semiconductor, Inc. 5

3.14.1 Creating task for import/export/fill memory..................................................................... 1463.14.2 Importing data into memory............................................................................................ 1483.14.3 Exporting memory to file................................................................................................. 1503.14.4 Fill memory..................................................................................................................... 152
3.15 Launch group................................................................................................................................1533.15.1 Creating launch group.................................................................................................... 1533.15.2 Launching launch group................................................................................................. 156
3.16 Load multiple binaries...................................................................................................................1573.16.1 Viewing binaries..............................................................................................................158
3.17 Memory view................................................................................................................................ 1593.17.1 Opening Memory view.................................................................................................... 1603.17.2 Adding memory monitor..................................................................................................1603.17.3 Adding memory renderings.............................................................................................1623.17.4 Mixed source rendering.................................................................................................. 1633.17.5 Setting memory access size........................................................................................... 1643.17.6 Exporting memory...........................................................................................................1643.17.7 Importing memory...........................................................................................................1653.17.8 Setting watchpoint in Memory view................................................................................ 1663.17.9 Clearing watchpoints from Memory view........................................................................ 166
3.18 Memory Browser view.................................................................................................................. 1673.19 Memory Management Unit configurator....................................................................................... 168
3.19.1 Creating MMU configuration........................................................................................... 1683.19.2 Saving MMU Configurator settings................................................................................. 1713.19.3 MMU Configurator toolbar.............................................................................................. 1713.19.4 MMU Configurator pages................................................................................................172
3.19.4.1 General page.................................................................................................... 1733.19.4.2 Program MATT page........................................................................................ 1743.19.4.3 Data MATT page...............................................................................................1773.19.4.4 Saving MMU configurator generated code....................................................... 180
3.19.5 Opening MMU Configurator view....................................................................................1823.20 Multicore debugging..................................................................................................................... 183
3.20.1 Multicore Suspend..........................................................................................................1833.20.2 Multicore Resume...........................................................................................................1843.20.3 Multicore Terminate........................................................................................................ 1843.20.4 Multicore Restart.............................................................................................................184
3.21 Multicore Groups.......................................................................................................................... 1853.21.1 Creating multicore group................................................................................................ 1853.21.2 Modifying multicore group...............................................................................................1883.21.3 Editing multicore group...................................................................................................1893.21.4 Using multicore group debugging commands................................................................ 1913.21.5 Multicore breakpoint halt groups.....................................................................................192
3.22 Multicore reset..............................................................................................................................1923.22.1 On demand reset............................................................................................................195
3.23 Path mappings..............................................................................................................................1953.23.1 Automatic path mappings............................................................................................... 1953.23.2 Manual path mappings................................................................................................... 197
3.23.2.1 Adding path mapping to workspace..................................................................2003.24 Redirecting standard output streams to socket............................................................................ 2013.25 Refreshing data during runtime.................................................................................................... 2033.26 Registers view.............................................................................................................................. 204
3.26.1 Opening Registers view..................................................................................................2063.26.2 Viewing registers............................................................................................................ 2063.26.3 Changing register values................................................................................................2063.26.4 Exporting registers..........................................................................................................2073.26.5 Importing registers..........................................................................................................208
Contents
CodeWarrior Development Studio Common Features Guide, Rev. 10.x, 01/20166 Freescale Semiconductor, Inc.

3.26.6 Changing register data display format............................................................................ 2093.27 Register Details view....................................................................................................................209
3.27.1 Viewing register details offline........................................................................................ 2103.27.2 Loading register dump file in offline Register Details view............................................. 2123.27.3 Customizing Register Details pane.................................................................................213
3.28 Remote launch............................................................................................................................. 2143.28.1 Remote Launch view...................................................................................................... 215
3.29 Stack crawls................................................................................................................................. 2163.29.1 One Frame mode............................................................................................................2163.29.2 Global preference........................................................................................................... 217
3.30 Symbolics..................................................................................................................................... 2193.31 System Browser view................................................................................................................... 220
3.31.1 Opening System Browser view.......................................................................................2203.32 Target connection lost.................................................................................................................. 2223.33 Target initialization files................................................................................................................ 223
3.33.1 Selecting target initialization file......................................................................................2233.34 Target Tasks view........................................................................................................................ 225
3.34.1 Exporting target tasks.....................................................................................................2253.34.2 Importing target tasks..................................................................................................... 226
3.35 Variables.......................................................................................................................................2263.35.1 Opening Variables view..................................................................................................2273.35.2 Adding variable location to view..................................................................................... 2273.35.3 Manipulating variable values.......................................................................................... 228
3.35.3.1 Fractional variable formats................................................................................2293.35.4 Adding global variables...................................................................................................2293.35.5 Cast to Type................................................................................................................... 230
3.36 Watchpoints..................................................................................................................................2313.36.1 Setting watchpoint.......................................................................................................... 2323.36.2 Creating watchpoint........................................................................................................2333.36.3 Viewing watchpoint properties........................................................................................2343.36.4 Modifying watchpoint properties..................................................................................... 2353.36.5 Disabling watchpoint.......................................................................................................2363.36.6 Enabling watchpoint........................................................................................................2363.36.7 Remove watchpoint........................................................................................................ 2373.36.8 Remove all watchpoints..................................................................................................237
Chapter 4 Debugger Shell.............................................................................2394.1 Executing previously issued commands.........................................................................................2414.2 Using code hints.............................................................................................................................2414.3 Using auto-completion....................................................................................................................2414.4 Command-line debugger shell........................................................................................................2424.5 Debugger Shell commands............................................................................................................ 242
4.5.1 about.................................................................................................................................2444.5.2 alias.................................................................................................................................. 2444.5.3 bp......................................................................................................................................2454.5.4 cd......................................................................................................................................2464.5.5 change..............................................................................................................................2464.5.6 cls..................................................................................................................................... 2494.5.7 cmdwin::ca........................................................................................................................2494.5.8 cmdwin::caln.....................................................................................................................2494.5.9 config................................................................................................................................ 2504.5.10 copy................................................................................................................................ 2544.5.11 debug..............................................................................................................................2554.5.12 dir....................................................................................................................................255
Contents
CodeWarrior Development Studio Common Features Guide, Rev. 10.x, 01/2016Freescale Semiconductor, Inc. 7
4.5.13 disassemble....................................................................................................................2564.5.14 display.............................................................................................................................2574.5.15 evaluate.......................................................................................................................... 2604.5.16 finish............................................................................................................................... 2614.5.17 fl::blankcheck..................................................................................................................2624.5.18 fl::checksum....................................................................................................................2624.5.19 fl::device..........................................................................................................................2634.5.20 fl::diagnose..................................................................................................................... 2644.5.21 fl::disconnect...................................................................................................................2654.5.22 fl::dump...........................................................................................................................2654.5.23 fl::erase...........................................................................................................................2664.5.24 fl::image.......................................................................................................................... 2664.5.25 fl::protect.........................................................................................................................2674.5.26 fl::secure......................................................................................................................... 2674.5.27 fl::target...........................................................................................................................2684.5.28 fl::verify........................................................................................................................... 2694.5.29 fl::write............................................................................................................................ 2694.5.30 funcs............................................................................................................................... 2694.5.31 getpid..............................................................................................................................2694.5.32 go....................................................................................................................................2694.5.33 help.................................................................................................................................2704.5.34 history............................................................................................................................. 2714.5.35 jtagclock..........................................................................................................................2714.5.36 kill....................................................................................................................................2714.5.37 launch............................................................................................................................. 2724.5.38 linux::displaylinuxlist....................................................................................................... 2724.5.39 linux::loadsymbolics........................................................................................................2734.5.40 linux::refreshmodules......................................................................................................2734.5.41 linux::selectmodule......................................................................................................... 2734.5.42 linux::unloadsymbolics....................................................................................................2734.5.43 loadsym.......................................................................................................................... 2734.5.44 log...................................................................................................................................2744.5.45 mc::config....................................................................................................................... 2744.5.46 mc::go.............................................................................................................................2754.5.47 mc::group........................................................................................................................2754.5.48 mc::kill.............................................................................................................................2764.5.49 mc::reset.........................................................................................................................2764.5.50 mc::restart.......................................................................................................................2764.5.51 mc::stop.......................................................................................................................... 2774.5.52 mc::type.......................................................................................................................... 2774.5.53 mem................................................................................................................................2784.5.54 next.................................................................................................................................2804.5.55 nexti................................................................................................................................ 2804.5.56 oneframe.........................................................................................................................2804.5.57 pwd................................................................................................................................. 2814.5.58 quitIDE............................................................................................................................2814.5.59 radix................................................................................................................................2814.5.60 redirect............................................................................................................................2824.5.61 refresh.............................................................................................................................2834.5.62 reg...................................................................................................................................2834.5.63 reset................................................................................................................................2864.5.64 restart..............................................................................................................................2864.5.65 restore.............................................................................................................................2874.5.66 run...................................................................................................................................2884.5.67 save................................................................................................................................ 288
Contents
CodeWarrior Development Studio Common Features Guide, Rev. 10.x, 01/20168 Freescale Semiconductor, Inc.

4.5.68 setpc............................................................................................................................... 2894.5.69 setpicloadaddr................................................................................................................ 2904.5.70 stack............................................................................................................................... 2904.5.71 status.............................................................................................................................. 2914.5.72 step.................................................................................................................................2914.5.73 stepi................................................................................................................................ 2924.5.74 stop.................................................................................................................................2924.5.75 switchtarget.....................................................................................................................2934.5.76 system............................................................................................................................ 2944.5.77 var...................................................................................................................................2944.5.78 wait................................................................................................................................. 2954.5.79 watchpoint.......................................................................................................................296
Chapter 5 Debugger Script Migration............................................................2975.1 Command-line syntax.....................................................................................................................2975.2 Launching debug session...............................................................................................................2975.3 Stepping......................................................................................................................................... 2995.4 Settings of config command........................................................................................................... 300
Index.................................................................................................................................. 301
Contents
CodeWarrior Development Studio Common Features Guide, Rev. 10.x, 01/2016Freescale Semiconductor, Inc. 9

Contents
CodeWarrior Development Studio Common Features Guide, Rev. 10.x, 01/201610 Freescale Semiconductor, Inc.

Chapter 1IntroductionThis manual describes the CodeWarrior IDE and debugger features that are common across all the CodeWarriorproducts. This chapter presents an overview of the manual and the CodeWarrior IDE.
The CodeWarrior Common Features Guide (document CWCFUG) may describefeatures that are not available for your product. Further, the figures show a typical userinterface, which may differ slightly from your CodeWarrior product. See your product'sTargeting Manual for details of its product-specific features.
NOTE
This chapter includes:
• Release notes on page 11
• Documentation structure on page 11
• Manual conventions on page 12
• CodeWarrior IDE overview on page 12
1.1 Release notesThese notes contain important information about the last-minute changes, bug fixes, incompatible elements,or other sections that may not be included in this manual.
Before using the CodeWarrior IDE, read the release notes.
The release notes for specific components of the CodeWarrior IDE are located in theRelease_Notes folder in the CodeWarrior installation directory.
NOTE
1.2 Documentation structureCodeWarrior products include an extensive documentation library of user guides, targeting manuals, andreference manuals.
Take advantage of the documentation library to learn how to efficiently develop software using the CodeWarriorprogramming environment.
This section includes:
• Documentation formats on page 11
1.2.1 Documentation formatsThis topic lists that the CodeWarrior documentation is provided in the PDF and HTML formats.
CodeWarrior documentation presents information in the following formats:
• PDF - Portable Document Format of the CodeWarrior manuals, such as the CodeWarrior CommonFeatures Guide (document CWCFUG) and the product-specific Targeting manuals.
• HTML (Hypertext Markup Language) - HTML versions of the CodeWarrior manuals. To access the HTMLversion of CodeWarrior manuals, choose Help > Help Contents from the CodeWarrior IDE menu bar.
IntroductionRelease notes
CodeWarrior Development Studio Common Features Guide, Rev. 10.x, 01/2016Freescale Semiconductor, Inc. 11

1.3 Manual conventionsThis topic lists the different conventions used in the manual.
It explains conventions in the CodeWarrior Common Features Guide (document CWCFUG).
This section includes:
• Figure conventions on page 12
• Keyboard conventions on page 12
1.3.1 Figure conventionsThe CodeWarrior IDE employs a virtually identical user interface across multiple hosts. For this reason,illustrations of common interface elements use images from any host.
However, some interface elements are unique to a particular host. In such cases, clearly labeled images identifythe specific host.
1.3.2 Keyboard conventionsThe CodeWarrior IDE accepts keyboard shortcuts, or key bindings , for frequently used operations. For eachoperation, this manual lists corresponding key bindings by platform.
At any time, you can obtain a list of available key bindings using Key Assist ( Help > Key Assist or Ctrl+Shift+L ).
1.4 CodeWarrior IDE overviewThe CodeWarrior IDE provides an efficient and flexible software-development tool suite. This topic explainsthe the software development cycle and the advantages of using the CodeWarrior IDE for development.
This topic explains:
• Development cycle on page 12
• CodeWarrior IDE advantages on page 13
1.4.1 Development cycleThis topic explains the steps required to complete the development cycle a project.
A software developer follows a general process to develop a project:
1. Begin with an idea for a new software.
2. Implement the new idea in source code.
3. Compile the source code into machine code.
4. Link the machine code and create an executable file.
5. Correct errors (debug).
6. Compile, link, and release a final executable file. The following figure shows the development cycle as aflowchart.
IntroductionManual conventions
CodeWarrior Development Studio Common Features Guide, Rev. 10.x, 01/201612 Freescale Semiconductor, Inc.

Figure 1: CodeWarrior Development Cycle
1.4.2 CodeWarrior IDE advantagesThis topic lists the different advantages of Codewarrior IDE.
• Cross-platform development
Develop software to run on multiple operating systems, or use multiple hosts to develop the same softwareproject. The CodeWarrior IDE runs on popular operating systems, such as Windows, Solaris, and Linux. Ituses virtually the same graphical user interface (GUI) across all Freescale Eclipse-based products.
• Multiple-language support
Choose from multiple programming languages when developing software. The CodeWarrior IDE supportshigh-level languages, such as C, C++, and Java, as well as in-line assemblers for most processors.
• Consistent development environment
IntroductionCodeWarrior IDE overview
CodeWarrior Development Studio Common Features Guide, Rev. 10.x, 01/2016Freescale Semiconductor, Inc. 13

Port software to new processors without having to learn new tools or lose an existing code base. TheCodeWarrior IDE supports many common desktop and embedded processor families, such as x86, PowerPC,and MIPS.
• Plug-in tool support
Extend the capabilities of the CodeWarrior IDE by adding a plug-in tool that supports new features. TheCodeWarrior IDE currently supports plug-ins for compilers, linkers, pre-linkers, post-linkers, preference panels,version controls, and other tools. Plug-ins make it possible for the CodeWarrior IDE to process differentlanguages and support different processor families.
IntroductionCodeWarrior IDE overview
CodeWarrior Development Studio Common Features Guide, Rev. 10.x, 01/201614 Freescale Semiconductor, Inc.

Chapter 2IDE ExtensionsThe CodeWarrior IDE is composed of various plug-ins, each of which provide a specific functionality to the IDE.This chapter explains how to work with various extensions (plug-ins) in the Eclipse IDE.
This chapter explains:
• CodeWarrior Projects view on page 16
• Command line interface on page 21
• Commander view on page 27
• Concurrent compilation on page 30
• Console view on page 32
• Shortcut menus on page 32
• Diagnostic Information export on page 33
• Extracting CodeWarrior configuration details on page 39
• Find and Open File on page 41
• Importing files on page 41
• Key mappings on page 47
• Linker Command File navigation on page 48
• Multiple compiler support on page 50
• New External File on page 51
• Exporting and importing macros on page 52
• Problems view on page 54
• Referenced projects on page 55
• Target management via Remote System Explorer on page 59
• Viewing CodeWarrior plug-ins on page 85
• Editing cwide-env file on page 88
• Handling message alerts on page 89
IDE Extensions
CodeWarrior Development Studio Common Features Guide, Rev. 10.x, 01/2016Freescale Semiconductor, Inc. 15

2.1 CodeWarrior Projects viewThe CodeWarrior Projects view displays all the resources in a workspace.
Figure 2: CodeWarrior Projects view
The CodeWarrior Projects view is an enhanced version of the C/C++ Projects view.
Improvements provided by the CodeWarrior Projects view are discussed in the following sections.
• Active configuration on page 16
• Tree and list view on page 17
• Column headers on page 18
• Quick search on page 19
• Filtering on page 20
2.1.1 Active configurationThe CodeWarrior Projects view displays the name of active configuration associated with a project.
Click the configuration name to view the shortcut menu that displays all the configurations available to the project.You can switch to different configurations using this shortcut menu.
IDE ExtensionsCodeWarrior Projects view
CodeWarrior Development Studio Common Features Guide, Rev. 10.x, 01/201616 Freescale Semiconductor, Inc.

Figure 3: CodeWarrior Projects view - Active configuration
2.1.2 Tree and list viewThe CodeWarrior Projects view supports both hierarchal tree and flat list viewing of the resources in aworkspace.
The table below lists the toolbar icons that can be used to switch the viewing of resources.
Table 1: CodeWarrior Projects view toolbar
Icon Description
Click the Show files in a hierarchal view icon in theCodeWarrior Projects view toolbar to display theresources in hierarchal tree view.
Click the Show files in a flat view icon in theCodeWarrior Projects view toolbar to display theresources in flat list view.
IDE ExtensionsCodeWarrior Projects view
CodeWarrior Development Studio Common Features Guide, Rev. 10.x, 01/2016Freescale Semiconductor, Inc. 17

2.1.3 Column headersThe column headers in the CodeWarrior Projects view let you sort the list of files and folders based on thecolumn.
A small triangle in the column header indicates the active column and the sort order. If a column is active, clickingon its header toggles between the descending and ascending order.
The files can be sorted in both hierarchal and flat list views. Sorting is not case-sensitivefor strings.
NOTE
To add a column header in the CodeWarrior Projects view:
1. Choose Customize Column Headers from the CodeWarrior Projects view pop-up menu.
The Customize Column Headers dialog appears.
Figure 4: Customize Column Headers
2. Select a checkbox to display or hide the corresponding column in the CodeWarrior Projects view.Alternatively, you can click Select All or Deselect All to display or hide all the columns listed in the dialog.
3. Click OK .
You cannot customize the FileName column using the Customize Column Headersdialog.
NOTE
The column header is added to the CodeWarrior Projects view.
IDE ExtensionsCodeWarrior Projects view
CodeWarrior Development Studio Common Features Guide, Rev. 10.x, 01/201618 Freescale Semiconductor, Inc.

2.1.4 Quick searchThe CodeWarrior Projects view provides quick search that lets you filter the files in the current view based onthe expression you enter.
Quick search provides the following features:
• Type Ahead - Type the first few letters of the file name and the CodeWarrior Projects view automaticallyselects the appropriate file based on the string typed.
• Wildcard character support - You can also use basic wildcard characters, such as ? and *, to extend yoursearch.
The CodeWarrior Projects view automatically switches to the flat view when anexpression is entered in the Search Text textbox.
NOTE
Figure 5: CodeWarrior Projects view - Quick search
Click the Popup icon in the CodeWarrior Projects view toolbar to specify the fields in which the Eclipse IDEsearches for the expression typed in the Search Text textbox.
When you click the Popup button, the fields appear depending on the headers enabledin the view.
NOTE
Click the Erase Text icon in the CodeWarrior Projects view toolbar to clear the Quick Search query. TheCodeWarrior Projects view reverts to the normal view displaying all the folders and files in the workspace.
IDE ExtensionsCodeWarrior Projects view
CodeWarrior Development Studio Common Features Guide, Rev. 10.x, 01/2016Freescale Semiconductor, Inc. 19

2.1.5 FilteringThe CodeWarrior Projects view lets you filter the elements being displayed.
The following four filters has been added to filter the content in the CodeWarrior Projects view.
• Generated Files - Filters the output directory associated with each build configuration. This contains all filesgenerated by a build including the executable files, object files, ephemeral makefiles, dependency files,map files, and other such elements. Typically, these files are all contained within a directory named after thebuild configuration. The entire directory is filtered.
• Includes - Filters out the Includes element, which shows the include paths the project is using and theincluded files.
• Launch Configurations - Filters .launch files, which are the launch configurations stored with the project.Typically, these files are stored in a Debug_Settings folder. In such case, the entire folder is filtered.
• Referenced Projects - Filters the Referenced Projects element that shows what other projects and build-configurations are referenced by the project.
To filter the content of the CodeWarrior Projects view:
1. Click the inverted triangle icon in the CodeWarrior Projects view.
The shortcut menu appears.
2. Choose Filters.
The C Element Filters dialog appears.
IDE ExtensionsCodeWarrior Projects view
CodeWarrior Development Studio Common Features Guide, Rev. 10.x, 01/201620 Freescale Semiconductor, Inc.

Figure 6: C Element Filters dialog
3. Select the filter element you want to exclude from the CodeWarrior Projects view.
4. Click OK.
2.2 Command line interfaceA new command- line tool, ecd.exe, is installed along with the cwide.exe that allows you to run buildcommands.
To create an Eclipse build from the ecd command line:
1. Click Start , click Run , type cmd to open Command Prompt .
2. Navigate to the <CWInstallDir> \eclipse\folder to invoke the ecd command line.
3. At the command prompt, type the following command:
ecd -build -data my_workspace_path -project my_project_path
IDE ExtensionsCommand line interface
CodeWarrior Development Studio Common Features Guide, Rev. 10.x, 01/2016Freescale Semiconductor, Inc. 21
Projects specified by the -project flag that are not present in the workspace (eitherthe default one or the one specified by the -data flag) are automatically imported inthe workspace as existing project in the file system, and recorded in the workspacemetadata.
NOTE
The ecd commands are listed below.
• build on page 22
• getOptions on page 23
• generateMakefiles on page 24
• references on page 24
• setOptions on page 25
• updateWorkspace on page 27
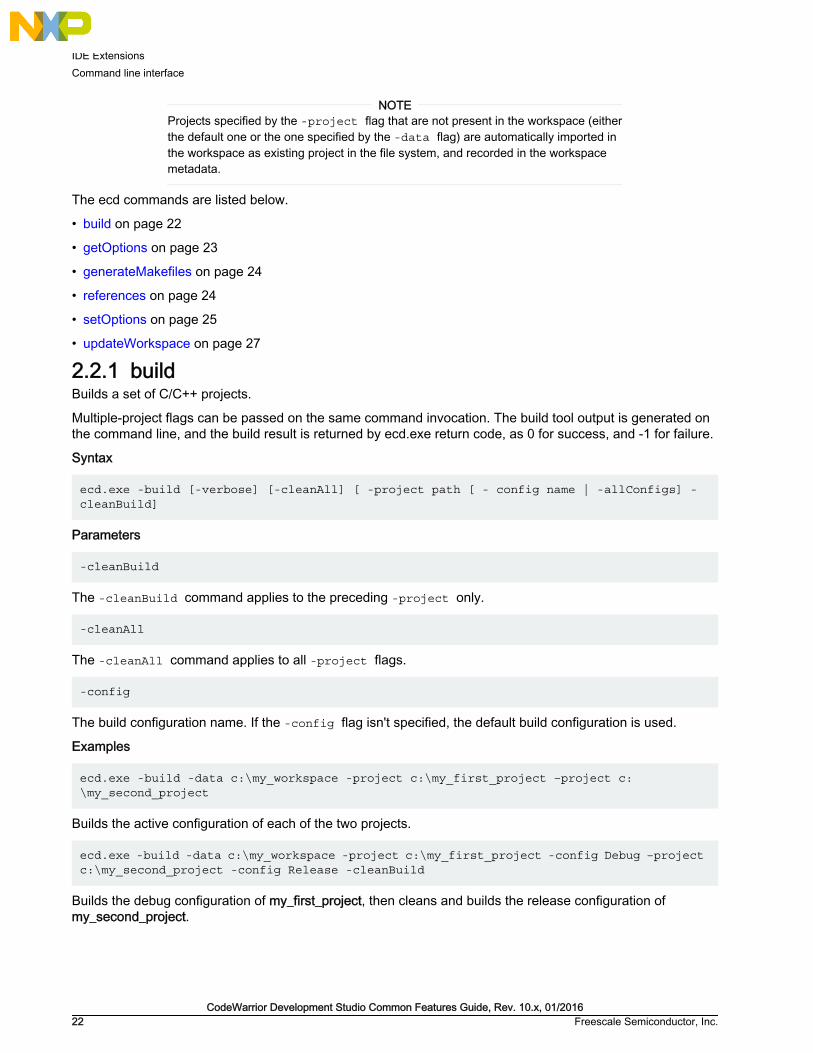
2.2.1 buildBuilds a set of C/C++ projects.
Multiple-project flags can be passed on the same command invocation. The build tool output is generated onthe command line, and the build result is returned by ecd.exe return code, as 0 for success, and -1 for failure.
Syntax
ecd.exe -build [-verbose] [-cleanAll] [ -project path [ - config name | -allConfigs] -cleanBuild]
Parameters
-cleanBuild
The -cleanBuild command applies to the preceding -project only.
-cleanAll
The -cleanAll command applies to all -project flags.
-config
The build configuration name. If the -config flag isn't specified, the default build configuration is used.
Examples
ecd.exe -build -data c:\my_workspace -project c:\my_first_project –project c:\my_second_project
Builds the active configuration of each of the two projects.
ecd.exe -build -data c:\my_workspace -project c:\my_first_project -config Debug –project c:\my_second_project -config Release -cleanBuild
Builds the debug configuration of my_first_project, then cleans and builds the release configuration ofmy_second_project.
IDE ExtensionsCommand line interface
CodeWarrior Development Studio Common Features Guide, Rev. 10.x, 01/201622 Freescale Semiconductor, Inc.

2.2.2 getOptionsPrints to the standard output C/C++ managed build, launch configuration or RSE system settings.
Syntax
ecd.exe -getOptions -project path [-config name | -allConfigs] [- file path] [-option option-name] [-launchConfig name | - allLaunchConfigs] [-rseSystem name | -allRseSystems]
Parameters
-config
The build configuration name. If the -config flag isn't specified, the default build configuration is used.
-allConfigs
Specifies that all build configurations will be edited or listed
-file
The file path of a file included in the project. If the -file flag is specified, a file-level setting is retrieved insteadof a build configuration level setting(s). The -file flag does not apply to the -launchConfig , -allLaunchConfigs , -rseSystem , and -allRseSystems flags.
-option
If the option setting isn't specified, all options are printed in a key=value format instead of a single option value,which could be used for discovering the list of option ids in a given build configuration, launch configuration orRSE system.
-option-name
Specify the option name.
-launchConfig
The launch configuration name. Allows retrieving launch configuration settings.
-allLaunchConfigs
Allow retrieving all launch configuration settings.
-rseSystem
The RSE system name. Allow retrieving RSE system settings.
-allRseSystems
Lets you retrieve RSE targets and connections settings.
Examples
ecd.exe -getOptions -project c:\my_first_project -config Debug
IDE ExtensionsCommand line interface
CodeWarrior Development Studio Common Features Guide, Rev. 10.x, 01/2016Freescale Semiconductor, Inc. 23

Gets all the options for the debug configuration of my_first_project.
ecd.exe -getOptions -project c:\my_first_project -allConfigs -option gnu.c.compiler.option.preprocessor.def.symbols
Gets the values of the specified option in each defined configuration.
ecd.exe -getOptions -project c:\my_first_project -rseSystem "my_first_project_Debug_B4860_Download Target"
Gets the RSE options of the specified RSE system. The quotes are necessary for escaping the space in theRSE system name.
ecd.exe -getOptions -project c:\my_first_project -allConfigs -allRseSystems
Displays all the RSE systems options in each defined configuration.
2.2.3 generateMakefilesCreates the makefiles required to build a C/C++ project.
Syntax
ecd.exe -generateMakefiles [-verbose] [ -project path [ - config name ] [-allConfigs] ] [-data workspace-path]
Parameters
-config
The build configuration name. If the -config flag isn't specified, the default build configuration is used.
-data workspace-path
The -data workspace-path flag can be used to specify a custom workspace.
Examples
ecd.exe -generateMakefiles -data c:\my_workspace -project c:\my_first_project –project c:\my_second_project
Generates the makefiles for the active configuration of each of the two projects.
ecd.exe -build -data c:\my_workspace -project c:\my_first_project -config Debug –project c:\my_second_project -config Release
Generates the makefiles for the debug configuration of my_first_project, then for the release configuration ofmy_second_project.
2.2.4 referencesLists, adds or removes all the referenced project and build configurations in a project.
Syntax
ecd.exe -references -project path [-config name | -allConfigs] ( - list | -add | -remove) referencedProjectLocation [buildConfigurationName]
IDE ExtensionsCommand line interface
CodeWarrior Development Studio Common Features Guide, Rev. 10.x, 01/201624 Freescale Semiconductor, Inc.

Parameters
-config name
The name of the build configuration to edit or list referenced project. If the -config flag is omitted, the active buildconfiguration will be used.
-allConfigs
Specifies that all build configurations will be edited or listed.
-list
List all the referenced projects and build configurations
-add referencedProjectLocation [buildConfigurationName]
Adds a new referenced project, specified by the 'referencedProjectLocation', which can be either an absolutepath, or a variable relative path (relative to the path variables defined in the project specified by the -project flag).If the buildConfigurationName is specified, a specific build configuration rather than the active buildconfiguration will be referenced.
-remove referencedProjectLocation [buildConfigurationName]
Removes an existing referenced project, specified by the 'referencedProjectLocation', which can be either anabsolute path, or a variable relative path (relative to the path variables defined in the project specified by the -project flag). If the buildConfigurationName is specified, only the specific referenced build configuration willbe removed, otherwise all references to the specified project will be removed.
Examples
ecd.exe -references -project c:\my_first_project
Lists the references of my_first_project; –list is the default command.
ecd.exe -references -project c:\my_first_project -add c:\my_second_project
Adds a reference of the active configuration of my_second_project to the active configuration of my_first_project.
ecd.exe -references -project c:\my_first_project -remove c:\my_second_project
Removes all the references of my_second_project from all configurations of my_first_project.
ecd.exe -references -project c:\my_first_project -config Debug -add c:\my_second_projectRelease
Adds a reference of the release configuration of my_second_project to the debug configuration ofmy_first_project.
2.2.5 setOptionsModifies C/C++ managed build, launch configuration or RSE system settings.
Syntax
ecd.exe -setOptions -project path [-config name | -allConfigs | -rseSystem name | -allRseSystems | -launchConfig name | -allLaunchConfigs] [-file path] (-set | -prepend | -append | -insert) option-name option- value
IDE ExtensionsCommand line interface
CodeWarrior Development Studio Common Features Guide, Rev. 10.x, 01/2016Freescale Semiconductor, Inc. 25

Parameters
-config
The build configuration name. If the '-config' flag isn't specified, the default build configuration will be used.
-file
The path of a file included in the project. If the '-file' flag is specified, a file-level setting is changed instead of abuild configuration level setting. The -file flag does not apply to the -launchConfig, -allLaunchConfigs ,-rseSystem, and -allRseSystems flags.
-set | -prepend | -append | -insert
A setting can be either changed by replacing its previous value by the new specified one, using the -set flag,or prepended or appended to the existing value using the -prepend and -append flags respectively. The -insert flag can be used for updating exist macros values in macro settings.
option-name
A complete option-name list can be obtained by using the -getOptions command documented above.
option-value
The new value of the setting to be changed.
-launchConfig
The launch configuration name. Allows modifying launch configuration settings.
-allLaunchConfigs
Allow modifying the values in all the launch configurations.
-rseSystem
The RSE system name. Allow modifying the value in the specific RSE systems.
Examples
ecd.exe -setOptions -project c:\my_first_project -allConfigs –set gnu.c.compiler.option.preprocessor.def.symbols FOO=BAR
Sets FOO as a defined symbol with value BAR in the list of defined symbols for every configuration.
ecd.exe -setOptions -project c:\my_first_project –config Debug –append gnu.c.compiler.option.preprocessor.def.symbols __SOME_MACRO_FOR_DEBUG__
Adds the macro in the list of defined symbols for the debug configuration. If this command is preceded by theprevious example, the list of defined symbols will contain FOO=BAR and __SOME_MACRO_FOR_DEBUG__ separatedby a line break.
ecd.exe -setOptions -project c:\my_first_project -allConfigs –set gnu.c.compiler.option.preprocessor.def.symbols FOO=BAZ
IDE ExtensionsCommand line interface
CodeWarrior Development Studio Common Features Guide, Rev. 10.x, 01/201626 Freescale Semiconductor, Inc.

Updates FOO as a defined symbol with value BAZ in the list of defined symbols for every configuration. If thiscommand is preceded by the first example, it will change BAR to BAZ.
ecd.exe -setOptions -project c:\my_first_project –file c:\my_first_project\Sources\main.c –prepend gnu.c.compiler.option.preprocessor.def.symbols __SOME_MACRO_FOR_FILE__
Adds the macro in the list of defined symbols for this file for the active configuration. If this command is precededby the previous examples, the list of defined symbols for main.c will contain __SOME_MACRO_FOR_FILE__,FOO=BAZ and __SOME_MACRO_FOR_DEBUG__ separated by a line break.
2.2.6 updateWorkspaceUpdates a workspace .metadata by including any project already located in the workspace file systemdirectory.
Optionally, it supports redirecting the standard output to a logfile. It also supports leaving the Workbench UIopen with the -noclose flag.
Syntax
ecd.exe -updateWorkspace -data workspace-path [-logfile path] [-noclose]
Example
ecd.exe -updateWorkspace -data c:\my_workspace
2.3 Commander viewThe Commander view provides quick access to some of the common and basic CodeWarrior operations.
This concept is similar to that of the Quick Launch Bar in Windows. The Commander view provides an icon anda descriptive label for each action. The Commander view is optional and customizable.
IDE ExtensionsCommander view
CodeWarrior Development Studio Common Features Guide, Rev. 10.x, 01/2016Freescale Semiconductor, Inc. 27

Figure 7: Commander view
The Commander view is not only a new place for existing commands, but also for new commands which optimizecommon user workflows. Some commands map directly to existing commands in the IDE. For example, theWelcome screen command and the Build All command. These two commands behave identically to thecommands in the IDE menu and toolbar. However, most commands are either improvements on existingcommands or commands which reduce the number of steps to get to an existing user interface or functionality.
In the Commander view, some commands have variant commands that appear next to the root command. Theroot command works for a single project; while the All variant works for all projects in the workspace. For example,the All command next to the Build command. These are two independent commands on a single line. The Allvariant is always available because it does not need a project context, while the Build command is available onlywhen there is a selection in the CodeWarrior Projects view or the view is pinned to a project (Pinning Commanderview on page 30). A variant action does not have an icon and is visible only if its base command is shown.
Commands in the Commander view, are grouped in the following four groups:
• Project Creation
• Build/Debug
• Settings
• Miscellaneous
Each group is a collapsible section and each command has a key binding, which appears in the tooltip of thecommand. By default, the Commander view is docked under the CodeWarrior Projects view but like any otherview it can be moved to any location within the CodeWarrior IDE.
Commands displayed in the Commander view may vary from product to product.
NOTE
IDE ExtensionsCommander view
CodeWarrior Development Studio Common Features Guide, Rev. 10.x, 01/201628 Freescale Semiconductor, Inc.

This section includes the following topics:
• Customizing Commander view on page 29
• Pinning Commander view on page 30
2.3.1 Customizing Commander viewYou can customize the content of the Commander view by choosing the commands to be displayed in theCommander view.
To customize the Commander view:
1. Choose Customize from the pop-up menu in the Commander view.
The Commander View Customization dialog appears.
Figure 8: Customizing Commander view
2. Expand a command group.
3. Select/deselect the command you want to hide/display.
4. Click OK.
The selected commands appear in the Commander view.
IDE ExtensionsCommander view
CodeWarrior Development Studio Common Features Guide, Rev. 10.x, 01/2016Freescale Semiconductor, Inc. 29

Clicking the Restore Default button sets the command set choices to the defaultcombination.
NOTE
2.3.2 Pinning Commander viewPinning the Commander view allows you to set the context to a particular project.
If you have multiple projects in your workspace but work mostly on a particular project, then you are allowed topin the Commander view to a specific project. So whenever you perform another task from the Commanderview, it uses the pinned project for its context regardless of the project selected in the CodeWarrior Projectsview.
Click the Pin to Project button in the Commander view to set the context to a particular project. A label alsoappears in the top-right corner to the Commander view specifying the project the view is pinned to.
The following figure shows the pinned Commander view:
Figure 9: Pinning Commander view
2.4 Concurrent compilationThe concurrent compilation feature allows you to specify number of processes to compile a CodeWarriorproject.
To enable the concurrent compilation for a project:
1. In the CodeWarrior Projects view, right-click the project folder.
IDE ExtensionsConcurrent compilation
CodeWarrior Development Studio Common Features Guide, Rev. 10.x, 01/201630 Freescale Semiconductor, Inc.

A shortcut menu appears.
2. Choose Properties from the shortcut menu.
The Properties for <project> dialog appears.
3. Select C/C++ Build from left pane of the Properties for <project> dialog.
The C/C++ build properties appear in the right pane of the Properties for <project> dialog.
4. Click the Behaviour tab.
The C/C++ build behavior properties appear under the Behaviour pane in the Properties for <project> dialog.
Figure 10: Properties for <Project> dialog
5. Select the Enable project specific settings checkbox.
The Enable parallel build checkbox is available.
6. Select any one of the following options.
• Use optimal number of jobs
• Use parallel jobs
• Use unlimited lobs
CodeWarrior Power Architecture does not support using parallel jobs. For this reason,the Use parallel jobs option is not available in the latest versions of the CodeWarriorDevelopment Studio for Power Architecture Processors.
NOTE
7. Click Apply.
8. Click OK.
You have now specified number of processes to compile the project.
IDE ExtensionsConcurrent compilation
CodeWarrior Development Studio Common Features Guide, Rev. 10.x, 01/2016Freescale Semiconductor, Inc. 31

2.5 Console viewThe CodeWarrior Console view displays the output from the build (standard out and standard error) as it isgenerated by the build process.
Double-clicking the error or warning message in the Console view moves the cursor to the error-source in theEditor window.
Figure 11: Console view
2.6 Shortcut menusShortcut menus provide shortcuts to frequently used CodeWarrior menu commands.
The available menu commands change, based on the context of the selected item.
Use shortcut menus to apply context-specific commands to selected items. Right-click an item to open a shortcutmenu for that item. The shortcut menu appears, displaying menu commands applicable to the selected item.
Examples of situations in which the debugger displays a shortcut menu are:
• Changing the format of variables displayed in variable panes
• Manipulating breakpoints and the program counter in source code panes
• Viewing memory in separate views
To discover additional features, try right-clicking in each IDE view to see whatcommands are presented in the shortcut menu that appears.
TIP
The following figure shows the shortcut menu displayed in the Variables view.
IDE ExtensionsConsole view
CodeWarrior Development Studio Common Features Guide, Rev. 10.x, 01/201632 Freescale Semiconductor, Inc.

Figure 12: Shortcut menu in Variables view
2.7 Diagnostic Information exportThe Diagnostic Information export feature allows you to export error log information to Freescale supportgroup to diagnose the issue you have encountered while working on the CodeWarrior product.
You can export diagnostic information in the following two ways:
• Whenever an error dialog invokes to inform some exception has occurred, the dialog displays an option toopen the Export wizard. You can then choose the files you want to send to Freescale support.
• You can manually open the Export wizard to generate an archive of logs and files to report any issue thatyou have encountered.
This section includes:
• General settings for Diagnostic Information on page 33
• Export Diagnostic Information on page 35
2.7.1 General settings for Diagnostic InformationYou can specify general settings for diagnostic information using the Preferences dialog.
To set general settings for diagnostic information, follow the steps given below:
1. Choose Windows > Preferences from the IDE menu bar.
The Preferences dialog appears.
IDE ExtensionsDiagnostic Information export
CodeWarrior Development Studio Common Features Guide, Rev. 10.x, 01/2016Freescale Semiconductor, Inc. 33

Figure 13: Preferences dialog - Diagnostic Information
2. Expand the General group and choose Diagnostic Information .
The Diagnostic Information page appears.
3. Enter the number of days for which you want to display the diagnostic information details in the exportwizard.
4. Select the Privacy option by dragging the bar to low, medium and high.
Privacy level setting is used to filter the content of the logs.
• Low: The file is sent as is.
• Medium: The personal information is obfuscated. You can click on the customize option to view or modifyfilter.
• High: The personal information is removed. Filters are used in the rest of the content.
• Click Customize to set privacy filters.
The Customize Filters dialog appears. You can add, remove, and modify filters.
• Click OK .
IDE ExtensionsDiagnostic Information export
CodeWarrior Development Studio Common Features Guide, Rev. 10.x, 01/201634 Freescale Semiconductor, Inc.

Figure 14: Diagnostic Information - Customize Filters
• Enter Contact Name and Contact Email in the contact information textbox. This information is optionalthough Freescale will not share this information with anyone.
• Click Restore Defaults to apply default factory settings.
• Click OK .
2.7.2 Export Diagnostic InformationYou can export diagnostic information into an archive file in workspace.
Follow the steps given below to export diagnostic information into an archive.
1. Choose File > Export from the IDE menu bar.
The Export dialog appears.
2. Expand the General group and choose Diagnostic Information option.
IDE ExtensionsDiagnostic Information export
CodeWarrior Development Studio Common Features Guide, Rev. 10.x, 01/2016Freescale Semiconductor, Inc. 35
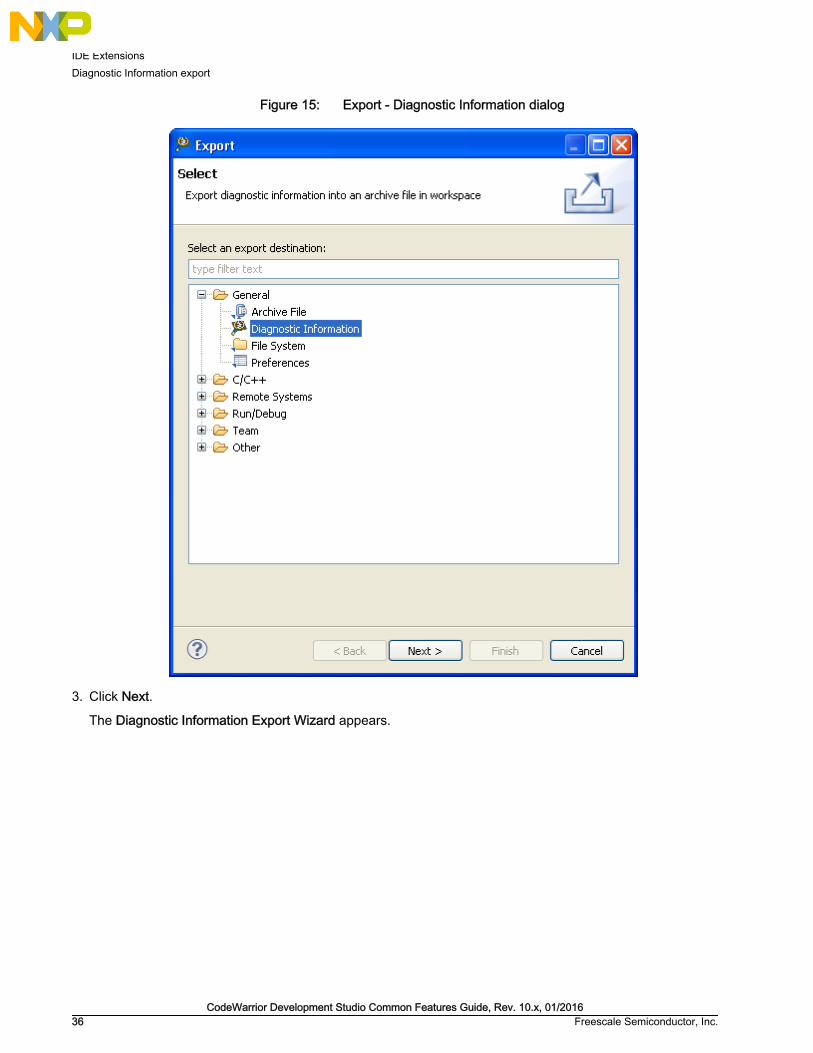
Figure 15: Export - Diagnostic Information dialog
3. Click Next.
The Diagnostic Information Export Wizard appears.
IDE ExtensionsDiagnostic Information export
CodeWarrior Development Studio Common Features Guide, Rev. 10.x, 01/201636 Freescale Semiconductor, Inc.

Figure 16: Diagnostic Information Export Wizard
4. Select the checkbox under the Source column to select the information that will be exported into thearchive file.
You must select at least one file for export.
NOTE
5. Click Browse to select a different archive file location.
6. Select the Privacy option or click Customize to set your privacy level. The Customize Filters dialogappears.
You can open the Customize Filters dialog through Customize button in the DiagnosticInformation Export Wizard ( Figure 16. Diagnostic Information Export Wizard on page37)or in the Preferences dialog ( General settings for Diagnostic Information on page33).
NOTE
7. Click Preview to view the text that will be sent to Freescale from the wizard.
IDE ExtensionsDiagnostic Information export
CodeWarrior Development Studio Common Features Guide, Rev. 10.x, 01/2016Freescale Semiconductor, Inc. 37

The Preview details dialog appears.
Figure 17: Preview details dialog
You can also check if more filters are needed to protect any sensitive information from leakage.
8. Click OK .
9. Click Next in the Diagnostic Information Export Wizard.
The Reproducible Details page appears.
IDE ExtensionsDiagnostic Information export
CodeWarrior Development Studio Common Features Guide, Rev. 10.x, 01/201638 Freescale Semiconductor, Inc.

Figure 18: Reproducible Details dialog
10.Enter the reproducible steps and any other relevant information in the Details to recreate the issue textbox.
11.Click Add to add additional files to the archive file for diagnosis.
12.Click Finish.
2.8 Extracting CodeWarrior configuration detailsYou can extract the configuration details of the currently installed CodeWarrior features and associated plug-ins.
Following are the steps:
1. Choose Help > About CodeWarrior Development Studio from the IDE menu bar.
The About Freescale CodeWarrior dialog appears.
2. Click Installation Details.
The CodeWarrior Development Studio Installation Details dialog appears.
IDE ExtensionsExtracting CodeWarrior configuration details
CodeWarrior Development Studio Common Features Guide, Rev. 10.x, 01/2016Freescale Semiconductor, Inc. 39
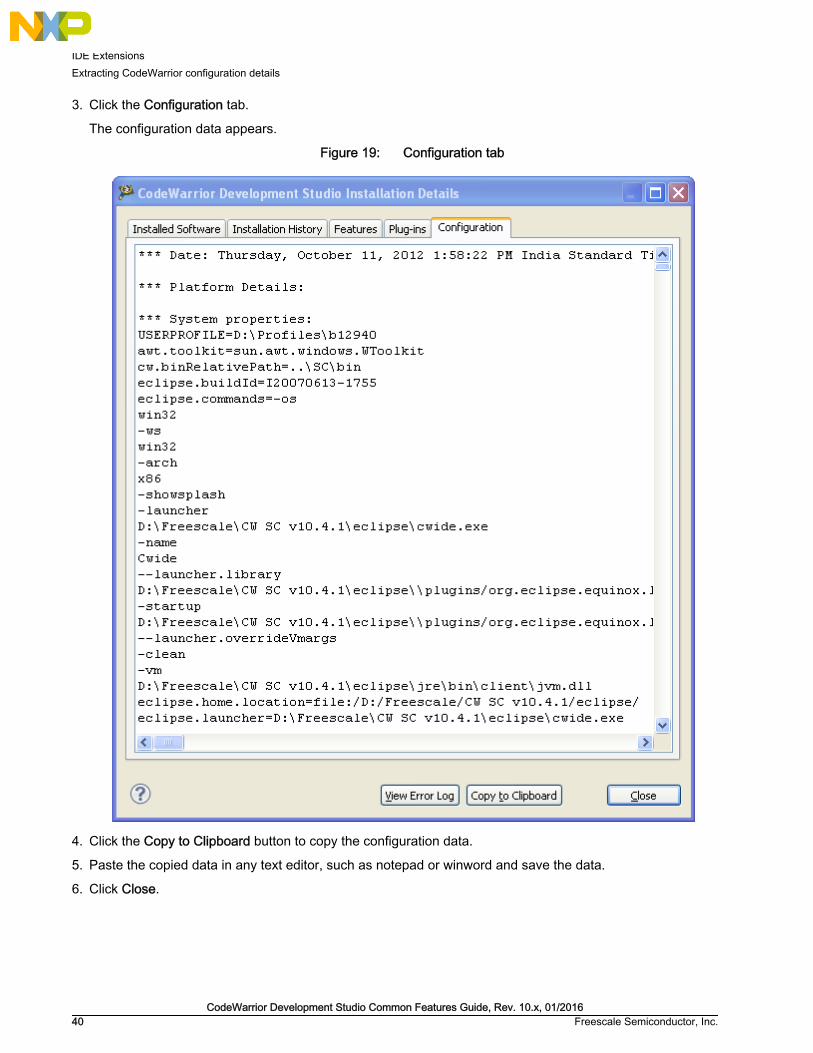
3. Click the Configuration tab.
The configuration data appears.
Figure 19: Configuration tab
4. Click the Copy to Clipboard button to copy the configuration data.
5. Paste the copied data in any text editor, such as notepad or winword and save the data.
6. Click Close.
IDE ExtensionsExtracting CodeWarrior configuration details
CodeWarrior Development Studio Common Features Guide, Rev. 10.x, 01/201640 Freescale Semiconductor, Inc.

2.9 Find and Open FileThe Find and Open File dialog lets you open a selected path or file in the Editor area of the CodeWarrior IDE.
To open particular path or file in the Editor area:
1. Choose File > Open Path from the IDE menu bar.
The Find and Open File dialog appears.
Figure 20: Find and Open File dialog
2. Enter a file descriptor. The file descriptor can be a simple file name, a partial path or a full path. The pathdelimiters can also be different from that of the native platform delimiters. For example, you can use "/" ona Windows host instead of "\".
3. Click OK.
Eclipse IDE performs the following actions:
• Scans for a matching file descriptor in all the open editor windows. If a match is found, the IDE activates theopen editor window in the Editor area.
• If no open editor windows match the specified file descriptor, IDE searches for a matching file in theaccessible paths of the current project. If a match is found, IDE opens the file in a new editor window in theEditor area. If the file is not found, IDE generate a beep sound.
The Open Path feature is also invoked when a file name is selected in an #includedirective in a source file. In such a case, the IDE opens the file in the Editor area withoutdisplaying the Find and Open File dialog.
NOTE
2.10 Importing filesYou can import files into the workbench either by drag and drop or by using the Import wizard.
This section includes:
• CodeWarrior drag and drop support on page 42
• Using Import wizard on page 42
IDE ExtensionsFind and Open File
CodeWarrior Development Studio Common Features Guide, Rev. 10.x, 01/2016Freescale Semiconductor, Inc. 41

2.10.1 CodeWarrior drag and drop supportThis topic explains the advantages of CodeWarrior drag and drop support feature.
The CodeWarrior drag and drop support extends the following features to the CodeWarrior IDE.
• Allows user to drop different files and folders to the Workbench window.
• Allows user to drop multiple files and folders simultaneously and handle them properly in a sequence.
• Supports files and directories created by the earlier versions of CodeWarrior ( .mcp files).
A classic project file has the .mcp extension.
NOTE
• Resolves potential handling ownership conflict between different components over the dropped objects.
• Automatically imports all projects found in a folder and its subfolders into the workspace. The projects areopened from their location, not copied into the workspace.
For example, to create a link to a project existing in a different workspace from the current workspace:
1. Open the workspace using Windows Explorer (In Linux, you can open the workspace using Shell).
2. Drag the project folder over the CodeWarrior IDE.
The CodeWarrior IDE effectively handles the files and folders dropped to the Workbench. A link to the existingproject is created in the CodeWarrior Projects view.
2.10.2 Using Import wizardThis topic explains the steps required to import an exisitng project into workspace using a sample project asan example.
This section explains:
• Import existing project on page 42
• Import example project on page 45
2.10.2.1 Import existing projectThe Import wizard lets you import existing project into the workspace.
To import existing project:
1. Choose File > Import from the IDE menu bar.
The Import wizard appears.
IDE ExtensionsImporting files
CodeWarrior Development Studio Common Features Guide, Rev. 10.x, 01/201642 Freescale Semiconductor, Inc.

Figure 21: Import wizard
2. Choose General > Existing Project into Workspace.
3. Click Next.
The Import Project page appears.
IDE ExtensionsImporting files
CodeWarrior Development Studio Common Features Guide, Rev. 10.x, 01/2016Freescale Semiconductor, Inc. 43

Figure 22: Import Projects page
4. Select Select root directory or Select archive file option and click the associated Browse to locate thedirectory or file containing the projects.
The list of existing projects appear under the Project group.
5. Under Projects , select the project or projects which you would like to import.
When there are projects with the same name in the list, only one of them is selected bydefault and allow you to change the selections as needed. If any error occurs during theimport, the project list is updated and all the projects that were already imported aredisabled.
NOTE
IDE ExtensionsImporting files
CodeWarrior Development Studio Common Features Guide, Rev. 10.x, 01/201644 Freescale Semiconductor, Inc.

You may select Copy projects into workspace checkbox to copy the project intoworkspace. You may also select Add Project to working sets checkbox to include theproject in working sets.
NOTE
6. Click Finish.
2.10.2.2 Import example projectThe Import wizard lets you import example project into the workspace.
To import an example project:
1. Choose File > Import from the IDE menu bar.
The Import wizard appears.
Figure 23: Import wizard
2. Choose CodeWarrior > Example Project.
3. Click Next.
IDE ExtensionsImporting files
CodeWarrior Development Studio Common Features Guide, Rev. 10.x, 01/2016Freescale Semiconductor, Inc. 45

The Import Projects page appears.
Figure 24: Import Projects page
4. Select the Select root directory or the Select archive file option and click the associated Browse to locatethe directory or file containing the projects.
The list of existing projects appear under the Projects group.
5. Under Projects, select the project or projects which you would like to import.
When there are projects with the same name in the list, only one of them is selected bydefault and allow you to change the selections as needed. If any error occurs during theimport, the project list is updated and all the projects that were already imported aredisabled.
NOTE
IDE ExtensionsImporting files
CodeWarrior Development Studio Common Features Guide, Rev. 10.x, 01/201646 Freescale Semiconductor, Inc.

You may select Copy projects into workspace checkbox to copy the project intoworkspace. You may also select Add Project to working sets checkbox to include theproject in working sets.
NOTE
6. Click Finish.
2.11 Key mappingsCodeWarrior Eclipse IDE accepts keyboard shortcuts, or key bindings , for frequently used operations.
At any time, you can obtain a list of available key bindings using Key Assist. To open the Key Assist view, chooseHelp > Key Assist.
Alternatively, press Ctrl+Shift+L keys to display a list of available key bindings in Eclipse.
Key bindings can vary based on the current context of Eclipse, platform and locale. Thecurrent platform and locale is determined when Eclipse starts, and does not vary overthe course of an Eclipse instance.
NOTE
The following table lists and defines the key mappings for Classic IDE and Eclipse IDE.
Table 2: Key Mappings - Classic IDE and Eclipse IDE
Behaviour Classic IDE Eclipse IDE
New Ctrl + Shift + N Ctrl + N
Open Open Path (Eclipse IDE) Ctrl + O Ctrl + Shift + A
Close Ctrl + W Ctrl + F4
Close All Ctrl + Shift + W Ctrl + Shift + W Ctrl + Shift + F4
Save Ctrl + S Ctrl + S
Save All Ctrl + Shift + S Ctrl + Shift + S
Print Ctrl + P Ctrl + P
Undo Ctrl + Z Alt + Backspace Ctrl + Z
Redo Ctrl + Shift + Z Ctrl + Y
Cut Ctrl + X Shift + Delete Ctrl + X Shift + Delete
Copy Ctrl + C Ctrl + Insert Ctrl + C Ctrl + Insert
Paste Ctrl + V Shift + Insert Ctrl + V Shift + Insert
Delete Del Del
Select All Ctrl + A Ctrl + A
Find Next F3 Ctrl + K
Find Previous Shift + F3 Ctrl + Shift + K
Table continues on the next page...
IDE ExtensionsKey mappings
CodeWarrior Development Studio Common Features Guide, Rev. 10.x, 01/2016Freescale Semiconductor, Inc. 47

Table 2: Key Mappings - Classic IDE and Eclipse IDE (continued)
Behaviour Classic IDE Eclipse IDE
Go to Line Ctrl + G Ctrl + L
Debug F5 F11
Run Ctrl + F5 Ctrl + F11
Step Over F10 F6
Step Into F11 F5
Step Out Step Return (Eclipse IDE) Shift + F11 F7
Enable/Disable Breakpoint ToggleBreakpoint (Eclipse IDE)
Ctrl + F9 Ctrl + Shift + B
Make Build All (Eclipse IDE) F7 Ctrl + B
Move Line Up Up Alt + Up
Move Line Down Down Alt + Down
2.12 Linker Command File navigationThe linker command file (LCF) navigation feature allows you to click on strings containing path names in theCodeWarrior Editor and navigate to the specified file.
The CodeWarrior Editor recognizes the files with .lcf , .cmd , and .l3k fileextensions as LCF files. A file with .txt file extension is not recognized as a LCF file.
NOTE
To navigate to a LCF file:
1. Open the LCF file in the text editor.
IDE ExtensionsLinker Command File navigation
CodeWarrior Development Studio Common Features Guide, Rev. 10.x, 01/201648 Freescale Semiconductor, Inc.

Figure 25: LCF file
2. In the LCF file, right-click a line that refers to a text file.
The shortcut menu appears.
3. Choose Open Reference from the shortcut menu.
IDE ExtensionsLinker Command File navigation
CodeWarrior Development Studio Common Features Guide, Rev. 10.x, 01/2016Freescale Semiconductor, Inc. 49

Figure 26: Open Reference
The referenced text file opens in the Editor window.
2.13 Multiple compiler supportThis feature helps you switch between multiple versions of a toolchain.
When you acquire a new version of the command line tools associated with an integration plug-in, multiplecompiler feature allows you to add the new version into the list of available toolchain versions.
To switch between multiple versions of a toolchain:
1. In the CodeWarrior Projects view, right-click the project, and choose Properties from the shortcut menu.
The Properties for <project> dialog appears.
2. Choose C/C++ Build > Settings in the left pane of the Properties for <project> dialog.
The C/C++ build settings appear in the right pane of the Properties for <project> dialog.
3. Click the Build Tool Versions tab.
The build tool version settings appear in the Build Tool Versions pane.
IDE ExtensionsMultiple compiler support
CodeWarrior Development Studio Common Features Guide, Rev. 10.x, 01/201650 Freescale Semiconductor, Inc.

Figure 27: Properties for <Project> dialog
The following table lists and defines the Build Tool Versions pane controls.
Table 3: Build Tool Versions pane controls
Control Description
Build Tool Versions table Lists multiple toolchain versions.
Add button Adds a new toolchain version.
Edit button Edits the currently selected toolchain version.
Delete button Deletes a toolchain version.
Set as Default button Sets the currently selected toolchain versions asdefault toolchain version for building projects.
Restore Defaults button Restores the default toolchain version.
The default toolchain version is highlighted in bold letters in the Build Tool Versionstable.
NOTE
4. Click Apply.
5. Click OK.
2.14 New External FileThe CodeWarrior Eclipse IDE supports creating, opening, and saving files that are located outside the currentworkspace.
To create a non-project file:
1. Click File > New > Other .
IDE ExtensionsNew External File
CodeWarrior Development Studio Common Features Guide, Rev. 10.x, 01/2016Freescale Semiconductor, Inc. 51

The New wizard appears.
Figure 28: New wizard - Select a wizard page
2. Choose General > New External File.
3. Click Next.
The New External File page appears.
4. Specify the path and filename.
5. Click Finish.
IDE opens the file in a new editor window in the Editor view.
2.15 Exporting and importing macrosYou can import and export specific macros defined for projects files from one project to another in theCodeWarrior IDE.
This saves the efforts in defining macros for projects with a similar file system structure.
• Add macro to a project on page 53
IDE ExtensionsExporting and importing macros
CodeWarrior Development Studio Common Features Guide, Rev. 10.x, 01/201652 Freescale Semiconductor, Inc.

• Export macros for a project on page 53
• Import macros into a new project on page 54
2.15.1 Add macro to a projectThis topic explains the steps required to add a macro to the project.
1. Right-click the project in the CodeWarrior Projects view.
The Properties for projectname dialog box appears.
2. Select C/C++ Build > Settings in the left panel.
3. Select target Compiler > Preprocessor > Macros.
4. Click Add in the Defined Preprocessor Macros field.
The Enter Value dialog box appears.
5. Define the required macro and click OK
Figure 29: Add macro to project file
2.15.2 Export macros for a projectThis topic explains how to export a macro in a project.
1. Right-click the project in the CodeWarrior Projects view.
The Properties for projectname dialog box appears.
2. Select C/C++ Build > Settings in the left panel.
3. Select target Compiler > Preprocessor > Macros.
4. Click Export Settings.
The Export Settings dialog box appears.
5. Select the file where you want to export the defined macros and click OK
IDE ExtensionsExporting and importing macros
CodeWarrior Development Studio Common Features Guide, Rev. 10.x, 01/2016Freescale Semiconductor, Inc. 53
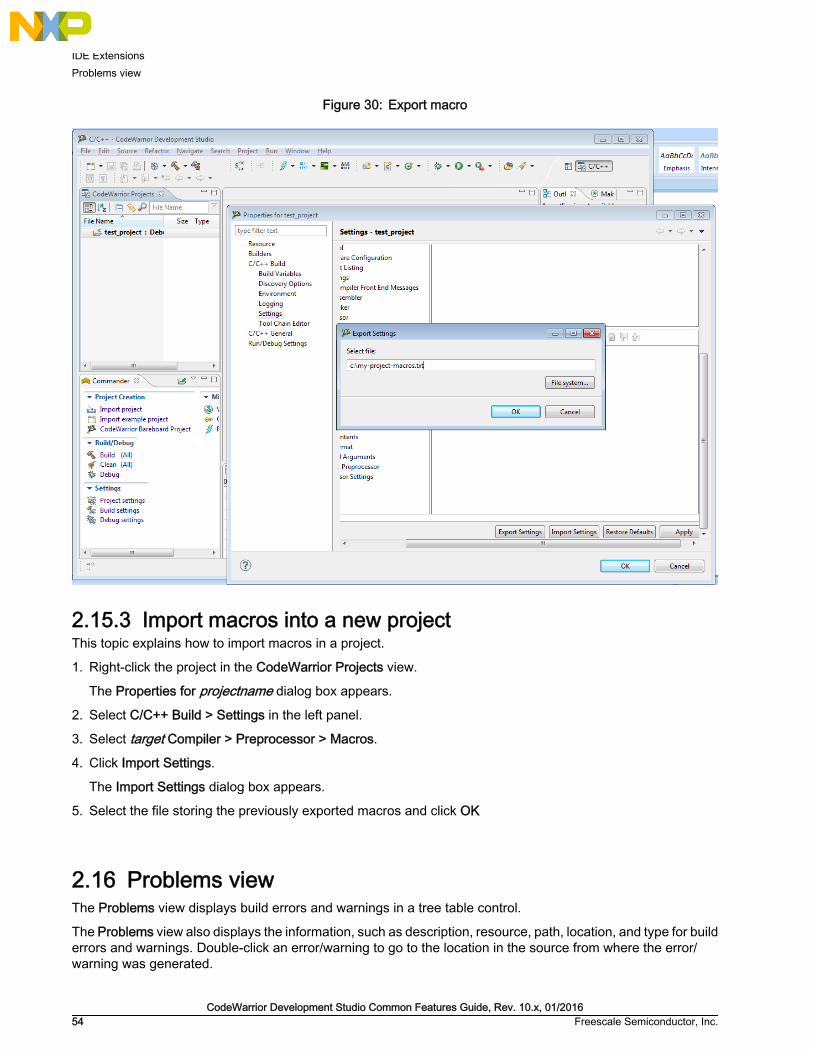
Figure 30: Export macro
2.15.3 Import macros into a new projectThis topic explains how to import macros in a project.
1. Right-click the project in the CodeWarrior Projects view.
The Properties for projectname dialog box appears.
2. Select C/C++ Build > Settings in the left panel.
3. Select target Compiler > Preprocessor > Macros.
4. Click Import Settings.
The Import Settings dialog box appears.
5. Select the file storing the previously exported macros and click OK
2.16 Problems viewThe Problems view displays build errors and warnings in a tree table control.
The Problems view also displays the information, such as description, resource, path, location, and type for builderrors and warnings. Double-click an error/warning to go to the location in the source from where the error/warning was generated.
IDE ExtensionsProblems view
CodeWarrior Development Studio Common Features Guide, Rev. 10.x, 01/201654 Freescale Semiconductor, Inc.

Figure 31: Problems view
Clicking the Toggle visibility of the details pane button in the Problems view displays the Details pane. The Detailspane displays full description of the selected error/warning.
Figure 32: Problems view - Details pane
2.17 Referenced projectsReferenced projects allow you to create build dependencies between CodeWarrior projects.
If project A is set up as a referenced project for project B, then project A will be built before each project B build.Referenced projects are automatically imported and opened when a project is imported in the workspace, soreferenced projects can be used to automatically populate the workspace with a set of projects.
This topic explains:
• Create Referenced project on page 55
• Displaying referenced projects in CodeWarrior Projects view on page 57
• Automatic linking with referenced project build artifact on page 58
• Circular build dependencies on page 59
2.17.1 Create Referenced projectThis section lists the steps required to create a referenced project.
To create a referenced project B in project A, follow the steps given below:
IDE ExtensionsReferenced projects
CodeWarrior Development Studio Common Features Guide, Rev. 10.x, 01/2016Freescale Semiconductor, Inc. 55

1. Select and right-click the project in the CodeWarrior Projects view.
2. Choose Properties from the shortcut menu that appears.
The Properties dialog appears.
3. Select the C/C++ Build option on the left and click the References tab in the C/C++ Build properties pageon the right.
4. Select project B in the tree.Figure 33: C/C++ Build properties > References pane
5. Click OK to include Project B in Project A.
You can also create a project reference by dragging Project B onto Project A in theCodeWarrior Projects view.
NOTE
The following table lists various options available in the C/C++ Build > References page.
Table 4: C/C++ Build > References options
Option Description
Build referenced projects and buildconfigurations when building thisproject
If selected, enable building referenced projects and buildconfigurations while building project. This option is also available fromthe CodeWarrior Projects view, by right-clicking on the `ReferencedProjects' element.
Expand All Click to expand all referenced projects in the tree.
Table continues on the next page...
IDE ExtensionsReferenced projects
CodeWarrior Development Studio Common Features Guide, Rev. 10.x, 01/201656 Freescale Semiconductor, Inc.

Table 4: C/C++ Build > References options (continued)
Option Description
Collapse All Click to collapse all the referenced projects in the tree.
Move Up/Move Down Changes the referenced project build order. The first project shownwill be built first.
Edit Location Allows you to change the location of referenced project. The projectlocation is recorded automatically as a project-relative path, and canmake use of the project path variables to be portable across machines
Build Projects referencing this buildconfiguration
Causes projects that include the current project as a referenced projectto be included in the current build dependency, and be built when thecurrent project is built.
Severity level for missing referencesprojects build error makers
Allows you to select Error or Warning to display severity level formissing references.
Restore Defaults Restores default factory settings
Apply Saves your changes without closing the dialog.
OK Saves your changes and close the dialog.
Cancel Closes the dialog without saving.
2.17.2 Displaying referenced projects in CodeWarrior Projects viewThe CodeWarrior Projects view displays the referenced projects and highlights which build configuration isreferenced.
The following figure shows the Referenced Project in the CodeWarrior Projects view.
Figure 34: CodeWarrior Projects view > Referenced project
All the project references appear under a Referenced Projects folder, which only showsif the project contains at least one referenced project.
NOTE
IDE ExtensionsReferenced projects
CodeWarrior Development Studio Common Features Guide, Rev. 10.x, 01/2016Freescale Semiconductor, Inc. 57

The following table shows the shortcut menu commands available through the CodeWarrior Projects view:
Table 5: Referenced projects - Shortcut menu commands
Command Description
Include in Build It allows you to quickly toggle whether all referencedprojects and build configurations will be included in thebuild or not.
Open/Import Project It is available when the referenced project element isselected and is either closed or does not exist in theworkspace. The action imports and/or opens thereferenced project in the workspace.
Close Project It is available when the referenced project element isselected and is opened in the workspace. It allows youto close the referenced project in the workspace.
Edit Location Allows you to edit the location of the referencedproject.
Remove Referenced Project Allows you to delete the referenced project.
2.17.3 Automatic linking with referenced project build artifactA project can automatically include the build artifact of its referenced project in its linker input settings.
You can use the '${ReferencedConfigurationsOutput}' build variable as shown in figure below to link projectswith build artifacts. The '${ReferencedConfigurationsOutput}' build variable contains automatically the list of thereferenced projects build artifacts paths.
Figure 35: Referenced project - Add file path dialog
IDE ExtensionsReferenced projects
CodeWarrior Development Studio Common Features Guide, Rev. 10.x, 01/201658 Freescale Semiconductor, Inc.

2.17.4 Circular build dependenciesIf two projects depend on each other through referenced projects, a build error will be generated, sincecircular build references is not permissible by design.
If multiple projects need to be built at the same time, a single referenced project can be used for the firstdependency, and the second project can set the 'Projects referencing this build configuration' flag, so thatbuilding the first or second project will cause the other one to be built automatically. This also applies toreferenced build configuration for single or multiple projects.
For example, if two different build configurations (Debug and Release) of a single project need to be built nomatter which one of the two build configuration is active, the 'Debug' build configuration can reference the'Release' build configuration in the 'References' tab, and the 'Release' build configuration can have its Projectsreferencing this build configuration' flag set to 'true', so that both the 'Debug' and 'Release' build configurationswill be built together, no matter which one is active.
2.18 Target management via Remote System ExplorerThe Remote System Explorer provides data models and frameworks to configure and manage both targetand connection configurations.
Remote System Explorer operates with remote system entities. The CodeWarrior uses two types of remotesystems, target configuration and connection configuration, for describing Freescale hardware with respect todebug process. A target configuration defines initialization, and target parameters.
The configuration model for bareboard debug uses a target and a connection configuration that allows you todefine a single target configuration that can be referred by multiple connection configurations. Each suchconfiguration is implemented as Remote System host.
This section includes the following topics:
• Creating remote system on page 59
• Creating hardware or simulator connection configuration on page 62
• Creating hardware or simulator target configuration on page 63
• Creating TRK target configuration on page 67
• Remote Systems view on page 68
• Automatic project remote system setting cache on page 72
• Compatibility with older products on page 75
2.18.1 Creating remote systemYou can create a new connection to a remote system using the New wizard.
To create a remote system:
1. Click File > New > Other.
The New wizard appears.
IDE ExtensionsTarget management via Remote System Explorer
CodeWarrior Development Studio Common Features Guide, Rev. 10.x, 01/2016Freescale Semiconductor, Inc. 59

Figure 36: New wizard - Select a wizard page
2. Choose Remote System Explorer > Connection.
3. Click Next .
The New Connection page appears.
IDE ExtensionsTarget management via Remote System Explorer
CodeWarrior Development Studio Common Features Guide, Rev. 10.x, 01/201660 Freescale Semiconductor, Inc.

Figure 37: New Connection page
4. Expand CodeWarrior Bareboard Debugging and choose a remote target type.
A remote target type represents a particular type of remote system. The supported remote target types are:
• Hardware or Simulator Connection - Connection configuration for a hardware-based or simulatedsystem. For more information, see Creating hardware or simulator connection configuration on page62.
• Hardware or Simulator Target - Target configuration for a hardware-based or simulated target. For moreinformation, see Creating hardware or simulator target configuration on page 63.
• TRK Target - System configuration for a system running the TRK debug agent. For more information,see Creating TRK target configuration on page 67.
5. Click Next.
The new configuration settings appear. You need to specify configuration settings depending upon the remotetarget type chosen in the New Connection page.
6. Click Finish.
IDE ExtensionsTarget management via Remote System Explorer
CodeWarrior Development Studio Common Features Guide, Rev. 10.x, 01/2016Freescale Semiconductor, Inc. 61
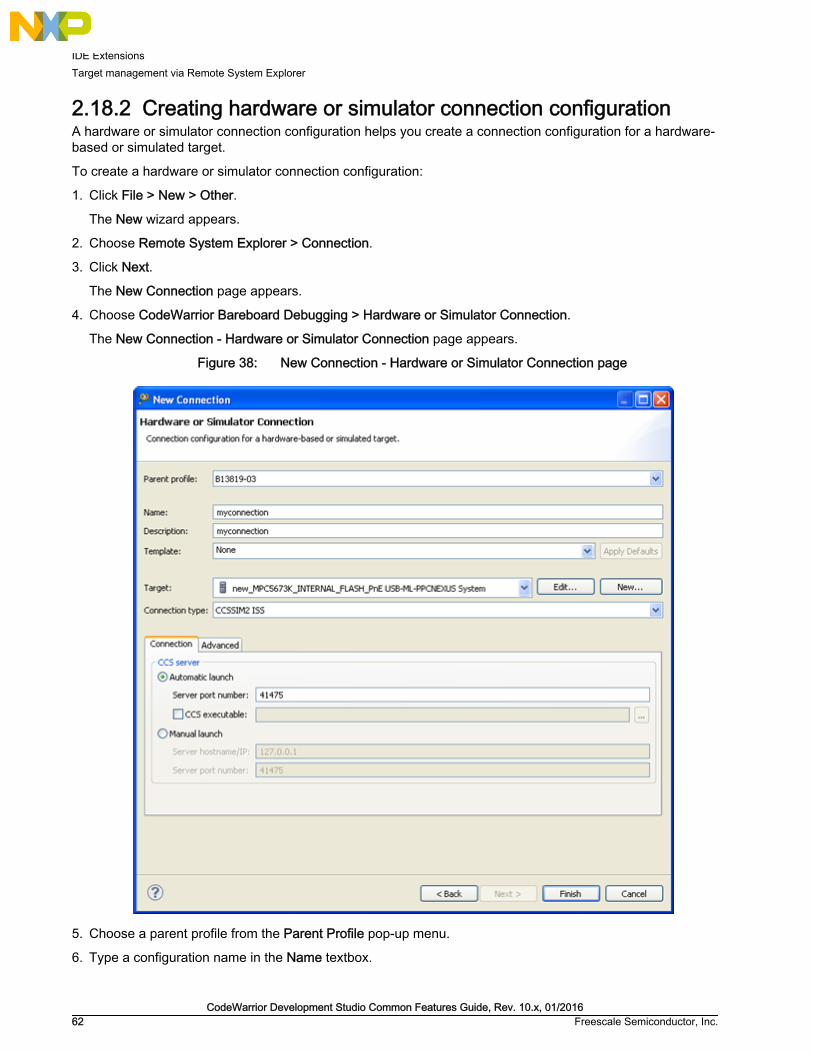
2.18.2 Creating hardware or simulator connection configurationA hardware or simulator connection configuration helps you create a connection configuration for a hardware-based or simulated target.
To create a hardware or simulator connection configuration:
1. Click File > New > Other.
The New wizard appears.
2. Choose Remote System Explorer > Connection.
3. Click Next.
The New Connection page appears.
4. Choose CodeWarrior Bareboard Debugging > Hardware or Simulator Connection.
The New Connection - Hardware or Simulator Connection page appears.
Figure 38: New Connection - Hardware or Simulator Connection page
5. Choose a parent profile from the Parent Profile pop-up menu.
6. Type a configuration name in the Name textbox.
IDE ExtensionsTarget management via Remote System Explorer
CodeWarrior Development Studio Common Features Guide, Rev. 10.x, 01/201662 Freescale Semiconductor, Inc.

7. Type connection description in the Description textbox.
8. Choose a remote system template from the Template pop-up menu. The remote system template is apredefined configuration fully supported by CodeWarrior debugger.
9. Choose None from the Template pop-up menu when the current remote system configuration does not useany reference template.
10.Click Apply Defaults to load settings from reference template in the current configuration.
11.Choose a target from the Target pop-up menu.
A target type is a CodeWarrior abstraction that represents the users target processor layout. This can be asimple processor or a set of processors as defined by a JTAG configuration file or a Power Architecture®device tree blob file.
12.Click Edit to add or remove target types.
13.Click New to create a new target configuration.
14.Choose a connection type from the Connection type pop-up menu.
• Choose CCSSIM2 ISS to specify setting for CodeWarrior Connection Server (CCS).
• Choose Ethernet TAP to specify settings for ethernet TAP connection.
• Choose USB TAP to specify settings for USB TAP connection.
15.Click Finish.
The hardware or simulator connection configuration appears in the Remote Systems view on page 68.
2.18.3 Creating hardware or simulator target configurationA hardware or simulator target configuration enables you to connect to your target via a direct hardwareconnection or simulate your target.
To create a bareboard or simulator remote system:
1. Click File > New > Other.
The New wizard appears.
2. Choose Remote System Explorer > Connection.
3. Click Next .
The New Connection page appears.
4. Choose CodeWarrior Bareboard Debugging > Hardware or Simulator Target.
The New Connection - Hardware or Simulator Target page appears.
IDE ExtensionsTarget management via Remote System Explorer
CodeWarrior Development Studio Common Features Guide, Rev. 10.x, 01/2016Freescale Semiconductor, Inc. 63
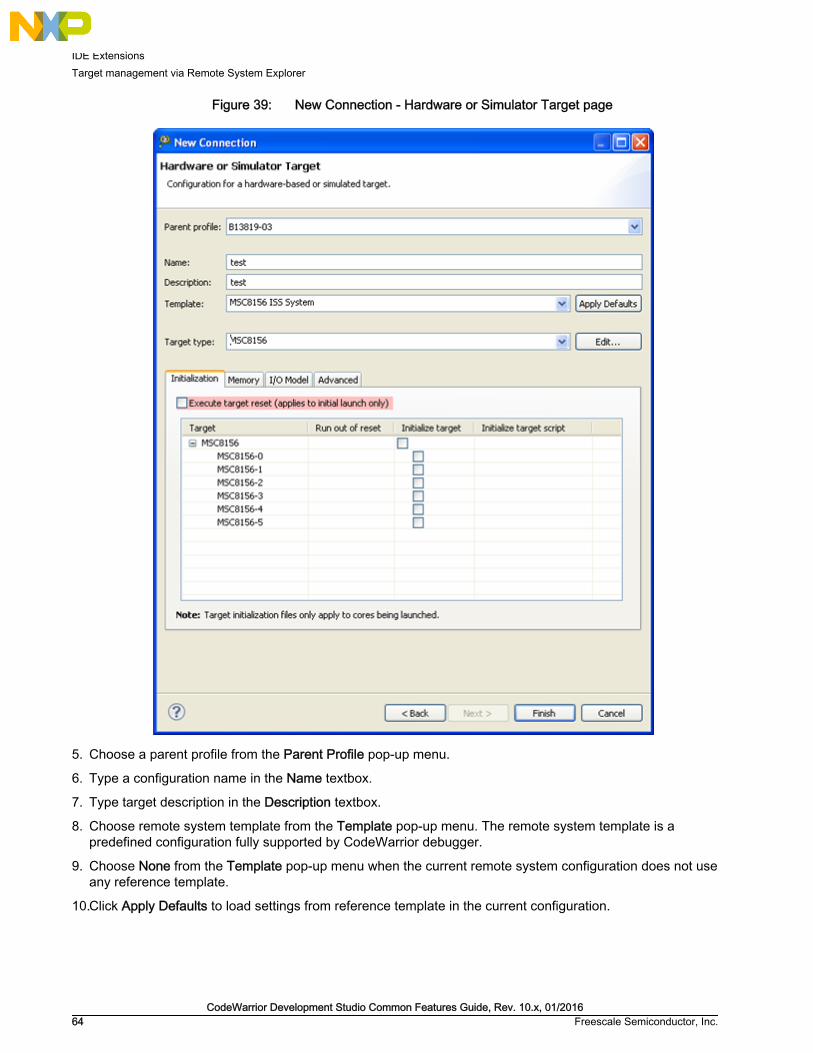
Figure 39: New Connection - Hardware or Simulator Target page
5. Choose a parent profile from the Parent Profile pop-up menu.
6. Type a configuration name in the Name textbox.
7. Type target description in the Description textbox.
8. Choose remote system template from the Template pop-up menu. The remote system template is apredefined configuration fully supported by CodeWarrior debugger.
9. Choose None from the Template pop-up menu when the current remote system configuration does not useany reference template.
10.Click Apply Defaults to load settings from reference template in the current configuration.
IDE ExtensionsTarget management via Remote System Explorer
CodeWarrior Development Studio Common Features Guide, Rev. 10.x, 01/201664 Freescale Semiconductor, Inc.

The differences between reference template and current configuration is highlighted.You can disable highlighting from Remote Systems view's pop-up menu. The color usedfor highlighting can be changed from global preferences.
NOTE
11.Choose a target configuration from the Target type pop-up menu.
A target type is a CodeWarrior abstraction that represents the user's target processor layout. This can be asimple processor or a set of processors as defined by a JTAG configuration file or a Power Architecture®device tree blob file.
12.Click Edit to edit the current target configuration.
13.Click New to create a new target configuration.
14.Click the Initialization tab.
The initialization settings page appears.
Figure 40: Hardware or Simulator Target page - Initialization pane
15.Specify the initialization settings to suit your needs.
16.Click the Memory tab.
The memory settings page appears.
IDE ExtensionsTarget management via Remote System Explorer
CodeWarrior Development Studio Common Features Guide, Rev. 10.x, 01/2016Freescale Semiconductor, Inc. 65

Figure 41: Hardware or Simulator Target page - Memory pane
17.Specify the target settings to suit your needs.
18.Click the I/O Model tab.
The I/O Model page appears.
Figure 42: Hardware or Simulator Target page - I/O Model pane
19.Specify the I/O model settings to suit your needs.
20.Click the Advanced tab.
The Advanced page appears.
IDE ExtensionsTarget management via Remote System Explorer
CodeWarrior Development Studio Common Features Guide, Rev. 10.x, 01/201666 Freescale Semiconductor, Inc.

Figure 43: Hardware or Simulator Target page - Advanced pane
21.Select the Target is emulated by Palladium checkbox if required.
22.Click Finish.
The hardware or simulator target appears in the Remote Systems view on page 68.
2.18.4 Creating TRK target configurationYou can create a target configuration for a target running the TRK debug agent.
This feature is not available in StarCore.
NOTE
To create a TRK target configuration:
1. Click File > New > Other.
The New wizard appears.
2. Choose Connection under the Remote System Explorer category.
3. Click Next.
The Select Remote System Type page appears.
4. Choose CodeWarrior Bareboard Debugging > TRK Target.
The TRK Target page appears.
5. Choose a parent profile from the Parent profile pop-up menu.
6. Type a configuration name in the Name textbox.
7. Type connection description in the Description textbox.
8. Choose a remote system template from the Template pop-up menu. The remote system template is a pre-defined configuration fully supported by CodeWarrior debugger.
9. Choose None from the Template pop-up menu when the current remote system configuration does not useany reference template.
10.Click Apply Defaults to load settings from reference template in the current configuration.
11.Choose a target type from the Target type pop-up menu or click Edit to import the target type.
12.Click the Initialization tab and specify the initialization settings to suit your needs.
13.Click the Memory tab and specify the memory configuration settings to suit your needs.
14.Click Finish.
The TRK target configuration appears in the Remote Systems view on page 68.
IDE ExtensionsTarget management via Remote System Explorer
CodeWarrior Development Studio Common Features Guide, Rev. 10.x, 01/2016Freescale Semiconductor, Inc. 67

2.18.5 Remote Systems viewThe Remote Systems view helps you view and modify remote system settings.
It displays various target and connection configurations. To open the Remote Systems view, choose Window >Show View > Remote Systems from the IDE menu bar.
Figure 44: Remote Systems view
2.18.5.1 Modifying target or connection configurationThe Remote System view allows you to modify settings for a target or connection.
To change target or connection settings:
1. Switch to the Remote Systems view.
2. Right-click a remote system name and choose Properties from the shortcut menu.
The Properties for <Remote System> dialog appears.
IDE ExtensionsTarget management via Remote System Explorer
CodeWarrior Development Studio Common Features Guide, Rev. 10.x, 01/201668 Freescale Semiconductor, Inc.

Figure 45: Properties for <target or connection> dialog
3. Change the settings in this page to suit your needs.
4. Click OK.
The changes are applied to the target.
2.18.5.2 Exporting target or connection configurationThe Remote Systems view allows you to export a target or connection to an external file.
To export a target or connection:
1. Switch to the Remote Systems view.
2. Right-click a remote system name and choose Export from the shortcut menu.
The Save As dialog appears.
3. Enter a file name in the File name textbox.
4. Click Save.
IDE ExtensionsTarget management via Remote System Explorer
CodeWarrior Development Studio Common Features Guide, Rev. 10.x, 01/2016Freescale Semiconductor, Inc. 69

2.18.5.3 Importing target or connection configurationThe Remote Systems view allows you to import a target or connection from an external file.
To import a target or connection:
1. Switch to the Remote Systems view.
2. Right-click in the view and choose Import from the shortcut menu.
The Open dialog appears.
3. Select a remote system file.
4. Click Open.
2.18.5.4 Apply to ProjectThe Apply to Project feature allows you to set the active target and component of a launch configuration.
To set the active target and component:
1. Switch to the Remote Systems view.
2. Right-click the host and choose Apply to Project from the shortcut menu.
A submenu with different projects and launch configurations appears.
Figure 46: Remote Systems - Apply to Project
3. Choose the item to apply the target selection in a project.
The projects items appear with a check mark to show if the item has the target selected.
4. Choose Apply To All to apply the target selection for all projects.
IDE ExtensionsTarget management via Remote System Explorer
CodeWarrior Development Studio Common Features Guide, Rev. 10.x, 01/201670 Freescale Semiconductor, Inc.

2.18.5.5 Apply to ConnectionThe Apply to Connection feature allows you to set a target configuration to a connection, without having toopen the Debug Configurations dialog.
To set a target configuration:
1. Switch to the Remote Systems view.
2. Right-click the host and choose Apply to Connection from the shortcut menu.
A submenu with different target configurations appears.
Figure 47: Remote Systems - Apply to Connection
3. Choose the item to apply the target configuration to the connection configuration.
The connection is selected with a check mark displayed.
2.18.5.6 Automatic removal of unreferenced remote systemWhen a CodeWarrior Remote System is no longer referenced by an open project, you may delete itautomatically.
To remove unreferenced remote systems:
1. Choose Window > Preferences > C/C++->Debug > CodeWarrior Debugger.
The CodeWarrior Debugger dialog appears.
IDE ExtensionsTarget management via Remote System Explorer
CodeWarrior Development Studio Common Features Guide, Rev. 10.x, 01/2016Freescale Semiconductor, Inc. 71
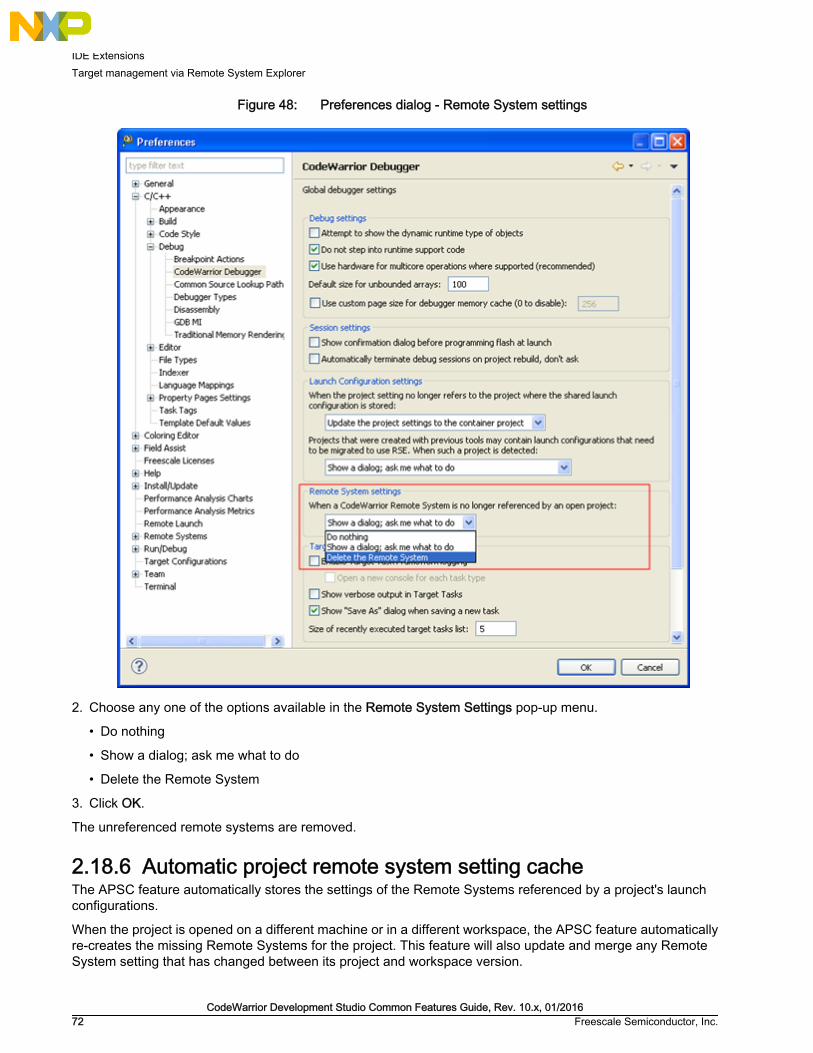
Figure 48: Preferences dialog - Remote System settings
2. Choose any one of the options available in the Remote System Settings pop-up menu.
• Do nothing
• Show a dialog; ask me what to do
• Delete the Remote System
3. Click OK.
The unreferenced remote systems are removed.
2.18.6 Automatic project remote system setting cacheThe APSC feature automatically stores the settings of the Remote Systems referenced by a project's launchconfigurations.
When the project is opened on a different machine or in a different workspace, the APSC feature automaticallyre-creates the missing Remote Systems for the project. This feature will also update and merge any RemoteSystem setting that has changed between its project and workspace version.
IDE ExtensionsTarget management via Remote System Explorer
CodeWarrior Development Studio Common Features Guide, Rev. 10.x, 01/201672 Freescale Semiconductor, Inc.

APSC feature allows you to update the Remote System tree when a project is open in the workspace and itsAPSC cache doesn't match the current Remote System settings. APSC provides following two operations:
• Remote System Missing on page 73
• Remote System Changed dialog on page 74
2.18.6.1 Remote System MissingThe Remote System Missing dialog appears when a project is open in the workspace and its APSC cachecontains Remote Systems that do not exist. In such case, you will be asked to create missing objects.
The following figure shows the Remote System Missing dialog.
Figure 49: Remote System Missing dialog
By default, the Remote System Missing dialog does not appear unless the RemoteSystem Project Cache workspace preferences are changed. Any missing host will beautomatically re-created.
NOTE
If you click Yes to create the missing Remote System, a new remote system will be created and initialized withthe cached settings.
If you click No, the Remote System Missing dialog will be closed.
You can click the Configure Project Cache Settings link to directly change the Remote System Project Cachepreferences to avoid automatically displaying this dialog in future.
This section includes the following topic:
• Remote system project cache preferences on page 73
2.18.6.1.1 Remote system project cache preferencesYou can set preferences for Remote System to handle differing Remote Systems and missing RemoteSystem.
Projects that reference Remote Systems contain an internal cache of the referenced Remote Systems. Whensuch projects are imported in the workspace, the Remote Systems in the cache may differ from the actualRemote Systems in the workspace or be missing entirely.
To configure merge settings:
1. Choose Window > Preferences.
The Preferences dialog appears.
IDE ExtensionsTarget management via Remote System Explorer
CodeWarrior Development Studio Common Features Guide, Rev. 10.x, 01/2016Freescale Semiconductor, Inc. 73

Figure 50: Preferences dialog - Remote Systems Project Cache settings
2. Expand the Remote System tree control from the left-pane of the Preferences dialog.
You can configure the way the dialog appears by changing the Remote System Project Cache page as shownin the above figure.
3. Select an option from how to handle differing RSE System.
4. Select an option from how to handle missing RSE Systems.
5. Choose an action from the When a RSE System is no longer referenced by an open project pop-up menu.
6. Click OK to apply changes.
You have set the preferences for Remote System to handle differing Remote Systems and missing RemoteSystems.
2.18.6.2 Remote System Changed dialogThe Remote System Changed dialog appears when a project is open in the workspace and its APSC cachecontains Remote Systems that have different settings to the ones in the existing Remote System tree. In such
IDE ExtensionsTarget management via Remote System Explorer
CodeWarrior Development Studio Common Features Guide, Rev. 10.x, 01/201674 Freescale Semiconductor, Inc.

case, you will be asked to update, discard or create a new set of objects for the cached Remote Systemsettings.
The Remote System Changed dialog provides following three options to resolve the version differences:
1. Replace the current version with the project version.
2. Discard the project version and update the project to use the current version.
3. Create a new Remote System for the project version.
4. Choose an appropriate option and click OK.
You can click the Configure Project Cache Settings link to directly change the Remote System Project Cachepreferences, to avoid automatically displaying this dialog in future. For details, see Remote system project cachepreferences on page 73.
You may keep the file containing the referenced remote systems available in the<Project_name>/Referenced Systems folder in a version control system forfuture use.
NOTE
2.18.7 Compatibility with older productsThe CodeWarrior connection configuration and target configuration have moved from the Launchingframework to the Remote System Explorer. This allows you to share the same connection and targetconfiguration among many launch configurations, and you can see all configurations for a Multicore system ata glance.
The following sections will show the facilities for migrating older projects to use RSE.
• Display of launch configurations needing migration on page 75
• Migrating launch configurations on page 78
2.18.7.1 Display of launch configurations needing migrationCodeWarrior allows you to display migration candidates as information, warnings, or errors in the Problemsview.
You can also set preference to ignore or automatically migrate the migration candidates.
IDE ExtensionsTarget management via Remote System Explorer
CodeWarrior Development Studio Common Features Guide, Rev. 10.x, 01/2016Freescale Semiconductor, Inc. 75

Figure 51: Migration candidates in Problems view
To configure migration preference:
1. Choose Window > Preferences .
The Preferences dialog appears.
2. Choose Run/Debug > Launching > Launch Configurations in the left pane of the Preferences dialog.
The launch configuration preferences appear in the right pane of the Preferences dialog.
IDE ExtensionsTarget management via Remote System Explorer
CodeWarrior Development Studio Common Features Guide, Rev. 10.x, 01/201676 Freescale Semiconductor, Inc.

Figure 52: Preferences dialog
3. Choose a value from the Available migrations can be shown in the workbench as problems or appliedautomatically pop-up menu.
• Ignore - Ignores the migration candidates.
• Show as information - Displays migration candidates as information in the Problems view.
• Show as warning - Displays migration candidates as warnings in the Problems view.
• Show as error - Displays migration candidates as errors in the Problems view.
• Apply automatically - Automatically migrates all migration candidates.
4. Click Apply.
5. Click OK.
IDE ExtensionsTarget management via Remote System Explorer
CodeWarrior Development Studio Common Features Guide, Rev. 10.x, 01/2016Freescale Semiconductor, Inc. 77

For projects created using Launching framework, a migration facility is provided.
2.18.7.2 Migrating launch configurationsFor projects created using Launching framework, a migration facility is provided. CodeWarrior allows you tomigrate launch configurations using two methods.
This section explains the following topics:
• Migration using Smart Migration on page 78
• Migration using Quick Fix on page 81
2.18.7.2.1 Migration using Smart MigrationThis section explains how to configure CodeWarrior for Smart Migration.
Perform the following steps to migrate using Smart Migration:
1. Choose Window > Preferences.
The Preferences dialog appears.
2. Choose C/C++ > Debug > CodeWarrior Debugger in the left pane of the Preferences dialog.
The CodeWarrior debugger preferences appear in the right pane of the Preferences dialog.
IDE ExtensionsTarget management via Remote System Explorer
CodeWarrior Development Studio Common Features Guide, Rev. 10.x, 01/201678 Freescale Semiconductor, Inc.

Figure 53: Configuring Smart Migration
3. Choose a migration option from the available pop-up menu.
• Do nothing - Launches configuration not migrated, and no warning is displayed.
• Show a dialog; ask me what to do - Displays a dialog to select a migration option.
• Perform Smart Migration, don't reuse existing systems - Automatically migrates launch configurationswithout using existing Remote System.
• Perform Smart Migration, reuse existing system if possible - Automatically migrates launchconfigurations using existing remote systems (if possible).
4. Click Apply.
5. Click OK.
Now, when you open a project that was created using Launching framework, the CodeWarrior launches theSmart Migration utility ( Figure 54. Launch Configuration Migration using Smart Migration on page 80) tomigrate all migration candidates.
To migrate using Smart Migration
IDE ExtensionsTarget management via Remote System Explorer
CodeWarrior Development Studio Common Features Guide, Rev. 10.x, 01/2016Freescale Semiconductor, Inc. 79

1. Open the project in CodeWarrior.
The Launch Configuration Migration to RSE Required dialog appears.
Figure 54: Launch Configuration Migration using Smart Migration
2. Select the Yes, Perform a Smart Migration now option.
3. Select the Re-use existing RSE system configuration if possible checkbox to reuse existing RemoteSystem configurations. Otherwise, Smart Migration migrates launch configurations without re-usingexisting Remote System configurations.
Selecting the No, ignore the problem for now option stops the migration process. Youcan still migrate launch configuration using Quick Fix or by directly editing the launchconfigurations.
NOTE
4. Select the Do this every time; don't show this dialog again checkbox to save your selection as generalpreference.
5. Click OK.
The Migrate Launch Configuration for RSE dialog appears.
IDE ExtensionsTarget management via Remote System Explorer
CodeWarrior Development Studio Common Features Guide, Rev. 10.x, 01/201680 Freescale Semiconductor, Inc.

Figure 55: Migrate Launch Configuration for RSE dialog
6. Specify a name for the launch configuration in the Create new RSE system named: textbox.
7. Click OK.
2.18.7.2.2 Migration using Quick FixThis section explains how to migrate using Quick Fix.
To migrate a launch configuration using Quick Fix:
1. Select a migration candidate in the Problems view.
2. Right-click and choose Quick Fix from the shortcut menu.
The Quick Fix dialog appears.
IDE ExtensionsTarget management via Remote System Explorer
CodeWarrior Development Studio Common Features Guide, Rev. 10.x, 01/2016Freescale Semiconductor, Inc. 81

Figure 56: Quick Fix dialog
3. Select a fix from the Select a Fix list box.
• Update launch configuration(s) in the same project to use a shared Remote System configuration -Assigns the selected remote system to all launch configurations from a single project.
• Update launch configuration(s) to use a shared Remote System configuration - Assigns the selectedremote system to all launch configurations from workspace.
• Migrate the launch configuration to be compatible with current tooling - Lets you to choose remotesystem for each selected launch configuration.
4. Select launch configurations to be migrated from the Problems table.
5. Click Finish.
The Migrate Launch Configuration for RSE dialog appears.
IDE ExtensionsTarget management via Remote System Explorer
CodeWarrior Development Studio Common Features Guide, Rev. 10.x, 01/201682 Freescale Semiconductor, Inc.

Figure 57: Migrate Launch Configuration for RSE dialog
6. Select a remote system setting.
• Select the Use existing RSE system option and choose an existing remote system from the pop-upmenu.
Remote systems compatible with the chosen launch configuration are only listed in thepop-up menu.
NOTE
• Select Create new RSE system named to create a new remote system by the specified name in thetextbox.
7. Click OK.
Alternatively, You can invoke the launch configuration migration dialog using the Preferences dialog:
1. Choose Window > Preferences .
The Preferences dialog appears.
2. Choose Run/Debug > Launching > Launch Configurations in the left pane of the Preferences dialog.
The launch configuration preferences appear in the right pane of the Preferences dialog.
IDE ExtensionsTarget management via Remote System Explorer
CodeWarrior Development Studio Common Features Guide, Rev. 10.x, 01/2016Freescale Semiconductor, Inc. 83

Figure 58: Preferences dialog
3. Click Migrate.
The Select Launch Configurations dialog appears.
IDE ExtensionsTarget management via Remote System Explorer
CodeWarrior Development Studio Common Features Guide, Rev. 10.x, 01/201684 Freescale Semiconductor, Inc.

Figure 59: Select Launch Configurations dialog
4. Select the launch configurations to migrate.
5. Click OK.
The Migrate Launch Configuration for RSE dialog ( Figure 57. Migrate Launch Configuration for RSE dialogon page 83) appears.
6. Select a remote system setting.
• Select the Use existing RSE system option to choose an existing remote system from the pop-up menu.
• Select Create new RSE system named to create a new remote system by the specified name in thetextbox.
7. Click OK.
2.19 Viewing CodeWarrior plug-insThis topic explains how to view the currently installed CodeWarrior features and the associated plug-ins.
1. Choose Help > About Freescale CodeWarrior from the IDE menu bar.
The About CodeWarrior Development Studio dialog appears.
IDE ExtensionsViewing CodeWarrior plug-ins
CodeWarrior Development Studio Common Features Guide, Rev. 10.x, 01/2016Freescale Semiconductor, Inc. 85

Figure 60: About CodeWarrior Development Studio dialog
2. Click the Installation Details button.
The CodeWarrior Development Studio Installation Details dialog appears.
3. Click the Features tab.
IDE ExtensionsViewing CodeWarrior plug-ins
CodeWarrior Development Studio Common Features Guide, Rev. 10.x, 01/201686 Freescale Semiconductor, Inc.

Figure 61: Features tab
4. Select a feature and click the Plug-in Details button to view the list of plug-ins associated with the selectedfeature.
For example, if you select the Eclipse TM Project feature and click the Plug-in Details button, the FeaturePlug-ins dialog containing the list of plug-ins associated with the Eclipse TM Project feature appears.
IDE ExtensionsViewing CodeWarrior plug-ins
CodeWarrior Development Studio Common Features Guide, Rev. 10.x, 01/2016Freescale Semiconductor, Inc. 87

Figure 62: Feature Plug-ins dialog
2.20 Editing cwide-env fileThe cwide-env file allows you to customize the list of environment variables of the java process that is createdby these tools to run the Eclipse IDE.
The cwide-env file is a file that is read by the cwide.exe, cwidec.exe, and ecd.exe tools.
The format of the cwide-env file follows the syntax as shown below.
<environment variable name>= <command> <value> ;
IDE ExtensionsEditing cwide-env file
CodeWarrior Development Studio Common Features Guide, Rev. 10.x, 01/201688 Freescale Semiconductor, Inc.

where
• <environment variable name> represents the name of the environment variable that you want to customize.
• <command> represents the command that you can use on the environment variable. Following options areavailable:
• -add - Adds the environment variable to the list, or erase the value of an existing variable.
• -remove - Removes the environment variable from the list.
• -append - Appends the value to the existing environment variable content.
• -prepend - Prepends the value to the existing environment variable content.
• <value> represents the value of the environment variable.
The expression can contain macros of the syntax %VAR%, which will be expanded before the environment variableis set.
The cwide-env file can also include other files to be passed as cwide-env files by adding a line with the followingsyntax.
-include <file name>
The changes to the environment variable list only affect the java process created by thecwide.exe, cwidec.exe, and ecd.exe tools.
NOTE
The content of a sample cwide-env file is shown below.
PATH= -prepend %CD%../MCU/bin;LM_LICENSE_FILE= -prepend %CD%../MCU/license.dat;CW_DE_SWITCHES= -prepend -ORBthreadPerConnectionPolicy 0 -ORBconnectionWatchImmediate 1 -ORBthreadPoolWatchConnection 5MCU_ProductDir= -add %CD%../MCUMCU_TOOLS_HOME= -add %CD%../MCUPA_TOOLS_HOME= -add %CD%../MCUCW_SA_HOME= -add %CD%../MCU/morpho_sa/sasdk/data/fsl.configs.sa.searchpathFLEXLM_BATCH= -add 1CROSS_TOOLS_HOME= -add %CD%../Cross_ToolsARM_GNU_TOOLS_HOME= -add %CD%../Cross_Tools/arm-none-eabi-gcc-4_7_3
2.21 Handling message alertsThis topic explains what are alert messages and how to handle them in CodeWarrior.
The message boxes with Yes/No or OK/Cancel buttons display the Do not Show this dialog again checkbox.This checkbox if selected lets CodeWarrior automatically execute your saved choice, without displaying themessage box next time. If you do not select the checkbox, the message box appears again next time.
For example, if the processor is in the Secure Debug mode and if the unlock key is not provided, then a pop-upmessage appears requesting the unlock key. If you enter the unlock key correctly, and select the Do not Showthis dialog again checkbox, the next time when unlock is needed, the key will be automatically provided withoutdisplaying the pop-up message. This is also applicable for the message boxes which do not require user input.For example, in the CodeWarrior Alert message box, if you select the Remember my choice and don't show thisdialog checkbox and click Yes, next time CodeWarrior will automatically take input as Yes, without displayingthe message box. And if you select the checkbox and click No, CodeWarrior will take input as No next time.
IDE ExtensionsHandling message alerts
CodeWarrior Development Studio Common Features Guide, Rev. 10.x, 01/2016Freescale Semiconductor, Inc. 89

Figure 63: CodeWarrior Alert message box
To rest the settings of such message boxes, that is to display the previously hidden message boxes whenneeded, perform the following steps.
1. Choose Window> Preferences to open the Preferences dialog.
2. Select C/C++ in the left pane.
3. Click the Clear button in the C/C++ dialogs group.Figure 64: Preferences dialog
4. Click Apply to save the settings.
5. Click OK to close the Preferences dialog.
This will clear all 'do not show again' settings and display all hidden message or dialogs again.
IDE ExtensionsHandling message alerts
CodeWarrior Development Studio Common Features Guide, Rev. 10.x, 01/201690 Freescale Semiconductor, Inc.

Chapter 3DebuggerThis chapter explains how to work with the debugger to control program execution.
This chapter describes the following topics.
• About debugger on page 92
• Breakpoints on page 92
• Build while debugging on page 110
• Cache view on page 111
• CodeWarrior debugger settings on page 116
• Core index indicators in homogeneous multicore environment on page 118
• Debug perspective on page 120
• Debug view on page 121
• Disassembly view on page 125
• Environment variables in launch configuration on page 126
• Flash programmer on page 127
• Flash File to Target on page 137
• Hardware diagnostics on page 139
• Import/Export/Fill memory on page 146
• Launch group on page 153
• Load multiple binaries on page 157
• Memory view on page 159
• Memory Browser view on page 167
• Memory Management Unit configurator on page 168
• Multicore debugging on page 183
• Multicore Groups on page 185
• Multicore reset on page 192
• Path mappings on page 195
• Redirecting standard output streams to socket on page 201
• Refreshing data during runtime on page 203
• Registers view on page 204
• Register Details view on page 209
• Remote launch on page 214
• Stack crawls on page 216
• Symbolics on page 219
• System Browser view on page 220
Debugger
CodeWarrior Development Studio Common Features Guide, Rev. 10.x, 01/2016Freescale Semiconductor, Inc. 91

• Target connection lost on page 222
• Target initialization files on page 223
• Target Tasks view on page 225
• Variables on page 226
• Watchpoints on page 231
3.1 About debuggerA debugger controls program execution and shows the internal operation of a computer program.
You can use the debugger to find problems while the program executes and observe how a program usesmemory to complete tasks.
These tasks can be performed using the CodeWarrior debugger:
• attach to a running process,
• manipulate the contents of cache, registers, and memory,
• change the program-counter (PC) value,
• execute debugger commands from a command line interface,
• connect to target hardware or simulators,
• render the same data in different formats or byte ordering,
• perform hardware diagnostics,
• program the flash memory,
• manipulate target memory, and
• configure target-hardware subsystems.
3.2 BreakpointsYou use a breakpoint to halt program execution on a particular line of source code.
Once execution halts, you can examine your program's current state and check register and variable values.You can also change these values and alter the flow of normal program execution. Setting breakpoints helpsyou debug your program and verify its efficiency.
The types of breakpoints are:
• Regular - Halts the program execution.
• Conditional - Halts the program execution when a specified condition is met.
• Special - Halts the program execution and then removes the breakpoint that caused the halt.
Breakpoints have enabled and disabled states. The following table defines these states.
DebuggerAbout debugger
CodeWarrior Development Studio Common Features Guide, Rev. 10.x, 01/201692 Freescale Semiconductor, Inc.

Table 6: Breakpoint states
State Icon Description
Enabled Indicates that the breakpoint is currently enabled. The debugger haltsthe program execution at an enabled breakpoint. Click the icon to disablethe breakpoint.
Disabled Indicates that the breakpoint is currently disabled. The debugger doesnot halt program execution at a disabled breakpoint. Click the icon toenable the breakpoint.
This section explains:
• Breakpoints view on page 93
• Breakpoint annotations on page 94
• Regular breakpoints on page 94
• Special breakpoints on page 96
• Breakpoint persistence on page 97
• Breakpoint preferences on page 97
• Working with breakpoints on page 99
• Breakpoint actions on page 105
• Selecting breakpoint template on page 109
3.2.1 Breakpoints viewThe Breakpoints view lists all the breakpoints set in the workbench projects.
This view also allows breakpoints to be grouped by type, project, file, or working sets, and supports nestedgroupings. If you double-click a breakpoint displayed by this view, the source code editor displays the sourcecode statement on which this breakpoint is set.
Choose Window > Show View > Breakpoints from the IDE menu bar to open the Breakpoints view.
Alternatively, press the Alt+Shift+Q, B key combination to open the Breakpoints view.
TIP
Figure 65: Breakpoints view
DebuggerBreakpoints
CodeWarrior Development Studio Common Features Guide, Rev. 10.x, 01/2016Freescale Semiconductor, Inc. 93

3.2.2 Breakpoint annotationsThis CodeWarrior feature allows you to change editor breakpoint annotations.
To change breakpoint annotations:
1. Choose Window > Preferences .
The Preferences dialog appears.
2. Choose General > Editors > Text Editors > Annotations .
The annotations appear in the right pane of the Preferences dialog.
Figure 66: Breakpoint annotations
3. Select Breakpoints (org.eclipse.debug.core.breakpoint) from the Annotation types list box.
4. Specify settings for the selected annotation.
5. Click Apply.
6. Click OK.
You have changed editor breakpoint annotations.
3.2.3 Regular breakpointsRegular breakpoints suspend the execution of a thread before a line of code or method is executed.
Regular breakpoints include:
• Line - Suspends the thread execution when the line of code it applies to is executed.
• Method - Suspends the thread execution when the method that it applies to, is entered or exited (or both).
DebuggerBreakpoints
CodeWarrior Development Studio Common Features Guide, Rev. 10.x, 01/201694 Freescale Semiconductor, Inc.

The following figure shows an editor window and the marker bar to the left of the source code. Breakpoint iconsappear in this marker bar.
Figure 67: Setting regular breakpoints
You can add a breakpoint while debugging your project. Double-click the marker bar tothe left of a source code line to set a breakpoint at that line.
NOTE
This topic explains:
• Setting line breakpoint on page 95
• Setting method breakpoint on page 95
3.2.3.1 Setting line breakpointLine breakpoints are set on an executable line of a program.
To set a line breakpoint at a line of source code:
1. Open the source code file in the editor and place the cursor on the line where you want to set thebreakpoint.
2. Choose Run > Toggle Line Breakpoint from the IDE menu bar. You can also double-click the marker barnext to the source code line.
A breakpoint appears in the Breakpoints view. A breakpoint icon appears on the marker bar, directly to theleft of the line where you added the breakpoint. The line where the breakpoint is set is highlighted in the editorarea. The line appears highlighted in the C/C++ perspective also.
When the breakpoint is enabled, the thread execution suspends before that line of code executes. The debuggerselects the suspended thread and displays it's stack frames.
3.2.3.2 Setting method breakpointMethod breakpoints are set on methods that do not have source code.
To set a method breakpoint on a line of source code:
DebuggerBreakpoints
CodeWarrior Development Studio Common Features Guide, Rev. 10.x, 01/2016Freescale Semiconductor, Inc. 95

1. Open the source code file in the editor.
2. Choose Window > Show View > Outline from the IDE menu bar.
The Outline view appears displaying an outline of the structured elements of the C/C++ file that is currentlyopen in the editor area.
3. Select the method where you want to add a breakpoint.
4. Choose Run > Toggle Breakpoint from the IDE menu bar. You can also choose Toggle Breakpoint fromthe shortcut menu.
A breakpoint appears in the Breakpoints view. A breakpoint appears on the marker bar in the file's editor forthe method that was selected, if source code exists for the class.
When the breakpoint is enabled, thread execution suspends before the method enters or exits.
3.2.4 Special breakpointsA special breakpoint is different from a regular breakpoint. A special breakpoint can be a hardware breakpointor a software breakpoint.
• Hardware - Hardware breakpoints are implemented by the processor hardware. The number of hardwarebreakpoints available varies by processor type.
• Software - Software breakpoints are implemented by replacing some code in the target with specialopcodes. These opcodes stop the core as soon as they are executed. Software breakpoints only work if thecode is running out of RAM. There is no restriction on the number of software breakpoints in a project.
Special breakpoints have enabled and disabled states. The following table describes these states.
Table 7: Special breakpoint states
State Hardware Icon Software Icon Description
Enabled Indicates that the breakpoint is currently enabled.The debugger halts program execution at anenabled breakpoint. Click the icon to disable thebreakpoint.
Disabled Indicates that the breakpoint is currently disabled.The debugger does not halt program execution at adisabled breakpoint. Click the icon to enable thebreakpoint.
This topic explains:
• Setting special breakpoint using IDE on page 96
3.2.4.1 Setting special breakpoint using IDEA special breakpoint is not a regular breakpoint and therefore, cannot be set by double-clicking. This sectionexplains how to set a special breakpoint on the source code.
To set a special breakpopint:
1. Choose Breakpoint Types > C/C++ Software Breakpoint or C/C++ Hardware Breakpoint from any of thefollowing views:
• Editor - From the shortcut menu that appears on right-clicking the marker bar.
• Disassembly - From the shortcut menu that appears on right-clicking the marker bar of the Disassemblyview.
DebuggerBreakpoints
CodeWarrior Development Studio Common Features Guide, Rev. 10.x, 01/201696 Freescale Semiconductor, Inc.

• Outline - From the shortut menu of the selected C++ class method.
• In the editor area, directly to the left of the line where you want to add the breakpoint, choose ToggleBreakpoint from the shortcut menu. You can also double-click the marker bar next to the source codeline.
A new special breakpoint marker appears on the marker bar, directly to the left of the line, where you addedthe breakpoint.
To add a special breakpoint while debugging your project, right-click the marker bar tothe left of a source code line and choose Breakpoint Types > C/C++ Software Breakpointor C/C++ Hardware Breakpoint from the shortcut menu.
TIP
3.2.5 Breakpoint persistenceThis CodeWarrior debugger feature allows you to preserve the enable/disable state of a breakpoint instance.
If you change the enabled/disable state of the breakpoint instances, the debugger serializes the breakpoint statefor all breakpoint instances. As a result, next time the user starts a new debug session, the breakpoint instancesare created as enabled/disabled according to the serialized state.
Figure 68: Breakpoints persistence
3.2.6 Breakpoint preferencesThis topic explains the steps required to change the preferences when a breakpoint is hit.
When a breakpoint is hit, CodeWarrior shifts the focus to the workbench and the Debug view. This can beannoying while working with long automated scripts. CodeWarrior can be configured to remain in background,when a breakpoint is hit, by changing the breakpoint preferences.
To change the breakpoint preferences for a debug session:
1. Choose Window > Preferences.
The Preferences dialog appears.
2. Select Run/Debug.
The Run/Debug preference pane appears.
DebuggerBreakpoints
CodeWarrior Development Studio Common Features Guide, Rev. 10.x, 01/2016Freescale Semiconductor, Inc. 97

Figure 69: Breakpoint preferences
3. Deselect the Activate the workbench when a breakpoint is hit checkbox and the Activate the debug viewwhen a breakpoint is hit checkbox.
4. Click Apply.
5. Click OK.
The breakpoint preferences are set to default after completion of the debug session.
NOTE
Alternatively, to ensure that CodeWarrior remains in the background, every time a breakpoint is hit, add thefollowing lines of code at the end of the <CWInstall>\eclipse\cwide.properties file, where <CWInstall> isthe CodeWarrior installation path:
org.eclipse.debug.ui/org.eclipse.debug.ui.activate_debug_view=falseorg.eclipse.debug.ui/org.eclipse.debug.ui.activate_workbench=false
DebuggerBreakpoints
CodeWarrior Development Studio Common Features Guide, Rev. 10.x, 01/201698 Freescale Semiconductor, Inc.

3.2.7 Working with breakpointsYou can perform various actions on the breapoints such as modifying the breakpoints properties, restrictingthe breakpoints to selected targets, and grouping them.
This topic describes the following sub-topics.
• Modify breakpoint properties on page 99
• Restricting breakpoints to selected targets and threads on page 101
• Limiting new breakpoints to active debug context on page 102
• Grouping breakpoints on page 103
• Disabling breakpoints on page 103
• Enabling breakpoints on page 104
• Removing breakpoints on page 104
• Removing All Breakpoints on page 104
• Undo delete breakpoint on page 104
• Redo delete breakpoint on page 105
• Skipping all breakpoints on page 105
3.2.7.1 Modify breakpoint propertiesThis section explains how to modify the breakpoint properties using CodeWarrior IDE.
To view or modify breakpoint properties for a breakpoint using the Properties for C/C++ breakpoint dialog. Youcan open the Properties for C/C++ breakpoint dialog using one of the following methods:
• From the Breakpoint view - right-click and choose Breakpoint Properties from the shortcut menu.
• From the editor area - right-click on breakpoint and choose Breakpoint Properties from the shortcut menu.
The following figure shows the Properties for C/C++ breakpoint dialog. The following table describes eachbreakpoint property.
DebuggerBreakpoints
CodeWarrior Development Studio Common Features Guide, Rev. 10.x, 01/2016Freescale Semiconductor, Inc. 99

Figure 70: Properties for C/C++ breakpoint dialog
Table 8: Breakpoint properties
Option Description
Actions Allows you to attach one or more breakpoint actions toa single breakpoint. For example, when a breakpointis encountered you could both log a message and playa sound. Actions are executed in the order they appearin the Actions for this breakpoint table.
Common Displays common properties of a breakpoint.Additionally, you can define a condition thatdetermines when the breakpoint will be encountered.A condition for a breakpoint can be any logicalexpression that returns true or false value.
Table continues on the next page...
DebuggerBreakpoints
CodeWarrior Development Studio Common Features Guide, Rev. 10.x, 01/2016100 Freescale Semiconductor, Inc.

Table 8: Breakpoint properties (continued)
Option Description
Filtering Allows you to restrict the breakpoint to the selectedtargets and threads. The Filtering option is availableduring a debug session.
Instances Displays real-time breakpoint information that helpsidentify the address and the way a breakpoint isinstalled on a target.
3.2.7.2 Restricting breakpoints to selected targets and threadsYou can restrict a breakpoint to one or more threads of a target. This process allows you to work on selectedthreads of a target.
To restrict a breakpoint to one or more process threads:
1. Select the Breakpoints view.
2. Right-click on the breakpoint you want to restrict, and choose Breakpoint Properties from the shortcutmenu.
The Properties for C/C++ Breakpoint dialog appears.
3. In the left pane, select Filtering. The Filtering option is available during a debug session.
DebuggerBreakpoints
CodeWarrior Development Studio Common Features Guide, Rev. 10.x, 01/2016Freescale Semiconductor, Inc. 101

Figure 71: Restrict breakpoint to selected targets and threads
4. From the Restrict to Selected Targets and Threads list, select the checkboxes adjacent to threads youwant to restrict the breakpoint.
5. Click OK.
The breakpoint is applied to the selected targets and threads.
3.2.7.3 Limiting new breakpoints to active debug contextThis topic explains how to limit the new breakpoints to the active debug context.
If a breakpoint is set in a file shared by multiple cores; the breakpoint is set for all cores by default. To enablelimiting new breakpoints on an active debug context:
1. Debug your project.
2. Select the Breakpoints view.
3. Click the Limit New Breakpoints to Active Debug Context icon in the Breakpoints view.
4. Double-click the marker bar to the left of a source code line to set a breakpoint at that line.
DebuggerBreakpoints
CodeWarrior Development Studio Common Features Guide, Rev. 10.x, 01/2016102 Freescale Semiconductor, Inc.

If no debug context exists, the breakpoint is installed in all contexts as normal.
NOTE
Once set, the breakpoint filtering is maintained for the individual context during a Restart but is lost after aTerminate. After a Terminate, the breakpoint is installed in all debug contexts.
3.2.7.4 Grouping breakpointsGrouping breakpoints helps you view a list of breakpoints that match specified criteria.
To group breakpoints:
1. Click the pop-up menu in the Breakpointsview.Figure 72: Grouping breakpoints
2. Choose Group By.
• Breakpoints - Displays a standard list of breakpoints.
• Breakpoint types - Groups all breakpoints by their types.
• Breakpoint Working Sets - Groups all breakpoints as user defined problem-specific sets that can bequickly enabled and disabled.
• Files - Groups all breakpoints by the files they are set in.
• Projects - Groups all breakpoints by the project in which they are set.
• Resource Working Sets - Groups all breakpoints into resource-specific working sets that can be quicklyenabled and disabled.
• Advanced - Displays the Group Breakpoints dialog that helps you specify nested grouping for theBreakpoints view. For example, you group breakpoints by Breakpoint Types and then group them byProjects and Working Sets.
3.2.7.5 Disabling breakpointsDisabling a breakpoint prevents it from affecting program execution and is easier than clearing or creatingnew breakpoints.
To disable a breakpoint:
1. Right-click on an enabled breakpoint in the marker bar.
2. Choose Disable Breakpoint from the shortcut menu.
The breakpoint icon changes to . The disabled breakpoint icon indicates that the breakpoint does not haltprogram execution.
DebuggerBreakpoints
CodeWarrior Development Studio Common Features Guide, Rev. 10.x, 01/2016Freescale Semiconductor, Inc. 103

Disabled breakpoints can be enabled without losing any information. To know how toenable breakpoints, see Enabling breakpoints on page 104.
NOTE
3.2.7.6 Enabling breakpointsThe program execution suspends whenever an enabled breakpoint is encountered in the source code.Enabling a breakpoint is easier than clearing or creating a new breakpoint.
To disable a breakpoint:
1. Right-click on a disabled breakpoint in the marker bar.
2. Choose Enable Breakpoint from the shortcut menu.
The breakpoint icon changes to . The enabled breakpoint icon indicates that it suspends the programexecution whenever encountered in the source code.
Enabled breakpoints can be disabled without losing any information. To know how todisable breakpoints, see Disabling breakpoints on page 103.
NOTE
3.2.7.7 Removing breakpointsThis topic explains how to remove a breakpoint.
To remove a breakpoint:
1. Right-click on a breakpoint in the Breakpoint view.
2. Choose Remove Selected Breakpoints from the shortcut menu.
The selected breakpoint is removed.
Alternatively, click the Remove Selected Breakpoints icon in the Breakpoints view.
NOTE
3.2.7.8 Removing All BreakpointsThis topic explains how to remove all the breakpoints using context menu.
To remove all breakpoints:
1. Right-click in the Breakpoints view.
2. Choose Remove All Breakpoints from the shortcut menu.
Alternatively, click the Remove All Breakpoints icon in the Breakpoints view.
NOTE
3.2.7.9 Undo delete breakpointThis feature allows you to undo delete breakpoints from breakpoints view.
This feature is useful when by mistake you have deleted a breakpoint with some elaborated conditions. To undodelete breakpoint:
1. Choose Edit > Undo Delete Breakpoint from the IDE menu bar.
DebuggerBreakpoints
CodeWarrior Development Studio Common Features Guide, Rev. 10.x, 01/2016104 Freescale Semiconductor, Inc.

3.2.7.10 Redo delete breakpointThis topic lists the steps required to redo delete breakpoint.
To redo delete breakpoint:
1. Choose Edit > Redo Delete Breakpoint from the IDE menu bar.
3.2.7.11 Skipping all breakpointsAll active breakpoints are skipped by the debugger during program/source code execution.
To ignore all active breakpoints, click the Skip All Breakpoints icon.
Skipped breakpoints do not suspend execution until they are turned on.
NOTE
Click the Skip All Breakpoints icon again to turn on all breakpoints.
3.2.8 Breakpoint actionsYou can use breakpoint actions to extend the breakpoint behavior and define other actions that occur whenprogram execution reaches the breakpoint.
This topic explains CodeWarrior enhancements to standard breakpoint behavior. The standard behavior ofbreakpoints of a debugger is to stop execution at a specific spot.
Breakpoint actions let you:
• specify specific tasks to perform,
• manage a list of actions, where each action has specific properties,
• attach specific actions to individual breakpoints,
• control the order in which the breakpoint actions occur, and
• execute the Debugger Shell commands.
You can associate more than one action with a breakpoint. The debugger executes the associated breakpointactions when the program execution encounters the breakpoint. The following table lists and describesbreakpoint actions.
Table 9: Breakpoint actions
Action Description
Debugger Shell Action Executes Debugger Shell commands or a DebuggerShell script.
Sound Action Plays the specified sound.
Log Action Logs messages to a console. The messages can beliteral strings or the result of an expression that thedebugger evaluates.
Resume Action Halt the program execution for a specified time andthen resumes the program execution.
External Tool Action Invokes a program, which is external to the debugger.
This section explains:
• Breakpoint Actions preferences page on page 106
DebuggerBreakpoints
CodeWarrior Development Studio Common Features Guide, Rev. 10.x, 01/2016Freescale Semiconductor, Inc. 105

• Adding breakpoint action on page 107
• Attaching breakpoint actions to breakpoints on page 108
3.2.8.1 Breakpoint Actions preferences pageUse the Breakpoint Actions preferences page to manage a global list of breakpoint actions available in aworkspace. Each action is an instance of a specific action type.
The Breakpoint Actions preferences page:
• shows a list of available actions,
• lets you create new actions for a selected action type, and
• lets you add, edit, and delete existing actions.
To open the Breakpoint Actions preferences page:
1. Choose Window > Preferences from the IDE menu bar.
The Preferences dialog appears.
2. Choose C/C++ > Debug > Breakpoint Actions.
The Breakpoint Actions preferences page appears.
DebuggerBreakpoints
CodeWarrior Development Studio Common Features Guide, Rev. 10.x, 01/2016106 Freescale Semiconductor, Inc.

Figure 73: Preferences dialog - Breakpoint Actions page
3.2.8.2 Adding breakpoint actionThis topic explains how to add a breakpoint action.
To add a breakpoint action:
1. Open the Breakpoint Actions preferences page.
2. Click New.
The New Breakpoint Action dialog appears.
DebuggerBreakpoints
CodeWarrior Development Studio Common Features Guide, Rev. 10.x, 01/2016Freescale Semiconductor, Inc. 107

Figure 74: New Breakpoint Action dialog
3. In the Action name textbox, enter a name for the new action.
4. Use the Action type pop-up menu to choose the type of action you want to create.
5. Specify additional breakpoint-action properties, according to the action type that you specified.
For example, to display a specified log message when the debugger encounters a breakpoint, specify thelog message in the Log Action breakpoint action.
6. Click OK.
The New Breakpoint Action dialog closes. The new breakpoint action appears in the Breakpoint Actionspreferences page table.
3.2.8.3 Attaching breakpoint actions to breakpointsThis topic explains how to attach breakpoint actions to an existng breakpoint.
To use a breakpoint action, you must attach it to an existing breakpoint.
To attach breakpoint actions to a breakpoint, add the associated breakpoint actions inthe Breakpoint Actions preference page.
NOTE
To attach breakpoint actions to a breakpoint:
1. Initiate a debugging session.
2. In the editor area of the Debug perspective, set a breakpoint.
3. Open the Breakpoints view.
a. From the IDE menu bar, choose Window > Show View.
The Show View dialog appears.
DebuggerBreakpoints
CodeWarrior Development Studio Common Features Guide, Rev. 10.x, 01/2016108 Freescale Semiconductor, Inc.

b. Choose Debug > Breakpoints.
c. Click OK.
4. In the Breakpoints view, right-click a breakpoint.
5. Choose Properties from the shortcut menu.
The Properties for dialog appears.
6. Select Actions in the left pane of the Properties for dialog.
The Actions page appears.
7. Follow these sub-steps for each breakpoint action that you want to attach to the breakpoint:
a. Select the breakpoint action from the Available actions table.
b. Click Attach.
The selected breakpoint action moves from the Available actions table to the Actions for this breakpointtable.
The debugger executes the breakpoint actions in the order shown in the Actions for thisbreakpoint table.
NOTE
8. To reorder the breakpoint actions in the Actions for this breakpoint table:
a. Select the action in the table.
b. Click Up to move the selected action up in the table.
c. Click Down to move the selected action down in the table.
During a debugging session, the debugger executes the breakpoint actions when the breakpoint is encountered.
3.2.9 Selecting breakpoint templateWhen you set a line or function breakpoint in the template code from the IDE, the breakpoint is set on alltemplate instances. This feature allows you to enable or disable a breakpoint for a particular core.
To disable breakpoint for a particular core:
1. Initiate a debugging session.
2. Open the Breakpoints view.
3. Click on the + sign to expand a breakpoint.
DebuggerBreakpoints
CodeWarrior Development Studio Common Features Guide, Rev. 10.x, 01/2016Freescale Semiconductor, Inc. 109

Figure 75: Selecting breakpoint template
4. Deselect the checkbox for the core for which you do not want the breakpoint applied.
3.3 Build while debuggingCodeWarrior allows automatic termination of the debug sessions when initiating a build that producesexecutables locked by those debug sessions.
The debug session locks the debugged elf when Create and Use Copy of Executable checkbox is notselected, see Symbolics on page 219. If you make changes to the source files and rebuild the project while adebug session is on, the build commands are invoked but the locked files are not overwritten and a link-timeerror is generated.
To enable build while debugging:
1. Choose Window > Preferences from the IDE menu bar.
The Preferences dialog appears.
2. Choose C/C++ > Debug > CodeWarrior Debugger.
The CodeWarrior debugger preferences appears in the right pane of the Preferences dialog.
DebuggerBuild while debugging
CodeWarrior Development Studio Common Features Guide, Rev. 10.x, 01/2016110 Freescale Semiconductor, Inc.

Figure 76: Preferences dialog
3. Select the Automatically terminate debug session on project rebuild, don't ask checkbox.
4. Click Apply.
5. Click OK.
Applying this setting immediately effects the project.
NOTE
Now the debug session will automatically terminate while initiating a build that produces executables locked bythose debug sessions
3.4 Cache viewThe Cache view helps you view, modify, and control a hardware cache.
Use the Cache view to examine instruction and data cache for L1 and L2 cache for the supported targets.
DebuggerCache view
CodeWarrior Development Studio Common Features Guide, Rev. 10.x, 01/2016Freescale Semiconductor, Inc. 111

This section explains:
• Opening Cache view on page 112
• Preserving sorting on page 113
• Cache view pop-up menu on page 114
3.4.1 Opening Cache viewThis topic explains how to view the cache view in CodeWarrior.
To open the Cache view:
1. Start a debugging session.
2. From the CodeWarrior menu bar, choose Window > Show View > Other.
The Show View dialog appears.
Figure 77: Show View dialog
3. Expand the Debug group and select Cache.
4. Click OK.
The Cache view appears.
DebuggerCache view
CodeWarrior Development Studio Common Features Guide, Rev. 10.x, 01/2016112 Freescale Semiconductor, Inc.

Alternatively, start typing Cache in the type filter text textbox. The Show View dialogfilters the list of the views and displays only the views matching the characters typed inthe textbox. Select Cache from the filtered list and click OK.
TIP
Figure 78: Cache view
If the Select Cache pop-up menu is dimmed in the Cache view then the current targetdoes not support viewing cache.
NOTE
3.4.2 Preserving sortingPreserve sorting of the cache when you update and refresh the cache.
To preserve sorting, perform the following steps:
1. Start a debugging session.
2. Open the Cache view. For more information about how to open the Cache view, see Opening Cache viewon page 112.
3. Choose the Preserve Sorting command from the pop-up menu of the Cache view.
DebuggerCache view
CodeWarrior Development Studio Common Features Guide, Rev. 10.x, 01/2016Freescale Semiconductor, Inc. 113

Figure 79: Cache view - Preserve sorting
The Preserve Sorting command is not available by default. If available, every operationthat triggers cache refresh, such as step, and run to breakpoint will have to wait for thecache data loading and sorting.
NOTE
3.4.3 Cache view pop-up menuYou can perform various actions on the cache using the pop-up menu in the Cache view.
Alternatively, you can use the Cache view toolbar that includes the same commands as the Cache view pop-upmenu. The following table lists the Cache view pop-up menu commands and their description.
DebuggerCache view
CodeWarrior Development Studio Common Features Guide, Rev. 10.x, 01/2016114 Freescale Semiconductor, Inc.

Table 10: Cache view pop-up menu commands
Command Description
Write Commits changes in the Cache view to the cache register of the target hardware, ifsupported by the target hardware.
Refresh Reads data from the target hardware and updates the cache display.
Invalidate Invalidates the entire content of the cache.
Flush Flushes the entire content of the cache. Flushing the cache involves committinguncommitted data to the next level of the memory hierarchy, and then invalidatingthe data within the cache.
Lock Locks the cache. Locking cache prevents the cache from fetching the new lines ordiscarding the current valid lines.
Synchronize Synchronize cache data with memory data.
Enable Turns on the cache.
Disable LRU Removes the Least Recently Used attribute from the existing display for each cacheline.
Inverse LRU Displays the inverse of the Least Recently Used attribute for each cache line.
Copy Cache Copies the cache contents to the system clipboard.
Export Cache Exports the cache contents to a file.
Search Finds an occurrence of a string in the cache lines.
Search Again Finds the next occurrence of a string in the cache lines.
Preserves sorting Preserves sorting of the cache when the cache data is updated and the cache isrefreshing. This option is not available by default. If available, every operation thattriggers cache refresh (like step, run to breakpoint) will have to wait for cache dataloading and sorting.
View Memory Views the corresponding memory for the selected cache lines.
Lock Line Locks the selected cache lines.
Invalidate Line Invalidates the selected cache lines.
Flush Line Flushes the entire contents of the selected cache lines.
Synchronize Line Synchronize selected cache data with memory data.
Lock Way Locks the cache ways specified with the Lock Ways menu command. Locking acache way means that the data contained in that way must not change. If the cacheneeds to discard a line, it will not discard the locked lines, such as the lines explicitlylocked, or the lines belonging to locked ways.
Unlock Way Unlocks the cache ways specified with the Lock Ways command.
Lock Ways Specifies the cache ways on which the Lock Way and Unlock Way commandsoperate.
DebuggerCache view
CodeWarrior Development Studio Common Features Guide, Rev. 10.x, 01/2016Freescale Semiconductor, Inc. 115

3.5 CodeWarrior debugger settingsYou can configure debugger settings of a CodeWarrior project having multiple associated launchconfigurations.
A launch configuration is a named collection of settings that the CodeWarrior tools use. For example, the projectyou created in the tutorial chapter had two associated launch configurations.
The CodeWarrior project wizard generates launch configurations with names that follow the pattern projectname- configtype - targettype, where:
• projectname represents the name of the project.
• configtype represents the type of launch configuration.
• targettype represents the type of target software or hardware on which the launch configuration acts.
Launch configurations for debugging code lets you specify settings such as:
• Files that belong to the launch configuration
• behavior of the debugger and related debugging tools
If you use the CodeWarrior wizard to create a new project, the IDE creates two debugger related launchconfigurations:
• Debug configuration that produces unoptimized code for development purposes.
• Release configuration that produces code intended for production purposes.
This section includes:
• Modifying debugger settings on page 116
• Reverting debugger settings on page 117
• Stopping debugger at program entry point on page 117
3.5.1 Modifying debugger settingsThis topic explains how to modify the debugger settings.
If you use the CodeWarrior wizard to create a new project, the IDE sets the debugger settings to default values.You can modify these settings as per the requirement.
To change debugger settings:
1. In the CodeWarrior Projects view, right-click the project folder.
A shortcut menu appears.
2. Choose Debug As > Debug Configurations.
The Debug Configurations dialog appears.
The left pane of the Debug Configurations dialog lists the debug configurations that apply to the currentproject.
3. Expand the CodeWarrior configuration.
4. From the expanded list, select the name of the debug configuration you want to modify.
The Debug Configurations dialog shows the settings for the selected configuration.
5. Click the Debugger tab.
The Debugger page appears.
DebuggerCodeWarrior debugger settings
CodeWarrior Development Studio Common Features Guide, Rev. 10.x, 01/2016116 Freescale Semiconductor, Inc.

6. Change the settings in this page to suit your needs.
7. Click the Apply button.
The IDE saves your new settings.
You can select other pages and modify their settings. When you finish, you can clickthe Debug button to start a new debugging session, or click the Close button to saveyour changes and close the Debug Configuration dialog.
NOTE
3.5.2 Reverting debugger settingsYou can revert pending changes and restore last saved settings.
To undo pending changes, click the Revert button at the bottom of the Debug Configurations dialog.
The IDE restores the last set of saved settings to all pages of the Debug Configurations dialog. Also, the IDEdisables the Revert button until you make new changes.
3.5.3 Stopping debugger at program entry pointThis feature helps you specify debugger settings for the CodeWarrior Debugger to remain stopped at programentry point.
To specify debugger settings to stop debugger at program entry point:
1. In the CodeWarrior Projects view, right-click the project folder.
A shortcut menu appears.
2. Choose Debug As > Debug Configurations.
The Debug Configurations dialog appears. The left pane of the Debug Configurations dialog lists the debugconfigurations that apply to the current project.
3. Expand the CodeWarrior configuration.
4. From the expanded list, select the name of the debug configuration you want to modify.
The Debug Configurations dialog shows the settings for the selected configuration.
5. Click the Debugger tab.
The Debugger pane appears.
6. Select the Stop on startup at checkbox.
The Program entry point and the User Specified options become available.
7. Select the Program entry point option.
To stop the debugger at a user-specified function, select the User specified option andtype the function name in the textbox.
NOTE
8. Click Apply.
The IDE saves the settings for the debugger to remain stopped at program entry point.
DebuggerCodeWarrior debugger settings
CodeWarrior Development Studio Common Features Guide, Rev. 10.x, 01/2016Freescale Semiconductor, Inc. 117

3.6 Core index indicators in homogeneous multicoreenvironment
You can identify the core(s) being debugged, when you debug a target with two or more cores of the samearchitecture.
The core index is displayed in three views: Debug, System Browser, and Console.
• Debug view
For information on how the core index is displayed in the Debug view, see the product's Targeting Manual.• System Browser view on page 118
• Console view on page 119
3.6.1 System Browser viewThis section lists the debug session types available in CodeWarrior.
The System Browser serves two types of debug sessions: Kernel Awareness and OS application.
This section provides details on:
• Kernel Awareness on page 118
• OS application on page 119
3.6.1.1 Kernel AwarenessThis topic explains about the kernel awareness debug session.
In a Kernel Awareness debug session, the core index is displayed under these scenarios:
• Multiple homogeneous cores, each running a single core Operating System (OS)
• Multicore OS
The System Browser view displays content for the a ctive debug context. For Kernel Awareness, the label of theprocess object, as shown in the Debug view, is displayed at the top of the System Browser view's client area.This label contains the index of the core the OS is running on, and is referred to as the context label.For example, if the user is performing Kernel Awareness on a P4080 target, and the user is looking at Linuxrunning on the 5th e500 core, then the top of the System Browser client area shows a label that contains core4.
In a multicore OS scenario, the system browser shows kernel threads for all cores being managed by the OS.The System Browser view that displays kernel threads indicates the core index for each thread.
The following figure shows the core index information for kernel threads in a multicore environment.
DebuggerCore index indicators in homogeneous multicore environment
CodeWarrior Development Studio Common Features Guide, Rev. 10.x, 01/2016118 Freescale Semiconductor, Inc.

Figure 80: System Browser View - Kernel Awareness
3.6.1.2 OS applicationOS Application debugging happens through a connection with an agent running on the OS.
The connection to the agent is through TCP/IP or COM port. In this scenario, the agent does not have informationabout the core it is running on, nor does the user specify it when configuring the launch. The user simply specifiesthe IP address or COM port where the agent is running.
The System Browser view shows the IP address or COM port in the context label.
Figure 81: System Browser view - OS application
3.6.2 Console viewThe console associated with a process object displays the label of that process, as it appears in the Debugview.
When debugging a homogeneous multicore target, this label contains the core index.
The following figure shows the core index in the Console view.
DebuggerCore index indicators in homogeneous multicore environment
CodeWarrior Development Studio Common Features Guide, Rev. 10.x, 01/2016Freescale Semiconductor, Inc. 119

Figure 82: Console view
3.7 Debug perspectiveThe Debug perspective lets you manage how the Workbench debugs and runs a program.
A perspective defines the initial set and layout of views in the Workbench window. Within the window, eachperspective shares the same set of editors. Each perspective provides a set of functionality aimed ataccomplishing a specific type of task or works with specific types of resources.
You can control your program's execution by setting breakpoints, suspending launched programs, steppingthrough your code, and examining the values of variables.
The Debug perspective displays this information:
• The stack frame of the suspended threads of each target that you are debugging
• Each thread in your program represented as a node in the tree
• The process of each program that you are running
The Debug perspective also drives the Source view. As you step through your program, the Source viewhighlights the location of the execution pointer.
The following figure shows a Debug perspective.
DebuggerDebug perspective
CodeWarrior Development Studio Common Features Guide, Rev. 10.x, 01/2016120 Freescale Semiconductor, Inc.

Figure 83: Debug perspective
3.8 Debug viewThe Debug view shows the target debugging information in a tree hierarchy.
Views support editors and provide alternate presentations as well as ways to navigate the information in yourWorkbench. For more information on the tree hierarchy and target debugging information, see the C/C++Development User Guide.
DebuggerDebug view
CodeWarrior Development Studio Common Features Guide, Rev. 10.x, 01/2016Freescale Semiconductor, Inc. 121

Figure 84: Debug view
Use the Debug view to perform these tasks:
• Clear all terminated processes.
• Start a new debug session for the selected process.
• Resume execution of the currently suspended debug target.
• Halt execution of the currently selected thread in a debug target.
• Terminate the selected debug session and/or process.
• Detach the debugger from the selected process.
• Execute the current line, including any routines, and proceed to the next statement.
• Execute the current line, following execution inside a routine.
• Re-enter the selected stack frame.
• Examine a program as it steps into disassembled code.
This section lists:
• Common debugging actions on page 122
3.8.1 Common debugging actionsThis topic explains how to perform common debugging actions that correct source-code errors, controlprogram execution, and observe memory behavior.
Following are the common debugging actions.
• Starting debugger on page 123
• Stepping into routine call on page 123
• Stepping Out of Routine Call on page 123
• Stepping over routine call on page 123
• Stopping program execution on page 124
• Resuming program execution on page 124
• Running program on page 124
• Disconnecting core on page 124
DebuggerDebug view
CodeWarrior Development Studio Common Features Guide, Rev. 10.x, 01/2016122 Freescale Semiconductor, Inc.

• Restarting debugger on page 124
• Debugging in Instruction Stepping mode on page 125
• Changing program counter value on page 125
3.8.1.1 Starting debuggerThis section explains about how to start the debugging session.
Use the debug command in the Command-Line Debugger Shell to begin a debugging session. The debuggerthen takes control of program execution, starting at the main entry point of the program.
Alternatively, choose Run > Debug or click the Debug button in the Debug view on page 121 toolbar to start thedebugger and launch a new Debug view.
Some projects require additional configuration before a debugging session can begin.For more information, see the product's Targeting Manual.
NOTE
3.8.1.2 Stepping into routine callUse the step command in the Command-Line Debugger Shell to execute one source-code statement at atime and follow execution in a routine call.>
Alternatively, choose Run > Step Into or click the Step Into button in the Debug view on page 121 toolbar to stepinto a routine.
After the debugger executes the source code statement, the current statement arrow moves to the nextstatement. The debugger uses these rules to find the next statement:
• If the executed statement did not call a routine, the current statement arrow moves to the next statement inthe source code.
• If the executed statement called a routine, the current statement arrow moves to the first statement in thecalled routine.
• If the executed statement is the last statement in a called routine, the current statement arrow moves to thestatement in the calling routine.
3.8.1.3 Stepping Out of Routine CallUse the Step Return command in the Command-Line Debugger Shell to execute the rest of the currentroutine and stop program execution after the routine returns to its caller. This command causes execution toreturn up the call chain.
Alternatively, choose Run > Step Return or click the Step Return button in the Debug view on page 121 toolbarto step out of a routine.
The current routine executes and returns to its caller; then program execution stops.
3.8.1.4 Stepping over routine callUse the next command in the Command-Line Debugger Shell to execute the current statement and advanceto the next statement in the source code.
If the current statement is a routine call, program execution continues until it reaches:
• end of the called routine,
• breakpoint,
• watchpoint,
• or an eventpoint that stops execution.
DebuggerDebug view
CodeWarrior Development Studio Common Features Guide, Rev. 10.x, 01/2016Freescale Semiconductor, Inc. 123

Alternatively, choose Run > Step Over or click the Step Over button (shown at left) in the Debug view on page121 toolbar to step over a routine. The current statement or routine executes; then program execution stops.
3.8.1.5 Stopping program executionUse the kill command in the Command-Line Debugger Shell to stop program execution during a debuggingsession.
Alternatively, choose Run > Terminate or click the Terminate button in the Debug view on page 121 toolbar tostop program execution.
The operating system surrenders control to the debugger, which stops the program execution.
When working with a processor that has multiple cores, you can choose Run > MulticoreTerminate to stop selected group of cores.
NOTE
3.8.1.6 Resuming program executionUse the go command in the Command-Line Debugger Shell to resume execution of a suspended debuggingsession.
Alternatively, choose Run > Resume or click the Debug button (shown at left) in the Debug view on page 121toolbar to resume program execution.
The suspended session resumes.
3.8.1.7 Running programUse the run command in the Command-Line Debugger Shell to execute a program outside of the debuggercontrol.
Alternatively, choose Run > Run or click the Run button (shown at left) in the Debug view on page 121 toolbarto begin program execution.
The program runs outside of debugger control. Further, any watchpoints and breakpoints (special, hardware,and software) are not hit.
The run command is shortcut for debug, go, and disconnect actions. The run commanddownloads the code to the target, puts the core in running mode, and then disconnectsfrom the target.
NOTE
3.8.1.8 Disconnecting coreThis topic explains how to disconnect a core from a target.
Click the Disconnect button in the Debug view on page 121 toolbar to disconnect a core from the target.
The effect of the disconnect command is same as of the terminate command. The only difference betweenthe two commands is that the disconnect command turns on when a debug session is running.
3.8.1.9 Restarting debuggerThis section explains how to restart a debug session.
You can restart debug session in following ways:
• Use the restart command in the Command-Line Debugger Shell, after stopping program execution. Thedebugger goes back to the beginning of the program and begins execution again.
DebuggerDebug view
CodeWarrior Development Studio Common Features Guide, Rev. 10.x, 01/2016124 Freescale Semiconductor, Inc.

• Right-click Thread in the Debug view and choose Restart from the shortcut menu.
• Click the Restart button in the Debug view toolbar to restart debug session.
Restart action is considerable faster to relaunch a debug session as it skips over loadingexecutable debug information and target register descriptors.
NOTE
3.8.1.10 Debugging in Instruction Stepping modeUse the stepi command in the Command-Line Debugger Shell to debug a program in instruction steppingmode.
In this mode, you can debug the program in Disassembly view on page 125 instead of the source view.
You can also switch to instruction stepping mode by clicking the Instruction Stepping Mode button in the Debugview on page 121 toolbar.
3.8.1.11 Changing program counter valueThis topic explains how to change the counter value.
To change the program-counter value:
1. Initiate a debugging session.
2. In the editor view, place the cursor on the line you want the debugger to execute.
3. Right-click on the line and choose Move To Line from the shortcut menu.
The debugger moves the program counter to the location you specified. The editor view shows the newlocation.
Changing the program-counter value because doing so can cause your program tomalfunction. For example, if you set the program counter outside the address range ofthe current function, the processor will skip the instructions that clean up the stack andreturn execution to the correct place in the calling function. Your program will thenbehave in an unpredictable way.
CAUTION
3.9 Disassembly viewThe Disassembly view shows the loaded program as assembly language instructions mixed with source codefor comparison.
The next instruction to be executed is indicated by an arrow marker and highlighted in the view.
You can perform these tasks in the Disassembly view:
• Set breakpoints at the start of any assembly language instruction
• Enable and disable breakpoints and set their properties
• Step through the disassembled instructions of your program
• Jump to specific instructions in the program
DebuggerDisassembly view
CodeWarrior Development Studio Common Features Guide, Rev. 10.x, 01/2016Freescale Semiconductor, Inc. 125

Figure 85: Disassembly view
3.10 Environment variables in launch configurationCodeWarrior allows you to use environment or eclipse variables to specify the path of the launch executable.
To specify an environment or eclipse variable:
1. Choose Run > Debug Configurations.
The Debug Configurations dialog appears.
2. Select a launch configuration in the left pane of the Debug Configurations dialog.
3. Click Variables.
The Select build variable dialog appears.
DebuggerEnvironment variables in launch configuration
CodeWarrior Development Studio Common Features Guide, Rev. 10.x, 01/2016126 Freescale Semiconductor, Inc.

Figure 86: Select Build Variable dialog
4. Select a variable from the available list.
5. Click OK.
Now you can use environment or eclipse variables to specify the path of the launch executable.
3.11 Flash programmerFlash programmer is a CodeWarrior plug-in that lets you program the flash memory of the supported targetboards from within the IDE.
The flash programmer can program the flash memory of the target board with code from a CodeWarrior IDEproject or a file. You can perform the following actions on a flash device using the flash programmer:
• Erase/Blank check actions on page 132
• Program/Verify actions on page 132
• Checksum actions on page 133
• Diagnostics actions on page 134
• Dump Flash actions on page 134
DebuggerFlash programmer
CodeWarrior Development Studio Common Features Guide, Rev. 10.x, 01/2016Freescale Semiconductor, Inc. 127

• Protect/Unprotect actions on page 135
• Secure/Unsecure actions on page 135
Click the Save button or press Ctrl+S to save task settings.
NOTE
The flash programmer runs as a target task in the Eclipse IDE. To program the flash memory on a target board,you need to perform the following tasks:
• Create a flash programmer target task on page 128
• Configure flash programmer target task on page 130
• Execute flash programmer target task on page 136
3.11.1 Create a flash programmer target taskYou can create a flash programmer task using the Create New Target Task wizard.
1. Choose Window > Show View > Other from the CodeWarrior IDE menu bar.
The Show View dialog appears.
Figure 87: Show View dialog
2. Expand the Debug group and select Target Tasks.
3. Click OK.
The Target Tasks view appears.
DebuggerFlash programmer
CodeWarrior Development Studio Common Features Guide, Rev. 10.x, 01/2016128 Freescale Semiconductor, Inc.

Figure 88: Target Tasks view
4. Click the Create a new Target Task button in the Target Tasks view toolbar.
The Create New Target Task wizard appears.
Figure 89: Create New Target Task window
5. In the Task Name textbox, enter a name for the new flash programming target task.
6. Choose a launch configuration from the Run Configuration pop-up menu.
• Choose Active Debug Context when flash programmer is used over an active debug session.
• Choose a project-specific debug context when flash programmer is used without an active debugsession.
7. Choose Flash Programmer from the Task Type pop-up menu.
8. Click Finish.
DebuggerFlash programmer
CodeWarrior Development Studio Common Features Guide, Rev. 10.x, 01/2016Freescale Semiconductor, Inc. 129

The target task is created and the Flash Programmer Task editor window appears. You use this window toconfigure the flash programmer target task.
• Flash Devices - Lists the devices added in the current task.
• Target RAM - Lets you specify the settings for Target RAM.
• Flash Program Actions - Displays the programmer actions to be performed on the flash devices.
3.11.2 Configure flash programmer target taskYou can add flash devices, specify Target RAM settings, and add flash program actions to a flashprogrammer task to configure it.
This topic contains the following sub-topics:
• Add flash device on page 130
• Specify target RAM settings on page 130
• Add flash programmer actions on page 131
3.11.2.1 Add flash deviceThis topic explain how to add a flash device.
To add a flash device to the Flash Devices table:
1. Click the Add Device button.
The Add Device dialog appears.
2. Select a flash device from the device list.
3. Click the Add Device button.
The flash device is added to the Flash Devices table in the Flash Programmer Task editor window.
You can select multiple flash devices to add to the Flash Devices table. To selectmultiple devices, hold down the Control key while selecting the devices.
NOTE
4. Click Done.
The Add Device dialog closes and the flash device appears in the Flash Devices table in the FlashProgrammer Task editor window.
For NOR flashes, the base address indicates the location where the flash is mapped inthe memory. For SPI and NAND flashes, the base address is usually 0x0.
NOTE
3.11.2.2 Specify target RAM settingsThe Target RAM is used by Flash Programmer to download its algorithms.
The Target RAM memory area is not restored by flash programmer. If you are usingflash programmer with Active Debug Context, it will impact your debug session.
NOTE
The Target RAM (Add flash device on page 130) group contains fields to specify settings for the Target RAM.
• Address textbox: Use it to specify the address from the target memory. The Address textbox should containthe first address from target memory used by the flash algorithm running on a target board.
DebuggerFlash programmer
CodeWarrior Development Studio Common Features Guide, Rev. 10.x, 01/2016130 Freescale Semiconductor, Inc.

• Size textbox: Use it to specify the size of the target memory. The flash programmer does not modify anymemory location other than the target memory buffer and the flash memory.
• Verify Target Memory Writes checkbox: Select this checkbox to verify all write operations to the hardwareRAM during flash programming.
3.11.2.3 Add flash programmer actionsThis section lists the various Flash Programmer actions avalable in the Flash Programmer Task editorwindow.
In the Flash Programmer Actions group in the Flash Programmer Task editor window (Create a flash programmertarget task on page 128), you can add following actions on the flash device.
• Erase/Blank check actions on page 132
• Program/Verify actions on page 132
• Checksum actions on page 133
• Diagnostics actions on page 134
• Dump Flash actions on page 134
• Protect/Unprotect actions on page 135
• Secure/Unsecure actions on page 135
The Flash Programmer Actions group contains the following UI controls to work with flash programmer actions:
• Add Action pop-up menu
• Erase/Blank Check Action: Allows you to add erase or blank check actions for a flash device.
• Program/Verify Action: Allows you to add program or verify flash actions for a flash device.
• Checksum Action: Allows you to add checksum actions for a flash device.
• Diagnostics Action: Lets you add a diagnostics action.
• Dump Flash Action: Lets you add a dump flash action.
• Protect/Unprotect Action: Lets you add protect or unprotect action.
• Secure/Unsecure Action: Lets you add secure or unsecure action.
• Duplicate Action button: Allows you to duplicate a flash program action in the Flash Programmer Actionstable.
• Remove Action button: Allows you to remove a flash program action from the Flash Programmer Actionstable.
• Move Upbutton: Allows you to move up the selected flash action in the Flash Programmer Actions table.
• Move Down button: Allows you to move down the selected flash action in the Flash Programmer Actionstable.
Actions can also be enabled or disabled using the Enabled column. The Descriptioncolumn contains the default description for the flash programmer actions. You can alsoedit the default description.
NOTE
This section includes:
• Erase/Blank check actions on page 132
• Program/Verify actions on page 132
DebuggerFlash programmer
CodeWarrior Development Studio Common Features Guide, Rev. 10.x, 01/2016Freescale Semiconductor, Inc. 131

• Checksum actions on page 133
• Diagnostics actions on page 134
• Dump Flash actions on page 134
• Protect/Unprotect actions on page 135
• Secure/Unsecure actions on page 135
• Duplicate action on page 135
• Remove action on page 136
3.11.2.3.1 Erase/Blank check actionsThe Erase action erases sectors from the flash device.
You can also use the erase action to erase the entire flash memory without selecting sectors. The blank checkaction verifies if the specified areas have been erased from the flash device.
Flash Programmer will not erase a bad sector in the NAND flash. After the erase actiona list of bad sectors is reported (if any).
NOTE
To add an erase/blank check action:
1. Choose Erase/Blank Check Action from the Add Action pop-up menu.
The Add Erase/Blank Check Action dialog appears.
2. Select a sector from the Sectors table and click the Add Erase Action button to add an erase operation onthe selected sector.
Press the Control or the Shift key for selecting multiple sectors from the Sectors table.
NOTE
3. Click the Add Blank Check button to add a blank check operation on the selected sector.
4. Select the Erase All Sectors Using Chip Erase Command checkbox to erase the entire flash memory.
After selecting the Erase All Sectors Using Chip Erase Command checkbox, you needto add either erase or blank check action to erase all sectors.
NOTE
5. Click Done.
The Add Erase/Blank Check Action dialog closes and the added erase/blank check actions appear in theFlash Programmer Actions table in the Flash Programmer Task editor window.
3.11.2.3.2 Program/Verify actionsThe Program action allows you to program the flash device and the verify action verifies the programmedflash device.
The program action will abort and fail if it is performed in a bad block for NAND flashes.
NOTE
To add a program/verify action:
1. Choose Program/Verify Action from the Add Action pop-up menu.
The Add Program/Verify Action dialog appears.
2. Select the file to be written to the flash device.
DebuggerFlash programmer
CodeWarrior Development Studio Common Features Guide, Rev. 10.x, 01/2016132 Freescale Semiconductor, Inc.

3. Select the Use File from Launch Configuration checkbox to use the file from the launch (run) configurationassociated with the task.
4. Specify the file name in the File textbox. You can use Workspace, File System, or Variables buttons toselect the desired file.
5. Choose a file type from the File Type pop-up menu. You can select any one of the following file types:
• Auto - Detects the file type automatically.
• Elf - Specifies executable in ELF format.
• Srec - Specifies files in Motorola S-record format.
• Binary - Specifies binary files.
6. Select the Erase sectors before program checkbox to erase sectors before program.
7. [Optional] Select the Verify after program checkbox to verify after the program.
The Verify after program checkbox is available only with the processors supporting it.
NOTE
8. Select the Restricted To Address in this Range checkbox to specify a memory range. The write action ispermitted only in the specified address range. In the Start textbox, specify the start address of the memoryrange sector and in the End textbox, specify the end address of the memory range.
9. Select the Apply Address Offset checkbox and set the memory address in the Address textbox. Value isadded to the start address of the file to be programmed or verified.
10.Click the Add Program Action button to add a program action on the flash device.
11.Click the Add Verify Action button to add a verify action on the flash device.
12.Click Done.
The Add Program/Verify Action dialog closes and the added program/verify actions appear in the FlashProgrammer Actions table in the Flash Programmer Task editor window.
3.11.2.3.3 Checksum actionsThe checksum can be computed over host file, target file, memory range or entire flash memory.
To add a checksum action:
1. Choose Checksum Action from the Add Action pop-up menu.
The Add Checksum Action dialog appears.
2. Select the file for checksum action.
3. Select the Use File from Launch Configuration checkbox to use the file from the launch (run) configurationassociated with the task.
4. Specify the filename in the File textbox. You can use the Workspace, File System, or Variables buttons toselect the desired file.
5. Choose the file type from the File Type pop-up menu.
6. Select an option from the Compute Checksum Over options. The checksum can be computed over thehost file, the target file, the memory range, or the entire flash memory.
7. Specify the memory range in the Restricted To Addresses in this Range group. The checksum action ispermitted only in the specified address range. In the Start textbox, specify the start address of the memoryrange sector and in the End textbox, specify the end address of the memory range.
DebuggerFlash programmer
CodeWarrior Development Studio Common Features Guide, Rev. 10.x, 01/2016Freescale Semiconductor, Inc. 133
8. Select the Apply Address Offset checkbox and set the memory address in the Address textbox. Value isadded to the start address of the file to be programmed or verified.
9. Click the Add Checksum Action button.
10.Click Done.
The Add Checksum Action dialog closes and the added checksum actions appear in the Flash ProgrammerActions table in the Flash Programmer Task editor window.
3.11.2.3.4 Diagnostics actionsThe diagnostics action generates the diagnostic information for a selected flash device.
Flash Programmer will report bad blocks, if they are present in the NAND flash.
NOTE
To add a diagnostics action:
1. Choose Diagnostics from the Add Action pop-up menu.
The Add Diagnostics Action dialog appears.
2. Select a device to perform the diagnostics action.
3. Click the Add Diagnostics Action button to add diagnostic action on the selected flash device.
Select the Perform Full Diagnostics checkbox to perform full diagnostics on a flashdevice.
NOTE
4. Click Done.
The Add Diagnostics Action dialog closes and the added diagnostics action appears in the Flash ProgrammerActions table in the Flash Programmer Task editor window.
3.11.2.3.5 Dump Flash actionsThe dump flash action allows you to dump selected sectors of a flash device or the entire flash device.
To add a dump flash action:
1. Choose Dump Flash Action from the Add Action pop-up menu.
The Add Dump Flash Action dialog appears.
2. Specify the file name in the File textbox. The flash is dumped in this selected file.
3. Choose the file type from the File Type pop-up menu. You can choose any one of the following file types:
• Srec: Saves files in Motorola S-record format.
• Binary: Saves files in binary file format.
4. Specify the memory range for which you want to add dump flash action.
• Enter the start address of the range in the Start textbox.
• Enter the end address of the range in the End textbox.
5. Click the Add Dump Flash Action button to add a dump flash action.
6. Click Done.
The Add Dump Flash Action dialog closes and the added dump flash action appear in the Flash ProgrammerActions table in the Flash Programmer Task editor window.
DebuggerFlash programmer
CodeWarrior Development Studio Common Features Guide, Rev. 10.x, 01/2016134 Freescale Semiconductor, Inc.

3.11.2.3.6 Protect/Unprotect actionsThe protect/unprotect actions allow you to change the protection of a sector in the flash device.
To add a protect/unprotect action:
1. Choose the Protect/Unprotect Action from the Add Action pop-up menu.
The Add Protect/Unprotect Action dialog appears.
2. Select a sector from the Sectors table and click the Add Protect Action button to add a protect operation onthe selected sector.
Press the Control or Shift key for selecting multiple sectors from the Sectors table.
NOTE
3. Click the Add Unprotect Action button to add an unprotect action on the selected sector.
4. Select the All Device checkbox to add action on full device.
5. Click Done.
The Add Protect/Unprotect Action dialog closes and the added protect or unprotect actions appear in theFlash Programmer Actions table in the Flash Programmer Task editor window.
3.11.2.3.7 Secure/Unsecure actionsThe secure/unsecure actions help you change the security of a flash device.
The Secure/Unsecure flash actions are not supported for StarCore devices.
NOTE
To add a secure/unsecure action:
1. Choose the Secure/Unsecure Action from the Add Action pop-up menu.
The Add Secure/UnSecure Action dialog appears.
2. Select a device from the Flash Devices table.
3. Click the Add Secure Action button to add Secure action on the selected flash device.
a. Enter password in the Password textbox.
b. Choose the password format from the Format pop-up menu.
4. Click the Add Unsecure Action button to add an unprotect action on the selected sector.
5. Click Done.
The Add Secure/UnSecure Action dialog closes and the added secure or unsecure action appears in theFlash Programmer Actions table in the Flash Programmer Task editor window.
3.11.2.3.8 Duplicate actionYou can duplicate a flash programmer action from the Flash Programmer Actions table.
1. Select the action in the Flash Programmer Actions table.
2. Click the Duplicate Action button.
The selected action is copied in the Flash Programmer Action table.
DebuggerFlash programmer
CodeWarrior Development Studio Common Features Guide, Rev. 10.x, 01/2016Freescale Semiconductor, Inc. 135

3.11.2.3.9 Remove actionYou can remove a flash programmer action from the Flash Programmer Actions table.
1. Select the action in the Flash Programmer Actions table.
2. Click the Remove Action button.
The selected action is removed from the Flash Programmer Action table.
3.11.3 Execute flash programmer target taskYou can execute the flash programmer tasks using the Target Tasks view.
To execute the configured flash programmer target task, select a target task and click the Execute button in theTarget Tasks view toolbar. Alternatively, right-click on a target task and choose Execute from the shortcut menu.
Figure 90: Execute target task
You can use predefined target tasks for supported boards. To load a predefined targettask, right-click in the Target Tasks view and choose Import Target Task from theshortcut menu. To save your custom tasks, right-click in the Target Tasks view and thenchoose Export Target Task from the shortcut menu.
NOTE
You can check the results of flash batch actions in the Console view. The green color indicates the success andthe red color indicates the failure of the task.
DebuggerFlash programmer
CodeWarrior Development Studio Common Features Guide, Rev. 10.x, 01/2016136 Freescale Semiconductor, Inc.

Figure 91: Console view
3.12 Flash File to TargetYou can use the Flash File to Target feature to perform flash operations such as erasing a flash device orprogramming a file.
You do not need any project for using Flash File to Target feature, only a valid Remote System is required.
To open the Flash File to Target dialog, click the Flash Programmer button on the IDE toolbar.
• Connection pop-up menu- Lists all run configurations defined in Eclipse. If a connection to the target hasalready been made the control becomes inactive and contains the text Active Debug Configuration.
• Flash Configuration File pop-up menu - Lists predefined target tasks for the processor selected in theLaunch Configuration and tasks added by user with the Browse button. The items in this pop-up menu areupdated based on the processor selected in the launch configuration. For more information on launchconfigurations, see product's Targeting Manual.• Unprotect flash memory before erase checkbox - Select to unprotect flash memory before erasing the
flash device. This feature allows you to unprotect the flash memory from Flash File To Target dialog.
• File to Flash group - Allows selecting the file to be programmed on the flash device and the location.
• File textbox - Used for specifying the filename. You can use the Workspace, File System, or Variablesbuttons to select the desired file.
• Offset:0x textbox - Used for specifying offset location for a file. If no offset is specified the default value ofzero is used. The offset is always added to the start address of the file. If the file does not contain addressinformation then zero is considered as start address.
• Save as Target Task - Select to enable Task Name textbox.
• Task Name textbox - Lets you to save the specified settings as a Flash target task. Use the testbox tospecify the name of the target task.
• Erase Whole Device button - Erases the flash device. In case you have multiple flash blocks on the device,all blocks are erased. If you want to selectively erase or program blocks, use the Flash programmer onpage 127 feature.
DebuggerFlash File to Target
CodeWarrior Development Studio Common Features Guide, Rev. 10.x, 01/2016Freescale Semiconductor, Inc. 137

• Erase and Program button - Erases the sectors that are occupied with data and then programs the file. Ifthe flash device can not be accessed at sector level then the flash device is completely erased.
This feature helps you perform these basic flash operations:
• Erasing flash device on page 138
• Programming a file on page 138
3.12.1 Erasing flash deviceThis topic explains how to erase a flash device.
To erase a flash device, follow these steps:
1. Click the Flash Programmer button on the IDE toolbar.
The Flash File to Target dialog appears.
2. Choose a connection from the Connection pop-up menu.
If a connection is already established with the target, this control is disabled.
NOTE
The Flash Configuration File pop-up menu is updated with the supported configurations for the processorfrom the launch configuration.
3. Choose a flash configuration from the Flash Configuration File pop-up menu.
4. Select the Unprotect flash memory before erase checkbox to unprotect flash memory before erasing theflash device.
5. Click the Erase Whole Device button.
3.12.2 Programming a fileThis topic explains how to program a file using Falsh prgrammer.
1. Click the Flash Programmer button on the IDE toolbar.
The Flash File to Target dialog appears.
2. Choose a connection from the Connection pop-up menu.
If a connection is already established with the target, this control is disabled.
NOTE
The Flash Configuration File pop-up menu is updated with the supported configurations for the processorfrom the launch configuration.
3. Choose a flash configuration from the Flash Configuration File pop-up menu.
4. Select the Unprotect flash memory before erase checkbox to unprotect flash memory before erasing theflash device.
5. Type the file name in the File textbox. You can use the Workspace, File System, or Variables buttons toselect the desired file.
6. Type the offset location in the Offset textbox.
7. Click the Erase and Program button.
DebuggerFlash File to Target
CodeWarrior Development Studio Common Features Guide, Rev. 10.x, 01/2016138 Freescale Semiconductor, Inc.

3.13 Hardware diagnosticsThe Hardware Diagnostics utility lets you run a series of diagnostic tests that determine if the basic hardwareis functional.
These tests include:
• Memory read/write: This test only makes a read or write access to the memory to read or write a byte, word(2 bytes) and long word (4 bytes) to or from the memory. For this task, the user needs to set the options inthe Memory Access group.
• Scope loop: This test makes read and write accesses to memory in a loop at the target address. The timebetween accesses is given by the loop speed settings. The loop can only be stopped by the user, whichcancels the test. For this type of test, the user needs to set the memory access settings and the loop speed.
• Memory tests: This test requires the user to set the access size and target address from the access settingsgroup and the settings present in the Memory Tests group.
This topic contains the following sub-topics:
• Creating hardware diagnostics task on page 139
• Working with Hardware Diagnostic Action editor on page 140
• Memory test use cases on page 145
3.13.1 Creating hardware diagnostics taskYou can create a hardware diagnostic task using the Create New Target Task wizard.
To create a task for hardware diagnostics:
1. Choose Window > Show View > Other from the IDE menu bar.
The Show View dialog appears.
2. Expand the Debug group and select Target Tasks.
3. Click OK.
4. Click the Create a new Target Task button on the Target Tasks view toolbar. Alternatively, right-click in theTarget Tasks view and choose New Task from the shortcut menu.
The Create a New Target Task wizard appears.
5. Type name for the new task in the Task Name textbox.
6. Choose a launch configuration from the Run Configuration pop-up menu.
If the task does not successfully launch the configuration that you specify, the Executebutton on the Target Tasks view toolbar stays unavailable.
NOTE
7. Choose Hardware Diagnostic from the Task Type pop-up menu.
8. Click Finish.
A new hardware diagnostic task is created in the Target Tasks view.
You can perform various actions on a hardware diagnostic task, such as renaming,deleting, or executing the task, using the shortcut menu that appears on right-clickingthe task in the Target tasks view.
NOTE
DebuggerHardware diagnostics
CodeWarrior Development Studio Common Features Guide, Rev. 10.x, 01/2016Freescale Semiconductor, Inc. 139

3.13.2 Working with Hardware Diagnostic Action editorThe Hardware Diagnostic Action editor is used to configure a hardware diagnostic task.
To open the Hardware Diagnostic Action editor for a particular task, double-click the task in the Target Tasksview.
The following figure shows the Hardware Diagnostics Action editor.
Figure 92: Hardware Diagnostics Action editor
The Hardware Diagnostics Action editor window includes the following groups:
• Action Type on page 140
• Memory Access on page 141
• Loop Speed on page 141
• Memory Tests on page 142
3.13.2.1 Action TypeThe Action Type group in the Hardware Diagnostics Action editor window is used for selecting the action type.
You can choose any one of the following actions:
• Memory read/write - Enables the options in the Memory Access group.
• Scope loop - Enables the options in the Memory Access and the Loop Speed groups.
• Memory test - Enables the access size and target address from the access settings group and the settingspresent in the Memory Tests group.
DebuggerHardware diagnostics
CodeWarrior Development Studio Common Features Guide, Rev. 10.x, 01/2016140 Freescale Semiconductor, Inc.

3.13.2.2 Memory AccessThe Memory Access pane configures diagnostic tests for performing memory reads and writes over theremote connection interface.
The table below lists and describes the items in the pane.
Table 11: Memory Access Pane Items
Item Description
Read Select to have the hardware diagnostic tools perform read tests.
Write Select to have the hardware diagnostic tools perform write tests.
1 unit Select to have the hardware diagnostic tools perform one memory unit access sizeoperations.
2 units Select to have the hardware diagnostic tools perform two memory units access sizeoperations.
4 units Select to have the hardware diagnostic tools perform four memory units access sizeoperations.
Target Address Specify the address of an area in RAM that the hardware diagnostic tools shouldanalyze. The tools must be able to access this starting address through the remoteconnection (after the hardware initializes).
Value Specify the value that the hardware diagnostic tools write during testing. Select theWrite option to enable this textbox.
Verify Memory Writes Select the checkbox to verify success of each data write to the memory.
3.13.2.3 Loop SpeedThe Loop Speed pane configures diagnostic tests for performing repeated memory reads and writes over theremote connection interface.
The tests repeat until you stop them. By performing repeated read and write operations, you can use a scopeanalyzer or logic analyzer to debug the hardware device. After the first 1000 operations, the Status shows theestimated time between operations.
For all values of Speed, the time between operations depends heavily on the processingspeed of the host computer.
NOTE
For Read operations, the Scope Loop test has an additional feature. During the first read operation, the hardwarediagnostic tools store the value read from the hardware. For all successive read operations, the hardwarediagnostic tools compare the read value to the stored value from the first read operation. If the Scope Loop testdetermines that the value read from the hardware is not stable, the diagnostic tools report the number of timesthat the read value differs from the first read value. Following table lists and describes the items in Loop Speedpane.
DebuggerHardware diagnostics
CodeWarrior Development Studio Common Features Guide, Rev. 10.x, 01/2016Freescale Semiconductor, Inc. 141

Table 12: Loop Speed Pane Items
Item Description
Set Loop Speed Enter a numeric value between 0 to 1000 in the textbox to adjust the speed.You can also move the slider to adjust the speed at which the hardwarediagnostic tools repeat successive read and write operations. Lower speedsincrease the delay between successive operations. Higher speeds decreasethe delay between successive operations.
3.13.2.4 Memory TestsThe Memory Tests pane lets you perform three hardware tests, Walking Ones, Bus Noise, and Address.
You can specify any combination of tests and number of passes to perform. For each pass, the hardwarediagnostic tools performs the tests in turn, until all passes are complete. The tools compare memory test failuresand display them in a log window after all passes are complete. Errors resulting from memory test failures donot stop the testing process; however, fatal errors immediately stop the testing process.
The following table explains the items in the Memory Tests pane.
Table 13: Memory Tests pane items
Item Explanation
Walking 1's Select the checkbox to have the hardware diagnostic tools perform the WalkingOnes on page 143 test. Deselect to have the diagnostic tools skip the WalkingOnes on page 143 test.
Address Select to have the hardware diagnostic tools perform the Address on page 143test. Deselect to have the diagnostic tools skip the Address on page 143 test.
Bus Noise Select to have the hardware diagnostic tools perform the Bus noise on page 144test. Deselect to have the diagnostic tools skip the Bus noise on page 144 test.
Test Area Size Specify the size of memory to be tested. This setting along with Target Addressdefines the memory range being tested.
Number of Passes Enter the number of times that you want to repeat the specified tests.
Use Target CPU Select to have the hardware diagnostic tools download the test code to thehardware device. Deselect to have the hardware diagnostic tools execute the testcode through the remote connection interface. Execution performance improvesgreatly if you execute the test code on the hardware CPU, but requires that thehardware has enough stability and robustness to execute the test code.
The option is not applicable for CodeWarrior StarCoredevices.
NOTE
Download Algorithm toAddress
Specify the address where the test driver is downloaded in case the Use targetCPU is selected.
The option is not applicable for CodeWarrior StarCoredevices.
NOTE
This section includes:
DebuggerHardware diagnostics
CodeWarrior Development Studio Common Features Guide, Rev. 10.x, 01/2016142 Freescale Semiconductor, Inc.

• Walking Ones on page 143
• Address on page 143
• Bus noise on page 144
• Address lines on page 144
• Data lines on page 145
3.13.2.4.1 Walking OnesThis section provides details on the Walking Ones test.
This test detects these memory faults:
• Address Line: The board or chip address lines are shorting or stuck at 0 or 1. Either condition could result inerrors when the hardware reads and writes to the memory location. Because this error occurs on anaddress line, the data may end up in the wrong location on a write operation, or the hardware may accessthe wrong data on a read operation.
• Data Line: The board or chip data lines are shorting or stuck at 0 or 1. Either condition could result incorrupted values as the hardware transfers data to or from memory.
• Retention: The contents of a memory location change over time. The effect is that the memory fails to retainits contents over time.
The Walking Ones test includes four sub-tests:
• Walking Ones: This subtest first initializes memory to all zeros. Then the subtest writes, reads, and verifiesbits, with each bit successively set from the least significant bit (LSB) to the most significant bit (MSB). Thesubtest configures bits such that by the time it sets the MSB, all bits are set to a value of 1. This patternrepeats for each location within the memory range that you specify. For example, the values for a byte-based Walking Ones subtest occur in this order:
0x01, 0x03, 0x07, 0x0F, 0x1F, 0x3F, 0x7F, 0xFF
• Ones Retention: This subtest immediately follows the Walking Ones subtest. The Walking Ones subtestshould leave each memory location with all bits set to 1. The Ones Retention subtest verifies that eachlocation has all bits set to 1.
• Walking Zeros: This subtest first initializes memory to all ones. Then the subtest writes, reads, and verifiesbits, with each bit successively set from the LSB to the MSB. The subtest configures bits such that by thetime it sets the MSB, all bits are set to a value of 0. This pattern repeats for each location within the memoryrange that you specify. For example, the values for a byte-based Walking Zeros subtest occur in this order:
0xFE, 0xFC, 0xF8, 0xF0, 0xE0, 0xC0, 0x80, 0x00
• Zeros Retention: This subtest immediately follows the Walking Zeros subtest. The Walking Zeros subtestshould leave each memory location with all bits set to 0. The Zeros Retention subtest verifies that eachlocation has all bits set to 0.
3.13.2.4.2 AddressThis section provides details on the Address test. This test detects memory aliasing.
Memory aliasing exists when a physical memory block repeats one or more times in a logical memory space.Without knowing about this condition, you might conclude that there is much more physical memory than whatactually exists.
DebuggerHardware diagnostics
CodeWarrior Development Studio Common Features Guide, Rev. 10.x, 01/2016Freescale Semiconductor, Inc. 143

The address test uses a simplistic technique to detect memory aliasing. The test writes sequentially increasingdata values (starting at one and increasing by one) to each successive memory location. The maximum datavalue is a prime number and its specific value depends on the addressing mode so as to not overflow the memorylocation.
The test uses a prime number of elements to avoid coinciding with binary math boundaries:
• For byte mode, the maximum prime number is 28-5 or 251.
• For word mode, the maximum prime number is 216-15 or 65521.
• For long word mode, the maximum prime number is 232-5 or 4294967291.
If the test reaches the maximum value, the value rolls over to 1 and starts incrementing again. This sequentialpattern repeats throughout the memory under test. Then the test reads back the resulting memory and verifiesit against the written patterns. Any deviation from the written order could indicate a memory aliasing condition.
3.13.2.4.3 Bus noiseThis test stresses on the memory system by causing many bits to flip from one memory access to the next(both addresses and data values).
Bus noise occurs when many bits change consecutively from one memory access to another. This conditioncan occur on both address and data lines.
3.13.2.4.4 Address linesThis section provides details on the Address lines test.
To force bit flips in address lines, the test uses three approaches:
• Sequential- This approach works sequentially through all of the memory under test, from lowest address tohighest address. This sequential approach results in an average number of bit flips from one access to thenext.
• Full Range Converging- This approach works from the fringes of the memory range toward the middle of thememory range. Memory access proceeds in this pattern, where + number and - number indicate the nextitem location (the specific increment or decrement depends on byte, word, or long word address mode):
• the lowest address
• the highest address
• (the lowest address) + 1
• (the highest address) - 1
• (the lowest address) + 2
• (the highest address) - 2
• Maximum Invert Convergence- This approach uses calculated end point addresses to maximize the numberof bits flipping from one access to the next. This approach involves identifying address end points such thatthe values have the maximum inverted bits relative to one another. Specifically, the test identifies the lowestaddress with all 0x5 values in the least significant nibbles and the highest address with all 0xA values inthe least significant nibbles. After the test identifies these end points, memory access alternates betweenlow address and high address, working towards the center of the memory under test. Accessing memory inthis manner, the test achieves the maximum number of bits flips from one access to the next.
DebuggerHardware diagnostics
CodeWarrior Development Studio Common Features Guide, Rev. 10.x, 01/2016144 Freescale Semiconductor, Inc.

3.13.2.4.5 Data linesThis section provides details on the Data Lines test.
To force bit flips in data lines, the test uses two sets of static data, a pseudo-random set and a fixed-pattern set.Each set contains 31 elements-a prime number. The test uses a prime number of elements to avoid coincidingwith binary math boundaries. The sets are unique to each addressing mode so as to occupy the full range ofbits.
• The test uses the pseudo-random data set to stress the data lines in a repeatable but pattern-less fashion.
• The test uses the fixed-pattern set to force significant numbers of data bits to flip from one access to thenext.
The sub-tests execute similarly in that each subtest iterates through static data, writing values to memory. Thetest combines the three address line approaches with the two data sets to produce six unique sub-tests:
• Sequential with Random Data
• Sequential with Fixed Pattern Data
• Full Range Converging with Random Data
• Full Range Converging with Fixed Pattern Data
• Maximum Invert Convergence with Random Data
• Maximum Invert Convergence with Fixed Pattern Data
3.13.3 Memory test use casesMemory tests are the complex tests that can be executed in two modes: Host based and Target baseddepending upon the selection made for the Use Target CPU checkbox.
The memory read /write and scope loop tests are host based tests. The host machine issues read and writeaction to the memory through the connection protocol. For example CCS.
• Selected: Target Based
• Deselected: Host Based
The Host Based tests are slower than the Target Based tests.
This section explains the following use case scenerios:
• Use Case 1: Execute host-based Scope Loop on target on page 145
• Use Case 2: Execute target-based Memory Tests on target on page 146
3.13.3.1 Use Case 1: Execute host-based Scope Loop on targetThis use case scenerio explains the steps required to execute the host based scope loop on the target.
Perform the following steps:
1. Select Scope loop in the Action Type.
2. Set Memory Access settings from the Memory Access section.
3. Set the speed used for the scope loop diagnostic from the Loop Speed section.
4. Save the settings.
5. Press Execute to execute the action.
DebuggerHardware diagnostics
CodeWarrior Development Studio Common Features Guide, Rev. 10.x, 01/2016Freescale Semiconductor, Inc. 145

3.13.3.2 Use Case 2: Execute target-based Memory Tests on targetThis use case scenerio explains the steps required to execute the target based memory test on the target.
Perform the following steps:
1. Select Memory Test in the Action Type.
2. Specify Target Address and Access Size settings from the Memory Access section.
3. Specify the following settings for Memory Tests section:
• Test Area Size: The tested memory region is computed from Target Address until Target Address + TestArea Size.
• Tests to Run: Select tests to run on the target.
• Number of passes: Specify number of times a test will be executed.
• Use Target CPU: set the Address to which the test driver (algorithm) is to be downloaded.
4. Save the settings.
5. Press Execute to execute the action.
3.14 Import/Export/Fill memoryThe Import/Export/Fill Memory utility lets you export memory contents to a file and import data from a file intomemory.
The utility also supports filling memory with a user provided data pattern.
This section explain the following topics:
• Creating task for import/export/fill memory on page 146
• Importing data into memory on page 148
• Exporting memory to file on page 150
• Fill memory on page 152
3.14.1 Creating task for import/export/fill memoryYou can use the Import/Export/Fill Memory utility to perform various tasks on memory.
The utility can be accessed from the Target Tasks view.
To open the Target Tasks view:
1. Choose Window > Show View > Other from the IDE menu bar.
The Show View dialog appears.
2. Expand the Debug group.
3. Select Target Tasks.
4. Click OK.
The first time it opens, the Target Tasks view contains no tasks. You must create a task to use the Import/Export/Fill Memory utility.
To create a task:
1. Click the Create a new Target Task button on the toolbar of the Target Tasks view. Alternatively, right-clickthe left-hand list of tasks and choose New Task from the shortcut menu that appears.
DebuggerImport/Export/Fill memory
CodeWarrior Development Studio Common Features Guide, Rev. 10.x, 01/2016146 Freescale Semiconductor, Inc.
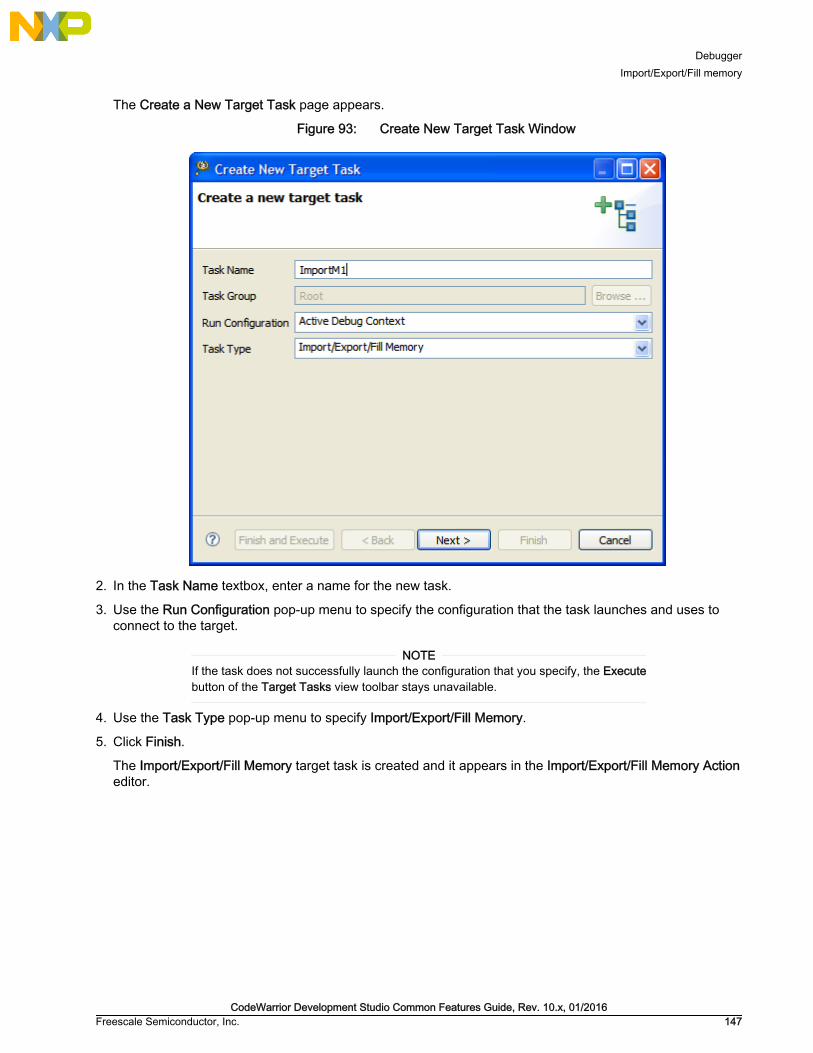
The Create a New Target Task page appears.
Figure 93: Create New Target Task Window
2. In the Task Name textbox, enter a name for the new task.
3. Use the Run Configuration pop-up menu to specify the configuration that the task launches and uses toconnect to the target.
If the task does not successfully launch the configuration that you specify, the Executebutton of the Target Tasks view toolbar stays unavailable.
NOTE
4. Use the Task Type pop-up menu to specify Import/Export/Fill Memory.
5. Click Finish.
The Import/Export/Fill Memory target task is created and it appears in the Import/Export/Fill Memory Actioneditor.
DebuggerImport/Export/Fill memory
CodeWarrior Development Studio Common Features Guide, Rev. 10.x, 01/2016Freescale Semiconductor, Inc. 147

Figure 94: Import/Export Memory Action editor
3.14.2 Importing data into memoryYou can import the encoded data from a user specified file, decode it, and copy it into a user specifiedmemory range.
Select the Import memory option from the Import/Export/Fill Memory Action editor to import data into memory.
DebuggerImport/Export/Fill memory
CodeWarrior Development Studio Common Features Guide, Rev. 10.x, 01/2016148 Freescale Semiconductor, Inc.

Figure 95: Import/Export Memory Action editor - Importing data into memory
The following table explains the import memory options.
Table 14: Controls used for importing data into memory
Item Explanation
Memory space and address Enter the literal address and memory space on which the data transfer isperformed. The Literal address field allows only decimal and hexadecimalvalues.
Expression Enter the memory address or expression at which the data transfer starts.
Access Size Denotes the number of addressable units of memory that the debuggeraccesses in transferring one data element. The default values shown are 1,2, and 4 units. When target information is available, this list shall be filteredto display the access sizes that are supported by the target.
Select file Enter the path to the file that contains the data to be imported. Click theWorkspace button to select a file from the current project workspace. Clickthe System button to select a file from the file system the standard File Opendialog. Click the Variables button to select a build variable.
Table continues on the next page...
DebuggerImport/Export/Fill memory
CodeWarrior Development Studio Common Features Guide, Rev. 10.x, 01/2016Freescale Semiconductor, Inc. 149

Table 14: Controls used for importing data into memory (continued)
Item Explanation
File Type Defines the format in which the imported data is encoded. By default, thefollowing file types are supported:
• Signed decimal Text
• Unsigned decimal Text
• Motorola S-Record format
• Hex Text
• Annotated Hex Text
• Raw Binary
Number of Elements Enter the total number of elements to be transferred.
Verify Memory Writes Select the checkbox to verify success of each data write to the memory.
3.14.3 Exporting memory to fileYou can read data from a user specified memory range, encode it in a user specified format, and store thisencoded data in a user specified output file.
Select the Export memory option from the Import/Export/Fill Memory Action editor to export memory to a file.
DebuggerImport/Export/Fill memory
CodeWarrior Development Studio Common Features Guide, Rev. 10.x, 01/2016150 Freescale Semiconductor, Inc.

Figure 96: Exporting memory
The following table explains the export memory options.
Table 15: Controls used for exporting data from memory into file
Item Explanation
Memory space and address Enter the literal address and memory space on which the data transfer isperformed. The Literal address field allows only decimal and hexadecimalvalues.
Expression Enter the memory address or expression at which the data transfer starts.
Access Size Denotes the number of addressable units of memory that the debuggeraccesses in transferring one data element. The default values shown are 1,2, and 4 units. When target information is available, this list shall be filteredto display the access sizes that are supported by the target.
Select file Enter the path of the file to write data. Click the Workspace button to selecta file from the current project workspace. Click the System button to select afile from the file system the standard File Open dialog. Click the Variablesbutton to select a build variable.
Table continues on the next page...
DebuggerImport/Export/Fill memory
CodeWarrior Development Studio Common Features Guide, Rev. 10.x, 01/2016Freescale Semiconductor, Inc. 151

Table 15: Controls used for exporting data from memory into file (continued)
Item Explanation
File Type Defines the format in which encoded data is exported. By default, thefollowing file types are supported:
• Signed decimal Text
• Unsigned decimal Text
• Motorola S-Record format
• Hex Text
• Annotated Hex Text
• Raw Binary
Number of Elements Enter the total number of elements to be transferred.
3.14.4 Fill memoryYou can fill a user specified memory range with a user specified data pattern.
Select the Fill memory option from the Import/Export/Fill Memory Action editor window to fill memory.
Figure 97: Fill memory
The following table explains the fill memory options.
DebuggerImport/Export/Fill memory
CodeWarrior Development Studio Common Features Guide, Rev. 10.x, 01/2016152 Freescale Semiconductor, Inc.
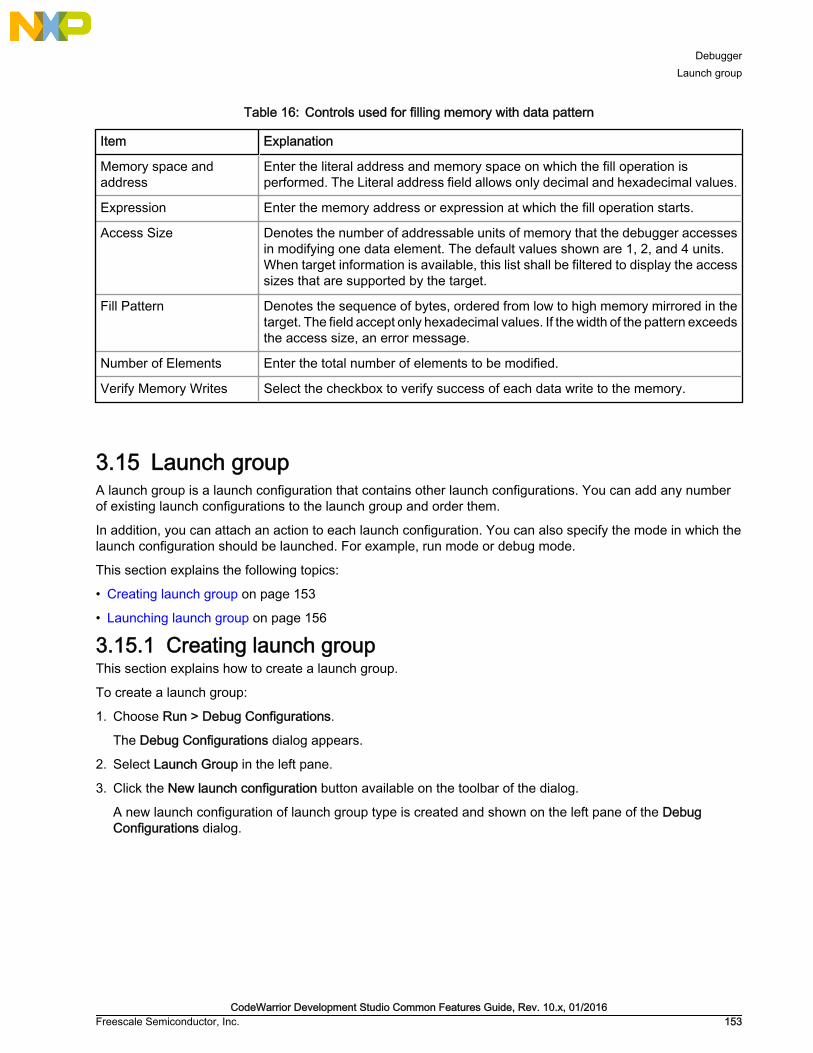
Table 16: Controls used for filling memory with data pattern
Item Explanation
Memory space andaddress
Enter the literal address and memory space on which the fill operation isperformed. The Literal address field allows only decimal and hexadecimal values.
Expression Enter the memory address or expression at which the fill operation starts.
Access Size Denotes the number of addressable units of memory that the debugger accessesin modifying one data element. The default values shown are 1, 2, and 4 units.When target information is available, this list shall be filtered to display the accesssizes that are supported by the target.
Fill Pattern Denotes the sequence of bytes, ordered from low to high memory mirrored in thetarget. The field accept only hexadecimal values. If the width of the pattern exceedsthe access size, an error message.
Number of Elements Enter the total number of elements to be modified.
Verify Memory Writes Select the checkbox to verify success of each data write to the memory.
3.15 Launch groupA launch group is a launch configuration that contains other launch configurations. You can add any numberof existing launch configurations to the launch group and order them.
In addition, you can attach an action to each launch configuration. You can also specify the mode in which thelaunch configuration should be launched. For example, run mode or debug mode.
This section explains the following topics:
• Creating launch group on page 153
• Launching launch group on page 156
3.15.1 Creating launch groupThis section explains how to create a launch group.
To create a launch group:
1. Choose Run > Debug Configurations.
The Debug Configurations dialog appears.
2. Select Launch Group in the left pane.
3. Click the New launch configuration button available on the toolbar of the dialog.
A new launch configuration of launch group type is created and shown on the left pane of the DebugConfigurations dialog.
DebuggerLaunch group
CodeWarrior Development Studio Common Features Guide, Rev. 10.x, 01/2016Freescale Semiconductor, Inc. 153

Figure 98: Launch Group Configuration pane controls
Table 17: Launch Group Configuration Pane Controls
Control Description
Name Specify a name for the launch group
Up button Click to move up the selected launch configuration
Down button Click to move down the selected launch configuration
Edit button Click to edit the selected entry in the launch group
Add button Click to add a launch configuration to the launch group
Remove button Click to remove a launch configuration from the launch group
4. Specify a name for the launch group configuration in the Name textbox.
5. Click Add.
The Add Launch Configuration dialog appears.
DebuggerLaunch group
CodeWarrior Development Studio Common Features Guide, Rev. 10.x, 01/2016154 Freescale Semiconductor, Inc.

Figure 99: Add Launch Configuration dialog
Table 18: Add Launch Configuration dialog options
Option Description
Launch Mode Allows you to specify launch mode for the selected launch configuration. Thiscan also be used to filter launch configurations.
• debug - specifies that the launch configuration will be launched in debugmode.
• run - specifies that the launch configuration will be launched in run mode.
• profile - specifies that the launch configuration will be launched in profile mode.
Use default mode whenlaunching
Selecting this checkbox indicates that the child launch configuration should belaunched in the mode used to initiate the launch group launch.
Post launch action Allows you to specify a post launch action for the selected launch configuration.
• None - the debugger immediately moves on to launch the next launchconfiguration.
• Wait until terminated - the debugger waits indefinitely until the debug sessionspawned by the last launch terminates and then it moves on to the next launchconfiguration.
• Delay - the debugger waits for specified number of seconds before moving onto the next launch configuration.
6. To add a launch configuration to the launch group:
DebuggerLaunch group
CodeWarrior Development Studio Common Features Guide, Rev. 10.x, 01/2016Freescale Semiconductor, Inc. 155
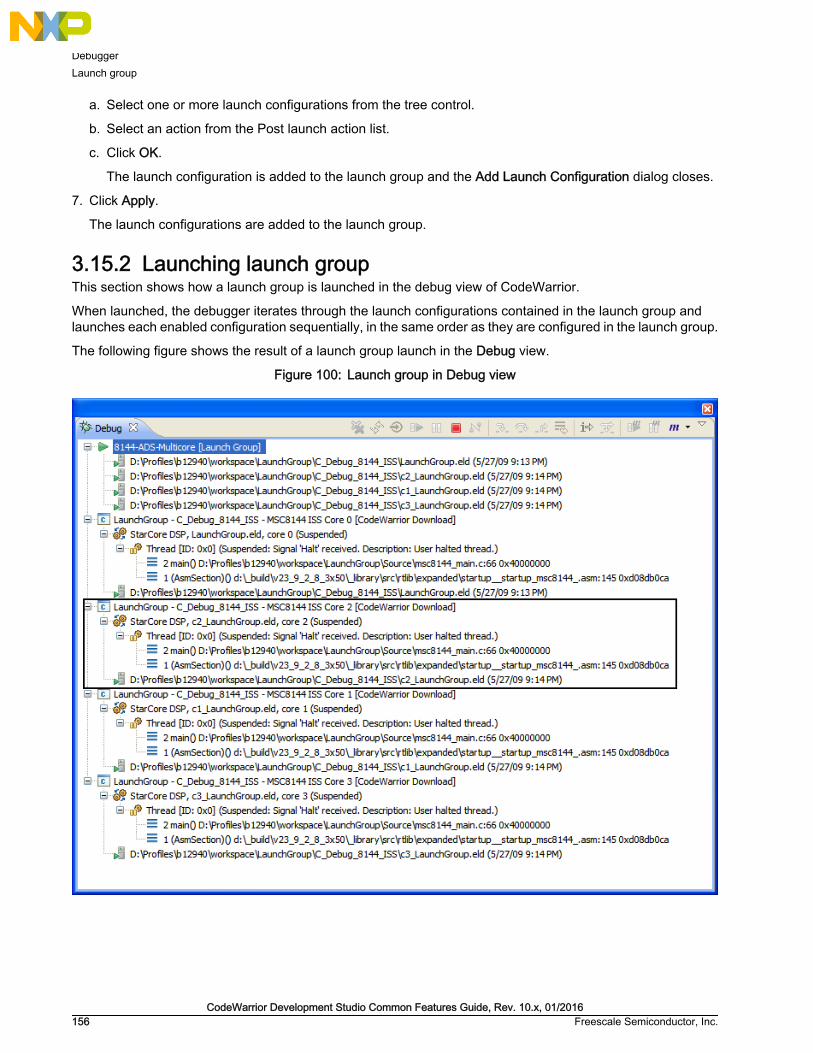
a. Select one or more launch configurations from the tree control.
b. Select an action from the Post launch action list.
c. Click OK.
The launch configuration is added to the launch group and the Add Launch Configuration dialog closes.
7. Click Apply.
The launch configurations are added to the launch group.
3.15.2 Launching launch groupThis section shows how a launch group is launched in the debug view of CodeWarrior.
When launched, the debugger iterates through the launch configurations contained in the launch group andlaunches each enabled configuration sequentially, in the same order as they are configured in the launch group.
The following figure shows the result of a launch group launch in the Debug view.
Figure 100: Launch group in Debug view
DebuggerLaunch group
CodeWarrior Development Studio Common Features Guide, Rev. 10.x, 01/2016156 Freescale Semiconductor, Inc.

3.16 Load multiple binariesThe CodeWarrior debugger supports loading multiple binaries(.elf) to make the symbols and source code ofother executable available within a debugging session.
To load multiple binary files within a debugging session:
1. Click Run > Debug Configurations.
The Debug Configurations dialog appears. The left side of this dialog has a list of debug configurations thatapply to the current application.
2. Expand the CodeWarrior configuration and select the debug configuration that you want to modify.
The following figure shows the Debug Configurations dialog with the settings for the debug configuration youselected.
Figure 101: Debug Configurations dialog
3. Click the Debugger tab to view the corresponding debugger settings page.
4. Click the Other Executables tab under the Debugger Options pane.
DebuggerLoad multiple binaries
CodeWarrior Development Studio Common Features Guide, Rev. 10.x, 01/2016Freescale Semiconductor, Inc. 157

5. Click Add to open the Debug Other Executable dialog.
The Debug Other Executable dialog allows you to specify additional ELF files to download or debug in additionto the main executable file associated with the launch configuration.
Figure 102: Debug Other Executable
6. Enter the path to the additional executable file that the debugger controls in addition to the current project'sexecutable file. Alternatively, click the Browse button to specify the file path.
7. Select the Load Symbols checkbox to have the debugger load symbols for the specified file. Deselect toprevent the debugger from loading the symbols. The Debug column of the File list corresponds to thissetting.
8. Select the Download to Device checkbox to have the debugger download the specified file to the targetdevice. Deselect this checkbox to prevent the debugger from downloading the file to the device. TheDownload column of the File list corresponds to this setting.
9. Click OK to add the additional executable to the Other Executables file list.
10.Click Debug to launch a debug session with multiple binaries.
Multiple binary files within a debugging session are now available.
This section includes the following topic:
• Viewing binaries on page 158
3.16.1 Viewing binariesThe Modules view shows the application executable and all shared libraries loaded by the application during adebug session.
In addition to the current project's executable file, the Modules view shows the other executables listed in theOther Executables pane (see Load multiple binaries on page 157).
To view the executables loaded during a debug session:
1. Choose Window > Show View > Modules from the IDE menu bar.
The Modules view appears.
DebuggerLoad multiple binaries
CodeWarrior Development Studio Common Features Guide, Rev. 10.x, 01/2016158 Freescale Semiconductor, Inc.

Figure 103: Modules view
2. Click on the application executable to view its details.
An executable can also be expanded in the Modules view (to shows its symbols) regardless of whether theexecutable has been targeted or not in the Debug Other Executable dialog.
3. An executable that is not marked to be targeted at launch time can be forced to be targeted at any timeduring the debug session by choosing Load Symbols from the shortcut menu that appears on right-clickingthe executable. The menu command will not be available if the executable is already targeted.
All executables listed in the Other Executables pane are added to the Modules viewwhether or not they are marked to be targeted or downloaded.
NOTE
3.17 Memory viewThe Memory view lets you monitor and modify your process memory.
The process memory is presented as a list called memory monitors. Each monitor represents a section ofmemory specified by its location called base address. Each memory monitor can be displayed in differentpredefined data formats known as memory renderings.
The debugger supports the following rendering types:
• Hex Integer
• Hexadecimal (default)
• ASCII
• Signed integer
• Unsigned integer
• Traditional
• Mixed Source
• Disassembly
DebuggerMemory view
CodeWarrior Development Studio Common Features Guide, Rev. 10.x, 01/2016Freescale Semiconductor, Inc. 159

• Floating Point
• Fixed Point
The default rendering is displayed automatically when a monitor is created.
The Memory view contains these two panes:
• Monitors - Displays the list of memory monitors added to the debug session currently selected in the Debugview
• Renderings - Displays memory renderings.
The content of the Renderings pane is controlled by the selection in the Monitors pane. The Renderings panecan be configured to display two renderings simultaneously.
This section includes the following topics:
• Opening Memory view on page 160
• Adding memory monitor on page 160
• Adding memory renderings on page 162
• Mixed source rendering on page 163
• Setting memory access size on page 164
• Exporting memory on page 164
• Importing memory on page 165
• Setting watchpoint in Memory view on page 166
• Clearing watchpoints from Memory view on page 166
3.17.1 Opening Memory viewTo open the Memory view, choose Window > Show View > Memory from the IDE menu bar.
The following figure shows the memory view.
Figure 104: Memory view
3.17.2 Adding memory monitorThis topic explains the steps required to add a memoy monitor.
To add a memory monitor to Memory view:
1. Start a debugging session.
DebuggerMemory view
CodeWarrior Development Studio Common Features Guide, Rev. 10.x, 01/2016160 Freescale Semiconductor, Inc.

2. Click the Memory tab.
The Memory view appears.
3. In the Monitors pane toolbar, click the plus-sign (+) icon. Alternatively, right-click a blank area in theMonitors pane and choose Add Memory Monitor from the shortcut menu.
The Monitor Memory dialog appears.
Figure 105: Monitor Memory dialog
4. Specify information about the memory monitor:
• To enter a memory space and literal address, enter an address.
• To enter an expression, type in the expression. If you enter a literal address as the expression, use theprefix 0x to indicate hexadecimal notation, or use no prefix to indicate decimal notation. You can use theavailable pop-up menu to choose a previously specified expression.
If you do not select a memory space and the expression does not contain a memoryspace then the memory space is set to default data memory space that is specific foreach architecture
NOTE
5. If you want to translate the memory address or the expression to another memory space, select theMemory space checkbox.
The Memory space pop-up menu becomes available.
6. Choose one of the following values from the Memory space pop-up menu.
• Physical - Indicates that the specified address or expression refers to physical memory space.
• Data - Indicates that the specified address or expression refers to data memory space.
• Program - Indicates that the specified address or expression refers to program memory space.
7. Click OK.
The memory monitor is added to the Monitors pane and the default rendering is displayed in the Renderingspane.
DebuggerMemory view
CodeWarrior Development Studio Common Features Guide, Rev. 10.x, 01/2016Freescale Semiconductor, Inc. 161

Figure 106: Added memory monitor
3.17.3 Adding memory renderingsThis section provides details on adding memory rendering. When you add a variable, expression, or registerto the Memory view, you can do so multiple times, each time adding a new (or the same) rendering.
Alternatively, once you have added a memory monitor and rendering, you can go to the Renderings pane andclick Add Rendering(s) . This will prompt you with a dialog to select the rendering that you want to add to theview. In this dialog, you can select more than one rendering by using the Shift or Control key. This will cause arendering to be opened for each rendering format that is selected. When you add multiple memory renderings,they are separated by tabs.
For more details on opening the Memory view and adding memory monitors, see Adding memory monitor onpage 160.
You can also split the Memory Renderings pane by clicking the Toggle Split Pane icon in the Memory viewtoolbar. When the Memory Renderings pane is split, you can view two renderings side-by-side.
When you have multiple memory renderings for a memory monitor, you can set the renderings to be linked withone another. To do this, click the Link Memory Rendering Panes icon in the toolbar. When renderings are linked,they are synchronized with each other (for example, if you change the column size in one rendering, the columnsize in the other rendering will also change - or if you scroll or move the cursor in one rendering, the otherrendering will scroll or follow the same cursor movement). Linking memory renderings only applies to the currentMemory view. If you have multiple Memory views open, they do not link to each other.
To remove a rendering, select it in the Memory Renderings pane, right-click and choose Remove Renderingfrom the shortcut menu. When you remove all memory renderings for a monitored expression, variable, orregister, the Memory Renderings pane will be populated with the memory rendering selection list. From this list,you can select the data format that you want to use for the memory rendering and click the Add Rendering(s)button.
DebuggerMemory view
CodeWarrior Development Studio Common Features Guide, Rev. 10.x, 01/2016162 Freescale Semiconductor, Inc.
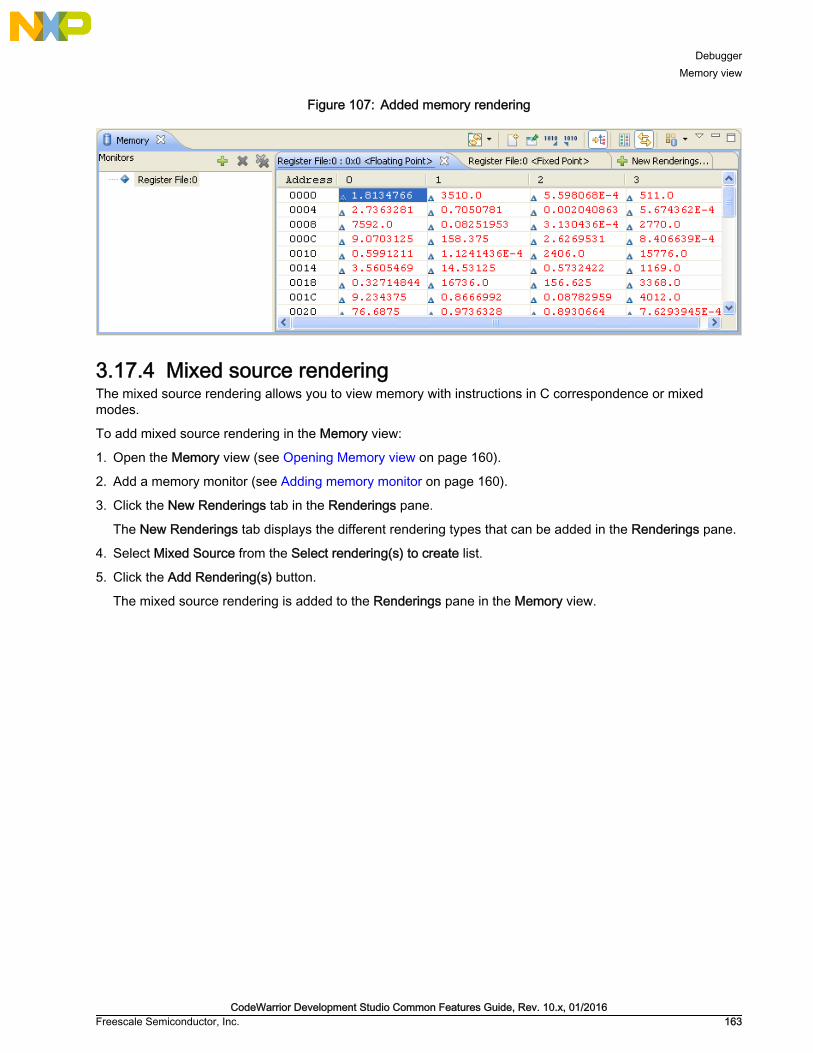
Figure 107: Added memory rendering
3.17.4 Mixed source renderingThe mixed source rendering allows you to view memory with instructions in C correspondence or mixedmodes.
To add mixed source rendering in the Memory view:
1. Open the Memory view (see Opening Memory view on page 160).
2. Add a memory monitor (see Adding memory monitor on page 160).
3. Click the New Renderings tab in the Renderings pane.
The New Renderings tab displays the different rendering types that can be added in the Renderings pane.
4. Select Mixed Source from the Select rendering(s) to create list.
5. Click the Add Rendering(s) button.
The mixed source rendering is added to the Renderings pane in the Memory view.
DebuggerMemory view
CodeWarrior Development Studio Common Features Guide, Rev. 10.x, 01/2016Freescale Semiconductor, Inc. 163

Figure 108: Mixed source rendering
3.17.5 Setting memory access sizeThis section explains how to define the memory access size.
To set memory access size:
1. Open the Memory view (see Opening Memory view on page 160).
2. Right-click on a Memory Rendering.
The shortcut menu appears.
3. Choose Format from the shortcut menu.
The Format dialog appears.
4. Choose a row size from the Row Size pop-up menu to change the number of rows displayed in theRenderings pane of the Memory view.
5. Choose a column size from the Column Size pop-up menu to change the number of columns.
The default value for the Column size depends on the architecture being debugged. Forexample, for 32 bit architectures the default value for Column size is 4 and for 8 bitarchitectures the default value is 1. To save the newly selected values as default values,click the Save as Defaults button.
NOTE
6. Click OK.
3.17.6 Exporting memoryThis section explains the steps required to export the memory data.
To export memory data:
DebuggerMemory view
CodeWarrior Development Studio Common Features Guide, Rev. 10.x, 01/2016164 Freescale Semiconductor, Inc.

1. Open the Memory view (see Opening Memory view on page 160).
2. Click the Export button in the Memory view toolbar.
The Export Memory dialog appears.
Figure 109: Export Memory dialog
• Format pop-up menu - Lets you choose the format in which the memory data is exported.
• SRecord - Exports memory data in Motorola S-record format.
• Plain Text - Exports memory data in ASCII format.
• RAW Binary - Exports memory data in binary format.
• Start address textbox - Specify the start address of memory range to be exported.
• End address textbox - Specify the end address of the memory range to be exported.
• Length textbox- Displays the length of the memory range.
• File name textbox - Specify the file name to save the exported memory. Click the Browse button to selecta file on your system.
• Choose memory format from the Format pop-up menu.
• Specify the start address of the memory range to be exported in the Start address textbox.
• Specify the end address of the memory range to be exported in the End address textbox.
• Type a file name in the File name textbox. Click Browse to select a file on your system.
• Click OK.
Memory data is now exported.
3.17.7 Importing memoryThis section explains the steps required to import the memory data.
To import memory data:
1. Open the Memory view (see Opening Memory view on page 160).
2. Click the Import button in the Memory view toolbar.
The Import Memory dialog appears.
DebuggerMemory view
CodeWarrior Development Studio Common Features Guide, Rev. 10.x, 01/2016Freescale Semiconductor, Inc. 165

Figure 110: Import Memory dialog
• Format pop-up menu - Allows you to choose the memory format.
• Restore to address specified in the file option - If selected, the imported memory is restored to thememory location specified in the memory file.
• Restore to this address textbox - Specify a memory address to store the imported memory. The importedmemory is restored to the memory location specified in the textbox.
• File name textbox - Specify the file name to import memory. Click the Browse button to select a file fromyour system.
• Scroll to restore address checkbox - If selected, the content in the memory view scroll to the restore pointafter the export operation is completed.
3. Choose memory format from the Format pop-up menu.
4. Select Restore to address specified in the file to restore the memory to location specified in the memoryfile.
5. Select Restore to this address option to store the memory data at the specified memory location. Type thememory location in the adjacent textbox.
6. Type a file name in the File name textbox. Click Browse to select a file from your file system.
7. Select the Scroll to restore address checkbox to scroll to restore point in memory view after the exportoperation is complete.
8. Click OK.
The memory data is now imported.
3.17.8 Setting watchpoint in Memory viewThis section explains the steps required to set a watchpoint in the memory view.
To set a watchpoint using the Memory view:
1. Choose Windows > Open Perspective > Debug from the IDE menu bar to switch to the Debug perspective.
2. Choose Window > Show View > Memory.
The Memory view appears.
3. Select a range of bytes in the Memory Renderings pane of the Memory view.
4. Right-click and choose Add Watchpoint (C/C++) from the shortcut menu that appears.
3.17.9 Clearing watchpoints from Memory viewThis section explains the steps required to remove the watchpoints from the memory view.
To clear a watchpoint from the Memory view:
1. Select the watchpoint expression in the Breakpoints view.
2. Click the Remove Selected Breakpoints button.
To clear all watchpoints from the Memory view:
DebuggerMemory view
CodeWarrior Development Studio Common Features Guide, Rev. 10.x, 01/2016166 Freescale Semiconductor, Inc.
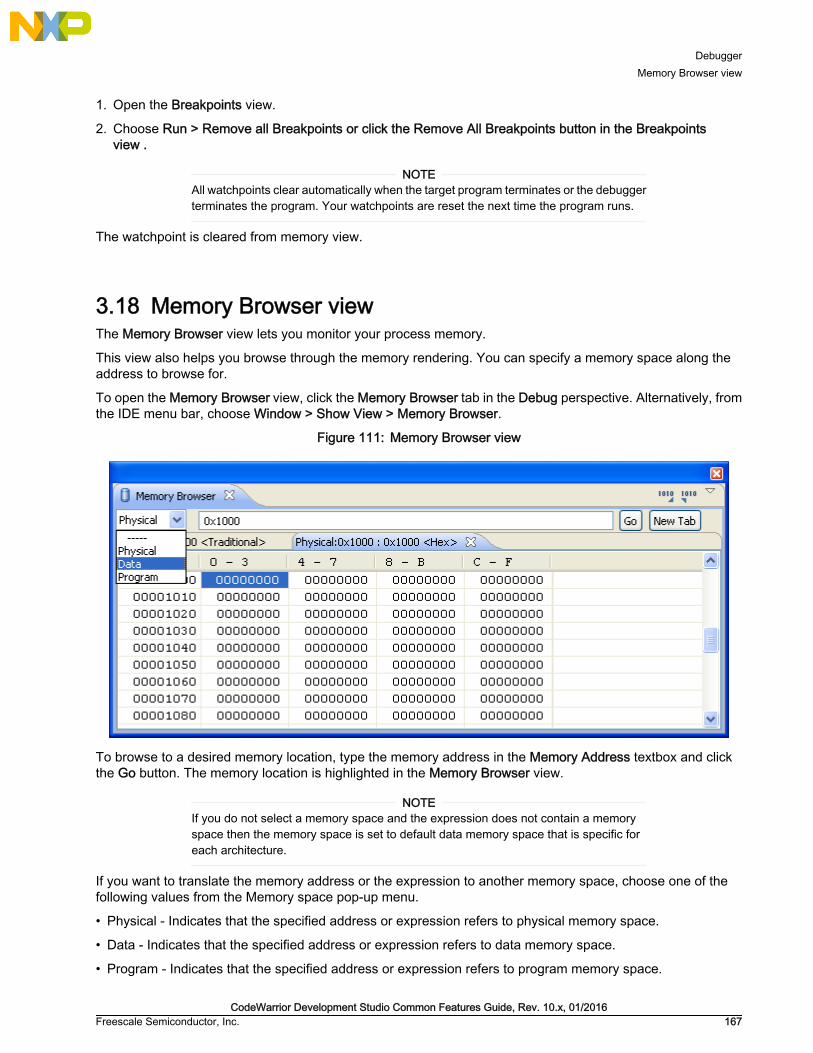
1. Open the Breakpoints view.
2. Choose Run > Remove all Breakpoints or click the Remove All Breakpoints button in the Breakpointsview .
All watchpoints clear automatically when the target program terminates or the debuggerterminates the program. Your watchpoints are reset the next time the program runs.
NOTE
The watchpoint is cleared from memory view.
3.18 Memory Browser viewThe Memory Browser view lets you monitor your process memory.
This view also helps you browse through the memory rendering. You can specify a memory space along theaddress to browse for.
To open the Memory Browser view, click the Memory Browser tab in the Debug perspective. Alternatively, fromthe IDE menu bar, choose Window > Show View > Memory Browser.
Figure 111: Memory Browser view
To browse to a desired memory location, type the memory address in the Memory Address textbox and clickthe Go button. The memory location is highlighted in the Memory Browser view.
If you do not select a memory space and the expression does not contain a memoryspace then the memory space is set to default data memory space that is specific foreach architecture.
NOTE
If you want to translate the memory address or the expression to another memory space, choose one of thefollowing values from the Memory space pop-up menu.
• Physical - Indicates that the specified address or expression refers to physical memory space.
• Data - Indicates that the specified address or expression refers to data memory space.
• Program - Indicates that the specified address or expression refers to program memory space.
DebuggerMemory Browser view
CodeWarrior Development Studio Common Features Guide, Rev. 10.x, 01/2016Freescale Semiconductor, Inc. 167

3.19 Memory Management Unit configuratorThe CodeWarrior Memory Management Unit (MMU) configurator allows different user tasks or programs(usually in the context of an RTOS) to use the same areas of memory.
To use the MMU configurator, you set up a mapping for data and instruction addresses, then enable addresstranslation. The mapping links virtual addresses to physical addresses. Translation occurs before software actson the addresses.
The MMU configurator simplifies peripheral-register initialization of the MMU registers. You can use the tool togenerate code that you can insert into a program. The inserted code initializes an MMU configuration or writesto the registers on-the-fly. Also, you can use the MMU configurator to examine the status of the current MMUconfiguration.
Use the MMU configurator to:
• configure MMU general control registers
• configure MMU program memory-address-translation properties
• configure MMU data memory-address-translation properties
• display the current contents of each register
• write the displayed contents from the MMU configurator to the MMU registers
• save to a file (in a format that you specify) the displayed contents of the MMU configurator
This chapter has these sections:
• Creating MMU configuration on page 168
• Saving MMU Configurator settings on page 171
• MMU Configurator toolbar on page 171
• MMU Configurator pages on page 172
• Opening MMU Configurator view on page 182
3.19.1 Creating MMU configurationYou must create an MMU configuration to use the MMU configurator.
To create the configuration:
1. From the main menu bar, choose File > New > Other.
The New wizard appears.
DebuggerMemory Management Unit configurator
CodeWarrior Development Studio Common Features Guide, Rev. 10.x, 01/2016168 Freescale Semiconductor, Inc.

Figure 112: New wizard - MMU configuration
2. Choose Peripheral Configurators > MMU Configuration File.
3. Click Next.
The MMU Configurator File page appears.
DebuggerMemory Management Unit configurator
CodeWarrior Development Studio Common Features Guide, Rev. 10.x, 01/2016Freescale Semiconductor, Inc. 169

Figure 113: MMU Configurator File page
4. Enter in the Container textbox the path to the directory in which you want to store the MMU configuration.Alternatively, click Browse and use the resulting dialog to specify the directory.
5. Enter in the File name textbox a name for the MMU configuration. Alternatively, leave the default nameintact.
If you enter a new name, make sure to preserve the .mmu filename extension.
NOTE
6. Expand Device Number, and select the target hardware for which you are creating the MMU configuration.( SC3x50)
7. Click Finish.
The IDE generates the MMU configuration file in the specified container directory and opens the MMUConfiguration File Editor view.
DebuggerMemory Management Unit configurator
CodeWarrior Development Studio Common Features Guide, Rev. 10.x, 01/2016170 Freescale Semiconductor, Inc.

Figure 114: MMU Configuration File Editor view
3.19.2 Saving MMU Configurator settingsEach time you change a setting on a page of the MMU configurator, you create a pending (unsaved) change.To commit those pending changes, you must save the MMU configurator settings to a file.
An asterisk (*) appears to the left of the MMU Configuration File Editor tab text to indicate that the MMUconfigurator still has pending changes among its pages.
To save to a file the current settings on each page of the MMU Configuration File Editor view:
1. Click the MMU Configuration File Editor tab.
The corresponding view becomes active.
2. From the main menu bar, choose File > Save.
The IDE saves to a file the pending changes to each page of the MMU configurator.
3.19.3 MMU Configurator toolbarThe MMU Configurator has an associated toolbar that helps you perform various actions.
Depending on how you open the MMU configurator, this toolbar appears either in the main IDE toolbar, or in theMMU configurator view toolbar. The following table explains each toolbar button.
Table 19: MMU configurator toolbar buttons
Name Icon Explanation
Save C Source Save the generated C code to a new .c file.
Table continues on the next page...
DebuggerMemory Management Unit configurator
CodeWarrior Development Studio Common Features Guide, Rev. 10.x, 01/2016Freescale Semiconductor, Inc. 171

Table 19: MMU configurator toolbar buttons (continued)
Name Icon Explanation
Save ASM Source Save the generated Assembly code to a new .asm file.
Save TCL Source Save the generated TCL script to a new .tcl file.
Read Target Registers Updates the content of the MMU Configuration File Editor pagesto reflect the current values of the target hardware registers.
Write Target Registers Writes the modified content of all the MMU Configuration FileEditor pages. You must click this button, or use thecorresponding toolbar menu command to write the MMUConfigurator modifications to the target hardware registers.
3.19.4 MMU Configurator pagesYou use MMU configurator pages to configure MMU mapping and translation properties.
The MMU configurator's tabbed interface displays pages for configuration options and pages for generated code.
This topic includes the following sections:
• General page on page 173
• Program MATT page on page 174
• Data MATT page on page 177
• Saving MMU configurator generated code on page 180
DebuggerMemory Management Unit configurator
CodeWarrior Development Studio Common Features Guide, Rev. 10.x, 01/2016172 Freescale Semiconductor, Inc.

3.19.4.1 General pageUse the General page to configure the overall MMU properties.
Figure 115: MMU Configuration File Editor- General page
The following table explains options on the General page.
Table 20: General page settings
Page Item Explanation
Address Translation Selected - Allows address translation. For example,translation occurs from a virtual address to a physicaladdress. Deselected - Disables address translation.For example, translation does not occur from a virtualaddress to a physical address. This checkboxcorresponds to the Address Translation Enable (ATE)bit of the MMU Control Register (M_CR).
Memory Protection Selected - Allows protection checking for all enabledsegment descriptors. With this checkbox selected, thesystem consumes more power. Deselected - Disablesprotection checking for all enabled segmentdescriptors. With this checkbox deselected, thesystem consumes less power. This checkboxcorresponds to the Memory Protection Enable (MPE)bit of the MMU Control Register (M_CR).
Table continues on the next page...
DebuggerMemory Management Unit configurator
CodeWarrior Development Studio Common Features Guide, Rev. 10.x, 01/2016Freescale Semiconductor, Inc. 173

Table 20: General page settings (continued)
Page Item Explanation
DPU Selected - Allows the Debug and Profiling Unit (DPU).Deselected - Disables the DPU. With this checkboxdeselected, DPU registers are disabled for read andwrite accesses. This checkbox corresponds to theDebug and Profiling Unit Enable (DPUE) bit of theMMU Control Register (M_CR).
Brunch Flush Selected - Allows automatic branch-target buffer flush.Deselected - Disables automatic branch-target bufferflush.
Cancel Cache Commands Selected - Cancels the cache command for programand data except for DFLUSH and DSYNC. Thischeckbox is not available for MSC8144 target device.
Capture Violation Address Selected - Includes the address at which the violationoccurred. Deselected - Does not include the addressat which the violation occurred.
3.19.4.2 Program MATT pageUse the Program MATT page to define and display program memory-space mappings (virtual-to-physicaladdress mappings) for the StarCore DSP.
The MMU configurator generates the appropriate descriptors for the program memory-address translation table(MATT).
Each memory-space mapping has a corresponding entry in the list on the left-hand side of the Program MATTpage. Each entry shows an abbreviated expression which summarizes the settings on the right-hand side of thepage. A plus sign to the left of an entry indicates an enabled mapping, and a minus sign indicates a disabledmapping.
To change an entry, select it from the left-hand side of the page, then use the Address, Size, and Propertiessettings to specify options that the MMU configurator verifies as a group. Click the Change button to assign thespecified options to the selected entry. To cancel your changes, select another entry from the left-hand side ofthe page, without clicking the Change button.
DebuggerMemory Management Unit configurator
CodeWarrior Development Studio Common Features Guide, Rev. 10.x, 01/2016174 Freescale Semiconductor, Inc.

Figure 116: MMU Configuration File Editor - Program MATT page
The following table explains each option on the Program MATT page.
Table 21: Program MATT page settings
Option Explanation
Virtual Enter the virtual base address of the program segment. This option corresponds tothe Program Segment Virtual Base Address and Size (PSVBAS) bits of the ProgramSegment Descriptor Registers A (M_PSDAx) that configure the virtual base address.
Physical Enter the most-significant part of the physical address to use for translation. Thisoption corresponds to the Data Segment Physical Base Address (DSPBA) bits of theData Segment Descriptor Registers B (M_DSDBx)."
Size Specify the PMATT Units number in Number box. Select the PMATT Units type fromthe Type pop-up menu: B, KB, MB, GB
Permissions Specify whether to share the program segment. This option corresponds to theSystem/Shared Virtual Program Memory (SSVPM) bit of the Program SegmentDescriptor Registers A (M_PSDAx).
Burst Specify the number of transactions (beats) on the bus that the bus controller cannotinterrupt. This burst size applies in the region to a cacheable segment. This optioncorresponds to the Program Burst Size (PBS) bits of the Program SegmentDescriptor Registers B (M_PSDBx).
Table continues on the next page...
DebuggerMemory Management Unit configurator
CodeWarrior Development Studio Common Features Guide, Rev. 10.x, 01/2016Freescale Semiconductor, Inc. 175

Table 21: Program MATT page settings (continued)
Option Explanation
L2 Cache Policy Determines the cache policy for the L2 cache for accesses from the core through L1Instruction cache: Cacheable, NonCacheable, and Reserved. The pop-up menu hastwo Reserved values.This is because the L2 Cache Policy Values is stored on 2 bitsso they are 4 possible values (2 valid and 2 reserved). Every entry in the combo boxcorresponds to a combination of bits.
Cacheable Selected - Allows caching of the segment in instruction cache. Deselected - Disablescaching of the segment in instruction cache. This checkbox corresponds to theInstruction Cacheability (IC) bit of the Program Segment Descriptor Registers A(M_PSDAx).
PAPS Selected-The segment has supervisor-level fetch permission for program accesses.If you select the PAPU checkboxas well, you disable program-protection checks forthis segment. Deselected - The segment does not have supervisor-level fetchpermission for program accesses. This checkbox corresponds to the ProgramAccess Permission in Supervisor Level (PAPS) bit of the Program SegmentDescriptor Registers A (M_PSDAx).
Entry Enabled Selected - The MMU enables this mapping entry. Deselected - The MMU disablesthis mapping entry.
PAPU Selected - The segment has user-level fetch permission for program accesses. If youselect the PAPS checkbox as well, you disable program-protection checks for thissegment. Deselected - The segment does not have user-level fetch permission forprogram accesses. This checkbox corresponds to the Program Access Permissionin User Level (PAPU) bit of the Program Segment Descriptor Registers A(M_PSDAx).
Prefetch Line Selected - Allows the fetch unit's program-line pre-fetch to a segment cacheable ininstruction cache. Deselected - Disables the fetch unit's program-line prefetch to asegment cacheable in instruction cache. This checkbox corresponds to the ProgramPre-fetch Line Enable (PPFE) bit of the Program Segment Descriptor Registers B(M_PSDBx).
Program Next LinePrefetch
Selected - Allows the fetch unit's program next line pre-fetch mechanism to an ICachecacheable segment. Deselected - Enables the fetch unit's program next line pre-fetchmechanism to an ICache cacheable segment.
The PMATT Table page as shown in figure below displays an alternate, tabular rendering of the settings thatyou specify on the Program MATT page. Use this page to view the configuration of all Program MATT mappings.The MMU configurator uses the settings that you specify on the Program MATT page to generate the columnheaders of this page. The table data shows the validated records for each Program MATT entry. You can resizethe table columns to hide columns or view the larger data fields. A plus sign ( + ) in a table cell represents aselected checkbox in the associated Program MATT configuration page.
The PMATT Table page shows just a tabular summary of the settings that you specifyon the Program MATT page. To make changes, use the Program MATT page.
NOTE
DebuggerMemory Management Unit configurator
CodeWarrior Development Studio Common Features Guide, Rev. 10.x, 01/2016176 Freescale Semiconductor, Inc.

Figure 117: MMU Configuration File Editor - PMATT Table page
3.19.4.3 Data MATT pageUse the Data MATT page to define and display data memory-space mappings (virtual-to physical addressmappings) for the StarCore DSP.
The MMU configurator generates the appropriate descriptors for the data memory-address translation table(MATT).
Each memory-space mapping has a corresponding entry in the list on the left-hand side of the Data MATT page.Each entry shows an abbreviated expression which summarizes the settings on the right-hand side of the page.A plus sign to the left of an entry indicates an enabled mapping, and a minus sign indicates a disabled mapping.
To change an entry, select it from the left-hand side of the page, then use the Address, Size, and Propertiessettings to specify options that the MMU configurator verifies as a group. Click the Change button to assign thespecified options to the selected entry. To cancel your changes, select another entry from the left-hand side ofthe page, without clicking the Change button.
The following figure shows the Data MATT page.
DebuggerMemory Management Unit configurator
CodeWarrior Development Studio Common Features Guide, Rev. 10.x, 01/2016Freescale Semiconductor, Inc. 177

Figure 118: MMU Configuration File Editor - Data MATT page
The following table explains each option on the Data MATT page
Table 22: Data MATT page settings
Option Explanation
Virtual Enter the virtual base address of the data segment. This option corresponds to the DataSegment Virtual Base Address and Size (DSVBAS) bits of the Data Segment DescriptorRegisters A (M_DSDAx) that configure the virtual base address.
Physical Enter the most-significant part of the physical address to use for translation. The valuethat you specify determines the size of the most- significant part. This optioncorresponds to the Data Segment Physical Base Address (DSPBA) bits of the DataSegment Descriptor Registers B (M_DSDBx).
Size Specify the PMATT Units number in Number box. Select the PMATT Units type fromthe pop-up menu: B, KB, MB, GB
Permissions Specify whether to share the data segment: shared and non-shared This optioncorresponds to the Supervisor/Shared Virtual Data Memory (SSVDM) bit of the DataSegment Descriptor Registers A (M_DSDAx).
Burst Specify the number of transactions (beats) on the bus that the bus controller cannotinterrupt. This burst size applies in the region to a cacheable segment. This optioncorresponds to the Data Burst Size (DBS) bits of the Data Segment Descriptor RegistersB (M_DSDBx).
Table continues on the next page...
DebuggerMemory Management Unit configurator
CodeWarrior Development Studio Common Features Guide, Rev. 10.x, 01/2016178 Freescale Semiconductor, Inc.

Table 22: Data MATT page settings (continued)
Option Explanation
L2 Cache Policy Determines the cache policy for the L2 cache for accesses from the core through L1Data Cache: Cacheable write through, Cacheable write-back, Non-cacheable, andAdaptive write.
DAPU Specify whether to allow user-level read (r-), write (-w), both (rw), or neither(--) types ofdata access. This option corresponds to the Data Access Permission in User Level(DAPU) bits of the Data Segment Descriptor Registers A (M_DSDAx).
DAPS Specify whether to allow supervisor-level read (r-), write (-w), both (rw), or neither (--)types of data access. This option corresponds to the Data Access Permission inSupervisor Level (DAPS) bits of the Data Segment Descriptor Registers A (M_DSDAx).
Write Policy Specify the policy to use for data writes and cache:
• Cacheable write through-Writes are buffered in the write queue (WRQ) and goes bothto the cache and to the higher-level memory. The write-through is a non-write allocate,and a cacheable write-through access is not updated in the cache unless there is ahit.
• Cacheable write back-writes are buffered in the write queue (WRQ) and goes throughthe DCache and the write back buffer (WBB). The information is written to the VBRin the cache only. The modified cache VBR is written to higher-level memory onlywhen it is replaced. The resulting WBB is combined with a write-allocate write-misspolicy in which the required VBR is loaded to cache when a write-miss occurs.
• Non Cacheable write through-writes are buffered in the WRQ and goes through thewrite through buffer (WTB) to the higher-level memory
• Non-cacheable write-through destructive area-writes are buffered in the WRQ andgoes through the write through buffer (WTB) to the higher-level memory. Speculativeread accesses are blocked in the platform level and does not goes to a higher levelmemory.
Prefetch Line Selected - Enables the fetch unit's data-line prefetch to a segment cacheable in datacache. Deselected - Disables the fetch unit's data-line prefetch to a segment cacheablein data cache. This checkbox corresponds to Data Pre-fetch Line Enable (DPFE) bit ofthe Data Segment Descriptor Registers B (M_DSDBx).
Entry Enabled Selected - The MMU enables this mapping entry. Deselected - The MMU disables thismapping entry.
DebuggerMemory Management Unit configurator
CodeWarrior Development Studio Common Features Guide, Rev. 10.x, 01/2016Freescale Semiconductor, Inc. 179

Figure 119: MMU Configuration File Editor - Data MATT Table page
The DMATT Table page shows an alternate, tabular rendering of the settings that you specify on the Data MATTpage. Use this page to view the configuration of all Data MATT mappings. The MMU configurator uses thesettings that you specify on the Data MATT page to generate the column headers of this page. The table datashows the validated records for each Data MATT entry. You can resize the table columns to hide columns orview the larger data fields. A plus sign ( + ) in a table cell represents a selected checkbox in the associated DataMATT configuration page.
The DMATT Table page shows the summary of the settings that you specify on theData MATT page in the tabular format. To changes these settings, use the Data MATTpage.
NOTE
3.19.4.4 Saving MMU configurator generated codeYou can save the C code, assembly code, and TCL script generated by the MMU Configuration File Editor.
This section includes the following topics:
• Saving generated C code on page 180
• Saving generated assembly code on page 181
• Saving generated TCL script on page 181
3.19.4.4.1 Saving generated C codeThe generated C code is unique for different targets. This section explains how to save the generated C code.
Follow these steps to save the C code generated by the MMU Configuration File Editor:
DebuggerMemory Management Unit configurator
CodeWarrior Development Studio Common Features Guide, Rev. 10.x, 01/2016180 Freescale Semiconductor, Inc.

1. From the CodeWarrior IDE menu bar, choose MMU Editor > Save C to save the generated C code.Alternatively, click the corresponding toolbar buttons in the MMU Configurator toolbar.
A standard Save dialog appears.
2. Specify the filename in the File name textbox and click Save to save the generated code as a new file.
The MMU Configuration File Editor regenerates the C code when you change settingsin the configuration pages or when you click Change on the Program MATT or DataMATT pages.
NOTE
3.19.4.4.2 Saving generated assembly codeThe generated Assembly (ASM) code is unique for different targets. This section explains how to save thegenerated ASM code.
Follow these steps to save the ASM code generated by the MMU Configuration File Editor:
1. From the CodeWarrior IDE menu bar, choose MMU Editor > Save ASM to save the generated Assemblycode. Alternatively, click the corresponding toolbar buttons in the MMU Configurator toolbar.
A standard Save dialog appears.
2. Specify the name of the file in the File name textbox and click Save to save the generated code as a newfile.
The MMU Configuration File Editor regenerates the Assembly code when you changesettings in the configuration pages or when you click Change on the Program MATT orData MATT pages.
NOTE
3.19.4.4.3 Saving generated TCL scriptThis section explains how to save the generated TCL script.
The generated TCL script can be executed within the Debugger Shell view, or the Debugger Shell can executethe generated TCL script as an initialization script for the target hardware. The generated TCL script is uniquefor different targets.
Follow these steps to save the TCL script generated by the MMU Configuration File Editor:
1. From the CodeWarrior IDE menu bar, choose MMU Editor > Save TCL to save the generated TCL script.Alternatively, click the corresponding toolbar buttons in the MMU Configurator toolbar.
A standard Save dialog appears.
2. Specify the filename in the File name textbox and click Save to save the generated code as a new file.
The MMU Configuration File Editor regenerates the TCL script when you changesettings in the configuration pages or when you click Change on the Program MATT orData MATT pages.
NOTE
DebuggerMemory Management Unit configurator
CodeWarrior Development Studio Common Features Guide, Rev. 10.x, 01/2016Freescale Semiconductor, Inc. 181

3.19.5 Opening MMU Configurator viewYou can use MMU Configurator view to examine the current state of a thread's MMU configuration during thecourse of the debugging session.
Using the New window to create an MMU configuration is just one way to work with MMU. Alternatively, you canopen the MMU Configurator view, such as during a debugging session. Also, you can detach the MMUConfigurator view into its own floating window and reposition that window into other collections of views.
Because the MMU configurator view does not have an associated configuration fileinitially, the MMU tab appears in place of the tab that shows the name of theconfiguration file. Saving the MMU Configurator view settings to a file (by choosing File> Save ) replaces the MMU tab with the name of the saved configuration file.
NOTE
To open the MMU Configurator view:
1. Start a debugging session.
2. In the Debug view of the Debug perspective, select the process for which you want to work with MMU.
3. Choose Window > Show View > Other from the IDE menu bar.
The Show View dialog appears.
Figure 120: Show View dialog - MMU Configurator
4. Expand Debug group, and choose MMU Configurator .
5. Click OK.
The MMU Configurator view appears, attached to an existing collection of views in the current perspective.
DebuggerMemory Management Unit configurator
CodeWarrior Development Studio Common Features Guide, Rev. 10.x, 01/2016182 Freescale Semiconductor, Inc.

You just finished opening the MMU Configurator view. You can right-click the MMU Configurator tab to choosethe menu command that detaches the view into a floating window. Also, you can drag the MMU Configuratortab to a different collection of view tabs.
3.20 Multicore debuggingThe debugger allows simultaneous debugging of multiple projects. This feature provides multi-core debuggingcapability for some embedded processors.
By configuring each project to operate on a single core, the debugger can debug multiple cores by debuggingmultiple projects.
CodeWarrior for Microcontrollers v10.x does not support debugging multiple projects onmultiple cores in the same multi-core target. CodeWarrior for Microcontrollers v10.xsupports creating and/or debugging Single Multi Processing (SMP) projects.
NOTE
Configuring multi-core debugging involves these tasks:
• creating a project for each core
• configuring specific target settings for each project
• for some cores, specifying a configuration file for initializing multi-core debugging
You can use either the user interface or the Debugger Shell to perform multicore operations. In the user interface,you can access multicore operations from these locations in the Debug perspective:
• Run menu
• Debug view shortcut menu
• Debug view toolbar
• Debug view toolbar pop-up menu
This section explains the follwoing topics:
• Multicore Suspend on page 183
• Multicore Resume on page 184
• Multicore Terminate on page 184
• Multicore Restart on page 184
3.20.1 Multicore SuspendThis section explains the steps required to suspend a multicore project.
To suspend execution of a core:
1. Enable multicore groups for multicore operations (see Multicore Groups on page 185).
2. In the Debug view, select a thread that corresponds to a core for bareboard debugging.
3. Click Multicore Suspend.
Alternatively, in the Command-Line Debugger Shell, select a thread using the switchtarget command andthen use the mc::stop command to suspend execution of a core during a debugging session.
DebuggerMulticore debugging
CodeWarrior Development Studio Common Features Guide, Rev. 10.x, 01/2016Freescale Semiconductor, Inc. 183

If Use all cores is enabled, then all cores in the processor are suspended. Otherwise, ifthe core is in a multicore group, then all cores in the multicore group are suspended. Ineither case, cores that are not being debugged can still be affected by the command. Ifthis is not the desired behavior, then reconfigure your multicore groups.
NOTE
3.20.2 Multicore ResumeThis section explains the steps required to resume a multicore project.
To resume execution of a core:
1. Enable multicore groups for multicore operations (see Multicore Groups on page 185).
2. In the Debug view, select a thread that corresponds to a core for bareboard debugging.
3. Click Multicore Resume.
Alternatively, in the Command-Line Debugger Shell, select a thread using the switchtarget command andthen use the mc::go command to resume execution of a core during a debugging session.
If Use all cores is enabled, all cores in the processor are resumed. Otherwise, if the coreis in a multicore group then all cores in the Multicore Group are resumed. In either case,note that cores that are not being debugged can still be affected by the command. If thisis not the desired behavior, reconfigure your multicore groups.
NOTE
3.20.3 Multicore TerminateThis section explains the steps required to terminate a multicore project.
To terminate execution of a core:
1. Enable multicore groups for multicore operations (see Multicore Groups on page 185).
2. In the Debug view, select a thread that corresponds to a core for bareboard debugging.
3. Click Multicore Terminate.
Alternatively,in the Command-Line Debugger Shell, select a thread using the switchtarget command andthen use the mc::kill command to terminate execution of a core during a debugging session.
If Use all cores is enabled then all Debug Threads for the processor will be terminated.Otherwise, if the core is in a multicore group then all threads corresponding to the coresin the multicore group will be terminated.
NOTE
3.20.4 Multicore RestartThis section explains the steps required to restart a multicore project.
To restart execution of a core:
1. Enable multicore groups for multicore operations (see Multicore Groups on page 185).
2. In the Debug view, select a thread that corresponds to a core for bareboard debugging.
3. Click Multicore Restart.
Alternatively,in the Command-Line Debugger Shell, select a thread using the switchtarget command and thenuse the mc::restart command to restart execution of a core during a debugging session.
DebuggerMulticore debugging
CodeWarrior Development Studio Common Features Guide, Rev. 10.x, 01/2016184 Freescale Semiconductor, Inc.

3.21 Multicore GroupsThe multicore grouping feature helps you define multiple arbitrary groupings of cores and then performmulticore operations on the groups.
Clicking the Multicore Groups button in the Debug view toolbar allows you to create new multicore groups.
Figure 121: Multicore Groups
The Multicore Groups pop-up menu provides the following options:
• Use All Cores - If the selected debug context is a multicore system, then all cores are used for multicoreoperations.
• Disable Halt Groups - Disables breakpoint halt groups, see Multicore breakpoint halt groups on page 192.
• Limit new breakpoints to current group - If selected, all new breakpoints set during a debug session arereproduced only on cores belonging to the group of the core on which the breakpoint is set.
• Edit Target Types - Opens the Target Types dialog to add or remove target types, see Editing multicoregroup on page 189.
• Edit Multicore Groups - Opens the Multicore Groups dialog to create multicore groups. You can also usethis option to modify existing multicore groups.
The Multicore Groups pop-up menu also shows the list of groups that are shown in the Multicore Groups dialog.
This section includes:
• Creating multicore group on page 185
• Modifying multicore group on page 188
• Editing multicore group on page 189
• Using multicore group debugging commands on page 191
• Multicore breakpoint halt groups on page 192
3.21.1 Creating multicore groupYou can create multicore groups using the New Multicore Group dialog.
To create a multicore group:
1. Click the Multicore Groups button from the Debug view toolbar.
DebuggerMulticore Groups
CodeWarrior Development Studio Common Features Guide, Rev. 10.x, 01/2016Freescale Semiconductor, Inc. 185

The Multicore Groups dialog appears.
Figure 122: Multicore Groups dialog
• New button - Creates a new group using the New Multicore Group dialog. The initial name of the group isthe name unless the name is already in use. If the name is already in use then an index is appended tothe group name. The initial enablement of the group and its descendants will be non-cores enabled,cores disabled. This guarantees an initial state with no error due to overlap.
• Remove button - Removes a selected group.
• Remove All button - Remove all groups.
• Use all cores checkbox - If selected, all cores are used for multicore operations irrespective of multicoregroups.
• Limit new breakpoints to current group checkbox - If selected, all new breakpoints set during a debugsession are reproduced only on cores belonging to the group of the core on which the breakpoint is set.When the Use all cores checkbox is selected, this checkbox appears dimmed and is not used onbreakpoints filtering, as all cores are considered on the same group for multicore operations.
• Click the New button.
The New Multicore Group dialog appears.
DebuggerMulticore Groups
CodeWarrior Development Studio Common Features Guide, Rev. 10.x, 01/2016186 Freescale Semiconductor, Inc.

Figure 123: New Multicore Group dialog
• Select a target type from the list.
• Click OK.
The group appears in the Multicore Groups dialog.
DebuggerMulticore Groups
CodeWarrior Development Studio Common Features Guide, Rev. 10.x, 01/2016Freescale Semiconductor, Inc. 187

Figure 124: Added multicore group
• Repeat Steps 2 - 4 to add more core groups for multicore operations.
• Click OK.
You have just created multicore group.
3.21.2 Modifying multicore groupYou can also modify an existing multicore group to add cores to the multicore group.
You are not allowed to enable a group that overlaps with another group.
NOTE
To modify a multicore group:
1. Choose Edit Multicore Groups from the Multicore Groups pop-up menu in the Debug view toolbar to openMulticore Groups dialog.
2. Select the cores you want to add to the multicore group.
3. Deselect the cores you want to remove from the multicore group.
4. Click OK.
DebuggerMulticore Groups
CodeWarrior Development Studio Common Features Guide, Rev. 10.x, 01/2016188 Freescale Semiconductor, Inc.

3.21.3 Editing multicore groupYou can edit multicore groups to add and remove system types from multicore groups.
You can add custom target types by importing files from:
• JTAG configuration files
• Device Tree Blob files (for Power Architecture)
To add and remove system types from multicore groups:
1. Choose Edit Target Type from the Multicore Groups pop-up menu.
The Target Types dialog appears.
Figure 125: Target Types dialog
• Import - Creates a custom target type by importing it from a configuration file.
• Remove - Removes a target type from the list.
• Remove All - Removes all target types from the list.
2. Click Import.
The Open dialog appears.
DebuggerMulticore Groups
CodeWarrior Development Studio Common Features Guide, Rev. 10.x, 01/2016Freescale Semiconductor, Inc. 189

Figure 126: Import target type
3. Select a multicore configuration file and click Open.
The multicore appears in the Target Types dialog.
DebuggerMulticore Groups
CodeWarrior Development Studio Common Features Guide, Rev. 10.x, 01/2016190 Freescale Semiconductor, Inc.

Figure 127: Added target types
4. Click OK.
3.21.4 Using multicore group debugging commandsMulticore Group features can also be accessed from the Debugger Shell command line.
The following table lists and defines different multicore group debugging commands.
Table 23: Multicore group debugging commands
Command Description
mc::type Syntax mc::type Lists the available target types.
mc::type import Syntax mc::type import <filename> Imports a new specified using thefilename .
mc::type remove Syntax mc::type remove <filename>|<type-index> ... Removes thespecified imported or types. Built-in target types cannot be removed and willreturn an error.
mc::type removeall Syntax mc::type removeall Removes all imported target types.
mc::group Syntax mc::group Lists the defined groups.
mc::group new Syntax mc::group new <type-name>|<type-index> [<name>] Creates anew group for the system specified using the type-name or type-index . Ifno name is specified, then a unique default name is assigned to the group.
Table continues on the next page...
DebuggerMulticore Groups
CodeWarrior Development Studio Common Features Guide, Rev. 10.x, 01/2016Freescale Semiconductor, Inc. 191

Table 23: Multicore group debugging commands (continued)
Command Description
mc::group rename Syntax mc::group rename <name>|<group-index> <new-name> Renamesan existing group. Specifying a duplicate name results in an error.
mc::group remove Syntax mc::group remove <name>|<group-index> ... Removes thespecified group or groups.
mc::group removeall Syntax mc::group removeall Removes all groups.
mc::group enable|disable Syntax mc::group enable|disable <index> ...|all Enables or disablesnodes in the group tree.
3.21.5 Multicore breakpoint halt groupsA halt group is a group of cores that will stop execution simultaneously whenever any one of the cores in thegroup hits a breakpoint.
In multicore groups, each group can be configured as a run control group, a breakpoint halt group, or both.
The halt groups are configured on any applicable debug target. Similarly, whenever a debug session is launched,all applicable halt groups are applied to the debug target.
Multicore breakpoint halt groups are supported by P4080 processor only.
NOTE
3.22 Multicore resetThis CodeWarrior debugger feature lets you configure reset and run out of reset action for your targetsystem.
It also enables you to configure your target system to perform system reset action.
The system reset action is applicable for initial launch only.
NOTE
To specify reset setting for cores in a multicore environment:
1. Go to the Remote Systems view on page 68.
2. Right-click a remote system and choose Properties from the shortcut menu.
The Properties for <Remote System> dialog appears.
DebuggerMulticore reset
CodeWarrior Development Studio Common Features Guide, Rev. 10.x, 01/2016192 Freescale Semiconductor, Inc.

Figure 128: Properties for <Remote System> dialog
3. Click the Initialization tab.
DebuggerMulticore reset
CodeWarrior Development Studio Common Features Guide, Rev. 10.x, 01/2016Freescale Semiconductor, Inc. 193

Figure 129: Initialization pane
• Execute system reset - Resets the entire Remote System. This checkbox is available only if theprocessor supports system reset. Reset system is executed only for the initial launch.
• Core reset - Independently resets one or more cores from the Remote System. This is available only ifthe processor supports core reset. Use this column in RSE configuration if you want to independentlyreset the core on launch or restart. Initial launches with system reset and core reset options will executeonly the system reset.
• Run out of reset - Puts a core in run mode after reset. This is available only if System Reset or CoreReset is selected.
• Initialize target - Allows initialize target script configuration
• Initialize target script - Script to initialize the target. This is available only if initialize target is selected.Target initialization scripts and reset cores are applied to cores being launched.
4. Select the Execute system reset checkbox to perform system reset. The system reset applies only to initiallaunch.
5. Select the Core reset checkbox adjacent to the core on which you want to perform a reset action.
6. Select the Run out of reset checkbox adjacent to the core on which you want to perform run out of resetaction.
7. Click OK.
Initialization files are executed only for cores selected for debug.
NOTE
This section explains:
• On demand reset on page 195
DebuggerMulticore reset
CodeWarrior Development Studio Common Features Guide, Rev. 10.x, 01/2016194 Freescale Semiconductor, Inc.

3.22.1 On demand resetThe on demand settings are serialized when the user performs the reset action.
The Reload button allows user to load the settings from the remote system configuration. The on demand resetconfigurations apply to the whole system, these configurations are not filtered to the active debug context. Theinitialization files are executed only for cores under debug.
You can access the Reset command from the Run menu in the debug view.
Figure 130: On demand reset
3.23 Path mappingsThe Path Mapping settings are used in IDE to resolve a partial or absolute path from a binary executableduring debugging to effectively locate a source file.
A binary executable used for debugging typically contains a list of source files in its debugger that were used tobuild the executable. The source file list is used by the debugger to provide source level debugging. TheCodeWarrior IDE supports automatic as well as manual path mapping.
In this section:
• Automatic path mappings on page 195
• Manual path mappings on page 197
3.23.1 Automatic path mappingsThe Automatic Path Mapping feature focuses on reducing as much as possible the manual steps required bythe user to set up the path mapping settings to support source level debugging.
For automatic path mapping:
1. In the CodeWarrior Projects view, expand Binaries folder and right-click the *.eld file.
2. Choose Properties from the shortcut menu that appears.
The Properties for *.eld dialog appears.
3. Select Path Mappings on the left side of the dialog.
DebuggerPath mappings
CodeWarrior Development Studio Common Features Guide, Rev. 10.x, 01/2016Freescale Semiconductor, Inc. 195

The Path Mappings page appears. This page displays every path mapping settings for the launchconfigurations associated with a project.
Figure 131: Automatic path mapping
You can edit either a single set of settings for all launch configurations associated with a project or the settingsfor a given launch configuration by choosing the appropriate value from the Launch Configuration pop-upmenu.
Under each path mapping, the table displays a list of source files that exist in the binary executable that sharethe same source mapping prefix. In the Local Path column, a green sign ( ) appears if the file exists afterbeing mapped by the destination path or a red ( ) if it does not. Also, the local path itself is displayed in redif it does not exist on the local file system.
A default folder named Files Not Mapped is created if you explicitly remove existing mappings. All unmappedfiles that are not found on the file system are automatically shown under this folder.
The following table describes various options available in the Path Mappings page.
Table 24: Automatic path mappings options
Options Description
Auto Correct When clicked, iterates automatically through all thefiles not found on the file system and attempt togroup them with their common prefix. This actionoften generates satisfactory results from the sourcefiles listed in the binaries so that the manual stepsrequired by the user are kept at a minimum.
Table continues on the next page...
DebuggerPath mappings
CodeWarrior Development Studio Common Features Guide, Rev. 10.x, 01/2016196 Freescale Semiconductor, Inc.

Table 24: Automatic path mappings options (continued)
Options Description
Add Allows you to create a new Path Mapping entry. Ifany paths are selected, the dialog will be pre-initialized with their common prefix.
Remove Allows you to remove any path mapping or defaultentry.
Edit Allows you to change the values of the selected pathmapping entry. Editing non-path mapping entry is notsupported.
Up Allows you to reorder the entries by moving theselected entry up in the list. Note that path mappingsneed always to be grouped together, and as suchmoving up the top most path mapping will alwaysmove its siblings above the preceding entry as well.
Down Allows you to reorder the entries by moving theselected entry down in the list. Note that pathmappings need always to be grouped together, andas such moving down the bottom most path mappingwill always move its siblings below the following entryas well.
Restore Defaults Resets the launch configuration path mappingssettings to their previous values, including the librarypath mapping automatically generated by the APMplug-in.
If you create a new path mappings manually from the source lookup path, the sourcefiles are automatically resorted to their most likely path mapping parent.
NOTE
4. Click OK.
The Path Mappings dialog closes.
3.23.2 Manual path mappingsPath mappings can be added manually per launch configuration or global, per workspace.
You need to specify the source lookup path in terms of the compilation path and the local file-system path forthe newly imported executable file. The CodeWarrior debugger uses both of these paths to debug the executablefile. The compilation path is the path to the original project that built the executable file. If the original project isfrom an IDE on a different computer, you specify the compilation path in terms of the file system on that computer.The local file-system path is the path to the project that the CodeWarrior IDE creates in order to debug theexecutable file.
In the latest case the mapping will be valid for all the projects within the workspace.
To add a path mapping to a launch configuration:
1. Click the Source tab of the Debug Configurations dialog.
DebuggerPath mappings
CodeWarrior Development Studio Common Features Guide, Rev. 10.x, 01/2016Freescale Semiconductor, Inc. 197

Figure 132: Debug Configurations dialog - Source pane
2. Click Add.
The Add Source dialog appears.
3. Select Path Mapping.Figure 133: Add Source dialog
4. Click OK.
DebuggerPath mappings
CodeWarrior Development Studio Common Features Guide, Rev. 10.x, 01/2016198 Freescale Semiconductor, Inc.

The Path Mappings dialog appears.
Figure 134: Path Mappings dialog
5. Specify the Path mappings name in the Name textbox.
6. Click Add.
7. In the Compilation path textbox, enter the path to the parent project of the executable file, relative to thecomputer that generated the file.
For example, the computer on which you debug the executable file is not the same computer that generatedthat executable file. On the computer that generated the executable file, the path to the parent project is D:\workspace\originalproject. Enter this path corresponding to the Compilation path textbox.
You can use the IDE to discover the path to the parent project of the executable file,relative to the computer that generated the file. In the C/C++ Projects view of the C/C++ perspective, expand the project that contains the executable file that you want todebug. Next, expand the group that has the name of the executable file itself. A list ofpaths appears, relative to the computer that generated the file. Search this list for thenames of source files used to build the executable file. The path to the parent project ofone of these source files is the path you should enter in the Compilation path textbox.
TIP
8. In the Local file system path textbox, enter the path to the parent project of the executable file, relative toyour computer. Alternatively, click the Browse button to specify the parent project.
Suppose the computer on which you debug the executable file is not the same computer that generated thatexecutable file. On your current computer, the path to the parent project of the executable file is C:\projects\thisproject. Enter this path in the Local file system path textbox.
DebuggerPath mappings
CodeWarrior Development Studio Common Features Guide, Rev. 10.x, 01/2016Freescale Semiconductor, Inc. 199

9. Click OK.
The Path Mappings dialog closes. The mapping information now appears under the path mapping shown inthe Source Lookup Path list of the Source page.
10.If needed, change the order in which the IDE searches the paths.
The IDE searches the paths in the order shown in the Source Lookup Path list, stopping at the first match.To change this order, select a path, then click the Up or Down button to change its position in the list.
11.Click Apply.
The IDE saves your changes.
This section also includes:
• Adding path mapping to workspace on page 200
3.23.2.1 Adding path mapping to workspaceThis section explains the steps required to add path mapping to a workspace.
To add a path mapping to the workspace:
1. Choose Window > Preferences from the CodeWarrior IDE menu bar.
The Preferences dialog appears.
2. Expand C/C++ > Debug > Common Source Lookup Path.
DebuggerPath mappings
CodeWarrior Development Studio Common Features Guide, Rev. 10.x, 01/2016200 Freescale Semiconductor, Inc.

Figure 135: Preferences dialog - Common Source Lookup Path
3. Repeat steps 2-11 provided in the Manual path mappings on page 197 section for adding a path mappingfor a single launch configuration.
3.24 Redirecting standard output streams to socketThis CodeWarrior feature allows you to redirect standard output (stdout, stderr) of a process beingdebugged to a user specified socket.
To specify the initial connection redirection settings:
1. In the CodeWarrior Projects view, right-click the project folder to display a shortcut menu.
2. Choose Debug As > Debug Configurations from the shortcut menu.
DebuggerRedirecting standard output streams to socket
CodeWarrior Development Studio Common Features Guide, Rev. 10.x, 01/2016Freescale Semiconductor, Inc. 201

The Debug Configurations dialog appears. The left pane of the Debug Configurations dialog has a list ofdebug configurations that apply to the current application.
3. Expand the CodeWarrior tree, and select the name of the debug configuration for which you want tomodify debugger settings.
The right pane of the Debug Configurations dialog shows the settings for the configuration that you selected.
4. Click the Common tab.
The common settings are available in the right pane of the Debug Configurations dialog.
Figure 136: Debug Configurations dialog
5. Select the Port checkbox.
The Act as Server or Hostname/IP address options become available.
6. Type the port number in the Port textbox.
7. Select Act as Server to redirect the output from this process to a local server socket bound to the specifiedport.
8. Select Hostname/IP address to redirect the output from this process to a server socket located on thespecified host and bound to the specified port. The debugger will connect and write to this server socketvia a client socket created on an ephemeral port
9. Click Apply.
The changes are applied to the selected debug configuration.
DebuggerRedirecting standard output streams to socket
CodeWarrior Development Studio Common Features Guide, Rev. 10.x, 01/2016202 Freescale Semiconductor, Inc.

You can also use the redirect command in the debugger shell to redirect standardoutput streams to a socket.
NOTE
3.25 Refreshing data during runtimeThis debugger feature refreshes the memory and registers data non-intrusively during runtime.
The data is automatically refreshed after a specified interval during runtime.
You can also refresh data by clicking the Refresh button from a view toolbar. If you choose Refresh WhileRunning from the pop-up menu, the data is refreshed automatically after the interval specified in debugconfigurations settings.
The data can be refreshed for the following views:
• Memory view
• Variable view
• Registers view
To specify a time interval to automatically refresh view data during runtime:
1. In the CodeWarrior Projects view, right-click the project folder to display a shortcut menu.
2. Choose Debug As > Debug Configurations from the shortcut menu.
The Debug Configurations dialog appears. The left pane of the Debug Configurations dialog lists debugconfigurations that apply to the current project.
3. Expand the CodeWarrior tree, and choose the name of the debug configuration for which you want tomodify debugger settings.
The right pane of the Debug Configurations dialog shows the settings for the configuration that you selected.
4. Click the Debugger tab.
5. Click the Debug tab from the Debugger Options group.
DebuggerRefreshing data during runtime
CodeWarrior Development Studio Common Features Guide, Rev. 10.x, 01/2016Freescale Semiconductor, Inc. 203

Figure 137: Refresh settings
6. Type the refresh interval in the Refresh while running period (seconds) textbox.
7. Click Apply.
The changes are applied to the selected debug configuration.
3.26 Registers viewThe Registers view lists information about the registers in a selected stack frame.
Values that have changed are highlighted in the Registers view when your program stops.
You can use the Registers view to:
• add, edit, or remove groups of registers
• view register details, such as explanations of a register's bit fields and values
• change register values
• import/export register data
You can also change the number system in which the debugger displays register values. These number systemsare supported:
DebuggerRegisters view
CodeWarrior Development Studio Common Features Guide, Rev. 10.x, 01/2016204 Freescale Semiconductor, Inc.

• Default
• Decimal
• Hexadecimal
• Octal
• Binary
• Fractional
The Registers view also allows you to cast existing data type to complex data types that may or may not existin the debugged executable. For more information on casting a data type, see Cast to Type on page 230.
Casting a register to a type requires that the size of the register must match the size ofthe type, otherwise the cast will fail. Therefore, if the type is a complex one (for example,structure, union), it should be declared first to avoid padding done by compilers.
NOTE
Figure 138: Registers view
This section explains:
• Opening Registers view on page 206
• Viewing registers on page 206
• Changing register values on page 206
DebuggerRegisters view
CodeWarrior Development Studio Common Features Guide, Rev. 10.x, 01/2016Freescale Semiconductor, Inc. 205

• Exporting registers on page 207
• Importing registers on page 208
• Changing register data display format on page 209
3.26.1 Opening Registers viewThis section provides instructions on how to open a registers view.
To open the Registers view:
1. Switch to the Debug perspective.
2. Choose Window > Show View > Registers from the IDE menu bar.
3.26.2 Viewing registersThis section provides instructions on how to view the registers content.
To view registers content:
1. Open the Registers view.
2. Expand a register group.
Expanding a group shows its content by register name and the content of each register in the group.
3.26.3 Changing register valuesThis section provides instructions on how to edit the values of a register.
To change the value of a register:
1. Open the Registers view.
2. Expand the hierarchical list to reveal the register whose value you want to modify.
3. Right-click the register value that you want to change and choose Change Value from the shortcut menuthat appears.
The Set Value dialog appears.
Figure 139: Set Value dialog
4. Enter a new value in the Enter a new value for ALTCAR textbox.
5. Click OK.
The debugger assigns the specified value to the selected register.
DebuggerRegisters view
CodeWarrior Development Studio Common Features Guide, Rev. 10.x, 01/2016206 Freescale Semiconductor, Inc.

Alternatively, you can click on the value and edit it to change the Registers value.
TIP
3.26.4 Exporting registersThis section provides instructions on how to export a register data file.
The export operation generates two files:
• a *.regs file that contains the registers information in XML format which is also used by the importoperation.
• a *.csv file that contains the registers information in plain text CSV (comma-separated values) format thatcan be used for easy visual inspection in an external text editor or MS Excel/Open Office.
To export register data to a file:
1. Open the Registers view.
2. Click the Export registers button in the Registers view toolbar.
The Export Registers dialog appears.
Figure 140: Export Registers dialog
• Registers group - Controls the scope of export operation. Selecting the All option exports all registers inthe Registers view. Selecting the Selected option exports selected registers. If a register group isselected in the Registers view then the entire register tree, starting at the selected node, is exported.
The Selected option is unavailable if no register is selected in the Registers view.
NOTE
DebuggerRegisters view
CodeWarrior Development Studio Common Features Guide, Rev. 10.x, 01/2016Freescale Semiconductor, Inc. 207

• File textbox - Specifies the name of the file to store the exported register information.
• Include register information checkbox - Select to export the location information for registers.
• Overwrite existing checkbox - Select this checkbox to overwrite an existing file.
• Cancel on error checkbox - Select to stop the export operation upon encountering any error.
3. Click Finish.
3.26.5 Importing registersThis section provides instructions on how to import register data.
To import register data from a file:
1. Open the Registers view.
2. Click the Import registers button in the Registers view toolbar.
The Import Registers dialog appears.
Figure 141: Import Registers dialog
• File pop-up menu - Specifies the name of the register data file to import register information.
• Import all registers - Selecting this option allows you to import all registers from the register data file.
• Import selected registers - Selecting this option allows you to select registers you want to import.
• Verify checkbox - When selected, a register write to the target is followed by a read and a comparisonagainst the written value. This ensures that the import operation on the register is successful.
DebuggerRegisters view
CodeWarrior Development Studio Common Features Guide, Rev. 10.x, 01/2016208 Freescale Semiconductor, Inc.

• Cancel on error checkbox - Select to stop the import operation upon encountering any error.
3. Click Finish.
3.26.6 Changing register data display formatYou can also change the format in which the debugger displays the contents of the registers.
For example, you can specify that a register's contents be displayed in hexadecimal, rather than binary. Thedebugger provides these data formats:
• Binary
• Natural
• Decimal
• Hexadecimal
To change register display format:
1. Open the Registers view.
2. Expand the hierarchical list to reveal the register for which you want to change the display format.
3. Select the register value that you want to view in a different format.
The value highlights.
4. Right-click and choose Format > dataformat from the shortcut menu that appears, where dataformat is thedata format in which you want to view the register value.
The register value changes format.
3.27 Register Details viewThe Register Details view shows detailed information for a selected register.
The Register Details view shows the following information for a register:
• Bit Fields - Shows a graphical representation of the selected register's bit values. This graphicalrepresentation shows how the register organizes bits. You can use this representation to select and changethe register's bit values. Hover the cursor over each part of the graphical representation to see additionalinformation.
• Actions - Lets you perform various operations on the selected register's bit-field values.
• Description - Shows explanatory information for the selected register. The information includes name,current value, description, and bit-field explanations and values of the selected register.
The default display of the Registers view shows register details, such as Bit Fields,Description, and Actions. To see more register contents, use the pop-up menu in theRegisters view to choose Layout > Registers View Only. To restore the register details,use the pop-up menu to choose a different menu command.
NOTE
To open the Register Details view, right-click on a register name in the Registers view and choose Show DetailsAs > Register Details pane from the shortcut menu. You can also click the Register Details button on the toolbarto open the Register Details view.
DebuggerRegister Details view
CodeWarrior Development Studio Common Features Guide, Rev. 10.x, 01/2016Freescale Semiconductor, Inc. 209
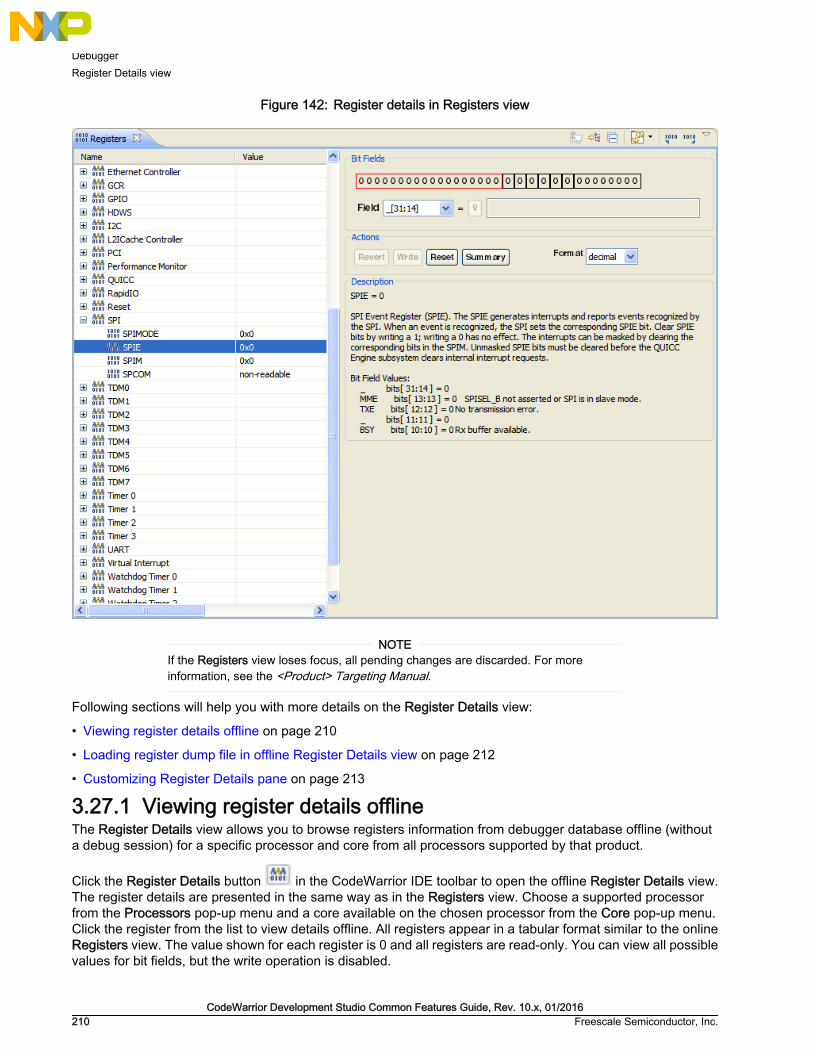
Figure 142: Register details in Registers view
If the Registers view loses focus, all pending changes are discarded. For moreinformation, see the <Product> Targeting Manual.
NOTE
Following sections will help you with more details on the Register Details view:
• Viewing register details offline on page 210
• Loading register dump file in offline Register Details view on page 212
• Customizing Register Details pane on page 213
3.27.1 Viewing register details offlineThe Register Details view allows you to browse registers information from debugger database offline (withouta debug session) for a specific processor and core from all processors supported by that product.
Click the Register Details button in the CodeWarrior IDE toolbar to open the offline Register Details view.The register details are presented in the same way as in the Registers view. Choose a supported processorfrom the Processors pop-up menu and a core available on the chosen processor from the Core pop-up menu.Click the register from the list to view details offline. All registers appear in a tabular format similar to the onlineRegisters view. The value shown for each register is 0 and all registers are read-only. You can view all possiblevalues for bit fields, but the write operation is disabled.
DebuggerRegister Details view
CodeWarrior Development Studio Common Features Guide, Rev. 10.x, 01/2016210 Freescale Semiconductor, Inc.

The Register Details view also provides an editor for "regs" files (files exported from registers view). ChooseFile > Open File and select the previously exported registers dump (. reg ) file, to open the Register Detailsview for viewing and editing registry details offline. For details on how to create a .reg file, see Exportingregisters on page 207.
Figure 143: Viewing register details offline - Visual editor
Upon loading the registers file, you can view and edit the register details in the Visual Editor mode and clickWrite to save the updated details to the .reg file. Alternatively, you can click the Text Editor tab to edit theregisters file.
DebuggerRegister Details view
CodeWarrior Development Studio Common Features Guide, Rev. 10.x, 01/2016Freescale Semiconductor, Inc. 211

Figure 144: Viewing register details offline - Text editor
3.27.2 Loading register dump file in offline Register Details viewYou can load a memory mapped register dump file to see the register values in the offline Register Detailsview.
Memory Mapped Registers(MMR) have static offset information in the debug database. This offset is relative toa base address and is computed at runtime based on a specific formula.
The dump file can be raw binary or in plain hex text format (annotated hex text format not supported yet).
The offline Register Details view displays the offsets from debug database (in the Offset column) and the offsetfrom dump file (in the Load dump file column) from where registers values are loaded. The dump file can beloaded either for an IP block, or a part of an IP block, or multiple IP blocks.
When a new processor is selected, the previously mapping configuration is applied to the new selectedprocessor.
You can add optional columns to the Register Details view by right-clicking on the table'sheader and choosing the required option from the shortcut menu.
NOTE
The following table provides details of the various options that help you load register dump file for mapping onMMR registers. These options are available in the shortcut menu that appears on right-clicking in the RegisterDetails view.
Table 25: Register Details view - Shortcut menu
Menu Command Description
Load dump file Launches the Import Register Dump dialog asking for details of the dumpfile to load.
Unload dump file Unloads the current dump file. The menu command is available only whena dump file is loaded.
Table continues on the next page...
DebuggerRegister Details view
CodeWarrior Development Studio Common Features Guide, Rev. 10.x, 01/2016212 Freescale Semiconductor, Inc.
Table 25: Register Details view - Shortcut menu (continued)
Menu Command Description
Change destination offset Launches the Change Destination Offset dialog asking for a new memoryoffset where the dump file will be loaded. The menu command is availableonly when a dump file is loaded.
Endianness Shows current endianness for the dump file and allows toggling it. The menucommand is available only when a dump file is loaded.
Runtime address Launches the Runtime address dialog asking for runtime address detailsfrom where the dump was made. The menu command is available only whena dump file is loaded.
To load a dump file in the offline Register Details view, perform the following steps.
1. Right-click in the Register Detailsview, and choose Load Dump File from the shortcut menu. Alternatively,you can drag and drop the dump file over the registers.
The Import Register Dump dialog appears.
2. Browse the dump file to be loaded.
3. Specify the Dump type, Destination offset, and dump Endianness in the respective fields. Destinationoffset is the memory offset where the register dump file will be loaded.
4. Click Finish.
A column is added with the name same as that of the loaded dump file along with global offset for the file.For example, dump.bin. To change the value of the destination offset, choose Change destination offset fromthe shortcut menu.
In case you choose the drag and drop method to load the dump file, the Dump file and Destination offset areautomatically filled in. You can change the endianness for the dump file by choosing Endianness from theshortcut menu. The value of the register will be loaded from dump file at displayed file offset and using thedisplayed endianness. The registers that are mapped outside the dump file range display “NA” in the dump filecolumn.
3.27.3 Customizing Register Details paneYou can customize background color, fonts, and foreground color for the Register Details pane.
To customize Register Details pane:
1. Open the Registers view.
2. Choose Window > Preferences from the IDE menu bar.
The Preferences dialog appears.
3. Choose General > Appearance > Colors and Fonts from the left pane of the Preferences dialog.
The color and fonts preferences appear in the right pane of the Preferences dialog.
DebuggerRegister Details view
CodeWarrior Development Studio Common Features Guide, Rev. 10.x, 01/2016Freescale Semiconductor, Inc. 213

Figure 145: Preferences dialog
4. Expand Debug > Register Details tree controls.
5. Modify colors and fonts settings to suit your needs.
6. Click Apply.
7. Click OK.
3.28 Remote launchThe remote launch feature of CodeWarrior allows launch configurations to be executed remotely.
A Jython script is used to declare which launch configuration to use as a basis and provides points of interactionwith the executing launch configuration if desired.
The launch scripts can be submitted to CodeWarrior in these ways:
• The submissions web page
• Java and/or Python Clients
CodeWarrior requires a launch configuration to be set up on the host CodeWarrior instance in order to execute.The remote launch script will make a copy of that launch configuration, execute it, and then delete theconfiguration.
This section explains:
DebuggerRemote launch
CodeWarrior Development Studio Common Features Guide, Rev. 10.x, 01/2016214 Freescale Semiconductor, Inc.

• Remote Launch view on page 215
3.28.1 Remote Launch viewThe Remote Launch view displays the remote launch configurations for the project.
The Enable Remote Launch option in the pop-up menu is a toggle button to enable or disable the remote launchview. The Open Remote Launch Web Page opens the CodeWarrior Remote Launch web page where you cansubmit remote launch scripts.
Click the Help/Examples link in the CodeWarrior Remote Launch web page for remotelaunch examples.
NOTE
To open the Remote Launch view:
1. Choose Window > Show View > Others from the IDE menu bar.
The Show View dialog appears.
Figure 146: Show View dialog
2. Expand the Debug tree control.
3. Select Remote Launch.
4. Click OK.
The Remote Launch view appears.
DebuggerRemote launch
CodeWarrior Development Studio Common Features Guide, Rev. 10.x, 01/2016Freescale Semiconductor, Inc. 215

Figure 147: Remote Launch view
The Jython Consoles view is a scripting view where you can work with Jython scripts. You can use this view totest remote launches.
Figure 148: Jython Consoles view
3.29 Stack crawlsCodeWarrior allows you to limit the depth of stack crawls in the debugger.
You can limit the stack crawl depth in two ways.
• One Frame mode on page 216
• Global preference on page 217
3.29.1 One Frame modeIn the one frame mode, only the topmost frame is retrieved by the debugger engine and displayed in theDebug view and in the debugger shell.
The following figure shows selecting the one-frame mode from the Debug view.
DebuggerStack crawls
CodeWarrior Development Studio Common Features Guide, Rev. 10.x, 01/2016216 Freescale Semiconductor, Inc.
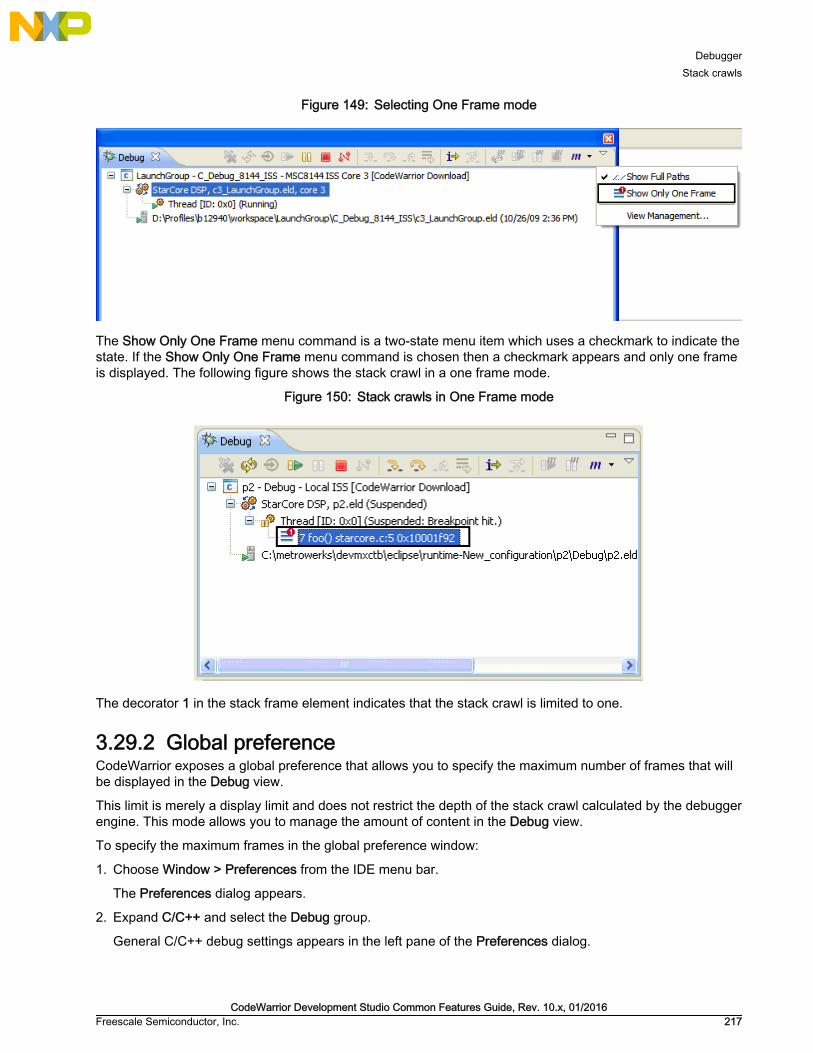
Figure 149: Selecting One Frame mode
The Show Only One Frame menu command is a two-state menu item which uses a checkmark to indicate thestate. If the Show Only One Frame menu command is chosen then a checkmark appears and only one frameis displayed. The following figure shows the stack crawl in a one frame mode.
Figure 150: Stack crawls in One Frame mode
The decorator 1 in the stack frame element indicates that the stack crawl is limited to one.
3.29.2 Global preferenceCodeWarrior exposes a global preference that allows you to specify the maximum number of frames that willbe displayed in the Debug view.
This limit is merely a display limit and does not restrict the depth of the stack crawl calculated by the debuggerengine. This mode allows you to manage the amount of content in the Debug view.
To specify the maximum frames in the global preference window:
1. Choose Window > Preferences from the IDE menu bar.
The Preferences dialog appears.
2. Expand C/C++ and select the Debug group.
General C/C++ debug settings appears in the left pane of the Preferences dialog.
DebuggerStack crawls
CodeWarrior Development Studio Common Features Guide, Rev. 10.x, 01/2016Freescale Semiconductor, Inc. 217

Figure 151: Preferences dialog
3. Type the maximum frame depth in the Maximum stack crawl depth textbox.
The upper limit for maximum frame depth is 100.
NOTE
4. Click Apply.
5. Click OK.
Changing the stack crawl preference does not have an immediate effect on stack crawls currently displayed inthe Debug view. The limit takes effect the next time the stack crawl is constructed, which happens either on thenext suspended event, or after toggling in or out of the one frame mode.
When the actual stack crawl depth of a core exceeds the number of frames specified in the global preference,the stack crawl contains a final frame that is labeled ... ( Figure 152. Exceeding stack crawl depth on page219). This label indicates that frames are being omitted from display.
DebuggerStack crawls
CodeWarrior Development Studio Common Features Guide, Rev. 10.x, 01/2016218 Freescale Semiconductor, Inc.

Figure 152: Exceeding stack crawl depth
3.30 SymbolicsUse the Symbolics page to specify whether the debugger keeps symbolics in memory.
Symbolics represent an application's debugging and symbolic information. Keeping symbolics in memory, knownas caching symbolics, helps when you debug a large application.
Suppose that the debugger loads symbolics for a large application, but does not download program code anddata to a hardware device. Also, suppose that the debugger uses custom makefiles with several build steps inorder to generate the large application. In this situation, caching symbolics helps speed up the debuggingprocess. The debugger uses the cached symbolics during subsequent debugging sessions. Otherwise, thedebugger spends significant time creating an in-memory representation of symbolics during subsequentdebugging sessions.
Caching symbolics provides the most benefit for large applications because doing sospeeds up application-launch times. If you debug a small application, caching symbolicsdoes not significantly improve launch times.
NOTE
To open the Symbolics page:
1. Choose Run > Debug Configurations from the IDE menu bar.
The Debug Configurations dialog appears. The left side of this dialog has a list of debug configurations thatapply to the current application.
2. Expand CodeWarrior and select the debug configuration that you want to modify.
3. Click the Debugger tab to view the corresponding debugger settings page.
4. Click the Symbolics tab in the Debugger Options group on the page.
The Symbolics page appears.
DebuggerSymbolics
CodeWarrior Development Studio Common Features Guide, Rev. 10.x, 01/2016Freescale Semiconductor, Inc. 219

Figure 153: Symbolics page
3.31 System Browser viewThe System Browser view is a framework for displaying embedded operating system (OS) information.
If you are working with a target running an embedded OS, you can use the System Browser view to gatherinformation about the OS during a debug session.
This section includes:
• Opening System Browser view on page 220
3.31.1 Opening System Browser viewThe System Browser view allows you to debug specific threads, tasks, and processes running in the OS.
To open the System Browser view:
1. Start a debugging session.
2. Choose Window > Show View > Other from the IDE menu bar.
The Show View dialog appears.
DebuggerSystem Browser view
CodeWarrior Development Studio Common Features Guide, Rev. 10.x, 01/2016220 Freescale Semiconductor, Inc.

Figure 154: Show View dialog
3. Expand the Debug group and select System Browser.
4. Click OK.
The System Browser view appears.
Figure 155: System Browser view
DebuggerSystem Browser view
CodeWarrior Development Studio Common Features Guide, Rev. 10.x, 01/2016Freescale Semiconductor, Inc. 221

The System Browser view shows information only when there is an OS running on thetarget being debugged.
NOTE
3.32 Target connection lostYou can configure the debugger's behavior when connection to the target is lost, such as low power modes,target power switched off, target changed communication speed, or disconnected run control.
This feature helps you configure the debugger to close the connection or automatically reconnect with a specifiedtime-out value.
To configure target connection lost settings for debugger:
1. Open Remote System view.
2. Right-click a remote system name and choose Properties from the shortcut menu.
The Properties for <Remote System> dialog appears.
3. In the right pane, click Advanced tab.
The advanced connection settings appear under the Advanced pane.
Figure 156: Advanced settings
4. Specify the target connection lost settings to suit your needs.
• Try to reconnect - Whenever target connection is lost, the debugger does not close the debug sessionbut waits for the connection to be restored. A time-out may be specified to limit the waiting time. Whenthe time-out expires, the debugger closes the debug session.
• Terminate the debug session - Select this option to terminate the debug session when target connectionis lost.
• Ask me - Select this option to prompt the user for an action when target connection is lost.
DebuggerTarget connection lost
CodeWarrior Development Studio Common Features Guide, Rev. 10.x, 01/2016222 Freescale Semiconductor, Inc.

5. Click OK.
You have just configured target connection lost settings for debugger.
3.33 Target initialization filesA target initialization file contains commands that initialize registers, memory locations, and other componentson a target board.
The most common use case is to have the CodeWarrior debugger execute a target initialization file immediatelybefore the debugger downloads a bareboard binary to a target board. The commands in a target initializationfile put a board in the state required to debug a bareboard program.
The target board can be initialized either by the debugger (by using an initialization file),or by an external boot loader or OS (U-Boot, Linux). In both cases, the extra use of aninitialization file is necessary for debugger-specific settings (for example, siliconworkarounds needed for the debug features).
NOTE
This section includes:
• Selecting target initialization file on page 223
3.33.1 Selecting target initialization fileA target initialization file is a command file that the CodeWarrior debugger executes each time the launchconfiguration to which the initialization file is assigned is debugged. You can use the target initialization file forall launch configuration types (Attach, Connect and Download).
The target initialization file is executed after the connection to the target is established, but before the downloadoperation takes place.
The debugger executes the commands in the target initialization file using the target connection protocol, suchas a JTAG run control device.
You do not need to use an initialization file if you debug using the CodeWarrior TRKdebug protocol.
NOTE
To select a target initialization file, follow these steps:
1. Go to the Remote Systems view on page 68.
2. Right-click a remote system name and choose Properties from the shortcut menu.
The Properties for <Remote System> dialog appears.
3. Click the Initialization tab.
DebuggerTarget initialization files
CodeWarrior Development Studio Common Features Guide, Rev. 10.x, 01/2016Freescale Semiconductor, Inc. 223

Figure 157: Properties for <Remote System> - Initialization settings
4. Click the ellipsis button in the Initialize target script column corresponding to the core for which you want toselect the target initialization file.
Click in the specified cell of the Initialize target script column for the ellipsis button toappear.
TIP
The Target Initialization File dialog appears.
Figure 158: Target Initialization File dialog
a. Select the File checkbox to enable the textbox.
b. Enter the target initialization file path in the File textbox. You can use the Workspace, File System, orVariables buttons to select the desired file.
c. Click OK.
DebuggerTarget initialization files
CodeWarrior Development Studio Common Features Guide, Rev. 10.x, 01/2016224 Freescale Semiconductor, Inc.

The target initialization file path appears in the Initialize target column.
5. Click OK.
3.34 Target Tasks viewYou can use the Target Tasks view to run a hardware-diagnostic or memory operation.
To open the Target Tasks view:
1. Choose Window > Show View > Other from the IDE menu bar.
The Show View dialog appears.
2. Expand the Debug group and select Target Tasks.
3. Click OK.
The Target Tasks View appears in the Debug perspective.
Figure 159: Target Task view
This section includes:
• Exporting target tasks on page 225
• Importing target tasks on page 226
3.34.1 Exporting target tasksYou can export a target task to an external file. The exported task is stored in XML format.
To export a target task:
1. Select the target task in the Target Task view.
2. Click the Export button from the Target Task view toolbar. Alternatively, right-click the target task andchoose Export from the shortcut menu.
The Save As dialog appears.
3. Type a file name in the File name pop-up menu.
4. Click Save.
DebuggerTarget Tasks view
CodeWarrior Development Studio Common Features Guide, Rev. 10.x, 01/2016Freescale Semiconductor, Inc. 225

3.34.2 Importing target tasksYou can import a target task from an external file.
To import a target task:
1. Click the Import button in the Target Tasks view toolbar. Alternatively, right-click in the Target Tasks viewand chosse Import from the shortcut menu.
The Open dialog appears.
2. Select a target task file.
3. Click Open.
3.35 VariablesThe Variables view shows all global and static variables for each process that you debug.
Use the view to observe changes in variable values as the program executes.
Figure 160: Variables view
This section includes:
• Opening Variables view on page 227
DebuggerVariables
CodeWarrior Development Studio Common Features Guide, Rev. 10.x, 01/2016226 Freescale Semiconductor, Inc.

• Adding variable location to view on page 227
• Manipulating variable values on page 228
• Adding global variables on page 229
• Cast to Type on page 230
3.35.1 Opening Variables viewUse the Variables view to display information about the variables in the currently-selected stack frame.
To open the Variables view:
1. Choose Window > Show View > Other from the IDE menu bar.
The Show View dialog appears.
2. Expand the Debug group and choose Variables.
3. Click OK.
The Variables view appears.
3.35.2 Adding variable location to viewYou can add the variable location column in the Variables view. A variable location can be a memory addressor a register.
This can change from one execution point to another in the target application. The return value will be ahexadecimal ("0x...") value if the variable is in memory; if it is in a register, $<register-name> will be returned.
To add the variable location column in the Variables view:
1. Open the pop-up menu in the Variables view .
2. Choose Layout > Select Columns.
The Select Columns dialog appears.
DebuggerVariables
CodeWarrior Development Studio Common Features Guide, Rev. 10.x, 01/2016Freescale Semiconductor, Inc. 227

Figure 161: Select Columns dialog
In the Variables view, Freescale CDT (C/C++ Development toolkit) does not support theActual Type column. This column is relevant for C++ only when RTTI (Runtime typeinformation) is used. Choose Window > Preferences... > C/C++ > Debug > CodeWarriorDebugger, and select the Attempt to show the dynamic runtime type of objects checkboxto get declared types displaying the Actual types.
NOTE
3. Select the Location checkbox.
4. Click OK.
You can use the Select Columns dialog to hide/show different columns in the Variablesview.
TIP
The variable location column appears in the Variables view.
3.35.3 Manipulating variable valuesYou can change the way the Variables view displays a variable value.
To manipulate the format of a variable value, choose Format from the shortcut menu and choose any of thefollowing formats:
• Binary
• Natural
DebuggerVariables
CodeWarrior Development Studio Common Features Guide, Rev. 10.x, 01/2016228 Freescale Semiconductor, Inc.

• Decimal
• Hexadecimal
• Fractional
This topic includes:
• Fractional variable formats on page 229
3.35.3.1 Fractional variable formatsIn addition to the Natural, Binary, Decimal, and Hexadecimal variable formats, CodeWarrior also supports anadditional class of custom fractional formats called Qn.
Qn is a floating point representation of a fractional or fixed point number where n signifies the number of fractionalbits (the number of bits to the right of the binary point).
CodeWarrior supports fractional formats ranging from Q0 to Q31 and for StarCore devices it ranges from Q0 toQ39.
To change the variable display format to fractional format:
1. Open the Variables view.
2. Right-click a variable in the Variables view.
A shortcut menu appears.
3. Choose Format > Fractional > Qn (where n = 0 to 31 and for StarCore devices n = 0 to 39).
The variable value will be displayed in the specified Qn format.
The Qn formats are available or dimmed depending on the size of the variable.
- Q0 - Q7 available for 1 byte variables
- Q0 - Q15 available for 2 byte variables
- Q0 - Q31 available for 4 byte variables
- Q0 - Q39 available for 5 byte variables. For variable size more than 32 bits, Q32-Q39is available.
NOTE
3.35.4 Adding global variablesYou can add global variables to the Variables view.
To add global variable:
1. Choose Project > Debug from the IDE menu bar.
A debugging session starts.
2.In the Variables view toolbar, click the Add Global Variables button .
The Add Globals dialog appears.
You can also add a global variable by choosing the Add Global Variable command fromthe shortcut menu.
TIP
DebuggerVariables
CodeWarrior Development Studio Common Features Guide, Rev. 10.x, 01/2016Freescale Semiconductor, Inc. 229

Figure 162: Add Globals dialog
3. Specify a search criteria in the available textbox to filter the list of variables.
4. Select the global variable to be added.
Global variables of other executables (other than the main one) are also listed in theAdd Globals dialog.
NOTE
5. Click OK.
3.35.5 Cast to TypeThis feature allows the user to cast the type of a variable to a particular type.
The Cast to Type dialog helps you filter the type list based on a search pattern specified in the search textbox.
To cast a variable to a selected type:
1. Open the Variables view.
2. Right-click a variable in the Variables view and choose Cast to Type from the shortcut menu.
The Cast to Type dialog appears.
DebuggerVariables
CodeWarrior Development Studio Common Features Guide, Rev. 10.x, 01/2016230 Freescale Semiconductor, Inc.

Figure 163: Cast to Type dialog
3. Specify a search pattern in the Search textbox.
The matching types appear in the Matching Items listbox.
4. Select a type from the Matching Items listbox.
5. Click OK.
3.36 WatchpointsYou use watchpoints (sometimes referred to as access breakpoints or memory breakpoints) to halt programexecution when your program reads or writes to a specific memory location.
You can then examine the call chain, check register and variable values, and step through your code. You canalso change variable values and alter the flow of normal program execution.
You can set a watchpoint from the:
• Breakpoints view
• Memory view
• Registers view
DebuggerWatchpoints
CodeWarrior Development Studio Common Features Guide, Rev. 10.x, 01/2016Freescale Semiconductor, Inc. 231
• Variables view
Not all targets support setting a watchpoint on a memory range. For example, if a targethas only one or two debug watch registers, you cannot set a watchpoint on 50 bytes.
NOTE
The debugger handles both watchpoints and breakpoints in a similar way. You use the Breakpoints view tomanage both types. For example, you use the Breakpoints view to add, remove, enable, and disable bothwatchpoints and breakpoints.
The debugger attempts to set the watchpoint if a session is in progress based on the active debugging context(the active context is the selected project in the Debug view). If the debugger sets the watchpoint when nodebugging session is in progress, or when re-starting a debugging session, the debugger attempts to set thewatchpoint at startup as it does for breakpoints.
The Problems view displays error messages when the debugger fails to set a watchpoint. For example, if youset watchpoints on overlapping memory ranges, or if a watchpoint falls out of execution scope, an error messageappears in the Problems view. You can use this view to see additional information about the error.
This section includes the following topics:
• Setting watchpoint on page 232
• Creating watchpoint on page 233
• Viewing watchpoint properties on page 234
• Modifying watchpoint properties on page 235
• Disabling watchpoint on page 236
• Enabling watchpoint on page 236
• Remove watchpoint on page 237
• Remove all watchpoints on page 237
3.36.1 Setting watchpointUse the Add Watchpoint dialog (Creating watchpoint on page 233) to set a watchpoint. When the value at thememory address on which you set a watchpoint changes, your program's execution halts and the debuggertakes control.
To set a watchpoint:
1. Open the Debug perspective.
2. Open any of the following views:
• Breakpoints
• Memory
• Register
• Variables
3. Right-click in the selected view.
The process of setting a watchpoint varies depending upon the type of view:
• Registers - select register(s) on which you want to set the watchpoint and choose Watch from theshortcut menu that appears.
• Variables - select global variable(s) and choose Watch from the shortcut menu.
• Breakpoints - choose Add Watchpoint (C/C++) from the shortcut menu.
DebuggerWatchpoints
CodeWarrior Development Studio Common Features Guide, Rev. 10.x, 01/2016232 Freescale Semiconductor, Inc.

The Add Watchpoint dialog appears.
• Memory - select the addressable unit or range of units on which you want to set the watchpoint, right-click, and choose Add Watchpoint (C/C++) from the shortcut menu that appears.
The Add Watchpoint dialog appears.
The Breakpoints view shows information about the newly set watchpoint and the number of addressable unitsthat the watchpoint monitors.
The Problems view shows error messages if the debugger fails to set a watchpoint.
3.36.2 Creating watchpointUse the Add Watchpoint dialog to create a watchpoint.
The debugger sets the watchpoint according to the settings that you specify in this dialog.
The following table describes each option.
Table 26: Add Watchpoint dialog options
Option Description
Expression to Watch Enter an expression that evaluates to an address onthe target device. The debugger displays an errormessage when the specified expression evaluates toan invalid address. You can enter these types ofexpressions:
• An r-value, such as &variable
• A register-based expression. Use the $ character todenote register names. For example, enter $SP-12to have the debugger set a watchpoint on the stack-pointer address minus 12 bytes.
The Add Watchpoints dialog does not support enteringexpressions that evaluate to registers.
Memory Space Select it if you want to specify the memory space inwhich the watchpoint is set. The pop-up menu to theright of the checkbox lists each memory spaceavailable for the active debug context. If no debugsession is active, the pop-up menu is empty and letsyou enter text. This feature lets you set a memory-space-qualified watchpoint before starting a debugsession.
Range If selected - enter the number of addresable units thatthe watchpoints monitors. If deselected - set thewatchpoint on the entire range of memory occupied bythe variable.
Write If selected - the watchpoint monitors write activity onthe specified memory space and address range. Ifdeselected - the watchpoint does not monitor writeactivity.
Table continues on the next page...
DebuggerWatchpoints
CodeWarrior Development Studio Common Features Guide, Rev. 10.x, 01/2016Freescale Semiconductor, Inc. 233

Table 26: Add Watchpoint dialog options (continued)
Option Description
Read If selected - the watchpoint monitors read activity onthe specified memory space and address range. Ifdeselected - the watchpoint does not monitor readactivity.
Enabled Select the Enabled option to enable or disable abreakpoint.
Condition Specifies an expression that is evaluated when thewatchpoint is hit.
Ignore count Set the ignore count of watchpoint number to aninteger n. The next n times the watchpoint is reached,program's execution does not stop; other than todecrement the ignore count, debugger takes no action.To make the watchpoint stop the next time it isreached, specify a count of 0 (zero).
3.36.3 Viewing watchpoint propertiesAfter you set a watchpoint, you can view its properties.
To view properties for a watchpoint:
1. Right-click the watchpoint in the Breakpoints view and choose Properties from the shortcut menu.
The Properties for dialog appears.
DebuggerWatchpoints
CodeWarrior Development Studio Common Features Guide, Rev. 10.x, 01/2016234 Freescale Semiconductor, Inc.

Figure 164: Properties for dialog
3.36.4 Modifying watchpoint propertiesAfter you set a watchpoint, you can modify its properties.
To modify properties for a watchpoint:
1. Right-click the watchpoint in the Breakpointsview and choose Breakpoint Properties from the shortcutmenu.
The Properties for C/C++ Watchpoint dialog appears.
2. Select Common in the left pane of the Properties for C/C++ Watchpoint dialog.
The right pane displays the common properties for the watchpoint.
DebuggerWatchpoints
CodeWarrior Development Studio Common Features Guide, Rev. 10.x, 01/2016Freescale Semiconductor, Inc. 235

Figure 165: Common watchpoint properties
3. Edit the values in the fields.
4. Click OK.
3.36.5 Disabling watchpointDisable a watchpoint to prevent it from affecting program execution.
The disabled watchpoint remains at the memory location at which you set it, so that you can enable it later.
To disable a watchpoint, select its name in the Breakpoints view, right-click and choose Disable from the shortcutmenu.
3.36.6 Enabling watchpointEnable a watchpoint to have it halt program execution when its associated memory location changes value.
Enabling a watchpoint that you previously disabled is easier than clearing it and re-creating it from scratch.
To enable a watchpoint, select its name in the Breakpoints view, right-click and choose Enable from the shortcutmenu.
DebuggerWatchpoints
CodeWarrior Development Studio Common Features Guide, Rev. 10.x, 01/2016236 Freescale Semiconductor, Inc.

3.36.7 Remove watchpointThis section explains how to remove a watchpoint.
To remove a watchpoint in the Breakpoints view, select its name from the list, right-click and choose Removefrom the shortcut menu that appears.
3.36.8 Remove all watchpointsThis section explains how to remove all the watchpoints.
To remove all watchpoints, right-click in the Breakpoints view and choose Remove All from the shortcut menuthat appears. The Breakpoints view reflects your changes.
DebuggerWatchpoints
CodeWarrior Development Studio Common Features Guide, Rev. 10.x, 01/2016Freescale Semiconductor, Inc. 237

DebuggerWatchpoints
CodeWarrior Development Studio Common Features Guide, Rev. 10.x, 01/2016238 Freescale Semiconductor, Inc.

Chapter 4Debugger ShellCodeWarrior supports a command-line interface to some of its features including the debugger. You can usethe command-line interface together with TCL scripting engine. You can even issue a command that saves thecommand-line activity to a log file.
The Debugger Shell view is used to issue command lines to the IDE. For example, you enter the commanddebug in this window to start a debugging session. The window lists the standard output and standard errorstreams of command-line activity.
Figure 166: Debugger Shell view
To open the Debugger Shell view, perform these steps.
1. Switch the IDE to the Debug perspective and start a debugging session.
2. Choose Window > Show View > Debugger Shell.
The Debugger Shell view appears ( Figure 166. Debugger Shell view on page 239).
Alternatively, choose Window > Show View > Other. Expand the Debug tree control inthe Show View dialog, choose Debugger Shell, and click OK.
NOTE
Debugger Shell
CodeWarrior Development Studio Common Features Guide, Rev. 10.x, 01/2016Freescale Semiconductor, Inc. 239
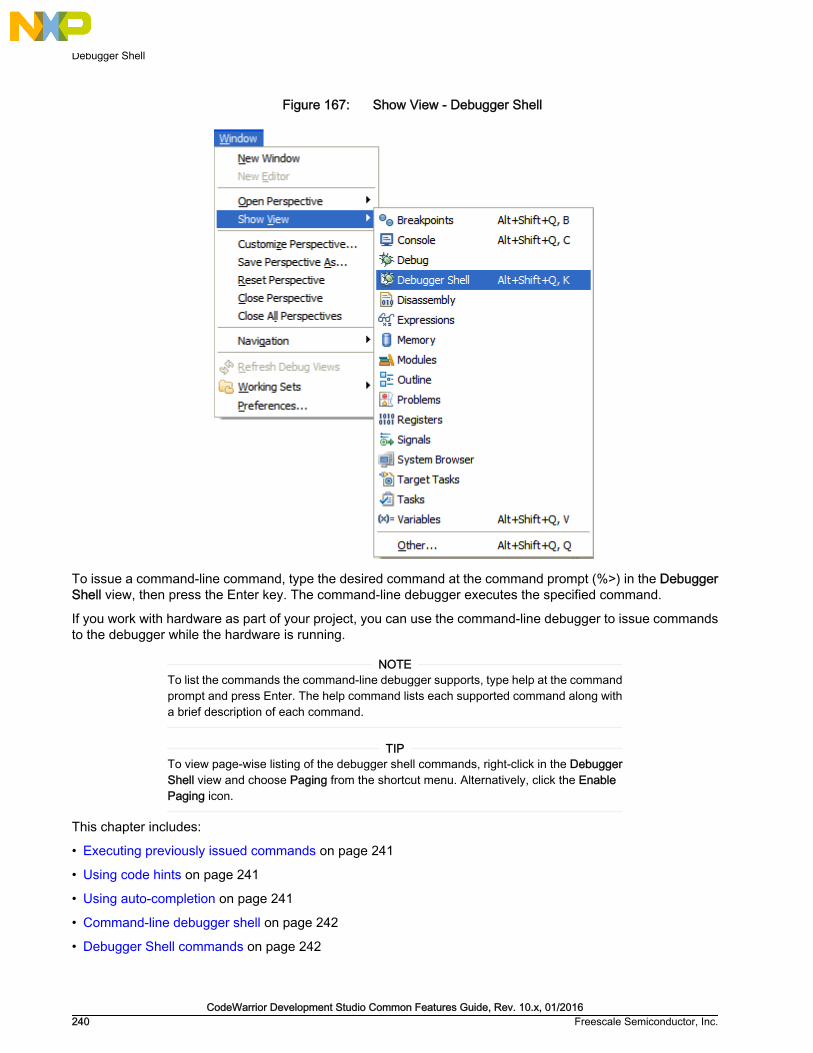
Figure 167: Show View - Debugger Shell
To issue a command-line command, type the desired command at the command prompt (%>) in the DebuggerShell view, then press the Enter key. The command-line debugger executes the specified command.
If you work with hardware as part of your project, you can use the command-line debugger to issue commandsto the debugger while the hardware is running.
To list the commands the command-line debugger supports, type help at the commandprompt and press Enter. The help command lists each supported command along witha brief description of each command.
NOTE
To view page-wise listing of the debugger shell commands, right-click in the DebuggerShell view and choose Paging from the shortcut menu. Alternatively, click the EnablePaging icon.
TIP
This chapter includes:
• Executing previously issued commands on page 241
• Using code hints on page 241
• Using auto-completion on page 241
• Command-line debugger shell on page 242
• Debugger Shell commands on page 242
Debugger Shell
CodeWarrior Development Studio Common Features Guide, Rev. 10.x, 01/2016240 Freescale Semiconductor, Inc.

4.1 Executing previously issued commandsThe debugger shell maintains a history of previously executed commands. Instead of re-typing thesecommands, you can recall them from the history. To recall a command from the history, press the Up arrowkey.
Each press of the Up arrow key shows the preceding issued command. Each press of the Down arrow key showsthe succeeding issued command.
4.2 Using code hintsYou can have the debugger shell complete the name of a command as you enter it on the command-line.
As you continue typing characters, the debugger shell refines the list of possible commands. For example, youcan use this technique as a shortcut to entering help to see a full list of commands.
To use code hints in the debugger shell:
1. Open the Debugger Shell view.
2. Type Ctrl + Space .
Code hints appear. As you enter additional characters, the debugger shell refines the commands that appearin the code hints. Use the arrow keys or the mouse to scroll through the command names that appear in thelist. The debugger shell shows additional information for the highlighted command name.
3. Highlight the name of the command that you want to have the debugger shell complete for you.
4. Press the Enter key, or double-click the name of the command.
The remaining characters of the command name appear in the debugger shell.
Press the Esc key to exit code hints and return to the debugger shell.
NOTE
4.3 Using auto-completionThis section explains the auto-completion feature of CodeWarrior.
The Debugger Shell supports auto-completion of these items:
• Debugger Shell commands
• Arguments (such as file path)
• TCL commands (both built-in and those created with proc)
To use auto-completion:
1. Open the Debugger Shell view.
2. Type the initial characters of an item that the debugger shell can auto-complete.
3. Press the Tab key.
The remaining characters of the item appear in the debugger shell.
Debugger ShellExecuting previously issued commands
CodeWarrior Development Studio Common Features Guide, Rev. 10.x, 01/2016Freescale Semiconductor, Inc. 241

If you enter the abbreviated form of an IDE command name, press the spacebar insteadof the Tab key to have the IDE auto-complete the command name
TIP
4.4 Command-line debugger shellThe command-line debugger engine executes the commands that you enter in the debugger shell and thendisplays the results.
Use the debugger shell to execute commands in a command-line environment. For example, the launch, debug,and run commands let you list or run launch configurations from the command line.
4.5 Debugger Shell commandsThis topic lists and defines every command-line debugger command.
Following list of commands are used:
• about on page 244
• alias on page 244
• bp on page 245
• cd on page 246
• change on page 246
• cls on page 249
• cmdwin::ca on page 249
• cmdwin::caln on page 249
• config on page 250
• copy on page 254
• debug on page 255
• dir on page 255
• disassemble on page 256
• display on page 257
• evaluate on page 260
• finish on page 261
• fl::blankcheck on page 262
• fl::checksum on page 262
• fl::device on page 263
• fl::diagnose on page 264
• fl::disconnect on page 265
• fl::dump on page 265
• fl::erase on page 266
Debugger ShellCommand-line debugger shell
CodeWarrior Development Studio Common Features Guide, Rev. 10.x, 01/2016242 Freescale Semiconductor, Inc.

• fl::image on page 266
• fl::protect on page 267
• fl::secure on page 267
• fl::target on page 268
• fl::verify on page 269
• fl::write on page 269
• funcs on page 269
• getpid on page 269
• go on page 269
• help on page 270
• history on page 271
• jtagclock on page 271
• kill on page 271
• launch on page 272
• linux::displaylinuxlist on page 272
• linux::loadsymbolics on page 273
• linux::refreshmodules on page 273
• linux::selectmodule on page 273
• linux::unloadsymbolics on page 273
• loadsym on page 273
• log on page 274
• mc::config on page 274
• mc::go on page 275
• mc::group on page 275
• mc::kill on page 276
• mc::reset on page 276
• mc::restart on page 276
• mc::stop on page 277
• mc::type on page 277
• mem on page 278
• next on page 280
• nexti on page 280
• oneframe on page 280
• pwd on page 281
• quitIDE on page 281
• radix on page 281
• redirect on page 282
Debugger ShellDebugger Shell commands
CodeWarrior Development Studio Common Features Guide, Rev. 10.x, 01/2016Freescale Semiconductor, Inc. 243

• refresh on page 283
• reg on page 283
• reset on page 286
• restart on page 286
• restore on page 287
• run on page 288
• save on page 288
• setpc on page 289
• setpicloadaddr on page 290
• stack on page 290
• status on page 291
• step on page 291
• stepi on page 292
• stop on page 292
• switchtarget on page 293
• system on page 294
• var on page 294
• wait on page 295
• watchpoint on page 296
4.5.1 aboutLists the version information.
Syntax
about
4.5.2 aliasCreates an alias for a debug command, removes such an alias, or lists all current aliases.
Syntax
alias [<alias> [<command>]]
Parameters
alias
Lists current aliases.
Examples
The following table lists and defines examples of the alias command.
Debugger ShellDebugger Shell commands
CodeWarrior Development Studio Common Features Guide, Rev. 10.x, 01/2016244 Freescale Semiconductor, Inc.

Table 27: alias Command-line debugger commands - Examples
Command Description
alias Lists current aliases.
alias ls dir Issues the dir command when ls is typed.
alias ls Removes the alias ls.
4.5.3 bpSets a breakpoint, removes a breakpoint, or lists the current breakpoints.
Syntax
bp
bp [-{hw|sw|auto}] {<func>|[<ms>:]<addr>|<file> <line> [<column>]}
bp [-{hw|sw|auto}] {<file> <line> [<function>] [column]}
bp all|#<id>|#<id.instance>|<func>|<addr> off|enable|disable|{ignore <count>}
bp #<id> cond <c-expr>
Examples
The following table lists and defines examples of the bp command.
Table 28: bp Command-line debugger command - Examples
Command Description
bp Lists all breakpoints.
bp -hw fn Sets hardware breakpoint at function fn().
bp -auto file.cpp 101 1 Sets an auto breakpoint on file file.cpp at line 101,column 1.
bp -auto file.cpp 101 "int foo<int>()" 1 Sets an auto breakpoint on file file.cpp at line 101 onfunction template instance " int foo<int>() ",column 1.
bp fn off Removes the breakpoint at function fn().
bp 10343 Sets a breakpoint at memory address 10343.
bp #4 off Removes the breakpoint number 4.
bp #4 disable Disables the breakpoint number 4.
bp #4 ignore 3 Sets ignore count to 3 for breakpoint number 4.
bp #4 cond x == 3 Sets the condition for breakpoint number 4 to fire onlyif x == 3.
bp #4.1 off Removes the breakpoint instance number 4.1.
bp #4.1 ignore 3 Sets ignore count to 3 for breakpoint instance number4.1.
bp #4.1 cond x == 3 Sets the condition for breakpoint instance number 4.1to fire only if x == 3.
Debugger ShellDebugger Shell commands
CodeWarrior Development Studio Common Features Guide, Rev. 10.x, 01/2016Freescale Semiconductor, Inc. 245

4.5.4 cdChanges to a different directory or lists the current directory.
Pressing the Tab key completes the directory name automatically.
Syntax
cd [<path>]
Parameter
path
Directory pathname; accepts asterisks and wildcards.
Examples
The following table lists and defines examples of the cd command.
Table 29: cd Command-line debugger command - Examples
Command Description
cd Displays current directory.
cd c: Changes to the C: drive root directory.
cd d:/mw/0622/ test Changes to the specified D: drive directory
cd c:p*s Changes to any C: drive directory whose name starts with p and ends withs.
4.5.5 changeChanges the contents of register, memory location, block of registers, or memory locations.
Syntax
change <addr-spec> [<range>] [-s|-ns] [%<conv>] <value>
change <addr-spec>{..<addr>|#<n>} [<range>] [-s|-ns] [%<conv>] <value>
change <reg-spec> [<n>] [-s|-ns] [%<conv>] <value>
change <reg-spec>{..<reg>|#<n>} [-s|-ns] [%<conv>] <value>
change <var-spec> [-s|-ns] [%<conv>] <value>
change v <var> [-s|-ns] [%<conv>] <value>
Parameter
The following table lists and defines parameters of the change command.
Table 30: change Command-line debugger command - Parameters
Command Description
<ms> On architectures supporting multiple memory spaces, specifies the memory space inwhich <addr> is to be found. See help for the option -ms of display or mem for moreinformation on memory spaces. If unspecified, the setting "config MemIdentifier" is used.
Table continues on the next page...
Debugger ShellDebugger Shell commands
CodeWarrior Development Studio Common Features Guide, Rev. 10.x, 01/2016246 Freescale Semiconductor, Inc.

Table 30: change Command-line debugger command - Parameters (continued)
Command Description
<addr> Target address in hex format.
<count> Number of memory cells.
x<cell-size> Memory is displayed in units called cells, where each cell consists of <cell-size> bytes.If unspecified, the setting "config MemWidth" is used.
h<access-size> Memory is accessed with a hardware access size of <access-size> bytes. If unspecified,the setting "config MemAccess" is used.
{8,16,32,64}bit Sets both <cell-size> and <access-size>.
<a1>{..<a2>|#<n>} Specifies a range of memory either by two endpoints, <a1> and <a2>, or by a startpointand a byte count, <a1> and <n>. This alternate syntax is provided mainly for backwardscompatibility. The new form of <addr> and <count> should be easier to use and thuspreferred.
{r|nr} If multiple registers are specified, then the prefix r: causes a recursive, depth-firsttraversal of the register hierarchy. The prefix nr: prevents recursion. If unspecified,recursion is the default. Note that different levels of the register hierarchy arerepresented in the manner of a path with forward-slashes '/' used to delimit the registergroups. A name that contains a slash itself can be represented with an escape backward-slash '\' followed by the forward-slash. Further note that a backslash in a doubly-quotedTcl string is itself an escape character -- in this case two backslashes are required.Alternatively, you may use curly braces '{' and '}' to denote your string in which case justone backslash is necessary.
<reg> A register name or a register group name.
..<reg> The end point for a range of registers to access.
<n> Number of registers.
all Specifies all registers.
v: If this option appears with no <var> following it, then all variables pertinent to the currentscope are printed.
<var> Symbolic name of the variable to print. Can be a C expression as well.
v This alternate syntax is provided mainly for backward compatibility.
-s|-ns Specifies whether each value is to be swapped. For memory, specifies whether eachcell is to be swapped. With a setting of -ns, target memory is written in order from lowestto highest byte address. Otherwise, each cell is endian swapped. If unspecified, thesetting "config MemSwap" is used.
%<conv> Specifies the type of the data. Possible values for <conv> are given below. The defaultconversion is set by the radix command for memory and registers and by the config varcommand for variables.
%x Hexadecimal.
%d Signed decimal.
%u Unsigned decimal.
Table continues on the next page...
Debugger ShellDebugger Shell commands
CodeWarrior Development Studio Common Features Guide, Rev. 10.x, 01/2016Freescale Semiconductor, Inc. 247
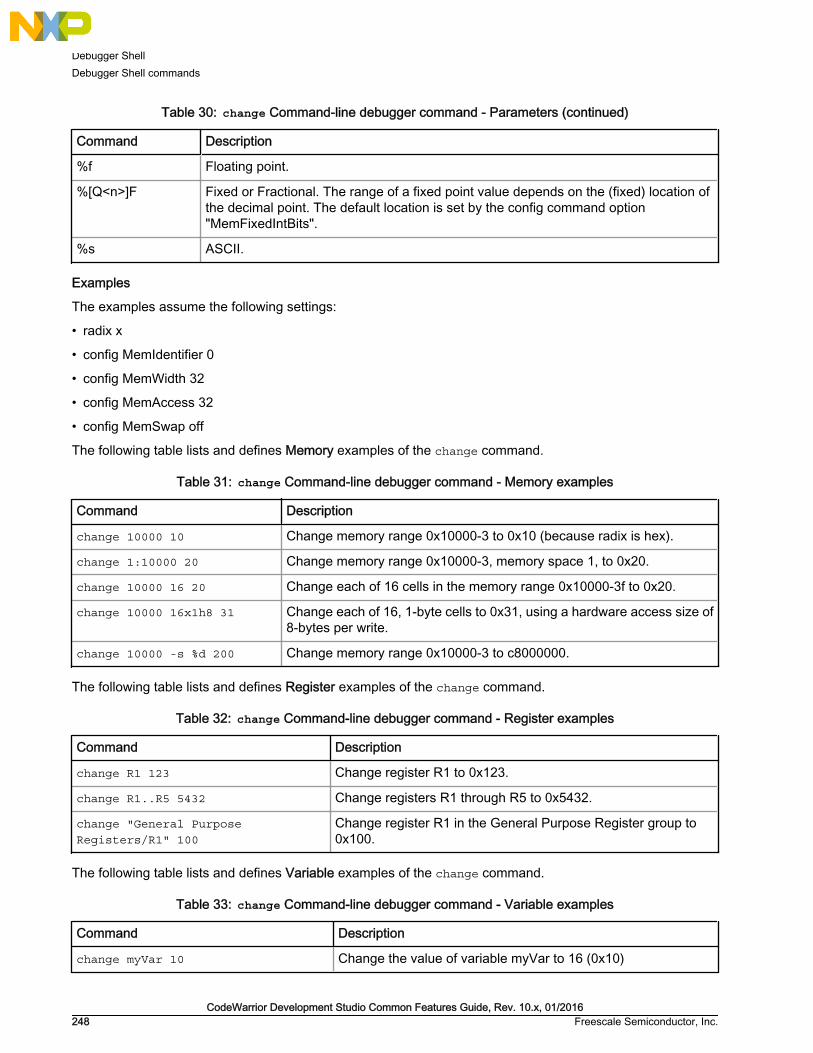
Table 30: change Command-line debugger command - Parameters (continued)
Command Description
%f Floating point.
%[Q<n>]F Fixed or Fractional. The range of a fixed point value depends on the (fixed) location ofthe decimal point. The default location is set by the config command option"MemFixedIntBits".
%s ASCII.
Examples
The examples assume the following settings:
• radix x
• config MemIdentifier 0
• config MemWidth 32
• config MemAccess 32
• config MemSwap off
The following table lists and defines Memory examples of the change command.
Table 31: change Command-line debugger command - Memory examples
Command Description
change 10000 10 Change memory range 0x10000-3 to 0x10 (because radix is hex).
change 1:10000 20 Change memory range 0x10000-3, memory space 1, to 0x20.
change 10000 16 20 Change each of 16 cells in the memory range 0x10000-3f to 0x20.
change 10000 16x1h8 31 Change each of 16, 1-byte cells to 0x31, using a hardware access size of8-bytes per write.
change 10000 -s %d 200 Change memory range 0x10000-3 to c8000000.
The following table lists and defines Register examples of the change command.
Table 32: change Command-line debugger command - Register examples
Command Description
change R1 123 Change register R1 to 0x123.
change R1..R5 5432 Change registers R1 through R5 to 0x5432.
change "General PurposeRegisters/R1" 100
Change register R1 in the General Purpose Register group to0x100.
The following table lists and defines Variable examples of the change command.
Table 33: change Command-line debugger command - Variable examples
Command Description
change myVar 10 Change the value of variable myVar to 16 (0x10)
Debugger ShellDebugger Shell commands
CodeWarrior Development Studio Common Features Guide, Rev. 10.x, 01/2016248 Freescale Semiconductor, Inc.

4.5.6 clsClears the command line debugger window.
Syntax
cls
4.5.7 cmdwin::caManages global cache operations.
That is, they affect the operation of the entire cache. For multi-core processors, these commands operate on aspecific cache if an optional ID number is provided. If the ID number is absent, the command operates on thecache that was assigned as the default by the last cmdwin::ca::default command. The following tablesummarizes cache commands.
Table 34: Global cache commands
Command Description
cmdwin::ca::default Sets specified cache as default
cmdwin::ca::enable Enables/disables cache
cmdwin::ca::flush Flushes cache
cmdwin::ca::inval Invalidates cache
cmdwin::ca::lock Locks/Unlocks cache
cmdwin::ca::show Shows the architecture of the cache
Syntax
command [<cache ID>] [on | off]
Parameters
<cache ID>
Selects the cache that the command affects.
[on | off]
Changes a cache state.
4.5.8 cmdwin::calnManages cache line operations.
They affect memory elements within a designated cache. The following table summarizes these commands.
Table 35: Cache line commands
Command Description
cmdwin::caln::get Displays cache line
Table continues on the next page...
Debugger ShellDebugger Shell commands
CodeWarrior Development Studio Common Features Guide, Rev. 10.x, 01/2016Freescale Semiconductor, Inc. 249

Table 35: Cache line commands (continued)
Command Description
cmdwin::caln::flush Flushes cache line
cmdwin::caln::inval Invalidates cache line
cmdwin::caln::lock Locks/unlocks cache line
cmdwin::caln::set Writes specified data to cache line
Syntax
command [<cache ID>] <line> [<count>]
Parameters
<cache ID>
Optional. Specifies the cache that the command affects, otherwise it affects the default cache.
<line>
Specifies the cache line to affect.
<count>
Optional. Specifies the number of cache lines the command affect.
Examples
The following table lists and defines examples of the cmdwin::caln commands.
Table 36: copy Command-line debugger command - Examples
Command Description
cmdwin::caln:get 2 Displays the second cache line.
cmdwin::caln:flush 2 Flushes line 2 of the default cache.
cmdwin::caln:set 2 = 0 1 1 2 3 5 813
Sets the contents of cache line two, where the first word has avalue of 0, the second word has a value of 1, the third word has avalue of 1, the fourth word has a value of 2, and so on.
4.5.9 configConfigures the command window.
Syntax
config <option> [<sub-option>] <value> [-np]
config
Debugger ShellDebugger Shell commands
CodeWarrior Development Studio Common Features Guide, Rev. 10.x, 01/2016250 Freescale Semiconductor, Inc.
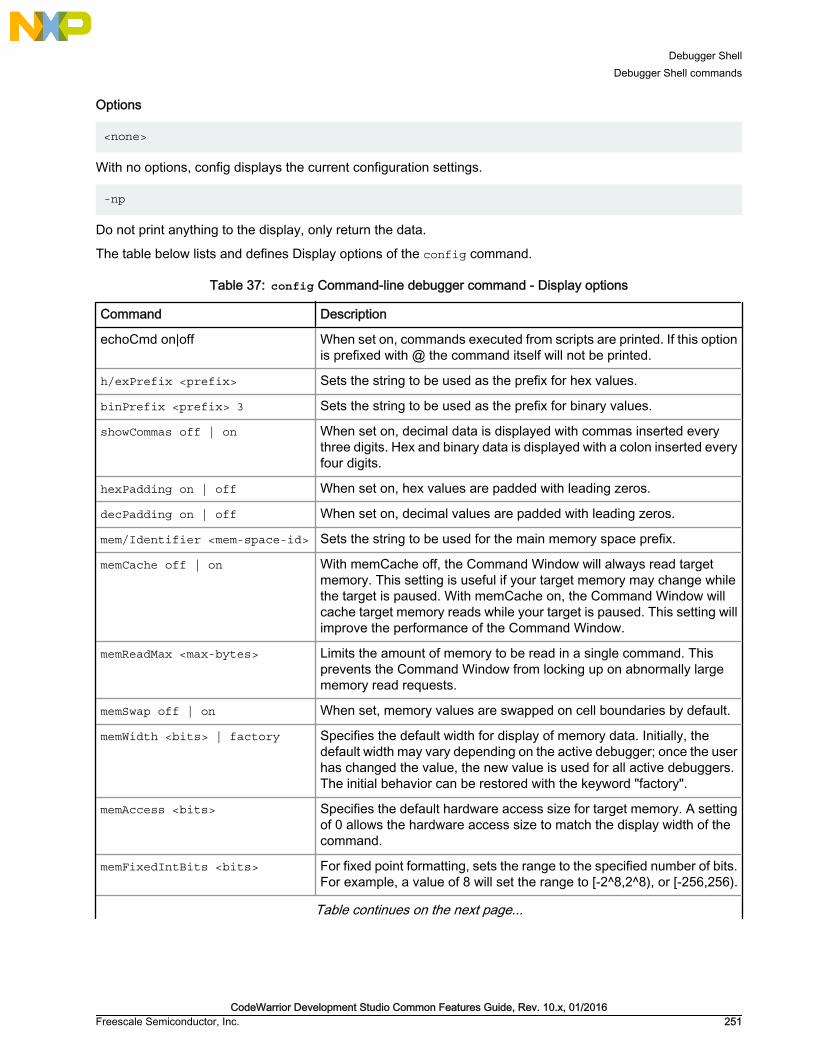
Options
<none>
With no options, config displays the current configuration settings.
-np
Do not print anything to the display, only return the data.
The table below lists and defines Display options of the config command.
Table 37: config Command-line debugger command - Display options
Command Description
echoCmd on|off When set on, commands executed from scripts are printed. If this optionis prefixed with @ the command itself will not be printed.
h/exPrefix <prefix> Sets the string to be used as the prefix for hex values.
binPrefix <prefix> 3 Sets the string to be used as the prefix for binary values.
showCommas off | on When set on, decimal data is displayed with commas inserted everythree digits. Hex and binary data is displayed with a colon inserted everyfour digits.
hexPadding on | off When set on, hex values are padded with leading zeros.
decPadding on | off When set on, decimal values are padded with leading zeros.
mem/Identifier <mem-space-id> Sets the string to be used for the main memory space prefix.
memCache off | on With memCache off, the Command Window will always read targetmemory. This setting is useful if your target memory may change whilethe target is paused. With memCache on, the Command Window willcache target memory reads while your target is paused. This setting willimprove the performance of the Command Window.
memReadMax <max-bytes> Limits the amount of memory to be read in a single command. Thisprevents the Command Window from locking up on abnormally largememory read requests.
memSwap off | on When set, memory values are swapped on cell boundaries by default.
memWidth <bits> | factory Specifies the default width for display of memory data. Initially, thedefault width may vary depending on the active debugger; once the userhas changed the value, the new value is used for all active debuggers.The initial behavior can be restored with the keyword "factory".
memAccess <bits> Specifies the default hardware access size for target memory. A settingof 0 allows the hardware access size to match the display width of thecommand.
memFixedIntBits <bits> For fixed point formatting, sets the range to the specified number of bits.For example, a value of 8 will set the range to [-2^8,2^8), or [-256,256).
Table continues on the next page...
Debugger ShellDebugger Shell commands
CodeWarrior Development Studio Common Features Guide, Rev. 10.x, 01/2016Freescale Semiconductor, Inc. 251

Table 37: config Command-line debugger command - Display options (continued)
Command Description
variable <sub-option> [on | off] Enables or disables certain fields in the output of the "evaluate"command. If neither on nor off are specified, then the field is enabled.Possible values for <sub-option> are:
• echo - the variable name
• location - the address of the variable
• size - the size of the variable is bytes
• type - the variable type
variable format <format> Controls the output format of the "evaluate" command. Possible valuesfor <format> are:
• - | Default
• d | Signed
• u | Unsigned
• x | h | Hex
• c | Char
• s | CString
• p | PascalString
• f | Float
• e | Enum
• i | Fixed Fract
• b | Binary Boolean SignedFixed
• o | w | Unicode
The following table lists and defines Run Control options of the config command.
Table 38: config Command-line debugger command - Run control options
Command Description
autoThreadSwitch off | interactive-only | on
Allows the user to control whether the Command Window willperform automatic thread-switching. Possible settings arealways on, always off, and on when running interactively, thatis not from a script. If enabled, automatic thread switching isdone in the following cases:
• If no thread is currently selected or if the current thread exits,then the first one detected will become the current.
• If the current thread is running and another thread stops, thenthe current thread will switch to the stopped thread.
debugTimeout <seconds> The maximum amount of time to wait for a debug command tofinish. You can also hit ESC to stop waiting.
Table continues on the next page...
Debugger ShellDebugger Shell commands
CodeWarrior Development Studio Common Features Guide, Rev. 10.x, 01/2016252 Freescale Semiconductor, Inc.

Table 38: config Command-line debugger command - Run control options (continued)
Command Description
runControlSync off | script-only | on Sets how to synchronize run control commands. If set to "on",then all run control commands will wait until a thread stoppedevent. If set to "off", then all run control commands will returnimmediately. If set to "script-only", then all run controlcommands will wait while running a script but will returnimmediately while running interactively.
setPCNextValidLine on | off Controls the behavior of the setpc command in the case thatthe specified file line number has no source code. If set to "on",the PC is set to the next line number containing source. If setto "off", an error is shown.
Examples
config
Display the current config status.
The following table lists and defines Display examples of the config command.
Table 39: Conf Command-Line Debugger Command - Display Examples
Command Description
config echoCmd on If "reg D1" is a command executed from a script, the output will have on topthe command itself:
cmdwin::reg D1
+ General Purpose Registers
D1=$ffffffffff
config hexPrefix 0x Show hexadecimal numbers with "0x" prefix.
config ShowCommas o n Show hexadecimal and binary numbers with a colon, as in $0000:0000, andshow decimal numbers with a comma, as in 1,000,000.00.
config HexPadding off Show hex and binary numbers with leading zeros, as in 0x0000. configMemIdentifier 0. Use "0" as the default memory space for memory commands.
config MemCache off Turn off caching of target memory. AFFECTS COMMAND WINDOW ONLY.
config MemReadMax 2048 Limit memory commands to 2048 (decimal) bytes.
config MemSwap on Swap memory on cell boundaries before accessing the target.
config MemWidth 16 Displays and writes 16bit values.
config MemWidth factory Reset the MemWidth to factory settings.
config MemAccess 8 Uses an 8-bit access size for reading and writing target memory.
config MemFixedIntBits 8 Sets the fixed point range to [-2^8,2^8), or [-256,256).
config var echo on Include the variable name in the output of the "evaluate" command.
Table continues on the next page...
Debugger ShellDebugger Shell commands
CodeWarrior Development Studio Common Features Guide, Rev. 10.x, 01/2016Freescale Semiconductor, Inc. 253

Table 39: Conf Command-Line Debugger Command - Display Examples (continued)
Command Description
config var format d Set the default display format of the "evaluate" command to decimal. Theformat may be one of the following strings or the corresponding characterabbreviation: Default('-'), Signed('d'), Unsigned('u'), Hex('h'|'x'), Char('c'),CString('s'), PascalString('p'), Float('f'), Enum('e'), Fixed('i'), Fract(no abbrev),Binary('b'), Boolean(no abbrev), SignedFixed(no abbrev), Unicode('o'|'w').
config var type off Exclude the variable type name in the output of the "evaluate" command.
config var location on Include the memory address in the output of the "evaluate" command.
config var size on Include the variable size in the output of the "evaluate" command.
The following table lists and defines Run Control examples of the config command.
Table 40: config Command-line debugger command - Run control examples
Command Description
config AutoThreadSwitchinteractive-only
If commands are being entered interactively, that is not from ascript, automatic thread switching will be performed. If no thread iscurrently selected or if the current thread exits, then the first onedetected will become the current. If the current thread is runningand another thread stops, then the current thread will switch to thestopped thread.
config DebugTimeout 10 Wait up to 10 seconds for debug command to finish.
config RunControlSync on Run control commands will wait for thread-stopped event.
config SetPCNextValidLine on If setpc is called for a file line number with no source code, the linenumber is automatically increased to the next line with sourcecode.
4.5.10 copyCopies contents of a memory address or address block to another memory location.
Syntax
copy [<ms>:]<addr>[..<addr>|#<bytes>] [<ms>:]<addr>
Parameter
<addr>
One of these memory-address specifications:
• A single address
• First address of the destination memory block.
Examples
The following table lists and defines examples of the copy command.
Debugger ShellDebugger Shell commands
CodeWarrior Development Studio Common Features Guide, Rev. 10.x, 01/2016254 Freescale Semiconductor, Inc.

Table 41: copy Command-line debugger command - Examples
Command Description
copy 00..1f 30 Copies memory addresses 00 through 1f to address 30.
copy 20#10 50 Copies 10 memory locations beginning at memory location 20 to memorybeginning at location 50.
4.5.11 debugLaunches a debug session.
Syntax
debug [[-index] <index> | [-name] <debug-config-name>]
Examples
The following table lists and defines examples of the debug command.
Table 42: debug Command-line debugger command - Examples
Command Description
debug Starts debugging using the default launch configuration, which is the lastdebugged configuration if one exists and index 0 otherwise.
debug -index 3 Starts debugging using the launch configuration at index 3. Type `launch'for the current set of launch configurations.
debug -name 3 Starts debugging using the launch configuration named `3'. Type `launch'for the current set of launch configurations.
debug 3 Starts debugging using the launch configuration named `3'. If `3' does notexist then launch configuration with index 3 will be launched. Type ̀ launch'for the current set of launch configurations.
debug {My Launch Config} Starts debugging using the launch configuration named `My LaunchConfig'. Type `launch' for the current set of launch configurations.
4.5.12 dirLists directory contents.
Syntax
dir [path|files]
Examples
The following table lists and defines examples of the dir command.
Table 43: dir Command-line debugger command-Examples
Command Description
dir Lists all files of the current directory.
Table continues on the next page...
Debugger ShellDebugger Shell commands
CodeWarrior Development Studio Common Features Guide, Rev. 10.x, 01/2016Freescale Semiconductor, Inc. 255
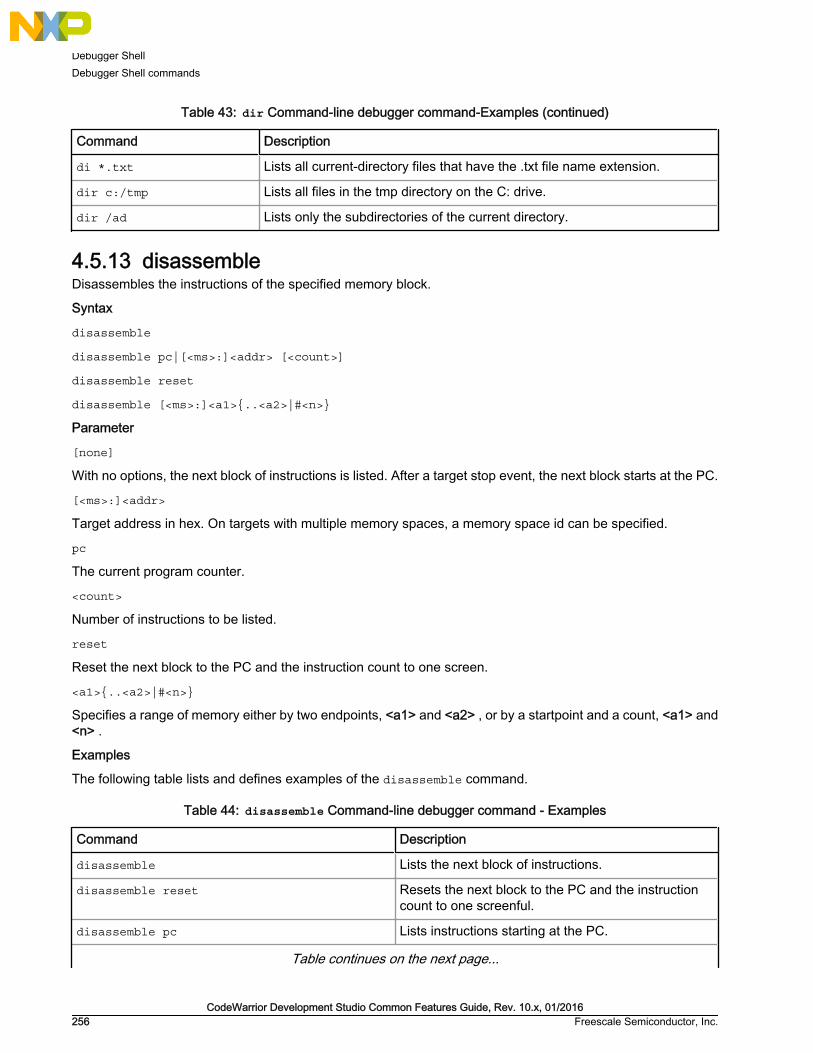
Table 43: dir Command-line debugger command-Examples (continued)
Command Description
di *.txt Lists all current-directory files that have the .txt file name extension.
dir c:/tmp Lists all files in the tmp directory on the C: drive.
dir /ad Lists only the subdirectories of the current directory.
4.5.13 disassembleDisassembles the instructions of the specified memory block.
Syntax
disassemble
disassemble pc|[<ms>:]<addr> [<count>]
disassemble reset
disassemble [<ms>:]<a1>{..<a2>|#<n>}
Parameter
[none]
With no options, the next block of instructions is listed. After a target stop event, the next block starts at the PC.
[<ms>:]<addr>
Target address in hex. On targets with multiple memory spaces, a memory space id can be specified.
pc
The current program counter.
<count>
Number of instructions to be listed.
reset
Reset the next block to the PC and the instruction count to one screen.
<a1>{..<a2>|#<n>}
Specifies a range of memory either by two endpoints, <a1> and <a2> , or by a startpoint and a count, <a1> and<n> .
Examples
The following table lists and defines examples of the disassemble command.
Table 44: disassemble Command-line debugger command - Examples
Command Description
disassemble Lists the next block of instructions.
disassemble reset Resets the next block to the PC and the instructioncount to one screenful.
disassemble pc Lists instructions starting at the PC.
Table continues on the next page...
Debugger ShellDebugger Shell commands
CodeWarrior Development Studio Common Features Guide, Rev. 10.x, 01/2016256 Freescale Semiconductor, Inc.
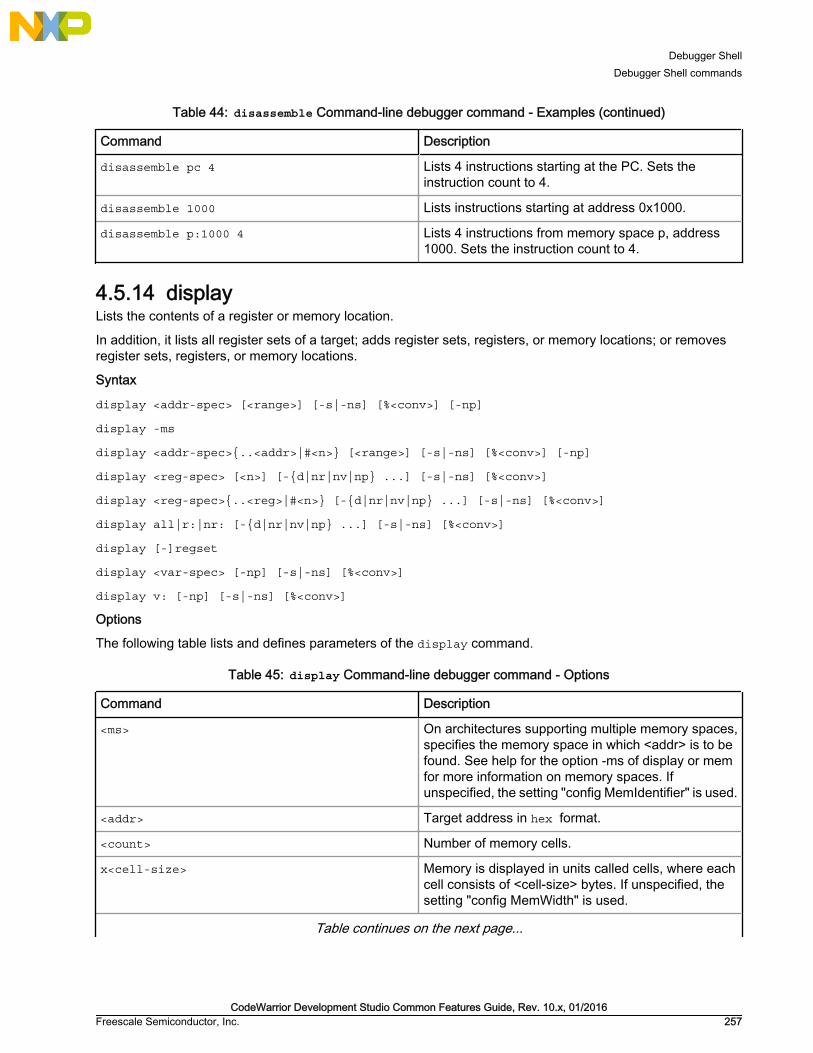
Table 44: disassemble Command-line debugger command - Examples (continued)
Command Description
disassemble pc 4 Lists 4 instructions starting at the PC. Sets theinstruction count to 4.
disassemble 1000 Lists instructions starting at address 0x1000.
disassemble p:1000 4 Lists 4 instructions from memory space p, address1000. Sets the instruction count to 4.
4.5.14 displayLists the contents of a register or memory location.
In addition, it lists all register sets of a target; adds register sets, registers, or memory locations; or removesregister sets, registers, or memory locations.
Syntax
display <addr-spec> [<range>] [-s|-ns] [%<conv>] [-np]
display -ms
display <addr-spec>{..<addr>|#<n>} [<range>] [-s|-ns] [%<conv>] [-np]
display <reg-spec> [<n>] [-{d|nr|nv|np} ...] [-s|-ns] [%<conv>]
display <reg-spec>{..<reg>|#<n>} [-{d|nr|nv|np} ...] [-s|-ns] [%<conv>]
display all|r:|nr: [-{d|nr|nv|np} ...] [-s|-ns] [%<conv>]
display [-]regset
display <var-spec> [-np] [-s|-ns] [%<conv>]
display v: [-np] [-s|-ns] [%<conv>]
Options
The following table lists and defines parameters of the display command.
Table 45: display Command-line debugger command - Options
Command Description
<ms> On architectures supporting multiple memory spaces,specifies the memory space in which <addr> is to befound. See help for the option -ms of display or memfor more information on memory spaces. Ifunspecified, the setting "config MemIdentifier" is used.
<addr> Target address in hex format.
<count> Number of memory cells.
x<cell-size> Memory is displayed in units called cells, where eachcell consists of <cell-size> bytes. If unspecified, thesetting "config MemWidth" is used.
Table continues on the next page...
Debugger ShellDebugger Shell commands
CodeWarrior Development Studio Common Features Guide, Rev. 10.x, 01/2016Freescale Semiconductor, Inc. 257

Table 45: display Command-line debugger command - Options (continued)
Command Description
h<access-size> Memory is accessed with a hardware access size of<access-size> bytes. If unspecified, the setting "configMemAccess" is used.
{8,16,32,64}bit Sets both <cell-size> and <access-size>.
-np Don't print anything to the display, only return the data.
-ms On architectures supporting multiple memory spaces,displays the list of available memory spaces includinga mnemonic and/or an integer index which may beused when specifying a target address.
<a1>{..<a2>|#<n>} Specifies a range of memory either by two endpoints,<a1> and <a2>, or by a startpoint and a byte count,<a1> and <n>. This alternate syntax is provided mainlyfor backwards compatibility. The new form of <addr>and <count> should be easier to use and thuspreferred.
{r|nr} If multiple registers are specified, then the prefix r:causes a recursive, depth-first traversal of the registerhierarchy. The prefix nr: prevents recursion. Ifunspecified, recursion is the default. Note that differentlevels of the register hierarchy are represented in themanner of a path with forward-slashes '/' used todelimit the register groups. A name that contains aslash itself can be represented with an escapebackward-slash '\' followed by the forward-slash.Further note that a backslash in a doubly-quoted Tclstring is itself an escape character -- in this case twobackslashes are required. Alternatively, you may usecurly braces '{' and '}' to denote your string in whichcase just one backslash is necessary.
<reg> A register name or a register group name.
..<reg> The end point for a range of registers to access.
<n> Number of registers.
all Specifies all registers.
-d Print detailed data book information.
-nr Print only register groups, that is no registers.
-nv Print only register groups and register names, that isno values.
-np Don't print anything to the display, only return the data.
regset Display the register group hierarchy.
Table continues on the next page...
Debugger ShellDebugger Shell commands
CodeWarrior Development Studio Common Features Guide, Rev. 10.x, 01/2016258 Freescale Semiconductor, Inc.

Table 45: display Command-line debugger command - Options (continued)
Command Description
v: If this option appears with no <var> following it, thenall variables pertinent to the current scope are printed.
<var> Symbolic name of the variable to print. Can be a Cexpression as well.
-s|-ns Specifies whether each value is to be swapped. Formemory, specifies whether each cell is to be swapped.With a setting of -ns, target memory is written in orderfrom lowest to highest byte address. Otherwise, eachcell is endian swapped. If unspecified, the setting"config MemSwap" is used.
%<conv> Specifies the type of the data. Possible values for<conv> are given below. The default conversion is setby the radix command for memory and registers andby the config var command for variables.
%x Hexadecimal.
%d Signed decimal.
%u Unsigned decimal.
%f Floating point.
%[Q<n>]F Fixed or Fractional. The range of a fixed point valuedepends on the (fixed) location of the decimal point.The default location is set by the config commandoption "MemFixedIntBits".
%s ASCII.
Examples
The examples assume the following settings:
• radix x
• config MemIdentifier 0
• config MemWidth 32
• config MemAccess 32
• config MemSwap off
The following table lists and defines examples of the display command.
Table 46: display Command-line debugger command - Examples
Command Description
display 10000 Displays memory range 0x10000-3 as one cell.
display 1:10000 Displays memory range 0x10000-3, memory space 1,as one cell.
Table continues on the next page...
Debugger ShellDebugger Shell commands
CodeWarrior Development Studio Common Features Guide, Rev. 10.x, 01/2016Freescale Semiconductor, Inc. 259

Table 46: display Command-line debugger command - Examples (continued)
Command Description
display 10000 16 Displays memory range 0x10000-3f as 16 cells.
display 10000 16x1h8 Displays 16, 1-byte cells, with a hardware access sizeof 8-bytes per read.
display 10000 8bit Displays one byte, with a hardware access size of onebyte.
display 10000 -np Returns one cell, but don't print it to the CommandWindow.
display 10000 -s Displays one cell with the data endian-swapped.
display 10000 %d Displays one cell in decimal format.
display -ms Displays the available memory spaces, if any.
display -regset Lists all the available register sets on the target chip.
display R1 Displays the value of register R1.
display "General Purpose Registers/R1" Displays the value of register R1 in the GeneralPurpose Register group.
display R1 -d Displays detailed "data book" contents of R1, includingbitfields and definitions.
display "nr:General Purpose Registers/R1"25
Beginning with register R1, display the next 25registers. Register groups are not recursivelysearched.
display myVar -s %d Displays the endian-swapped contents of variablemyVar in decimal.
4.5.15 evaluateDisplays variable or expression.
Syntax
evaluate [#<format>] [-l] [<var|expr>]
Parameter
<format>
Output format and possible values:
#-, #Default
#d, #Signed
#u, #Unsigned
#h, #x, #Hex
#c, #Char
#s, #CString
Debugger ShellDebugger Shell commands
CodeWarrior Development Studio Common Features Guide, Rev. 10.x, 01/2016260 Freescale Semiconductor, Inc.

#p, #PascalString
#f, #Float
#e, #Enum
#i, #Fixed
#o, #w, #Unicode
#b, #Binary
<none>, #Fract
<none>, #Boolean
<none>, #SignedFixed
Examples
The following table lists and defines examples of the evaluate command.
Table 47: evaluate Command-line debugger command - Examples
Command Description
evaluate Lists the types for all the variables in current and globalstack.
evaluate i Returns the value of variable 'i'
evaluate #b i Returns the value of variable 'i' formatted in binary
evaluate -l 10 Returns the address for line 10 in the current file
evaluate -l myfile.c,10 Returns the address for line 10 in file myfile.c
evaluate -l +10 Returns the address to an offset of 10 lines startingfrom the current line
evaluate -l myfile.c:mysymbol Returns the address of the symbol 'mysymbol' definedin file 'myfile.c'.
evaluate -l mysymbol Returns the address of the global symbol 'mysymbol'.
evaluate -l mysymbol +10 Returns the address of the 10'th line belonging to theglobal symbol 'mysymbol'.
evaluate -l myfile.c:mysymbol Returns the address of the local symbol 'mysymbol'defined in the file 'myfile.c'.
evaluate -l myfile.c:mysymbol 10 Returns the address of the 10'th line belonging to thelocal symbol.
4.5.16 finishExecutes until the current function returns.
Syntax
finish
Debugger ShellDebugger Shell commands
CodeWarrior Development Studio Common Features Guide, Rev. 10.x, 01/2016Freescale Semiconductor, Inc. 261

4.5.17 fl::blankcheckTests that the flash device is in the blank state.
Syntax
blankcheck all | list
Parameters
all
Check that all sectors are in the blank state.
list
Check that specific sectors are in the blank state. The sector list is set with the "device" command.
Examples
The following table lists and defines examples of the fl::blankcheck command.
Table 48: fl::blankcheck Command-line debugger command - Examples
Command Description
blankcheck all Tests if the flash device is in the blank state. All sectorswill be tested regardless of the enabled list maintainedby the "device" command.
blankcheck list Tests whether the sectors in the enabled list are in theblank state.
4.5.18 fl::checksumCalculates a checksum.
Syntax
checksum [-host | -range <addr> <size> | -dev]
Options
The following table lists and defines options of the fl::checksum command.
Table 49: fl::checksum Command-line debugger command - Options
Command Description
<none> When no options are specified, calculate thechecksum for the target memory contentscorresponding to the settings of the fl::imagecommand. The target is defined by the fl::targetcommand.
-host Calculates the checksum for the host image filecontents corresponding to the settings of the fl::imagecommand.
Table continues on the next page...
Debugger ShellDebugger Shell commands
CodeWarrior Development Studio Common Features Guide, Rev. 10.x, 01/2016262 Freescale Semiconductor, Inc.

Table 49: fl::checksum Command-line debugger command - Options (continued)
Command Description
-range <addr> <size> Calculate the checksum for the targetmemory contents specified by a beginning address<addr> and number of bytes <size>, both given in hex.The target is defined by the fl::target command.
-dev Calculates the checksum for the entire flash contents.The flash is defined by the fl::device command. Thetarget is defined by the fl::target command.
Examples
checksum
Calculates a checksum.
4.5.19 fl::deviceDefines the flash device.
Syntax
device
device <setting> ...
device ls
device ls org [<dev>]
device ls sect [[<dev>] <org>]
Options
The following table lists and defines options of the fl::device command.
Table 50: fl::device Command-line debugger command - Options
Command Description
<none> With no options, lists the current settings.
<setting> Used to set a configuration setting. Possible valuesare: -d <dev>, -o <org>, -a <addr> [<end>] ,-se all | <index> ... , -sd all |<index> ...
-d <dev> Sets the device to <dev>.
-o <org> Sets the organization to <org>.
Table continues on the next page...
Debugger ShellDebugger Shell commands
CodeWarrior Development Studio Common Features Guide, Rev. 10.x, 01/2016Freescale Semiconductor, Inc. 263
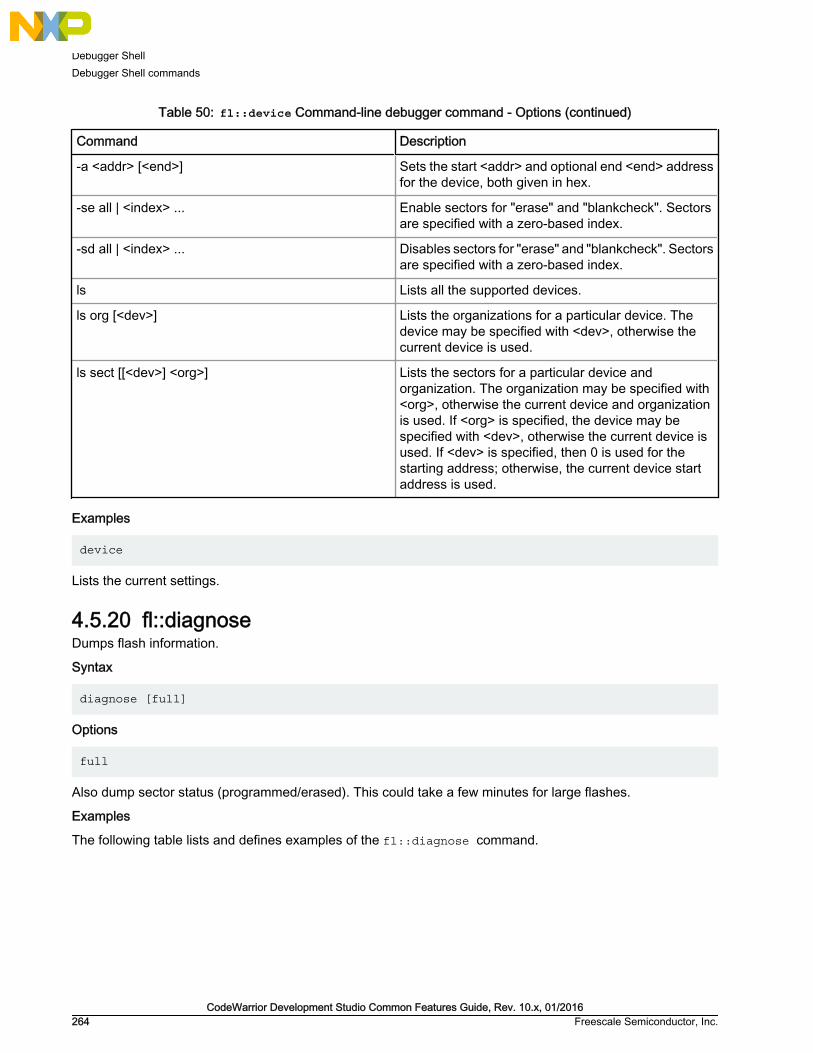
Table 50: fl::device Command-line debugger command - Options (continued)
Command Description
-a <addr> [<end>] Sets the start <addr> and optional end <end> addressfor the device, both given in hex.
-se all | <index> ... Enable sectors for "erase" and "blankcheck". Sectorsare specified with a zero-based index.
-sd all | <index> ... Disables sectors for "erase" and "blankcheck". Sectorsare specified with a zero-based index.
ls Lists all the supported devices.
ls org [<dev>] Lists the organizations for a particular device. Thedevice may be specified with <dev>, otherwise thecurrent device is used.
ls sect [[<dev>] <org>] Lists the sectors for a particular device andorganization. The organization may be specified with<org>, otherwise the current device and organizationis used. If <org> is specified, the device may bespecified with <dev>, otherwise the current device isused. If <dev> is specified, then 0 is used for thestarting address; otherwise, the current device startaddress is used.
Examples
device
Lists the current settings.
4.5.20 fl::diagnoseDumps flash information.
Syntax
diagnose [full]
Options
full
Also dump sector status (programmed/erased). This could take a few minutes for large flashes.
Examples
The following table lists and defines examples of the fl::diagnose command.
Debugger ShellDebugger Shell commands
CodeWarrior Development Studio Common Features Guide, Rev. 10.x, 01/2016264 Freescale Semiconductor, Inc.

Table 51: fl::diagnose Command-line debugger command - Examples
Command Description
diagnose Dumps flash information like ID, sector map, sectorfactory protect status. fl::device command needsto be called prior to this command in order to set thedevice.
4.5.21 fl::disconnectCloses the connection to the target.
Syntax
disconnect
Examples
disconnect
Closes the connection to the target. The first flash command that needs to access the target opens a connectionto the target that remains open for further flash operations.
4.5.22 fl::dumpDumps the content of entire flash to the specified file.
Syntax
fl::dump [all | -range start_addr end_addr] -o <file>
Parameter
-all
Dumps content of entire flash to the specified file.
-range <start_addr> <end_addr>
Sets the range of flash region to be dumped.
-t <type>
Sets the type of flash region to be dumped .
-o <file>
Dumps the flash to the specified file. This is mandatory.
Examples
dump -all -t "Binary/Raw Format" -o "myfile"
Dumps all flash or flash region from <start_addr> to <end_addr> to the file specified with -o argument.
Debugger ShellDebugger Shell commands
CodeWarrior Development Studio Common Features Guide, Rev. 10.x, 01/2016Freescale Semiconductor, Inc. 265

4.5.23 fl::eraseErases the flash device.
Syntax
erase all | list | image
Parameters
all
Erases all sectors using an all-chip erase function.
list
Erases specific sectors as set with the "device" command.
image
Erases all sectors occupied by the file specified with fl::image.
Examples
The following table lists and defines examples of the fl::erase command.
Table 52: fl::erase Command-line debugger command - Examples
Command Description
erase all Erases the device using the all-chip erase operation.This is not supported by all flash devices. All sectorswill be erased regardless of the enabled list maintainedby the "device" command. Erase the device one sectorat a time. All sectors will be erased regardless of theenabled list maintained by the "device" command.
erase list Erases the sectors in enabled list.
erase image Erases the sectors occupied by the file defined withfl::image.
4.5.24 fl::imageDefines the flash image settings.
Syntax
image
image <setting> ...
image ls
Options
The following table lists and defines options of the fl::image command.
Debugger ShellDebugger Shell commands
CodeWarrior Development Studio Common Features Guide, Rev. 10.x, 01/2016266 Freescale Semiconductor, Inc.

Table 53: fl::image Command-line debugger command - Options
Command Description
<none> With no options, lists the current settings.
<setting> Used to set a configuration setting. Possible valuesare: -f <file>, -t <type>, -re on|off, -r<addr> [<end>], -oe on|off, -o <offset>
-f <file> Sets the image file.
-t <type> Sets the type of the image file. Possible values areshown by "image ls".
-re on|off If -re is set to on, the range settings of this commandwill be used to restrict all flash commands to aparticular address range. Otherwise no restriction ismade.
-r <addr> [<end>] Sets the start <addr> and optional end <end> addressfor the restricting flash access, both given in hex. Therange must also be enabled by the option "-re".
-oe all | <index> ... If -oe is set to on, the offset setting of this commandwill be used.
-o If -oe is set to on, then the value of this setting is addedto all addresses in the image file. The value is given inhex.
Examples
image
Lists the current settings.
4.5.25 fl::protectProtects the sectors.
Syntax
fl::protect [on | off]
Parameter
[on | off]
Enables or disables protection of sectors.
4.5.26 fl::secureSecures/unsecures the device.
Syntax
fl::secure [on | off] [password <pass>]
Debugger ShellDebugger Shell commands
CodeWarrior Development Studio Common Features Guide, Rev. 10.x, 01/2016Freescale Semiconductor, Inc. 267
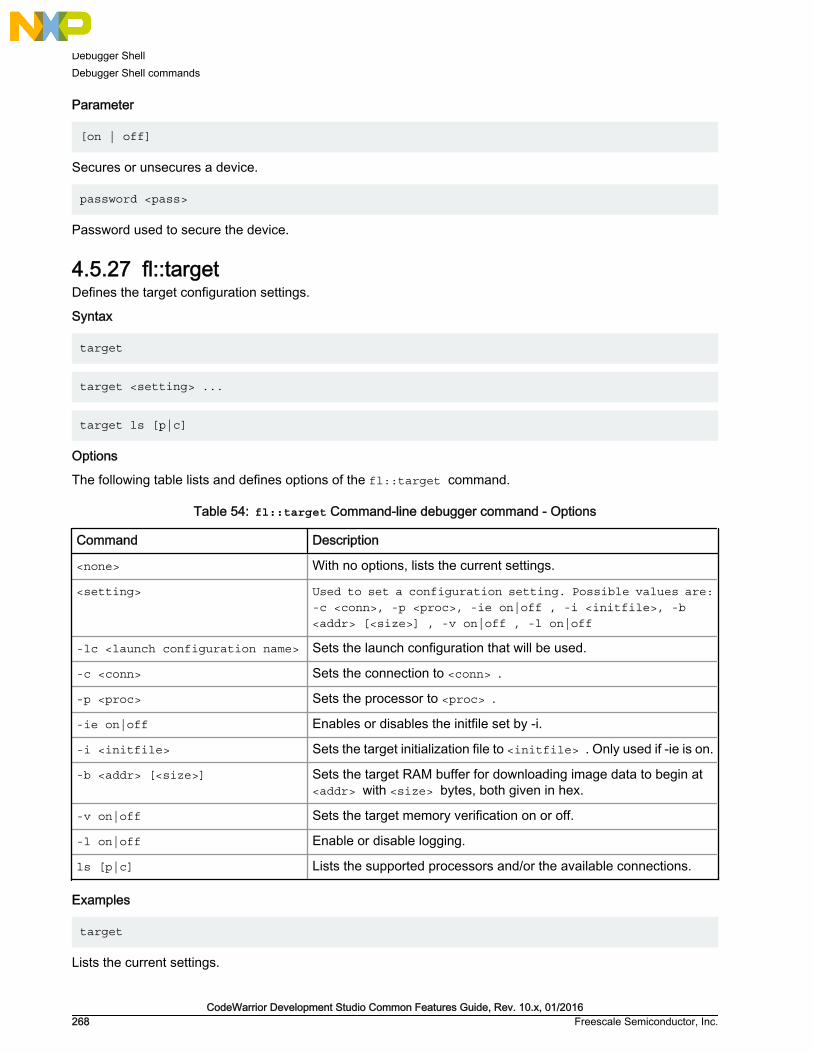
Parameter
[on | off]
Secures or unsecures a device.
password <pass>
Password used to secure the device.
4.5.27 fl::targetDefines the target configuration settings.
Syntax
target
target <setting> ...
target ls [p|c]
Options
The following table lists and defines options of the fl::target command.
Table 54: fl::target Command-line debugger command - Options
Command Description
<none> With no options, lists the current settings.
<setting> Used to set a configuration setting. Possible values are:-c <conn>, -p <proc>, -ie on|off , -i <initfile>, -b<addr> [<size>] , -v on|off , -l on|off
-lc <launch configuration name> Sets the launch configuration that will be used.
-c <conn> Sets the connection to <conn> .
-p <proc> Sets the processor to <proc> .
-ie on|off Enables or disables the initfile set by -i.
-i <initfile> Sets the target initialization file to <initfile> . Only used if -ie is on.
-b <addr> [<size>] Sets the target RAM buffer for downloading image data to begin at<addr> with <size> bytes, both given in hex.
-v on|off Sets the target memory verification on or off.
-l on|off Enable or disable logging.
ls [p|c] Lists the supported processors and/or the available connections.
Examples
target
Lists the current settings.
Debugger ShellDebugger Shell commands
CodeWarrior Development Studio Common Features Guide, Rev. 10.x, 01/2016268 Freescale Semiconductor, Inc.

4.5.28 fl::verifyVerifies the flash device.
Syntax
verify
4.5.29 fl::writeWrites the flash device.
Syntax
write
4.5.30 funcsDisplays information about functions.
Syntax
funcs [-all] <file> <line>
Parameter
[-all]
Displays information about the functions using all debug contexts.
<file>
Specifies the file name.
<line>
Specifies the line number.
4.5.31 getpidLists the ID of the process being debugged.
Syntax
getpid
4.5.32 goStarts to debug your program from the current instruction.
Syntax
go [nowait | <timeout_s>]
Parameter
<none>
Debugger ShellDebugger Shell commands
CodeWarrior Development Studio Common Features Guide, Rev. 10.x, 01/2016Freescale Semiconductor, Inc. 269

Runs the default thread. The command may wait for a thread break event before returning, depending on thesettings config runControlSync and config autoThreadSwitch.
nowait
Returns immediately without waiting for a thread break event.
<timeout_s>
Maximum number of seconds to wait for a thread break event. Can be set to nowait .
Examples
The following table lists and defines examples of the go command.
Table 55: go Command-line debugger command - Examples
Command Description
go Runs the default thread.
go nowait Runs the default thread without waiting for a threadbreak event.
go 5 Runs the default thread. If config runControlSync isenabled, then the command will wait for a thread breakevent for a maximum of 5 seconds.
4.5.33 helpLists debug command help in the command-line debugger window.
Syntax
help [-sort | -tree | <cmd>]
Parameter
command
Name or short-cut name of a command.
Examples
The following table lists and defines examples of the help command.
Table 56: help Command-Line Debugger Command - Examples
Command Description
help Lists all debug commands.
help b Lists help information for the break command.
Debugger ShellDebugger Shell commands
CodeWarrior Development Studio Common Features Guide, Rev. 10.x, 01/2016270 Freescale Semiconductor, Inc.

4.5.34 historyLists the history of the commands entered during the current debug session.
Syntax
history
4.5.35 jtagclockReads or updates the current JTAG clock speed.
Syntax
jtagclock
jtagclock <chain-position> [<speed-in-kHz>]
Examples
The following table lists and defines examples of the jtagclock command.
Table 57: jtagclock Command-line debugger command - Examples
Command Description
jtagclock 3 Reads the current jtag clock speed for chain position3.
jtagclock 3 1000 Updates the jtag clock speed to 1000kHz for chainposition 3.
4.5.36 killCloses the specified debug session.
Syntax
kill [all | <index> ...]
Examples
The following table lists and defines examples of the kill command.
Table 58: kill Command-line debugger command - Examples
Command Description
kill Kills the debug session for the current process.
kill all Kills all active debug sessions.
kill 0 1 Kills debug sessions 0 and 1.
Debugger ShellDebugger Shell commands
CodeWarrior Development Studio Common Features Guide, Rev. 10.x, 01/2016Freescale Semiconductor, Inc. 271
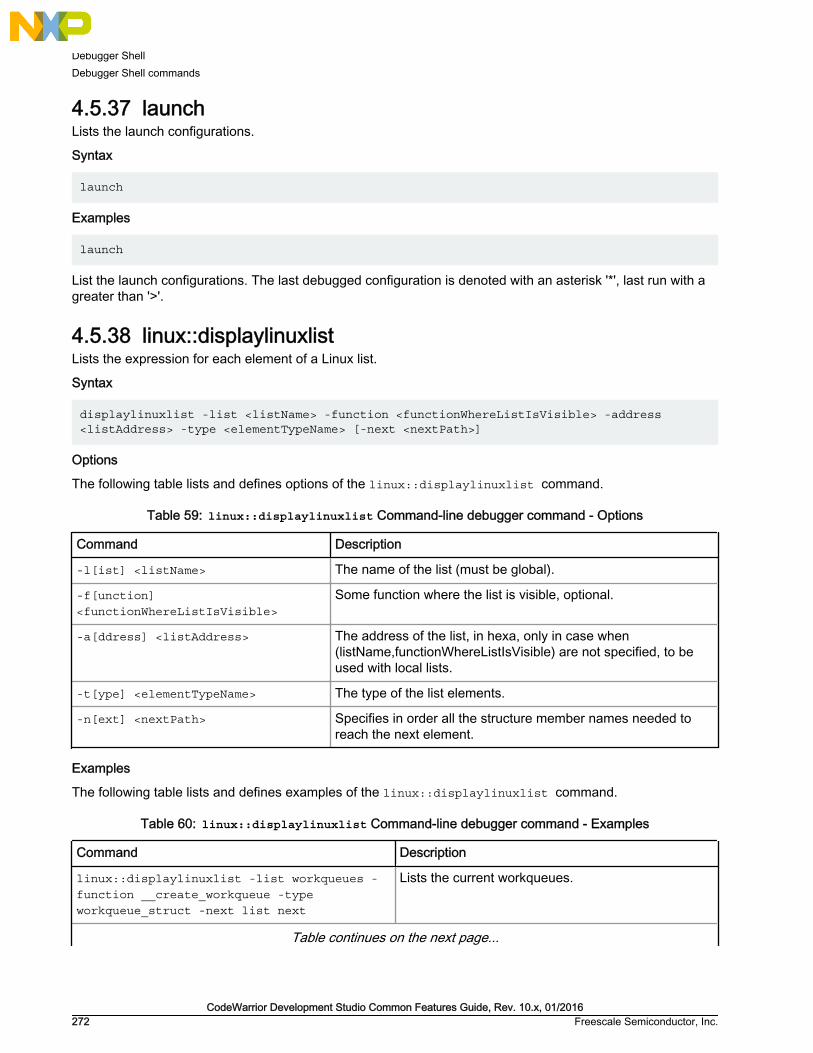
4.5.37 launchLists the launch configurations.
Syntax
launch
Examples
launch
List the launch configurations. The last debugged configuration is denoted with an asterisk '*', last run with agreater than '>'.
4.5.38 linux::displaylinuxlistLists the expression for each element of a Linux list.
Syntax
displaylinuxlist -list <listName> -function <functionWhereListIsVisible> -address <listAddress> -type <elementTypeName> [-next <nextPath>]
Options
The following table lists and defines options of the linux::displaylinuxlist command.
Table 59: linux::displaylinuxlist Command-line debugger command - Options
Command Description
-l[ist] <listName> The name of the list (must be global).
-f[unction]<functionWhereListIsVisible>
Some function where the list is visible, optional.
-a[ddress] <listAddress> The address of the list, in hexa, only in case when(listName,functionWhereListIsVisible) are not specified, to beused with local lists.
-t[ype] <elementTypeName> The type of the list elements.
-n[ext] <nextPath> Specifies in order all the structure member names needed toreach the next element.
Examples
The following table lists and defines examples of the linux::displaylinuxlist command.
Table 60: linux::displaylinuxlist Command-line debugger command - Examples
Command Description
linux::displaylinuxlist -list workqueues -function __create_workqueue -typeworkqueue_struct -next list next
Lists the current workqueues.
Table continues on the next page...
Debugger ShellDebugger Shell commands
CodeWarrior Development Studio Common Features Guide, Rev. 10.x, 01/2016272 Freescale Semiconductor, Inc.

Table 60: linux::displaylinuxlist Command-line debugger command - Examples (continued)
Command Description
linux::displaylinuxlist -address 0xC00703fc-type workqueue_struct -next list next
Lists the current workqueues, 0xC00703fc should bethe address of workqueues. Available only if the kernelis stopped.
4.5.39 linux::loadsymbolicsLoads the symbolics for the selected module.
Syntax
loadsymbolics <absolute_file_path>
4.5.40 linux::refreshmodulesLists loaded modules.
Syntax
refreshmodules
4.5.41 linux::selectmoduleSets the current module.
Syntax
selectmodules <index>
4.5.42 linux::unloadsymbolicsUnloads the symbolics for the specified module.
Syntax
unloadsymbolics
4.5.43 loadsymLoads a symbolic file.
Syntax
loadsym <filename> [PIC load addr (hex)]
Examples
The following table lists and defines examples of the loadsym command.
Table 61: loadsym Command-line debugger command - Examples
Command Description
loadsym myapp.elf Loads the debug information in myapp.elf into the debugger.
loadsym mypicapp.elf 0x40000 Loads the debug information in mypicapp.elf into the debugger;symbolics addresses are adjusted based on the alternate loadaddress of 0x40000.
Debugger ShellDebugger Shell commands
CodeWarrior Development Studio Common Features Guide, Rev. 10.x, 01/2016Freescale Semiconductor, Inc. 273

4.5.44 logLogs the commands or lists entries of a debug session.
If issued with no parameters, the command lists all open log files.
Syntax
log c|s <filename>
log off [c|s] [all]
log
Parameter
c
Command specifier.
s
Lists entry specifier.
<filename>
Name of a log file.
Examples
The following table lists and defines examples of the log command.
Table 62: log Command-line debugger command - Examples
Command Description
log Lists currently opened log files.
log s session.log Logs all display entries to file session.log.
log off c Closes current command log file.
log off Closes current command and log file.
log off all Closes all log files.
4.5.45 mc::configDisplays or edits multicore groups options.
Syntax
config [useAllCores|haltGroups|smartSelect [enable|disable]]
Examples
The following table lists and defines examples of the mc::config command.
Debugger ShellDebugger Shell commands
CodeWarrior Development Studio Common Features Guide, Rev. 10.x, 01/2016274 Freescale Semiconductor, Inc.

Table 63: mc::config Command-Line Debugger Command - Examples
Command Description
mc::config Shows the current configuration settings.
mc::config useAllCores disable Disables Use All Cores mode.
mc::config haltGroups enable Enables halt groups (where supported)
mc::config smartSelect disable Disables smart select mode so that the mc::group enable|disablecommands behave analagously to pressing Ctrl+Click on a MulticoreGroups Dialog group node. Note : This setting does not affect theMulticore Groups dialog operation.
4.5.46 mc::goResumes multiple cores.
Syntax
mc::go
Remarks
mc::go resumes the selected cores associated with the current thread context (see switchtarget on page293).
4.5.47 mc::groupDisplays or edits multicore groups.
Syntax
group
group new <type-name> [<name>]
group rename <name>|<group-index> <new-name>
group remove <name>|<group-index> ...
group removeall
group enable|disable [-context ops|swbps|hwbps|wps ...] <group-index> ...|all
Examples
The following table lists and defines examples of the mc::group command.
Debugger ShellDebugger Shell commands
CodeWarrior Development Studio Common Features Guide, Rev. 10.x, 01/2016Freescale Semiconductor, Inc. 275

Table 64: mc::group Command-line debugger command - Examples
Command Description
mc::group Shows the defined groups, including indices for use inthe mc::group rename|enable|remove set ofcommands.
mc::group new 8572 Creates a new group for target type 8572. The groupname will be based on the target name and will beunique. The enablement of the group elements will beall non-cores enabled, all cores disabled.
mc::group rename 0 "My Group Name" Renames the group at index 0 to "My Group Name".
mc::group enable 0 1.0 Enables the group at index 0 and the element at index1.0 of the mc::group command.
mc::group enable -context swbps hwbps 0 Enables the group contexts for software and hardwarebreakpoints at index 0 of the mc::group command.Note, the index must correspond to a group, not aspecific core.
mc::group remove "My Group Name" Removes the group named "My Group Name".
mc::group removeall Removes all groups.
4.5.48 mc::killTerminates multiple cores.
Syntax
mc::kill
Remarks
mc::kill terminates the debug session for the selected cores associated with the current thread context (seeswitchtarget on page 293).
4.5.49 mc::resetResets multiple cores.
Syntax
mc::reset
Remarks
mc::reset resets the debug session associated with the current thread context (see switchtarget on page293).
4.5.50 mc::restartRestarts multiple cores.
Syntax
mc::restart
Debugger ShellDebugger Shell commands
CodeWarrior Development Studio Common Features Guide, Rev. 10.x, 01/2016276 Freescale Semiconductor, Inc.

Remarks
mc::restart restarts the debug session for the selected cores associated with the current thread context (seeswitchtarget on page 293).
4.5.51 mc::stopSuspends multiple cores.
Syntax
mc::stop
Remarks
mc::stop stops the selected cores associated with the current thread context (see switchtarget on page 293).
4.5.52 mc::typeDisplays or edits target types.
SYNTAX
type
type import <filename>
type remove <filename>|<type-index> ...
ype removeall
Examples
The following table lists and defines examples of the mc::type command.
Table 65: mc::type Command-line debugger command - Examples
Command Description
mc::type Shows the target types available for multicoredebugging as well as type indices for use by themc::type remove and mc::group new commands.
mc::type import 8572_jtag.txt Creates a new type from the JTAG configuration file.
mc::type remove 8572_jtag.txt Removes the type imported from the specified file.
mc::group removeall Removes all imported types.
Debugger ShellDebugger Shell commands
CodeWarrior Development Studio Common Features Guide, Rev. 10.x, 01/2016Freescale Semiconductor, Inc. 277

4.5.53 memReads and writes memory.
Syntax
mem <addr-spec> [<range>] [-s|-ns] [%<conv>] [-np]
mem
mem <addr-spec> [<range>] [-s|-ns] [%<conv>] =<value>
mem -ms
Overview
The mem command reads or writes one or more adjacent "cells" of memory, where a cell is defined as acontiguous block of bytes. The cell size is determined by the <cell-size> parameter or by the config commandoption "MemWidth".
Options
The following table lists and defines options of the mem command.
Table 66: mem Command-line debugger command - Options
Command Description
[none] With no option, next block of memory is read.
<ms> On architectures supporting multiple memory spaces, specifies the memoryspace in which <addr> is to be found. See the help for the option -ms of displayor mem for more information on memory spaces. If unspecified, the setting"config MemIdentifier" is used.
<addr> Target address in hex.
<count> Number of memory cells.
x<cell-size> Memory is displayed in units called cells, where each cell consists of <cell-size> bytes. If unspecified, the setting "config MemWidth" is used.
h<access-size> Memory is accessed with a hardware access size of <access-size> bytes. Ifunspecified, the setting "config MemAccess" is used.
{8,16,32,64}bit Sets both <cell-size> and <access-size> .
-np Don't print anything to the display, only return the data.
-ms On architectures supporting multiple memory spaces, displays the list ofavailable memory spaces including a mnemonic and/or an integer index whichmay be used when specifying a target address.
-s|-ns Specifies whether each value is to be swapped. For memory, specifies whethereach cell is to be swapped. With a setting of -ns , target memory is written inorder from lowest to highest byte address. Otherwise, each cell is endianswapped. If unspecified, the setting "config MemSwap" is used.
Table continues on the next page...
Debugger ShellDebugger Shell commands
CodeWarrior Development Studio Common Features Guide, Rev. 10.x, 01/2016278 Freescale Semiconductor, Inc.

Table 66: mem Command-line debugger command - Options (continued)
Command Description
%<conv> Specifies the type of the data. Possible values for <conv> are given below. Thedefault conversion is set by the radix command for memory and registers andby the config var command for variables.
%x Hexadecimal.
%d Signed decimal.
%u Unsigned decimal.
%f Floating point.
%[Q<n>]F Fixed or Fractional. The range of a fixed point value depends on the (fixed)location of the decimal point. The default location is set by the config commandoption "MemFixedIntBits" .
%s ASCII.
Examples
The examples assume the following settings:
• radix x
• config MemIdentifier 0
• config MemWidth 32
• config MemAccess 32
• config MemSwap off
The following table lists and defines examples of the mem command.
Table 67: mem Command-line debugger command - Examples
Command Description
mem Displays the next block of memory.
mem 10000 Changes memory range 0x10000-3 as one cell.
mem 1:10000 Changes memory range 0x10000-3, memory space 1, as one cell.
mem 10000 16 Displays memory range 0x10000-3f as 16 cells.
mem 10000 16x1h8 Displays 16, 1-byte cells, with a hardware access size of 8-bytes perread.
mem 10000 8bit Displays one byte, with a hardware access size of one byte.
mem 10000 -np Returns one cell, but don't print it to the Command Window.
mem 10000 -s Displays one byte with the data endian-swapped.
mem 10000 %d Displays one cell in decimal format.
mem -ms Displays the available memory spaces, if any.
mem 10000 =10 Changes memory range 0x10000-3 to 0x10 (because radix is hex).
Table continues on the next page...
Debugger ShellDebugger Shell commands
CodeWarrior Development Studio Common Features Guide, Rev. 10.x, 01/2016Freescale Semiconductor, Inc. 279

Table 67: mem Command-line debugger command - Examples (continued)
Command Description
mem 1:10000 =20 Changes memory range 0x10000-3 , memory space 1, to 0x20 .
mem 10000 16x1h8 =31 Changes each of 16, 1-byte cells to 0x31 , using a hardware accesssize of 8-bytes per write.
mem 10000 -s %d =200 Changes memory range 0x10000-3 to c8000000.
4.5.54 nextRuns to next source line or assembly instruction in current frame.
Syntax
next
Remarks
If you execute the next command interactively, the command returns immediately, and target-program executionstarts. Then you can wait for execution to stop (for example, due to a breakpoint) or type the stop command.
If you execute the next command in a script, the command-line debugger polls until the debugger stops (forexample, due to a breakpoint). Then the command line debugger executes the next command in the script. Ifthis polling continues indefinitely because debugging does not stop, press the ESC key to stop the script.
4.5.55 nextiExecutes over function calls, if any, to the next assembly instruction.
Syntax
nexti
Remarks
If you execute nexti command, it will execute the thread to the next assembly instruction unless current instructionis a function call. In such a case, the thread is executed until the function returns.
4.5.56 oneframeQueries or sets the one-frame stack crawl mode for the current thread.
Syntax
oneframe [on | off]
Examples
The following table lists and defines examples of the oneframe command.
Debugger ShellDebugger Shell commands
CodeWarrior Development Studio Common Features Guide, Rev. 10.x, 01/2016280 Freescale Semiconductor, Inc.

Table 68: oneframe Command-line debugger command - Examples
Command Description
oneframe on Tells the debugger to only query and show one framein stack crawls.
oneframe off Turns off one-frame mode.
oneframe Reveals if one-frame mode is on or off.
4.5.57 pwdLists current working directory.
Syntax
pwd
4.5.58 quitIDEQuits the IDE.
Syntax
quitIDE
4.5.59 radixLists or changes the default input radix (number base) for command entries, registers and memory locations.
Entering this command without any parameter values lists the current default radix.
Syntax
radix [x|d|u|b|f|h]
Parameter
x
Hexadecimal
d
Decimal
u
Unsigned decimal
b
Binary
f
Debugger ShellDebugger Shell commands
CodeWarrior Development Studio Common Features Guide, Rev. 10.x, 01/2016Freescale Semiconductor, Inc. 281

Fractional
h
Hexadecimal
Examples
The following table lists and defines examples of the radix command.
Table 69: radix Command-line debugger command - Examples
Command Description
radix Lists the current setting.
radix d Changes the setting to decimal.
radix x Changes the setting to hexadecimal.
4.5.60 redirectRedirects I/O streams of the current target process.
Syntax
redirect <stream> <destination>
Options
The following table lists and defines options of the red command.
Table 70: red Command-line debugger command - Options
Command Description
<stream> stdout | stderr | both
<destination> stop | server <port> | socket [<host>] <port>
<port> TCP/IP port number of destination socket.
<host> IP4 address or IP6 address or hostname of target system. Assumed to be"localhost" if omitted.
stop Ends redirection for the specified stream(s).
server Attempts to establish a server socket on the specified port. Client socketsmay connect to this server socket and read the redirected data. Data writtenby the target while no client is connected is discarded.
socket Attempts to connect to the specified server socket. All target output data iswritten to this connection.
Examples
The following table lists and defines examples of the red command.
Debugger ShellDebugger Shell commands
CodeWarrior Development Studio Common Features Guide, Rev. 10.x, 01/2016282 Freescale Semiconductor, Inc.

Table 71: red Command-line debugger command - Examples
Command Description
redirect stdout server 27018 Redirects output of stdout for the current process to a serversocket on local port 27018.
redirect stderr socket logmachine.com22018
Attempts to connect to the server socket at port 22018 on host"logmachine.com" and redirects output of stderr for the currentprocess to that connection.
redirect both stop Ends redirection (if any) currently in place for both stdout andstderr for the current process.
4.5.61 refreshDiscards all cached target data and refresh views.
Syntax
refresh [all | -p <pid> <pid> ...]
Options
The following table lists and defines options of the refresh command.
Table 72: refresh Command-line debugger command - Options
Command Description
[none] No option will refresh current process only.
all Refreshes all currently debugged processes.
-p <+pid> Specifies list of process ID for the processes to berefreshed.
Examples
refresh -p 0 1
Refreshes debugger data for debugged processes with PID `0' and `1'.
4.5.62 regReads and writes registers.
Syntax
reg export <reg-spec> [<n>] <file>
reg export <file>
reg import <file>
reg <reg-spec> [<n>] [-{d|nr|nv|np} ...] [-s|-ns] [%<conv>]
reg <reg-spec>{..<reg>|#<n>} [-{d|nr|nv|np} ...] [-s|-ns] [%<conv>]
reg all|r:|nr: [-{d|nr|nv|np} ...] [-s|-ns] [%<conv>]
reg <reg-spec> [<n>] [-s|-ns] [%<conv>] =<value>
Debugger ShellDebugger Shell commands
CodeWarrior Development Studio Common Features Guide, Rev. 10.x, 01/2016Freescale Semiconductor, Inc. 283

reg <reg-spec>{..<reg>|#<n>} [-s|-ns] [%<conv>] =<value>
reg -regset
reg
Options
The following table lists and defines options of the reg command.
Table 73: reg Command-line debugger command - Options
Command Description
export Exports all or a set (specified through <reg-spec>[<n>]) of registers into a specified file. The traversal ofthe register hierarchy is recursive. Existing files areoverwritten.
import Imports registers from a specified file.
[none] No option is equivalent to reg -regset .
<reg-spec> [{r|nr}:]<reg> {r|nr} If multiple registers are specified, then the prefix r:causes a recursive, depth-first traversal of the registerhierarchy. The prefix nr: prevents recursion. Ifunspecified, recursion is the default. Note that differentlevels of the register hierarchy are represented in themanner of a path with forward-slashes '/' used todelimit the register groups. A name that contains aslash itself can be represented with an escapebackward-slash '\' followed by the forward-slash.Further note that a backslash in a doubly-quoted Tclstring is itself an escape character -- in this case twobackslashes are required. Alternatively, you may usecurly braces '{' and '}' to denote your string in whichcase just one backslash is necessary.
<reg> A register name or a register group name.
..<reg> The end point for a range of registers to access.
<n> Number of registers.
all Specifies all registers.
-d Print detailed data book information.
-nr Print only register group, that is no registers.
-nv Print only register groups and register names, that isno values.
-np Do not print anything to the display, only return thedata.
regset Display the register group hierarchy.
Table continues on the next page...
Debugger ShellDebugger Shell commands
CodeWarrior Development Studio Common Features Guide, Rev. 10.x, 01/2016284 Freescale Semiconductor, Inc.

Table 73: reg Command-line debugger command - Options (continued)
Command Description
-s| -ns Specifies whether each value is to be swapped. Formemory, specifies whether each cell is to be swapped.With a setting of -ns, target memory is written in orderfrom lowest to highest byte address. Otherwise, eachcell is endian swapped. If unspecified, the setting"config MemSwap" is used.
%<conv> Specifies the type of the data. Possible values for<conv> are given below. The default conversion is setby the radix command for memory and registers andby the config var command for variables.
%x Hexadecimal
%d Signed decimal.
%u Unsigned decimal.
%f Floating point.
%[Q<n>]F Fixed or fractional. The range of a fixed point valuedepends on the (fixed) location of the decimal point.The default location is set by the config commandoption MemFixedIntBits .
%s ASCII
Examples
The following table lists and defines examples of the reg command.
Table 74: reg Command-line debugger command - Examples
Command Description
reg -regset Lists all the available register sets on the target chip.
reg R1 Displays the value of register R1.
reg "General Purpose Registers/R1" Displays value of register R1 in the General PurposeRegister group.
reg R1 -d Displays detailed "data book" contents of R1, includingbitfields and definitions.
reg "nr:General Purpose Registers/R1" 25 Beginning with register R1, display the next 25registers. Register groups are not recursivelysearched.
reg R1 =123 Changes register R1 to 0x123 .
reg R1..R5 =5432 Changes registers R1 through R5 to 0x5432 .
reg "General Purpose Registers/R1" =100 Changes register R1 in the General Purpose Registergroup to 0x100 .
Table continues on the next page...
Debugger ShellDebugger Shell commands
CodeWarrior Development Studio Common Features Guide, Rev. 10.x, 01/2016Freescale Semiconductor, Inc. 285

Table 74: reg Command-line debugger command - Examples (continued)
Command Description
reg export filename Exports all registers from the target to the specified file.
reg export R1 filename Exports the value of register R1 to the specified file.
reg export "General Purpose Registers/R1" 25filename
Beginning with register R1, export the next 25 registersto the specified file.
reg import filename Imports registers from the specified file.
4.5.63 resetResets the target hardware.
Syntax
reset [h/ard|s/oft] [run]
Options
h/ard|s/oft
The type of reset, either hard or soft. If unspecified, the default depends on the hardware support. If soft issupported, then that is the default. Otherwise, if hard is supported, then that is the default.
run
Let's the target run after the reset, also called "reset to user". Otherwise, the target is halted at the reset vector.
Examples
The following table lists and defines examples of the reset command.
Table 75: reset Command-line debugger command - Examples
Command Description
reset Issues a soft reset if supported, otherwise a hard reset.
reset s Issues a soft reset.
reset hard Issues a hard reset.
reset run Issues a soft reset if supported, otherwise a hard reset. The target isallowed to run after the reset.
4.5.64 restartRestarts the current debug session.
Syntax
restart
Debugger ShellDebugger Shell commands
CodeWarrior Development Studio Common Features Guide, Rev. 10.x, 01/2016286 Freescale Semiconductor, Inc.

Examples
restart
This command will restart the current debug session.
4.5.65 restoreWrites file contents to memory.
Syntax
restore -h <filename> [[<ms>:]<addr>|+<offset>] [8bit|16bit|32bit|64bit]
restore -b <filename> [<ms>:]<addr> [8bit|16bit|32bit|64bit]
Options
The following table lists and defines options of the restore command.
Table 76: restore Command-line debugger command - Options
Command Description
-h|-b Specifies the input file format as hex or binary.
[<ms>:]<addr> Address to load to. For hex format, this selectionoverrides the address specified in the file. Forarchitectures with multiple memory spaces, a memoryspace id may be specified. See config MemIdentifierand mem -ms for more details.
<offset> Loads the contents of the hex file at an offset of theoriginal location.
8bit|16bit|32bit|64bit Controls the memory access size.
Examples
The following table lists and defines examples of the restore command.
Table 77: restore Command-line debugger command - Examples
Command Description
restore -h dat.txt Loads the contents of the hex file dat.txt into memory.
restore -b dat.bin 0x20 Loads the contents of binary file dat.bin into memorybeginning at 0x20.
restore -h dat.bin +0x20 Loads the contents of the binary file dat.lod intomemory with an offset of 0x20 relative to the addresssaved in dat.bin.
Debugger ShellDebugger Shell commands
CodeWarrior Development Studio Common Features Guide, Rev. 10.x, 01/2016Freescale Semiconductor, Inc. 287

4.5.66 runLaunches a process.
Syntax
run [[-index] <index> | [-name] <debug-config-name>]
Examples
The following table lists and defines examples of the run command.
Table 78: run Command-line debugger command-Examples
Command Description
run Starts a process using the default launchconfiguration, which is the last run configuration if oneexists and index 0 otherwise.
run -index 3 Starts a process using the launch configuration atindex 3. Type 'launch' for the current set of launchconfigurations.
run -name 3 Starts a process using the launch configuration named'3'. Type 'launch' for the current set of launchconfigurations.
run 3 Starts a process using the launch configuration named'3'. If '3' does not exist then configuration with index 3will be started. Type 'launch' for the current set oflaunch configurations.
run {My Launch Config} Starts debugging using the launch configurationnamed 'My Launch Config' . Type 'launch' for thecurrent set of launch configurations.
4.5.67 saveSaves the contents of memory locations to a binary file or a text file containing hexadecimal values.
Syntax
save -h|-b [<ms>:]<addr>... <filename> [-a|-o] [8bit|16bit|32bit|64bit]
Parameter
-h|-b
Sets the output file format to hex or binary. For hex format, the address is also saved so that the contents caneasily be restored with the restore command.
[<ms>:]<addr>
Address to read from. For architectures with multiple memory spaces, a memory space id may be specified.
-a
Debugger ShellDebugger Shell commands
CodeWarrior Development Studio Common Features Guide, Rev. 10.x, 01/2016288 Freescale Semiconductor, Inc.
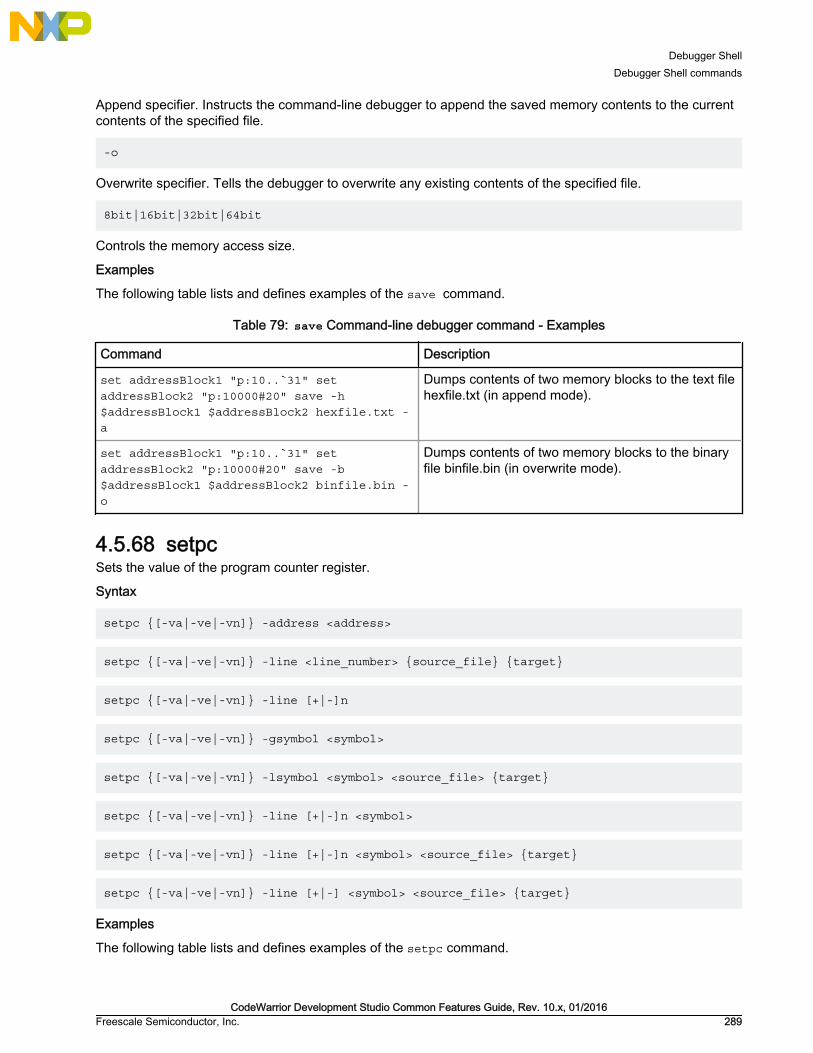
Append specifier. Instructs the command-line debugger to append the saved memory contents to the currentcontents of the specified file.
-o
Overwrite specifier. Tells the debugger to overwrite any existing contents of the specified file.
8bit|16bit|32bit|64bit
Controls the memory access size.
Examples
The following table lists and defines examples of the save command.
Table 79: save Command-line debugger command - Examples
Command Description
set addressBlock1 "p:10..`31" setaddressBlock2 "p:10000#20" save -h$addressBlock1 $addressBlock2 hexfile.txt -a
Dumps contents of two memory blocks to the text filehexfile.txt (in append mode).
set addressBlock1 "p:10..`31" setaddressBlock2 "p:10000#20" save -b$addressBlock1 $addressBlock2 binfile.bin -o
Dumps contents of two memory blocks to the binaryfile binfile.bin (in overwrite mode).
4.5.68 setpcSets the value of the program counter register.
Syntax
setpc {[-va|-ve|-vn]} -address <address>
setpc {[-va|-ve|-vn]} -line <line_number> {source_file} {target}
setpc {[-va|-ve|-vn]} -line [+|-]n
setpc {[-va|-ve|-vn]} -gsymbol <symbol>
setpc {[-va|-ve|-vn]} -lsymbol <symbol> <source_file> {target}
setpc {[-va|-ve|-vn]} -line [+|-]n <symbol>
setpc {[-va|-ve|-vn]} -line [+|-]n <symbol> <source_file> {target}
setpc {[-va|-ve|-vn]} -line [+|-] <symbol> <source_file> {target}
Examples
The following table lists and defines examples of the setpc command.
Debugger ShellDebugger Shell commands
CodeWarrior Development Studio Common Features Guide, Rev. 10.x, 01/2016Freescale Semiconductor, Inc. 289

Table 80: setpc Command-line debugger command - Examples
Command Description
setpc -address 0x1000 Sets the PC to address 0x1000.
setpc -line 10 Sets the PC to source line 10 in the current source file.
setpc -line 10 myfile.c Sets the PC to source line 10 in source file 'myfile.c'.
setpc -line +10 Sets the PC to an offset of 10 lines from the current source line.
setpc -gsymbol my_extern_function Sets the PC to the address of the 'my_extern_function' globalsymbol.
setpc -lsymbol my_static_functionmyfile.c
Sets the PC to the address of the 'my_static_function' localsymbol defined in source file 'myfile.c'.
setpc -line +10 my_extern_function Sets the PC to the address corresponding to an offset of 10source lines from the location where 'my_extern_function' globalsymbol was defined.
setpc -line +10 my_static_functionmyfile.c
Sets the PC to the address corresponding to an offset of 10source lines from the location where 'my_static_function' localsymbol was defined, in source file 'myfile.c'.
setpc -line 10 myfile.c mymodule.ko Sets the PC to source line 10 in source file 'myfile.c'. The file'myfile.c' is used by the target 'mymodule.ko'.
4.5.69 setpicloadaddrIndicates where a PIC executable is loaded.
Syntax
setpicloadaddr [symfile] <PIC load addr (hex) | reset>]
Examples
The following table lists and defines examples of the setpicloadaddr command.
Table 81: setpicloadaddr Command-line debugger command - Examples
Command Description
setpicloadaddr 0x40000 Tells the debugger the main executable is loaded at0x40000.
setpicloadaddr myapp.elf 0x40000 Tells the debugger myapp.elf is loaded at 0x40000.
setpicloadaddr myapp.elf reset Tells the debugger myapp.elf is loaded at the addressset in the ELF.
4.5.70 stackPrints the call stack.
Syntax
stack [num_frames] [-default]
Debugger ShellDebugger Shell commands
CodeWarrior Development Studio Common Features Guide, Rev. 10.x, 01/2016290 Freescale Semiconductor, Inc.
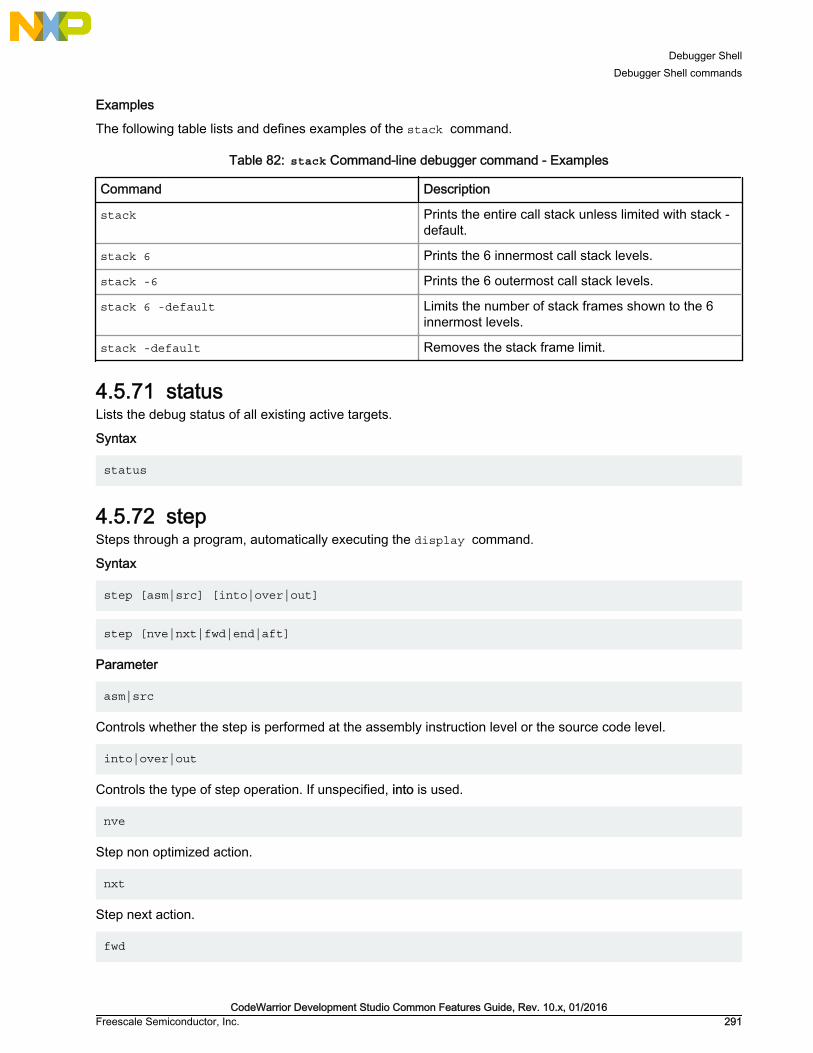
Examples
The following table lists and defines examples of the stack command.
Table 82: stack Command-line debugger command - Examples
Command Description
stack Prints the entire call stack unless limited with stack -default.
stack 6 Prints the 6 innermost call stack levels.
stack -6 Prints the 6 outermost call stack levels.
stack 6 -default Limits the number of stack frames shown to the 6innermost levels.
stack -default Removes the stack frame limit.
4.5.71 statusLists the debug status of all existing active targets.
Syntax
status
4.5.72 stepSteps through a program, automatically executing the display command.
Syntax
step [asm|src] [into|over|out]
step [nve|nxt|fwd|end|aft]
Parameter
asm|src
Controls whether the step is performed at the assembly instruction level or the source code level.
into|over|out
Controls the type of step operation. If unspecified, into is used.
nve
Step non optimized action.
nxt
Step next action.
fwd
Debugger ShellDebugger Shell commands
CodeWarrior Development Studio Common Features Guide, Rev. 10.x, 01/2016Freescale Semiconductor, Inc. 291

Step forward action.
end
Step end of statement action.
aft
Step end all previous action.
Examples
The following table lists and defines examples of the step command.
Table 83: step Command-line debugger command - Examples
Command Description
step Steps into the current source or assembly line.
step over Steps over the current source or assembly line.
step out Steps out of a function.
step asm Steps over a single assembly instruction.
4.5.73 stepiExecutes to the next assembly instruction.
Syntax
stepi
4.5.74 stopStops a running program (started by a go, step, or next command).
Syntax
stop
Examples
The following table lists and defines examples of the stop command.
Table 84: stop Command-line debugger command - Examples
Command Description
stop Using it after command go/step out/next, this will stopthe target program.
Debugger ShellDebugger Shell commands
CodeWarrior Development Studio Common Features Guide, Rev. 10.x, 01/2016292 Freescale Semiconductor, Inc.

4.5.75 switchtargetDisplays information about debugged threads, processes and connections or changes the debug context forsubsequent commands.
Syntax
switchtarget [<index> | -cur | -ResetIndex -pid | -tid | -conn | -arch]
switchtarget -tid [-pid=<procID>] [[-arch==<name>] | [-conn==<name>]]
switchtarget -pid [[-arch==<name>] | [-conn==<name>]]
switchtarget -arch [-conn==<name>]
switchtarget -conn [-arch==<name>]
switchtarget [-pid=<procID>] [-tid=<threadID>] [[-arch==<name>] | [- conn==<name>]]
Parameter
index
Session Index number.
Examples
The following table lists and defines examples of the switchtarget command.
Table 85: switchtarget Command-line debugger command - Examples
Command Description
switchtarget Lists currently available debug sessions.
switchtarget 0 Selects the thread with index 0
switchtarget -cur Lists the index of the current thread.
switchtarget -ResetIndex Resets the index counter to 0, not valid while debugging.
switchtarget -tid Lists the thread IDs of the current process of the current connection.
switchtarget -pid Lists the process IDs of the debugged processes of the currentconnection.
switchtarget -pid -arch=EPPC Lists the process IDs of the debugged processes of EPPCarchitecture on the current debug system.
switchtarget -pid -conn=Launch-1 Lists the process IDs of the debugged processes of the Launch-1connection.
switchtarget -arch -conn=Launch-1 Lists the architectures debugged on Launch-1 connection.
switchtarget -conn -arch=EPPC Lists the name of the connection of EPPC architecture on thecurrent debug system.
Table continues on the next page...
Debugger ShellDebugger Shell commands
CodeWarrior Development Studio Common Features Guide, Rev. 10.x, 01/2016Freescale Semiconductor, Inc. 293

Table 85: switchtarget Command-line debugger command - Examples (continued)
Command Description
switchtarget -pid=0 -tid=0 -arch=EPPC
Switches current context to thread 0 of process 0 of EPPCarchitecture on the current debug system.
switchtarget -pid=0 -tid=0 -conn=Launch-1
Switches current context to thread 0 of process 0 on Launch-1connection.
4.5.76 systemExecutes system command.
Syntax
system [command]
Parameter
command
Any system command that does not use a full screen display.
Examples
The following table lists and defines examples of the system command.
Table 86: system Command-line debugger command - Examples
Command Description
system del *.tmp Deletes from the current directory all files that have the .tmp filenameextension.
4.5.77 varReads and writes variables or C-expressions.
Syntax
var
var <var-spec> [-np] [-s|-ns] [%<conv>]
var v: [-np] [-s|-ns] [%<conv>]
var <var-spec> [-s|-ns] [%<conv>] =<value>
Options
The following table lists and defines options of the var command.
Debugger ShellDebugger Shell commands
CodeWarrior Development Studio Common Features Guide, Rev. 10.x, 01/2016294 Freescale Semiconductor, Inc.

Table 87: var Command-line debugger command - Options
Command Description
[none] No option is equivalent to "var v:".
v: If this option appears with no <var> following it, then all variables pertinent to thecurrent scope are printed.
<var> Symbolic name of the variable to print. Can be a C expression as well.
-np Don't print anything to the display, only return the data.
-s|-ns Specifies whether each value is to be swapped. For memory, specifies whether eachcell is to be swapped. With a setting of -ns, target memory is written in order fromlowest to highest byte address. Otherwise, each cell is endian swapped. If unspecified,the setting "config MemSwap" is used.
%<conv> Specifies the type of the data. Possible values for <conv> are given below. The defaultconversion is set by the radix command for memory and registers and by the configvar command for variables.
%x Hexadecimal.
%d Signed decimal.
%u Unsigned decimal.
%f Floating point.
%[Q<n>]F Fixed or Fractional. The range of a fixed point value depends on the (fixed) locationof the decimal point. The default location is set by the config command option"MemFixedIntBits".
%s ASCII.
Examples
The following table lists and defines examples of the var command.
Table 88: var Command-line debugger command - Examples
Command Description
var myVar -s %d Displays the endian-swapped contents of variable myVar in decimal.
var myVar =10 Changes the value of variable myVar to 16 (0x10).
4.5.78 waitTells the debugger to wait for a specified amount of time, or until you press the space bar.
Syntax
wait <time-ms>
Parameter
time-ms
Number of milliseconds to wait.
Debugger ShellDebugger Shell commands
CodeWarrior Development Studio Common Features Guide, Rev. 10.x, 01/2016Freescale Semiconductor, Inc. 295

Examples
The following table lists and defines examples of the wait command.
Table 89: wait Command-line debugger command - Examples
Command Description
wait Debugger waits until you press the space bar.
wait 2000 Wait for 2 seconds.
4.5.79 watchpointSets, removes, disables, enables or list watchpoints.
You can also set condition on watchpoint.
Syntax
watchpoint
watchpoint [-{r|w|rw}] {<var>|[<ms>:]<addr> <size>}
watchpoint all|#<id>|<var>|[<ms>:]<addr> off|enable|disable
watchpoint #<id> ignore <count>
watchpoint #<id> cond <c-expr>
watchpoint #<id> type -{r|w|rw}
watchpoint #<id> size <units>
Examples
The following table lists and defines examples of the watchpoint command.
Table 90: watchpoint Command-line debugger command - Examples
Command Description
watchpoint Displays all watchpoints.
watchpoint gData Sets read-write (the default) watchpoint on variable gData.
watchpoint -r gData Sets read-only watchpoint on variable gData.
watchpoint all off Removes all watchpoints.
watchpoint #4 disable Disables watchpoint number 4.
watchpoint 10343 4 Sets a watchpoint at memory address 10343 of length 4.
watchpoint #4 ignore 3 Sets ignore count to 3 for watchpoint number 4.
watchpoint #4 cond x == 3 Sets the condition for watchpoint number 4 to fire only if x == 3.
watchpoint #4 type -rw Sets the access type read/write for watchpoint number 4.
watchpoint #4 size 8 Sets the size to 8 units for watchpoint number 4.
Debugger ShellDebugger Shell commands
CodeWarrior Development Studio Common Features Guide, Rev. 10.x, 01/2016296 Freescale Semiconductor, Inc.

Chapter 5Debugger Script MigrationThis chapter describes the migration from the Command window of the CodeWarrior Classic IDE to the debuggershell of the CodeWarrior Eclipse IDE. The Debugger Shell of the CodeWarrior Eclipse IDE uses the sameTclScript scripting engine as the Command Window with some notable exceptions and changes, as follows:
• new command line syntax for launching the CodeWarrior Eclipse IDE
• removal of the build commands
• removal of the display commands, which are replaced by GUI preferences
• improved step command syntax
• new commands for starting a debug session
This chapter explains:
• Command-line syntax on page 297
• Launching debug session on page 297
• Stepping on page 299
• Settings of config command on page 300
5.1 Command-line syntaxYou can start the CodeWarrior Eclipse IDE and execute a Debugger Shell script using the command-linesyntax.
For example, execute a Debugger Shell script with a TclScript script as input from the command-line, as shownin the example below:
D:\SC\eclipse>cwide.exe -vmargsplus -Dcw.script=D:\my_script.tcl
Users familiar with the -vmargs option in the CodeWarrior Eclipse IDE should note thatCodeWarrior will not work properly if -vmargs is used. Use the custom -vmargsplusoption in place of the -vmargs option.
NOTE
5.2 Launching debug sessionThe CodeWarrior Eclipse IDE provides debugger commands that can be run in the Debugger Shell.
In the CodeWarrior Classic IDE, you use the project -list command to browse the list of projects to debug andthe debug command to start a debug session. However, in the CodeWarrior Eclipse IDE, you use the followingcommands in the Debugger Shell:
• launch: to list the launch configurations
• debug: to start a debug session
• run: to start a process
Debugger Script MigrationCommand-line syntax
CodeWarrior Development Studio Common Features Guide, Rev. 10.x, 01/2016Freescale Semiconductor, Inc. 297

Figure 168: launch command
Figure 169: debug and run commands
The debug command in the CodeWarrior Eclipse IDE also replaces the attach andconnect commands, which have been removed in the CodeWarrior Eclipse IDE.
NOTE
The help launch, help debug, and help run commands display the help details of the respective commands, asshown in Figure 170. help command on page 299.
Debugger Script MigrationLaunching debug session
CodeWarrior Development Studio Common Features Guide, Rev. 10.x, 01/2016298 Freescale Semiconductor, Inc.
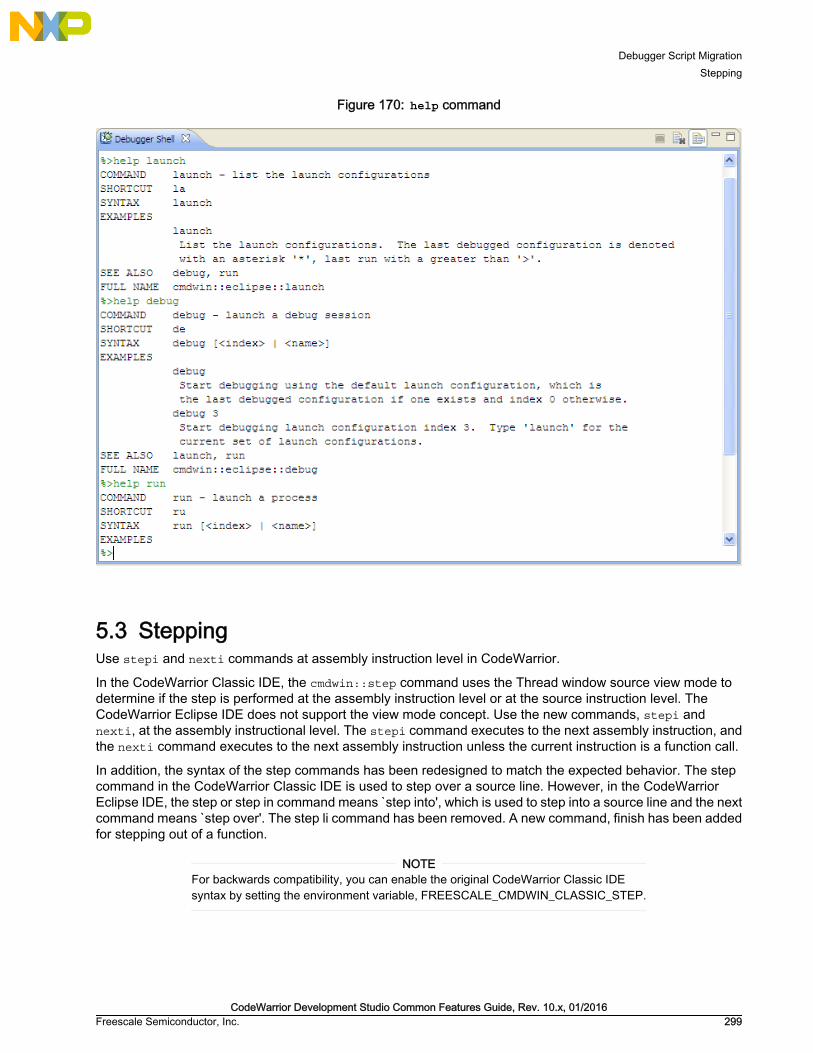
Figure 170: help command
5.3 SteppingUse stepi and nexti commands at assembly instruction level in CodeWarrior.
In the CodeWarrior Classic IDE, the cmdwin::step command uses the Thread window source view mode todetermine if the step is performed at the assembly instruction level or at the source instruction level. TheCodeWarrior Eclipse IDE does not support the view mode concept. Use the new commands, stepi andnexti, at the assembly instructional level. The stepi command executes to the next assembly instruction, andthe nexti command executes to the next assembly instruction unless the current instruction is a function call.
In addition, the syntax of the step commands has been redesigned to match the expected behavior. The stepcommand in the CodeWarrior Classic IDE is used to step over a source line. However, in the CodeWarriorEclipse IDE, the step or step in command means ̀ step into', which is used to step into a source line and the nextcommand means ̀ step over'. The step li command has been removed. A new command, finish has been addedfor stepping out of a function.
For backwards compatibility, you can enable the original CodeWarrior Classic IDEsyntax by setting the environment variable, FREESCALE_CMDWIN_CLASSIC_STEP.
NOTE
Debugger Script MigrationStepping
CodeWarrior Development Studio Common Features Guide, Rev. 10.x, 01/2016Freescale Semiconductor, Inc. 299

5.4 Settings of config commandThis section lists the config command settings that have been removed in the CodeWarrior Eclipse IDE.
The table below shows the config command settings that have been removed in the CodeWarrior Eclipse IDE.
Table 91: config command settings
Command Description
config c Sets the syntax coloring
config o Aborts a script
config page Controls the paging behavior
config s Sets the page size
config project Accesses the build projects
config target Accesses the build targets
The remaining config command settings work the same as in the CodeWarrior Classic IDE.
Debugger Script MigrationSettings of config command
CodeWarrior Development Studio Common Features Guide, Rev. 10.x, 01/2016300 Freescale Semiconductor, Inc.
IndexAabout 244About debugger 92Action Type 140Active configuration 16Add flash device 130Add Flash Programmer Actions 131Add macro 53Adding breakpoint action 107Adding global variables 229Adding memory monitor 160Adding memory renderings 162Adding path mapping to workspace 200Adding variable location to view 227Address 143Address lines 144alias 244Apply to Connection 71Apply to Project 70Attaching breakpoint actions to breakpoints 108Auto-completion 241Automatic Linking with referenced project build artifact 58Automatic path mappings 195Automatic project remote system setting cache 72Automatic removal of unreferenced remote system 71
Bbp 245Breakpoint actions 105Breakpoint Actions preferences page 106Breakpoint annotations 94Breakpoint Persistence 97Breakpoint preferences 97Breakpoints 92Breakpoints view 93build 22Build while debugging 110Bus noise 144
CCache view 111Cache view pop-up menu 114Cast to Type 230cd 246change 246Changing program counter value 125Changing register values 206Checksum actions 133Circular build dependencies 59Clearing watchpoints from Memory view 166
cls 249cmdwin::ca 249cmdwin::caln 249Code hints 241CodeWarrior debugger settings 116CodeWarrior IDE advantages 13CodeWarrior IDE overview 12CodeWarrior Projects view 16Column headers 18Command line interface 21Command-Line debugger shell 242Command-line syntax 297Commander view 27Concurrent compilation 30config 250config settings 300Configure flash programmer target task 130Console view 32, 119copy 254Core index indicators in homogeneous multicoreenvironment 118Create a flash programmer target task 128Create a Referenced project 55Creating hardware diagnostics task 139Creating hardware or simulator connection configuration 62Creating hardware or simulator target configuration 63Creating launch group 153Creating MMU configuration 168Creating multicore group 185Creating remote system 59Creating task for import/export/fill memory 146Creating TRK target configuration 67Creating watchpoint 233Customizing Commander view 29Customizing Register Details Pane 213cwide-env file 88
DData lines 145Data MATT page 177debug 255Debug perspective 120Debug view 121Debugger 91Debugger Script Migration 297Debugger Shell 239Debugger Shell commands 242Debugging in Instruction Stepping mode 125Development cycle 12Diagnostic Information export 33Diagnostics actions 134
Index
CodeWarrior Development Studio Common Features Guide, Rev. 10.x, 01/2016Freescale Semiconductor, Inc. 301

dir 255Disabling breakpoints 103Disabling watchpoint 236disassemble 256Disassembly view 125Disconnecting core 124display 257Display of Launch Configurations Needing Migration 75Documentation formats 11Documentation structure 11Dump Flash actions 134Duplicate action 135
EEditing multicore group 189Enabling breakpoints 104Enabling watchpoint 236Environment variables in launch configuration 126Erase/Blank check actions 132Erasing flash device 138evaluate 260Execute flash programmer target task 136Execute host-based Scope Loop on target 145Execute target-based Memory Tests on target 146Export Diagnostic Information 35Export moacro 53Exporting memory 164Exporting memory to file 150Exporting registers 207Exporting target or connection configuration 69Exporting target tasks 225Extracting CodeWarrior configuration details 39
FFigure conventions 12Fill Memory 152Filtering 20Find and Open File 41finish 261fl::blankcheck 262fl::checksum 262fl::device 263fl::diagnose 264fl::disconnect 265fl::dump 265fl::erase 266fl::image 266fl::protect 267fl::secure 267fl::target 268fl::verify 269fl::write 269Flash File to Target 137
Flash programmer 127Fractional variable formats 229funcs 269
GGeneral page 173General settings for Diagnostic Information 33generateMakefiles 24getOptions 23getpid 269Global preference 217go 269Grouping breakpoints 103
HHardware diagnostics 139help 270history 271
IIDE Extensions 15Import example project 45Import existing project 42Import Macro 54Import wizard 42Import/Export/Fill memory 146Importing data into memory 148Importing files 41Importing memory 165Importing registers 208Importing target or connection configuration 70Importing target tasks 226Introduction 11
Jjtagclock 271
KKernel Awareness 118Keyboard conventions 12kill 271
Llaunch 272Launch group 153Launching debug session 297Launching launch group 156Limiting New Breakpoints to Active Debug Context 102Linker Command File navigation 48linux::displaylinuxlist 272
Index
CodeWarrior Development Studio Common Features Guide, Rev. 10.x, 01/2016302 Freescale Semiconductor, Inc.

linux::loadsymbolics 273linux::refreshmodules 273linux::selectmodule 273linux::unloadsymbolics 273Load multiple binaries 157loadsym 273log 274Loop Speed 141
MManipulating variable values 228Manual conventions 12Manual path mappings 197mc::config 274mc::go 275mc::group 275mc::kill 276mc::reset 276mc::restart 276mc::stop 277mc::type 277mem 278Memory Access 141Memory Browser view 167Memory Management Unit configurator 168Memory Mapped Registers(MMR) 212Memory test use cases 145Memory Tests 142Memory view 159Message alert 89Migrating launch configurations 78Migration using Quick Fix 81Migration using Smart Migration 78Mixed source rendering 163MMU Configurator pages 172MMU configurator toolbar 171Modify Breakpoint Properties 99Modifying debugger settings 116Modifying multicore group 188Modifying target or connection configuration 68Modifying watchpoint properties 235Multicore breakpoint halt groups 192Multicore debugging 183Multicore Groups 185Multicore reset 192Multicore Restart 184Multicore Resume 184Multicore Suspend 183Multicore Terminate 184Multiple compiler support 50
NNew External File 51
next 280nexti 280
OOffline Register Details view
Loading register dump file 212On demand reset 195One Frame mode 216oneframe 280Opening Cache view 112Opening Memory view 160Opening MMU Configurator view 182Opening Registers view 206Opening the System Browser view 220Opening Variables view 227OS application 119
PPath mappings 195Pinning Commander view 30Preserving sorting 113Problems view 54Program MATT page 174Program/Verify actions 132Programming file 138Protect/Unprotect actions 135pwd 281
QQuick search 19quitIDE 281
Rradix 281redirect 282Redo delete breakpoint 105Referenced projects 55, 57references 24refresh 283Refreshing Data During Runtime 203reg 283Register Details view 209Registers view 204Regular breakpoints 94Release notes 11Remote launch 214Remote Launch view 215Remote System Changed dialog 74Remote System Missing 73Remote system project cache preferences 73Remote Systems view 68Remove action 136
Index
CodeWarrior Development Studio Common Features Guide, Rev. 10.x, 01/2016Freescale Semiconductor, Inc. 303

Remove all watchpoints 237Remove watchpoint 237Removing All Breakpoints 104Removing breakpoints 104reset 286restart 286Restarting debugger 124restore 287Restricting breakpoints to selected targets and threads 101Resuming program execution 124Reverting debugger settings 117run 288Running program 124
Ssave 288Saving generated assembly code 181Saving generated C code 180Saving generated TCL script 181Saving MMU configurator generated code 180Saving MMU Configurator settings 171Secure/Unsecure actions 135Selecting breakpoint template 109Selecting target initialization file 223setOptions 25setpc 289setpicloadaddr 290Setting line breakpoint 95Setting memory access size 164Setting method breakpoint 95Setting special breakpoint 96Setting watchpoint 232Setting watchpoint in Memory view 166Shortcut menus 32Skipping all breakpoints 105Special breakpoints 96Specify target RAM settings 130stack 290Stack crawls 216Standard output streams 201Starting debugger 123status 291step 291stepi 292Stepping 299Stepping into routine call 123Stepping Out of Routine Call 123Stepping over routine call 123stop 292Stopping debugger at program entry point 117Stopping program execution 124switchtarget 293Symbolics 219system 294
System Browser view 118, 220
TTarget connection lost 222Target initialization files 223Target management via Remote System Explorer 59Target Tasks view 225Tree and List View 17
UUndo delete breakpoint 104updateWorkspace 27Using Multicore Group Debugging Commands 191
Vvar 294Variables 226Viewing binaries 158Viewing CodeWarrior plug-ins 85Viewing register details offline 210Viewing registers 206Viewing watchpoint properties 234
Wwait 295Walking Ones 143watchpoint 296Watchpoints 231Working with breakpoints 99Working with Hardware Diagnostic Action editor 140
Index
CodeWarrior Development Studio Common Features Guide, Rev. 10.x, 01/2016304 Freescale Semiconductor, Inc.


How To Reach UsHome Page:
freescale.com
Web Support:
freescale.com/support
Information in this document is provided solely to enable systemand software implementers to use Freescale products. There areno express or implied copyright licenses granted hereunder todesign or fabricate any integrated circuits based on the informationin this document. Freescale reserves the right to make changeswithout further notice to any products herein.
Freescale makes no warranty, representation, or guaranteeregarding the suitability of its products for any particular purpose,nor does Freescale assume any liability arising out of theapplication or use of any product or circuit, and specificallydisclaims any and all liability, including without limitationconsequential or incidental damages. “Typical” parameters thatmay be provided in Freescale data sheets and/or specifications canand do vary in different applications, and actual performance mayvary over time. All operating parameters, including “typicals,” mustbe validated for each customer application by customer's technicalexperts. Freescale does not convey any license under its patentrights nor the rights of others. Freescale sells products pursuant tostandard terms and conditions of sale, which can be found at thefollowing address: freescale.com/SalesTermsandConditions.
Freescale, the Freescale logo, CodeWarrior, and StarCore aretrademarks of Freescale Semiconductor, Inc., Reg. U.S. Pat. &Tm. Off. All other product or service names are the property oftheir respective owners. The Power Architecture and Power.orgword marks and the Power and Power.org logos and relatedmarks are trademarks and service marks licensed by Power.org.© 2008–2016 Freescale Semiconductor, Inc. All rights reserved.
CWCFUGRev. 10.x
01/2016