Embed Size (px)
Citation preview
Running head: COCA-COLA FINANCIAL AND MARKET ANALYSIS 1
Coca-Cola Financial and Market Analysis
Arden Thorne, Cristina Romero, Emma Giesbrecht, Markus Jensen
Capilano University

COCA-COLA FINANCIAL AND MARKET ANALYSIS 2
Contents
Executive Summary ............................................................................................................ 3
Company Background ........................................................................................................ 4
SWOT Analysis .................................................................................................................. 6
Current Events .................................................................................................................... 7
US tariffs on Steel and Aluminum .................................................................................. 7
Coca-Cola Expanding into Energy Drinks ..................................................................... 8
Financial Ratios .................................................................................................................. 9
Liquidity Ratios .............................................................................................................. 9
Financial Leverage Ratios............................................................................................. 10
Turnover Ratios ............................................................................................................ 11
Profitability Ratios ........................................................................................................ 13
Market Ratios ................................................................................................................ 14
Stock Market Analysis ...................................................................................................... 15
Recommendations and Conclusions ................................................................................. 18
Shareholder Recommendations .................................................................................... 18
Management Recommendations ................................................................................... 18
Lender Recommendations ............................................................................................ 20
Conclusion .................................................................................................................... 21
References ......................................................................................................................... 22
Appendix A ....................................................................................................................... 25
Appendix B ....................................................................................................................... 26
Appendix C ....................................................................................................................... 27
Appendix D ....................................................................................................................... 27

COCA-COLA FINANCIAL AND MARKET ANALYSIS 3
Executive Summary
Coca-Cola is a well-established company that has been a dominant force in the non-
alcoholic ready- to-drink (NARTD) beverage industry for 132 years. This does not mean that the
company is without fault, however; the large NARTD global market poses many challenges for
Coca-Cola, many financially.
The purpose of this report is to analyze Coca-Cola economically and provide
recommendations to shareholders, the company’s management, and potential lenders. This is
done through a financial SWOT analysis, which provides insight to areas in which the company
is succeeding or that require attention; examination of the impact of current events related to
production and market value on the company’s finances; evaluation and comparison of several
financial ratios over the past five years, which will identify if areas need improvement or are
successful; and an analysis of Coca-Cola in the stock market through stock prices, dividends, and
the price per earnings ratio. The data discussed will highlight how the company is doing
internally, as well as comparing them to their main competitors in the market.
Our recommendations to the shareholders, management, and lenders of Coca-Cola
include:
• Shareholders can consider Coca-Cola as a good investment, but should be cautious of
potential future market value drops or potential over-value.
• Management should continue to increase dividend payout to shareholders to ensure
market value stays competitive in the industry and lower cost of revenue to increase
profit margins.
• Lenders should be cautious of Coca-Cola’s rapidly decreasing times interest earned ratio
when considering a loan.

COCA-COLA FINANCIAL AND MARKET ANALYSIS 4
Company Background
Coca-Cola is an internationally known household name (Maverick, 2018). Currently,
Coca-Cola controls 40% of the global non-alcoholic beverage industry, owning approximately
500 different brands (Maverick, 2018). Coca-Cola was founded in Atlanta, Georgia in 1886 by
Dr. John S Pemberton (Coca-Cola History, 2018). The original recipe was created by Dr.
Pemberton himself, and was then named by his partner Frank M. Robinson (Coca-Cola History,
2018). Originally Coca-Cola was sold exclusively in soda fountains for only 5 cents a serving,
with an average of about 9 servings sold a day for the first year (Coca-Cola History, 2018). In
contrast, Coca-Cola now sells about 1.9 billion beverage servings globally daily (Coca-Cola
History, 2018).
After 2 years, Coca-Cola became available in soda fountains beyond Atlanta and into
other states. In 1894, Coca-Cola became available to purchase in a bottle on a small scale, and
then transitioned into large scale bottling 5 years later (Coca-Cola History, 2018). The first
marketing efforts were made in 1887 using an innovative coupon and free sample promotional
tactic (Coca-Cola History, 2018). Soon after, newspaper and other promotional items began to
be distributed (Coca-Cola History, 2018). By the 1970’s, Coca-Cola’s advertising campaigns
reflected a brand connected to “fun, friends and good times” (Coca-Cola History, 2018).
In 1990, Coca-Cola opened the “World of Coca-Cola” in Atlanta, a public attraction
dedicated to the history of Coca-Cola (World of Coca-Cola, Our Story, n.d.). The attraction was
revamped by 2007 to include a greenspace, aquarium and other tourist attractions at “Pemberton
Place” in Atlanta (World of Coca-Cola, Our Story, n.d.). Since the original opening in 1990,
Coca-Cola is proud to have welcomed over 24 million guests to World of Coca-Cola (World of
Coca-Cola, Our Story, n.d.).

COCA-COLA FINANCIAL AND MARKET ANALYSIS 5
Currently, Coca-Cola has a leading beverage presence in over 200 countries around the
world, competing with biggest rival PepsiCo (Maverick, 2018). Coca-Cola and PepsiCo are
constantly competing with each other to dominate the global beverage market, currently
controlling 60%. Coca-Cola is currently winning that battle with 40% of the market controlled
by Coca-Cola and 20% by PepsiCo (Maverick, 2018). However; each company is constantly
looking for ways to improve and expand (Maverick, 2018).
Coca-Cola is currently led by Chief Executive Officer James Quincey at headquarters in
Atlanta, Georgia (Coca-Coca Leaders, 2018). Because of the large global presence Coca-Cola
has around the world, there are many presidents managing different headquarters around the
world including:
• John Murphy, president of Asia Pacific Group
• Brian J. Smith, president of Europe, Middle East and Africa Group
• Alfredo Rivera, president of Latin America Group
• James L. Dinkins, president of North America Group.
(Coca-Coca Leaders, 2018).

COCA-COLA FINANCIAL AND MARKET ANALYSIS 6
SWOT Analysis
The SWOT analysis has evaluated Coca-Cola’s internal strengths and weaknesses, as
well as external opportunities and threats. To summarize, Coca-Cola’s strongest strengths are
Strengths Weaknesses
• Increasing dividend payout to
stakeholders each year, increasing
1.29% from 2013-2017 (see Appendix
A).
• Controls 40% of the global beverage
market. (Maverick, 2018).
• Valued at 79.2 billion dollars in 2018,
based on brand equity, profit and
assets. (“Coca-Cola: Brand,” 2018).
• Long term debt has increased by 1.6%
from 2013 to 2017 (see Appendix B).
• Increasing Price/Earnings Ratio
resulting shareholders have to invest
more to receive the same amount. The
Price/Earnings Ratio increased by a
staggering 6.35% from 2016 to 2017,
as can be seen in the financial ratios.
• Lower stock price at $49.60 USD in
November 2018 than PepsiCo at
$117.91 USD in November 2018
results in lower appeal to investors.
(MarketWatch, 2018).
Opportunities Threats
• Healthy amount of Total Assets at
$87,896 million in 2018 results in
opportunity to invest in the company
in increase in areas that need
improvement such as sustainability
(see Appendix B).
• A decrease of 0.72% for Cost of
Revenue from 2013 to 2017 provides
Coca-Cola with the opportunity to
invest that money into increasing
brand equity and value in other areas
(see Appendix C).
• Decreasing amount of debt issued by
0.92% from 2016 to 2017 will provide
Coca-Cola the opportunity to finance
investments through assets rather than
liabilities and become more appealing
to investors (see Appendix A).
• A decreasing Profit Margin Ratio
implies the company has an increasing
risk for lower sales, resulting in future
net loss. The Profit Margin Ratio
decreased by 0.2% between 2013-
2018, as shown in the financial ratios.
• Decrease in Earnings Per Share
(0.19% from 2016 to 2017) ratio poses
as a threat to potential investors
interest in the company.
• A much higher Price Per Earnings
Ratio of 166.93 than the leading
competitor PepsiCo at 21.29 in 2018
will result in decreased interest by
investors for Coca-Cola, and a higher
competitive force coming from rivals.
(MacroTrends, 2018).
COCA-COLA FINANCIAL AND MARKET ANALYSIS 7
undoubtedly it’s high brand equity and large control of the global beverage industry. (Basin,
2018). Financially, the increasing dividend payout is a strength for Coca-Cola to increase
shareholder value. (Why Dividends Matter To Investors, 2018). The shareholder value increases
as dividend payout increases by communicating financial well-being through the willingness and
ability to pay dividends to shareholders. (Why Dividends Matter To Investors, 2018). As outlined
on the SWOT, Coca-Cola has a significantly lower current stock price than main rival, PepsiCo.
This poses as a weakness for company value to stakeholders and investors, who may not be
looking at other factors of the company other than face value. (Murphy, 2018). The increase in
Price/Earnings Ratio as outlined in the SWOT increases the loss of value and interest from
stakeholders and investors, poses another weakness for Coca-Cola. (Investment Valuation
Ratios: Price/Earnings Ratio, n.d.). As outlined in the SWOT, the external financial
opportunities for Coca-Cola include the chance to invest money saved on COGS, company assets
and decreasing debt issued. Perhaps the most pressing external threat for Coca-Cola is the
decreasing profit margin and earnings per share, lowering their market value and interest from
investors. (Murphy, 2018).
Current Events
US tariffs on Steel and Aluminum
Coca-Cola CEO James Quincey has said that the company has been seeing new cost
pressures based on the increase in prices of steel and aluminum from new tariffs imposed by the
Trump administration. These higher prices of steel and aluminum have forced the production
costs of cans upward, which in turn has resulted in Coca-Cola raising their prices of soft drinks
during the second quarter. Quincey had said in a statement, “We had to take with our bottling
partners an increase [in prices] in our sparkling beverage industry in the middle of the year,
COCA-COLA FINANCIAL AND MARKET ANALYSIS 8
which is relatively uncommon”. Regardless of the increase in soft drink prices from Coca-Cola,
the company had better than expected earnings in the second quarter, while still dropping slightly
compared to first quarter earnings (Lovelace, 2018). On such a large-scale manufacturing basis,
a slight change in the price of steel and aluminum could have a very serious impact in the future
of Coca-Cola’s revenues. To put things into perspective, Coca-Cola sells an average of 1.9
billion soft drinks each day (Coca-Cola, 2018). If only a tenth of these soft drinks were
packaged in cans opposed to bottles, it would be 190 million cans each day. If each can were to
cost an extra $0.10 because of steel and aluminum tariffs, it would cost Coca-Cola an extra 19
million dollars per day. Although second quarter earnings were not as low as expected, the new
tariffs imposed by the US will have a dramatic effect on Coca-Cola’s income statement.
Coca-Cola Expanding into Energy Drinks
Coca-Cola has recently shown interest in expanding their product line into the energy
drink sector. CEO James Quincey has made it apparent that Coca-Cola wants to be a “total
beverage company” and that a new line of energy drinks will help it get there (Wiener-Bronner,
2018). Laurent Grandet, a consumer analyst with Guggenheim Securities says that the energy
drink sector is one of the fastest growing segments of the beverage industry. He also claimed
that it is highly profitable because consumers are used to paying more for energy drinks
compared to a traditional soft drink. As with any global company, a new product entering the
market has a very large possibility for increased sales and revenues. Coca-Cola would
undoubtedly make a profit if they entered the energy drink market purely based on a wider
consumer base. One problem they would face is the fact that Coca-Cola made a deal with
Monster Energy in 2014, which would mean that if they were to introduce a new line of energy
drinks, they would be directly competing with one of their biggest business partners. Coca-Cola
COCA-COLA FINANCIAL AND MARKET ANALYSIS 9
even owns nearly 18.5% of Monster Energy, which could provide a barrier to entering the sector
(Wiener-Bronner, 2018). If Coca-Cola where to enter this new market, earning potential for the
company would dramatically increase. Consumers willing to pay a higher price for beverages
along with providing to a broader range of consumers would likely have a positive impact on
Coca-Cola’s income statement, and the company in general.
Financial Ratios
Below is a glance at the liquidity, financial leverage, turnover, profitability, and market
ratios for Coca-Cola compared to PepsiCo from 2013 to 2017.
Liquidity Ratios
Liquidity ratios are devised to estimate how well a company can pay off its liabilities
with its assets. The key difference between the current and quick ratios is that the former
includes inventory, which can be difficult to convert to cash to pay things off in the short term,
while the latter subtracts it out.
Current Ratio. From 2013 to 2017, Coca-Cola saw an increase in current ratio from 1.13
to 1.34 compared to PepsiCo’s increase from 1.24 to 1.51 in the same amount of time. With a
ratio above 1, both companies are able to pay back their liabilities with their assets; however,
Coca-Cola’s lower ratios puts it at a higher risk of distress or defaulting. Despite its lower
number, at 1.34 Coca-Cola is unlikely to have any issues with payments and is stable.
Year Coca Cola PepsiCo Coca Cola PepsiCo
2013 1.13 1.24 1.01 0.93
2014 1.02 1.14 0.92 0.85
2015 1.24 1.31 1.13 1.05
2016 1.28 1.28 1.18 1.08
2017 1.34 1.51 1.25 1.29
Current Ratio Quick Ratio
COCA-COLA FINANCIAL AND MARKET ANALYSIS 10
Quick Ratio. Coca-Cola’s quick ratio increased from 1.01 to 1.25 in the five years, while
PepsiCo’s increased from 0.93 to 1.29. Both companies are currently capable of paying all
current liabilities within the next few months if necessary and are well above the industry
average of 0.71 at the end of 2017 (“Nonalcoholic Beverage Industry,” n.d.).
Coca-Cola has been decreasing its inventory at year end consistently every year since
2013, dropping from $3,277 million to $2,655 million; it has remained as 3% of total assets,
indicating a decreasing value of assets (see Appendix B). The greatest increase in current assets
has been the other current assets, increasing by 170% from $2,797 million to $7,548 million
between 2016 and 2017 according to the horizontal analysis in Appendix B. This is not the ideal
account to be raising the total current assets, as their origin is unclear and they may not be from
everyday operations. A decrease in this account could affect Coca-Cola’s ability to pay short-
term liabilities in the coming years; however, the increase in the liquidity ratios has been steady
since 2014, so there is minimal worry at this point.
Financial Leverage Ratios
Total Debt Ratio. The total debt ratio for Coca-Cola increased from 0.63 to 0.81 with
PepsiCo’s similarly increasing from 0.69 to 0.86 over the five years. This means that as of 2017
81% of Coca-Cola’s, and 86% of PepsiCo’s, assets are funded through debt or liabilities.
Coca-Cola’s total debt ratio increased at a relatively constant rate, with a slightly larger
jump from 2016 to 2017. This is likely due to the sudden decrease in retained earnings and
Year Coca Cola PepsiCo Coca Cola PepsiCo
2013 0.63 0.69 22.09 9.76
2014 0.67 0.75 20.10 9.63
2015 0.72 0.83 10.20 7.98
2016 0.74 0.85 11.77 6.37
2017 0.81 0.86 11.21 8.34
Total Debt Ratio Times Interest Earned

COCA-COLA FINANCIAL AND MARKET ANALYSIS 11
increase in other liabilities in 2017. These numbers are not amazing, but with both companies in
a similar range it is not a major concern. The industry’s ratio may simply be higher than others,
and having a higher total debt ratio may hint toward expected future expansion and opportunities
as well.
Times Interest Earned. Times interest earned for Coca-Cola decreased from 22.09 to
11.21 and PepsiCo’s decreased 9.76 to 8.34. As this ratio shows how many times the company
can pay its interest before taxes, these numbers decreasing so dramatically is not good. There
was a sharp decrease from 2014 to 2015 due to interest increasing by 77% (see Appendix C).
Since then, interest has not changed dramatically and the ratio began rising again. The same year,
PepsiCo saw a sharp decline, although not as significantly, in their times interest earned ratio,
before recovering in the following years. Both companies suffered a drop at the same time, likely
due to similar circumstances, but PepsiCo has recovered much faster than Coca-Cola.
Turnover Ratios
Inventory Turnover. Inventory Turnover is an important ratio for any company; the
longer its stock sits on the shelves, the more the stock costs (“4 ways to assess your business,”
n.d.). In 2017, Coca-Cola’s inventory turnover held at 4.99, a decrease from their 5.62 in 2013.
PepsiCo fared better with an increase over five years from 8.94 to 10.15. This means that Coca-
Cola may have excess inventory which could be caused by weaker sales than PepsiCo
Year Coca Cola PepsiCo Coca Cola PepsiCo Coca Cola PepsiCo Coca Cola PepsiCo
2013 5.62 8.94 9.62 10.72 N/A N/A 3.13 3.52
2014 5.77 9.43 10.30 11.12 8.81 6.12 3.14 3.72
2015 6.02 9.68 11.24 11.15 7.08 5.44 3.52 3.76
2016 6.16 10.37 10.86 11.21 5.93 4.99 3.94 3.82
2017 4.99 10.15 9.66 10.89 5.33 4.50 4.32 3.76
Inventory Turnover Receivable Turnover Payable Turnover Fixed Asset Turnover
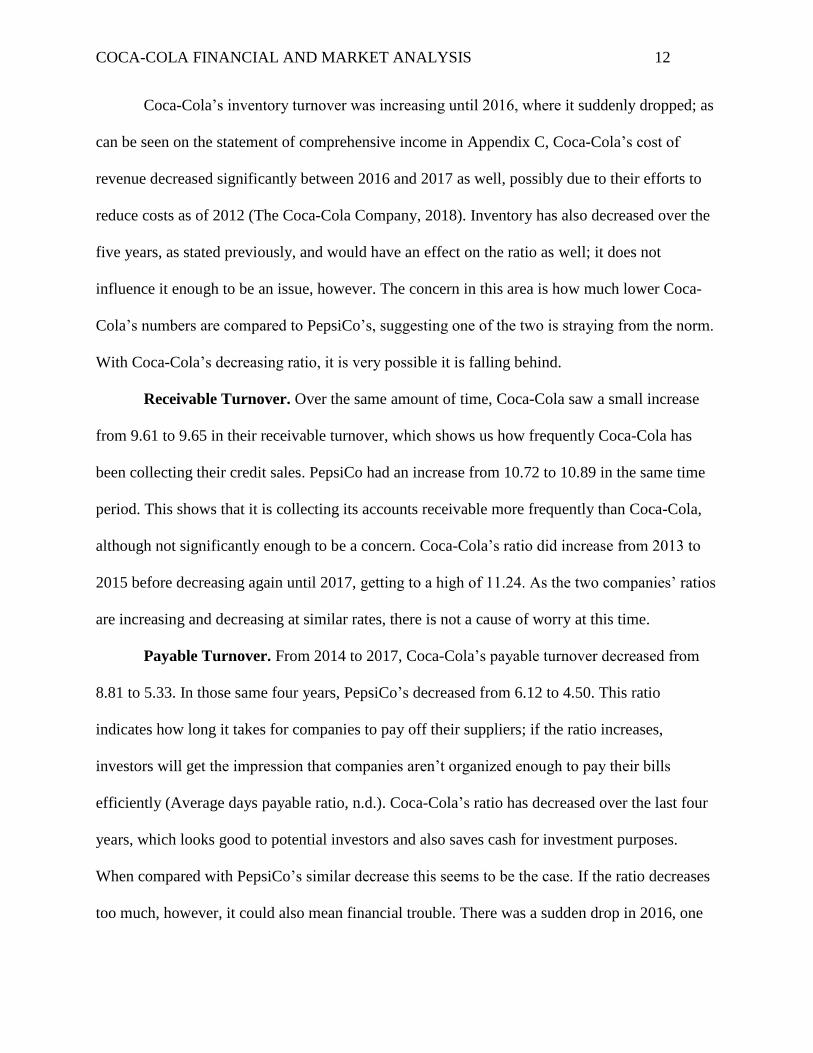
COCA-COLA FINANCIAL AND MARKET ANALYSIS 12
Coca-Cola’s inventory turnover was increasing until 2016, where it suddenly dropped; as
can be seen on the statement of comprehensive income in Appendix C, Coca-Cola’s cost of
revenue decreased significantly between 2016 and 2017 as well, possibly due to their efforts to
reduce costs as of 2012 (The Coca-Cola Company, 2018). Inventory has also decreased over the
five years, as stated previously, and would have an effect on the ratio as well; it does not
influence it enough to be an issue, however. The concern in this area is how much lower Coca-
Cola’s numbers are compared to PepsiCo’s, suggesting one of the two is straying from the norm.
With Coca-Cola’s decreasing ratio, it is very possible it is falling behind.
Receivable Turnover. Over the same amount of time, Coca-Cola saw a small increase
from 9.61 to 9.65 in their receivable turnover, which shows us how frequently Coca-Cola has
been collecting their credit sales. PepsiCo had an increase from 10.72 to 10.89 in the same time
period. This shows that it is collecting its accounts receivable more frequently than Coca-Cola,
although not significantly enough to be a concern. Coca-Cola’s ratio did increase from 2013 to
2015 before decreasing again until 2017, getting to a high of 11.24. As the two companies’ ratios
are increasing and decreasing at similar rates, there is not a cause of worry at this time.
Payable Turnover. From 2014 to 2017, Coca-Cola’s payable turnover decreased from
8.81 to 5.33. In those same four years, PepsiCo’s decreased from 6.12 to 4.50. This ratio
indicates how long it takes for companies to pay off their suppliers; if the ratio increases,
investors will get the impression that companies aren’t organized enough to pay their bills
efficiently (Average days payable ratio, n.d.). Coca-Cola’s ratio has decreased over the last four
years, which looks good to potential investors and also saves cash for investment purposes.
When compared with PepsiCo’s similar decrease this seems to be the case. If the ratio decreases
too much, however, it could also mean financial trouble. There was a sudden drop in 2016, one
COCA-COLA FINANCIAL AND MARKET ANALYSIS 13
year after the significant decrease in total debt ratio. This could be a sign that the company is not
doing as well handling its payments.
Fixed Asset Turnover. Both companies are doing well in using their fixed assets, with
Coca-Cola’s turnover increasing from 3.13 to 4.32 and PepsiCo with a relatively smaller increase
from 3.52 to 3.76. The fixed asset turnover shows us if a company is using their assets to their
advantage to increase sales, and Coca-Cola’s rising steadily over the five years signals well-
managed fixed assets.
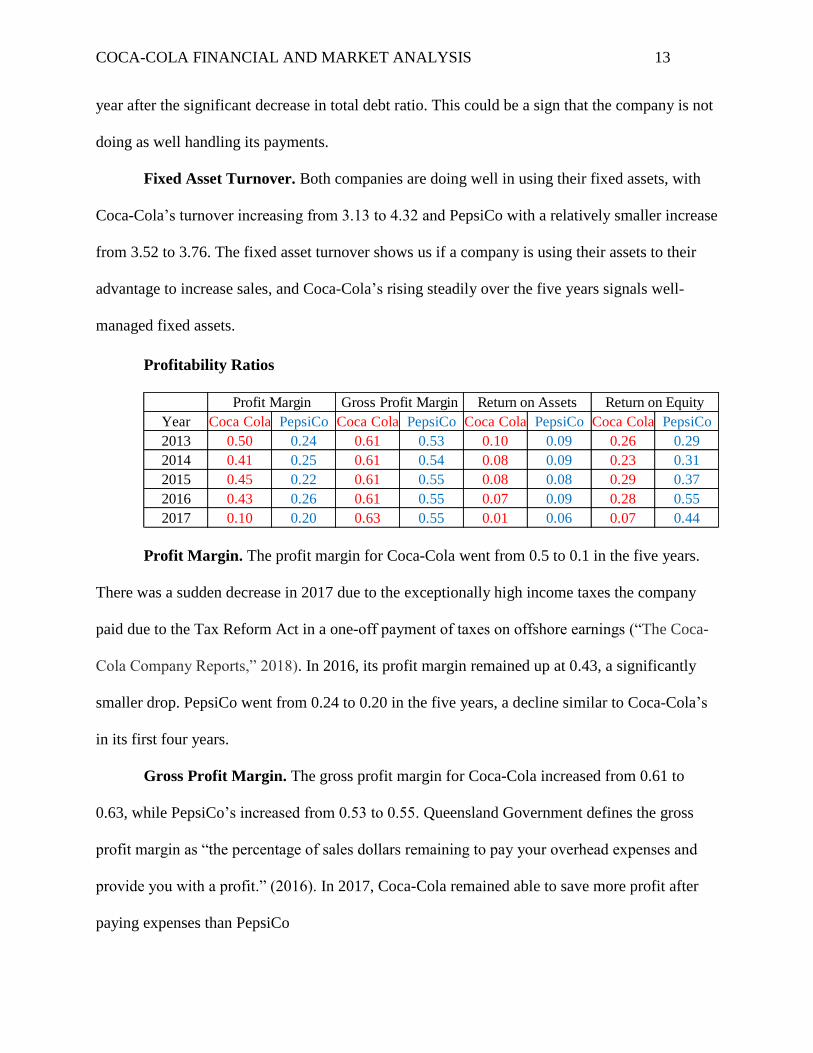
Profitability Ratios
Profit Margin. The profit margin for Coca-Cola went from 0.5 to 0.1 in the five years.
There was a sudden decrease in 2017 due to the exceptionally high income taxes the company
paid due to the Tax Reform Act in a one-off payment of taxes on offshore earnings (“The Coca-
Cola Company Reports,” 2018). In 2016, its profit margin remained up at 0.43, a significantly
smaller drop. PepsiCo went from 0.24 to 0.20 in the five years, a decline similar to Coca-Cola’s
in its first four years.
Gross Profit Margin. The gross profit margin for Coca-Cola increased from 0.61 to
0.63, while PepsiCo’s increased from 0.53 to 0.55. Queensland Government defines the gross
profit margin as “the percentage of sales dollars remaining to pay your overhead expenses and
provide you with a profit.” (2016). In 2017, Coca-Cola remained able to save more profit after
paying expenses than PepsiCo
Year Coca Cola PepsiCo Coca Cola PepsiCo Coca Cola PepsiCo Coca Cola PepsiCo
2013 0.50 0.24 0.61 0.53 0.10 0.09 0.26 0.29
2014 0.41 0.25 0.61 0.54 0.08 0.09 0.23 0.31
2015 0.45 0.22 0.61 0.55 0.08 0.08 0.29 0.37
2016 0.43 0.26 0.61 0.55 0.07 0.09 0.28 0.55
2017 0.10 0.20 0.63 0.55 0.01 0.06 0.07 0.44
Profit Margin Gross Profit Margin Return on Assets Return on Equity

COCA-COLA FINANCIAL AND MARKET ANALYSIS 14
Return on Asset Ratio. Over the five years, Coca-Cola suffered a major drop in its
return on asset ratio from 0.095 to 0.014, again with a large drop in 2017 that was likely due to
the low net income. Since return on assets is a comparison between how much is spent on assets
in a business and how much is made back, Coca-Cola’s ratio shows that the company has not
been utilizing its assets as effectively as it was in 2013; this means it is not making money back
from the money it has invested. PepsiCo had a less detrimental decrease from 0.09 to 0.06; with
PepsiCo’s gradual decrease and Coca-Cola’s ratio being incredibly low overall, this may be an
important ratio to watch.
Return on Equity. Coca-Cola’s return on equity decreased from 0.26 to 0.073, while
PepsiCo had an increase from 0.29 to 0.44. This is an indicator that for every dollar received
from shareholders, PepsiCo has been making more profit than Coca-Cola; therefore, PepsiCo has
been working more productively than Coca-Cola, making more money with each dollar they
invested in the company. Coca-Cola’s return on equity also suffered a large drop in 2017,
another area suffering from the low net income.
Market Ratios
Basic Earnings Per Share. Earnings per share (EPS) is a way for investors to look at a
company’s profitability and analyze stock prices, done by looking at past, current, and projected
earnings (Islam, Khan, Choudhury, Adnan, 2014). In 2013, Coca-Cola’s basic earnings per share
Year Coca Cola PepsiCo Coca Cola PepsiCo
2013 1.94 4.37 18.81 16.86
2014 1.62 4.31 23.66 20.00
2015 1.69 3.71 23.68 25.30
2016 1.51 4.39 26.27 22.96
2017 0.29 3.40 166.93 35.00
Basic Earnings Per Share Price Per Earnings

COCA-COLA FINANCIAL AND MARKET ANALYSIS 15
sat at 1.94 and suffered a decrease to 0.29 by 2017. PepsiCo’s basic EPS decreased from 4.37 to
3.4, showing potential investors that it’s a more profitable company.
Price Per Earnings. In that same amount of time, Coca-Cola’s price per earnings
jumped from 18.81 to 166.93 while PepsiCo’s climbed from 16.86 to 35.00. When price per
earnings are relatively low, this shows that the stock could be undervalued and a risky
investment (Peavler, 2018). Alternatively, a high price per earnings could point toward either
expected company growth or an overpriced stock. An increase in this is not an immediate turn-
away; however, Coca-Cola’s increase from 26.27 in 2016 to 166.93 in 2017 is a very
dramatically leap that may not be beneficial for investors.
Stock Market Analysis
Over the past five years there has been constant growth throughout the beverage industry
and Coca-Cola has followed the trend, albeit less than other relevant companies. Its stocks have
not increased dramatically in that time, only up 29.62%. National Beverage Corporation has been
the leader at 465.45%, with PepsiCo and Cott Corporation both in the middle leaning toward the
lower end. National Beverage Corporation appears to be an exception in the industry, but Coca-
Cola is still significantly lower than its competitors, with the next lowest-growing company
being PepsiCo with a growth rate 19.89% higher. In the last year Coca-Cola’s growth leads at
8.47% however, with National Beverage Corporation falling to the bottom at a decrease of
13.51%. PepsiCo is consistently closest to Coca-Cola, with a five-year growth of 42.51%
compared to Coca-Cola’s 22.86%, and a growth of 1.48% to Coca-Cola’s 8.47% in the last year.
Coca-Cola’s shares are trading for $49.37 at close on November 28, 2018, significantly
below PepsiCo at $118.50 and National Beverage Corp. at $91.15, but well above Cott
Corporation at $19.58. The company appears to keep their stock lower intentionally, having

COCA-COLA FINANCIAL AND MARKET ANALYSIS 16
implemented a 2-for-1 split in 2012 when their stocks were priced at approximately $74.12.
Keeping prices lower can attract investors, as stocks are often purchased in round lots of 100 and
spending $5,000 on stocks seems more reasonable than spending $11,000 (Pinsent, 2018).
Coca-Cola and PepsiCo are both mega-cap companies, with market capitalizations of
$211.591 billion and $167.271 billion respectively (“Market Capitalization,” 2018). Mega-cap
companies are known to be reliable investments with consistent dividends, but will have slower
growth than lower investments (“Market Capitalization,” 2018). This is accurate for both
companies, as they have the highest market capitalizations of the four and the lowest growth
rates. Both Cott Corporation and National Beverage Corporation have a market capitalization
between $2 billion and $5 billion, making them mid-cap companies (“Market Capitalization,”
2018). Mid-cap companies are known to have potential for more growth than large- or mega-
caps, but they are higher risk investments (“Market Capitalization,” 2018).
Price per earnings (P/E) ratios vary significantly throughout the industry, with Coca-Cola
at the top as of November 28, 2018 at 75.55 (a decrease from December 31, 2017 at 166.93) and
PepsiCo following at 34.19. A higher P/E ratio typically means growth is expected in the
company, but it can also hint at a stock being overvalued. With the lack of growth through the
years for Coca-Cola, it is very possible that the latter is true and the stock will decrease in the
future. With National Beverage Corporation at 26.60 and Cott Corporation at the bottom with
6.86, Coca-Cola does appear to be significantly over the industry average, pointing at this
situation. Alternatively, Coca-Cola’s stocks are currently leading in growth in the past year, and
it may continue to steadily rise.
Coca-Cola has been declaring dividends for many years and is doing well in dividend
yield with a steady growth in dividend rates. Its trailing annual dividend rate is 1.54 with a

COCA-COLA FINANCIAL AND MARKET ANALYSIS 17
forward annual dividend rate of 1.56. Over the past five years dividends have increased from
$0.305 per share to $0.39 per share quarterly, or $1.22 per share to $1.56 per share yearly. This is
a strength to the company and will increase shareholder value, as shown in the SWOT analysis.
PepsiCo also has a high dividend rate, with a trailing annual dividend rate of 3.46 and a forward
annual dividend rate of 3.71. Its dividends are quite a bit higher, increasing from $0.5675 per
share to $0.9275 per share quarterly, or $2.27 per share to $3.71 per share yearly. Coca-Cola’s
trailing annual dividend yield of 3.12% and a forward annual dividend of 3.18%, as opposed to
PepsiCo’s trailing annual dividend yield of 2.98% and forward annual dividend yield of 3.21%.
Coca-Cola is doing well with its dividend yields, growing over time and giving a good return on
shareholders’ investments. High dividend yield rates can attract investors and Coca-Cola is
giving a good return within the industry. It will need to continue to increase with PepsiCo,
perhaps quicker, to keep this appeal.
Overall, Coca-Cola’s stock appears to be a good investment; it will not be the
highest-growing in a portfolio, but it will supply a dividend quarterly and is a relatively low-risk
investment. Watching the company would be important, as there is a chance that it is overvalued
and will drop quickly in the future, but its steady growth and overall company size give
confidence to it. It is not an expensive stock to purchase, and it yields a good dividend at 3.12%,
giving investors a good return for their investment. It is not volatile, so it will be a steady
investment.
COCA-COLA FINANCIAL AND MARKET ANALYSIS 18
Recommendations and Conclusions
Shareholder Recommendations
While Coca-Cola has good branding, the company is not performing as well it appears to
be. With decreasing earnings per share (EPS) and rapidly increasing price per earnings (P/E)
ratios, it may be becoming an overvalued company that will fall quickly in the future. That does
not mean it is a poor investment, however; it is simply important to watch the company for
potential future value drops.
Overall, Coca-Cola’s stock is a good investment for shareholders for a couple of reasons,
one of which being its steadily-rising quarterly dividends, currently at 3.12%. Despite its low
growth rate, the company has steady growth over time, and is relatively low risk due to its mega-
cap status.
As mentioned in the stock market analysis, dividends have increased over the past 5
years from $0.305 per share to $0.39 per share quarterly, or $1.22 per share to $1.56 per share
yearly. However, the lack of growth for the P/E ratio over the years for Coca-Cola implies that it
is very possible that the value of the stock will decrease in the future, as a company of its size is
unlikely to grow that significantly. An investment in this stock would be best for someone
looking for a long-term investment with a constantly growing dividend, but less increase in stock
value. Its P/E and EPS ratios should be watched in the coming years, as they may indicate that
the stock is losing its value.
Management Recommendations
Coca-Cola is beginning to fall behind the industry in several areas and an improvement
will be necessary to retain shareholders and go forward with a promising company. To maintain
shareholders and equity, Coca-Cola management should continue to increase dividend payout to

COCA-COLA FINANCIAL AND MARKET ANALYSIS 19
ensure happy shareholders. Additionally, this will ensure they do not fall behind main
competitors market values such as PepsiCo’s. Although Coca-Cola has had a steadily increasing
dividend payout, it would be beneficial for the company to continue to increase dividends at a
higher yield to ensure value continues to grow and to stay in competition with PepsiCo.
Currently, PepsiCo has a dividend payout of $0.93 per quarter as of September 2018
(CSIMarket, 2018). Coca-Cola is currently paying dividends of $0.39 per share quarterly.
PepsiCo’s shares are valued higher than Coca-Cola’s, so this in itself is not an issue; however,
Coca-Cola’s dividend yields are beginning to fall behind, despite growing over time. It provides
a good return on shareholders investments, considering its forward annual dividend yield of
3.18% increasing from its trailing yield of 3.12%, but PepsiCo recently made a jump from 2.98%
to 3.21%. These growing dividend yield rates will attract investors, as it implies Coca-Cola is
giving a good return within the industry. However, it will need to continue to increase dividend
yield at the same rate as PepsiCo’s forward annual dividend yield of 3.21% to keep the appeal
and maintain dividends as a strength for the company.
Coca-Cola managers should also continue to reduce costs of revenue through utilization
of supply chains, leveraging, and automation, where applicable, to offset the coming increases
due to the rising tariffs on aluminum and steel. With a declining revenue, down 15% in 2017,
this would continue the increase of its gross profit margin and allow the company to continue
rebranding, refranchising, and investing (see Appendix C; “The Coca-Cola Company Reports,”
2018).
The decline in revenue has been ongoing since 2013; this is therefore not a surprise in
either the industry or Coca-Cola’s own books. While the company is doing what it can to
increase sales in the coming years, lowering the cost of revenue in other areas to balance with the

COCA-COLA FINANCIAL AND MARKET ANALYSIS 20
tariffs would allow Coca-Cola to continue raising its gross profit margin as it did in 2017 (“The
Coca-Cola Company Reports,” 2018). This would also increase net income again since the
company’s income taxes were only high for 2017 and will be reducing again in the coming
years. This will improve all profitability ratios as well as EPS, increasing appeal to investors.
Lender Recommendations
Lenders, such as bankers, should be cautious of loaning money to Coca-Cola at this time
because of their rapidly declining times interest earned ratio, which is an indicator of a
company’s ability to honor the payment of interest before taxes to lenders. Coca-Cola’s
significantly decreasing times interest earned ratio implies that the company is taking longer to
pay off debts and/or increasingly neglecting payments. This is a reason for lenders to be
cautious, as it could result in missed interest payments from Coca-Cola in the future. The
company’s times interest earned ratio decreased from 22.09% to 11.21% from 2013 to 2018. It
suffered a drop of approximately 50% in 2015, falling to 10.20 from 2014’s 20.10. This is an
alarming rate that implies Coca-Cola is beginning to struggle with re-paying interest before taxes
to lenders.
Over the past five years, the company’s interest has been increasing as well, indicating a
need to get additional external financing. This could be due to Coca-Cola’s focus on rebranding,
which has been reducing revenue since 2012, or could be used to finance its launches of
smartwater, ZICO coconut water, and Appletiser (“The Coca-Cola Company Reports,” 2018). It
is not necessary to abstain from lending to Coca-Cola at this point, as it is a well-established
company that is unlikely to be bankrupt in the near future; however, watching the company for a
few quarters before making a final judgement may be in a lender’s best interest.

COCA-COLA FINANCIAL AND MARKET ANALYSIS 21
Conclusion
Coca-Cola is a large, well-established company with many financial successes and
struggles. Despite its lower earnings per share and price per earnings ratios, it is a relatively safe
investment for shareholders. The company’s struggles in the market value ratios in 2017 are due
to an exceptional year of income taxes that will not occur again in the following years. To
maintain Coca-Cola’s status, management should increase dividend yield to stay competitive in
the market, as well as focus on decreasing cost of revenue to improve profitability with
decreasing revenue. These will attract new investors to the company and supply extra cash to be
spent on both new investments and rebranding/refranchising. Potential lenders should be wary of
Coca-Cola’s decreasing times interest ratio, which hints at possible financial difficulty in the
future, but should not withhold any investment at this point.
Coca-Cola is doing well in its branding, but is beginning to fall behind financially. Other
companies in the industry, such as PepsiCo, are beginning to surpass Coca-Cola financially in
areas that they were previously doing better in, such as dividends and return on assets. Many
financial ratios were affected by the increased income tax, giving unusually low ratios that will
likely be improving again in the coming year. At this point in time, there is no concern for Coca-
Cola’s operations; consistently lower ratios in the future, however, could begin to hint at trouble.

COCA-COLA FINANCIAL AND MARKET ANALYSIS 22
References
Asmith. (n.d.). Our Story. Retrieved from https://www.worldofcoca-cola.com/our-story/
Average days payable ratio & industry analysis tool. (n.d.). Retrieved from
https://www.bdc.ca/en/articles-tools/entrepreneur-toolkit/business-assessments/pages/accounts-
payable-benchmarking-tool-entrepreneurs.aspx
Coca-Cola: Brand value 2018. (n.d.). Retrieved from
https://www.statista.com/statistics/326065/coca-cola-brand-value/
Coca-Cola History │ World of Coca-Cola. (n.d.). Retrieved from https://www.worldofcoca-
cola.com/about-us/coca-cola-history/
Coca-Cola Leaders. (n.d.). Retrieved from https://www.coca-colacompany.com/our-
company/leadership
Financial ratios: 4 ways to assess your business. (n.d.). Retrieved from
https://www.bdc.ca/en/articles-tools/money-finance/manage-finances/pages/financial-ratios-4-
ways-assess-business.aspx
Islam, R., Khan, T. R., Choudhury, T. T., & Adnan, A. M. (2014). How Earning Per Share (EPS)
Affects on Share Price and Firm Value. European Journal of Business and Management,6(17),
97-108.
Lovelace, B. (2018, July 25). Coca-Cola CEO says company sees cost pressures from Trump's
tariffs. Retrieved from https://www.cnbc.com/2018/07/25/coca-cola-ceo-company-sees-cost-
pressures-from-trumps-tariffs.html
Market Capitalization. (2018, August 03). Retrieved from
https://www.investopedia.com/terms/m/marketcapitalization.asp

COCA-COLA FINANCIAL AND MARKET ANALYSIS 23
Maverick, J. B. (2018, November 14). Much of the Global Beverage Industry Is Controlled by
Coca-Cola and Pepsi. Retrieved from https://www.investopedia.com/ask/answers/060415/how-
much-global-beverage-industry-controlled-coca-cola-and-pepsi.asp
Measuring profitability. (2018, August 09). Retrieved from
https://www.business.qld.gov.au/running-business/finances-cash-flow/managing-
money/monitoring-performance/measuring-profitability
Murphy, C. B. (2018, May 22). Why Do Companies Care About Their Stock Prices? Retrieved from
https://www.investopedia.com/investing/why-do-companies-care-about-their-stock-prices/
Nonalcoholic Beverages Industry Financial Strength Information. (n.d.). Retrieved from
https://csimarket.com/Industry/industry_Financial_Strength_Ratios.php?ind=502
Peavler, R. (n.d.). What Are Market Value Ratios and How Are They Used? Retrieved from
https://www.thebalancesmb.com/what-are-market-value-ratios-and-how-are-they-used-393224
Pepsico Inc's Dividend Payout by Quarter. (n.d.). Retrieved from
https://csimarket.com/stocks/single_dividendpr.php?code=PEP
Pinsent, W. (2018, October 09). Understanding Stock Prices and Values. Retrieved from
https://www.investopedia.com/articles/stocks/08/stock-prices-fool.asp
The Coca-Cola Company. (2018). 2017 Annual Report on Form 10k. Washington, D.C.: The Coca-
Cola Company.
The Coca-Cola Company Reports Strong Operating Results for Fourth Quarter and Full Year 2017;
Achieves or Exceeds All Full Year Guidance. (2018, February 16). Retrieved from
https://www.coca-colacompany.com/press-center/press-releases/the-coca-cola-company-reports-
strong-operating-results-for-fourth-quarter-2017

COCA-COLA FINANCIAL AND MARKET ANALYSIS 24
What Is the Relationship Between P/E Ratio and Stock Price? (2016, March 18). Retrieved from
https://www.fool.com/knowledge-center/the-relationship-between-pe-ratio-and-stock-price.aspx
Why Dividends Matter To Investors. (2018, July 24). Retrieved from
https://www.investopedia.com/articles/fundamental/03/102903.asp
Wiener-Bronner, D. (2018, November 17). Why Coca-Cola may launch Coke-branded energy
drinks. Retrieved from https://www.cnn.com/2018/11/17/business/coca-cola-energy-
drinks/index.html

COCA-COLA FINANCIAL AND MARKET ANALYSIS 25
Appendix A
Statement of Cash Flows
COCA COLA CO (KO)
Statement of Cash Flows
For the years ended December 1
Fiscal year ends in December. USD in millions except per share data.TTM Dec-17 Dec-16 Dec-15 Dec-14 Dec-13
Cash Flows From Operating Activities
Net income 2,242$ 1,182$ 6,550$ 7,366$ 7,124$ 8,626$
Depreciation & amortization 1,184 1,260 1,787 1,970 1,976 1,977
Deferred income taxes (1,871) (1,256) (856) 73 (40) 648
Stock based compensation 226 219 258 236 209 227
Change in working capital 2,836 3,529 (221) (157) (439) (932)
Accounts receivable (141) (28) (212) (253) 28
Inventory (355) (142) (250) 35 (105)
Prepaid expenses 571 283 123 194 (163)
Accounts payable (445) (540) 1,004 (250) (158)
Income taxes payable (153) 750 (306) 151 22
Other working capital 2,836 4,052 (544) (516) (316) (556)
Other non-cash items 1,833 2,172 1,278 1,040 1,785 (4)
Net cash provided by operating activities 6,450 7,106 8,796 10,528 10,615 10,542
Cash Flows From Investing Activities
Investments in property, plant, and equipment (1,455) (1,675) (2,262) (2,553) (2,406) (2,550)
Property, plant, and equipment reductions 124 104 150 85 223 111
Acquisitions, net (1,528) (79) 197 (1,926) (241) 519
Purchases of investments (10,918) (16,520) (15,499) (15,831) (17,800) (14,782)
Sales/Maturities of investments 14,803 15,911 16,624 14,079 12,986 12,791
Other investing activities (21) (191) (209) (40) (268) (303)
Net cash used for investing activities 1,005 (2,450) (999) (6,186) (7,506) (4,214)
Cash Flows From Financing Activities
Debt issued 27,461 29,857 27,281 40,434 41,674 43,425
Debt repayment (30,501) (28,768) (25,615) (37,738) (36,962) (38,714)
Common stock issued 1,278 1,595 1,434 1,245 1,532 1,328
Common stock repurchased (2,802) (3,682) (3,681) (3,564) (4,162) (4,832)
Dividend paid (6,398) (6,320) (6,043) (5,741) (5,350) (4,969)
Other financing activities (117) (129) 79 251 (363) 17
Net cash provided by (used for) financing activities (11,079) (7,447) (6,545) (5,113) (3,631) (3,745)
Effect of exchange rate changes (66) 242 (6) (878) (934) (611)
Net change in cash (3,690) (2,549) 1,246 (1,649) (1,456) 1,972
Cash at beginning of period 11,987 8,555 7,309 8,958 10,414 8,442
Cash at end of period 8,297$ 6,006$ 8,555$ 7,309$ 8,958$ 10,414$
Free Cash Flow
Operating cash flow 6,450 7,106 8,796 10,528 10,615 10,542
Capital expenditure (1,455) (1,675) (2,262) (2,553) (2,406) (2,550)
Free cash flow 4,995 5,431 6,534 7,975 8,209 7,992

COCA-COLA FINANCIAL AND MARKET ANALYSIS 26
Appendix B
Statement of Financial Position and Vertical/Horizontal Analyses
COCA COLA CO (KO)
Statement of Financial Position
For the years ended December 1
Fiscal year ends in December. USD in millions except per share data. Dec-17 Dec-16 Dec-15 Dec-14 Dec-13 Dec-17 Dec-16 Dec-15 Dec-14 Dec-17 Dec-16 Dec-15 Dec-14
Assets
Current assets
Cash
Cash and cash equivalents 6,006$ 8,555$ 7,309$ 8,958$ 10,414$ 7% 10% 8% 10% -30% 17% -18% -14%
Short-term investments 14,669 13,646 12,591 12,717 9,854 17% 16% 14% 14% 7% 8% -1% 29%
Total cash 20,675 22,201 19,900 21,675 20,268 24% 25% 22% 24% -7% 12% -8% 7%
Receivables 3,667 3,856 3,941 4,466 4,873 4% 4% 4% 5% -5% -2% -12% -8%
Inventories 2,655 2,675 2,902 3,100 3,277 3% 3% 3% 3% -1% -8% -6% -5%
Prepaid expenses 2,000 2,481 2,752 3,066 2,886 2% 3% 3% 3% -19% -10% -10% 6%
Other current assets 7,548 2,797 3,900 679 9% 3% 4% 1% 170% -28% 474%
Total current assets 36,545 34,010 33,395 32,986 31,304 42% 39% 37% 36% 7% 2% 1% 5%
Non-current assets
Property, plant and equipment
Gross property, plant and equipment 16,449 21,256 22,354 25,258 25,032 19% 24% 25% 27% -23% -5% -11% 1%
Accumulated Depreciation (8,246) (10,621) (9,783) (10,625) (10,065) -9% -12% -11% -12% -22% 9% -8% 6%
Net property, plant and equipment 8,203 10,635 12,571 14,633 14,967 9% 12% 14% 16% -23% -15% -14% -2%
Equity and other investments 21,952 17,249 15,788 13,625 11,512 25% 20% 18% 15% 27% 9% 16% 18%
Goodwill 9,401 10,629 11,289 12,100 12,312 11% 12% 13% 13% -12% -6% -7% -2%
Intangible assets 7,235 10,499 12,843 14,272 15,299 8% 12% 14% 16% -31% -18% -10% -7%
Other long-term assets 4,560 4,248 4,207 4,407 4,661 5% 5% 5% 5% 7% 1% -5% -5%
Total non-current assets 51,351 53,260 56,698 59,037 58,751 58% 61% 63% 64% -4% -6% -4% 0%
Total assets 87,896$ 87,270$ 90,093$ 92,023$ 90,055$ 100% 100% 100% 100% 1% -3% -2% 2%
Liabilities and stockholders' equity
Liabilities
Current liabilities
Short-term debt 16,503$ 16,025$ 15,806$ 22,682$ 17,925$ 19% 18% 18% 25% 3% 1% -30% 27%
Accounts payable 2,288 2,682 2,795 2,089 1,933 3% 3% 3% 2% -15% -4% 34% 8%
Deferred income taxes 692 1% -100%
Taxes payable 757 679 775 911 759 1% 1% 1% 1% 11% -12% -15% 20%
Accrued liabilities 5,259 4,887 5,485 5,637 6,261 6% 6% 6% 6% 8% -11% -3% -10%
Other current liabilities 2,387 1,567 2,069 1,055 933 3% 2% 2% 1% 52% -24% 96% 13%
Total current liabilities 27,194 26,532 26,930 32,374 27,811 31% 30% 30% 35% 2% -1% -17% 16%
Non-current liabilities
Long-term debt 31,182 29,684 28,407 19,063 19,154 35% 34% 32% 21% 5% 4% 49% 0%
Deferred taxes liabilities 2,522 3,753 4,691 5,636 6,152 3% 4% 5% 6% -33% -20% -17% -8%
Minority interest 1,905 158 210 241 267 2% 0% 0% 0% 1106% -25% -13% -10%
Other long-term liabilities 8,021 4,081 4,301 4,389 3,498 9% 5% 5% 5% 97% -5% -2% 25%
Total non-current liabilities 43,630 37,676 37,609 29,329 29,071 50% 43% 42% 32% 16% 0% 28% 1%
Total liabilities 70,824 64,208 64,539 61,703 56,882 81% 74% 72% 67% 10% -1% 5% 8%
Stockholders' equity
Common stock 1,760 1,760 1,760 1,760 1,760 2% 2% 2% 2% 0% 0% 0% 0%
Additional paid-in capital 15,864 14,993 14,016 13,154 12,276 18% 17% 16% 14% 6% 7% 7% 7%
Retained earnings 60,430 65,502 65,018 63,408 61,660 69% 75% 72% 69% -8% 1% 3% 3%
Treasury stock (50,677) (47,988) (45,066) (42,225) (39,091) -58% -55% -50% -46% 6% 6% 7% 8%
Accumulated other comprehensive income (10,305) (11,205) (10,174) (5,777) (3,432) -12% -13% -11% -6% -8% 10% 76% 68%
Total stockholders' equity 17,072 23,062 25,554 30,320 33,173 19% 26% 28% 33% -26% -10% -16% -9%
Total liabilities and stockholders' equity 87,896$ 87,270$ 90,093$ 92,023$ 90,055$ 100% 100% 100% 100% 1% -3% -2% 2%
Vertical Analysis Horizontal Analysis

COCA-COLA FINANCIAL AND MARKET ANALYSIS 27
Appendix C
Statement of Comprehensive Income and Vertical/Horizontal Analyses
Appendix D
Stock Market Comparison
COCA COLA CO (KO)
Statement of Comprehensive Income
For the years ended December 1
USD in millions except per share data. Dec-17 Dec-16 Dec-15 Dec-14 Dec-13 Dec-17 Dec-16 Dec-15 Dec-14 Dec-17 Dec-16 Dec-15 Dec-14
Revenue 35,410$ 41,863$ 44,294$ 45,998$ 46,854$ 100% 100% 100% 100% -15% -5% -4% -2%
Cost of revenue 13,256 16,465 17,482 17,889 18,421 37% 39% 39% 39% -19% -6% -2% -3%
Gross profit 22,154 25,398 26,812 28,109 28,433 63% 61% 61% 61% -13% -5% -5% -1%
Operating expenses 0%
Sales, General and administrative 12,496 15,262 16,427 17,218 17,310 35% 36% 37% 37% -18% -7% -5% -1%
Restructuring, merger and acquisition 1,088 3% 0% 0% 0%
Other operating expenses (857) 1,510 1,657 1,183 895 -2% 4% 4% 3% -157% -9% 40% 32%
Total operating expenses 12,727 16,772 18,084 18,401 18,205 36% 40% 41% 40% -24% -7% -2% 1%
Operating income 9,427 8,626 8,728 9,708 10,228 27% 21% 20% 21% 9% -1% -10% -5%
Interest Expense 841 733 856 483 463 2% 2% 2% 1% 15% -14% 77% 4%
Other income (expense) (1,844) 243 1,733 100 1,712 -5% 1% 4% 0% -859% -86% 1633% -94%
Income before taxes 6,742 8,136 9,605 9,325 11,477 19% 19% 22% 20% -17% -15% 3% -19%
Provision for income taxes 5,560 1,586 2,239 2,201 2,851 16% 4% 5% 5% 251% -29% 2% -23%
Net income from continuing operations 1,182$ 6,550$ 7,366$ 7,124$ 8,626$ 3% 16% 17% 15% -82% -11% 3% -17%
Net income from discontinuing ops 101
Other (35) (23) (15) (26) (42)
Net income 1,248 6,527 7,351 7,098 8,584 4% 16% 17% 15% -81% -11% 4% -17%
Net income available to common shareholders 1,248 6,527 7,351 7,098 8,584
Earnings per share
Basic 0.29$ 1.51$ 1.69$ 1.62$ 1.94$
Diluted 0.29$ 1.49$ 1.67$ 1.60$ 1.90$
Weighted average shares outstanding
Basic 4,272 4,317 4,352 4,387 4,434
Diluted 4,324 4,367 4,405 4,450 4,509
EBITDA 8,843 10,656 12,431 11,784 13,917
Vertical Analysis Horizontal Analysis