Embed Size (px)
DESCRIPTION
COBECOS Salerno 22-23 Feb 2007. David Agnew Imperial College/MRAG. CFCA project tasks. A full description of existing MCS capacity and costs for each MS; - PowerPoint PPT Presentation
Citation preview
COBECOS COBECOS Salerno 22-23 Feb 2007Salerno 22-23 Feb 2007
David AgnewDavid Agnew
Imperial College/MRAGImperial College/MRAG


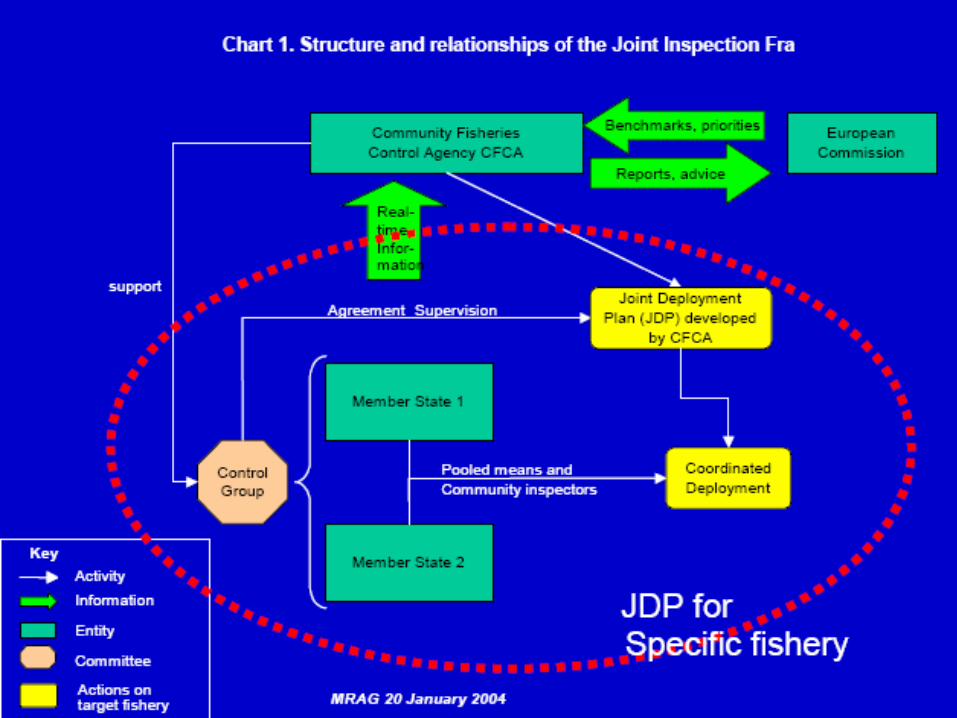
CFCA project tasksCFCA project tasks
A full description of existing MCS capacity and A full description of existing MCS capacity and costs for each MS;costs for each MS;
To establish the views of MS, the Commission, To establish the views of MS, the Commission, third parties (fishery partner counties and third parties (fishery partner counties and Regional Fisheries Organisations) and other Regional Fisheries Organisations) and other industry stakeholders on the operation of the industry stakeholders on the operation of the Agency indicators of MS ‘interest’;Agency indicators of MS ‘interest’;
To examine options for joint deployment plans, To examine options for joint deployment plans, their efficiency and cost/benefittheir efficiency and cost/benefit
To examine options for Agency activity, and costs To examine options for Agency activity, and costs from case studies and other meansfrom case studies and other means
To examine options for Agency structureTo examine options for Agency structure
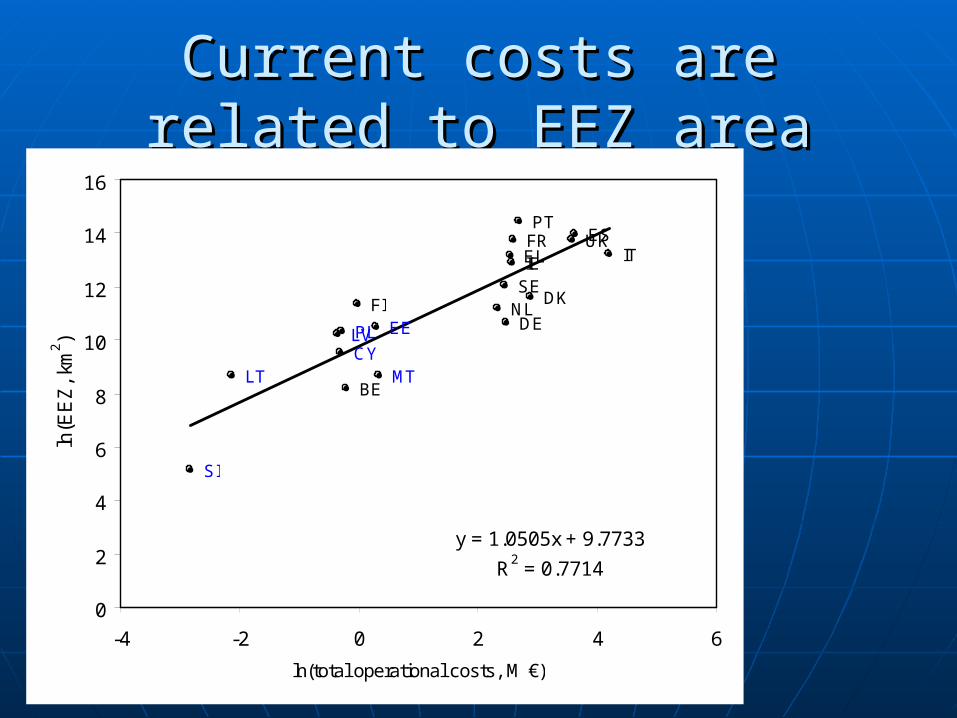
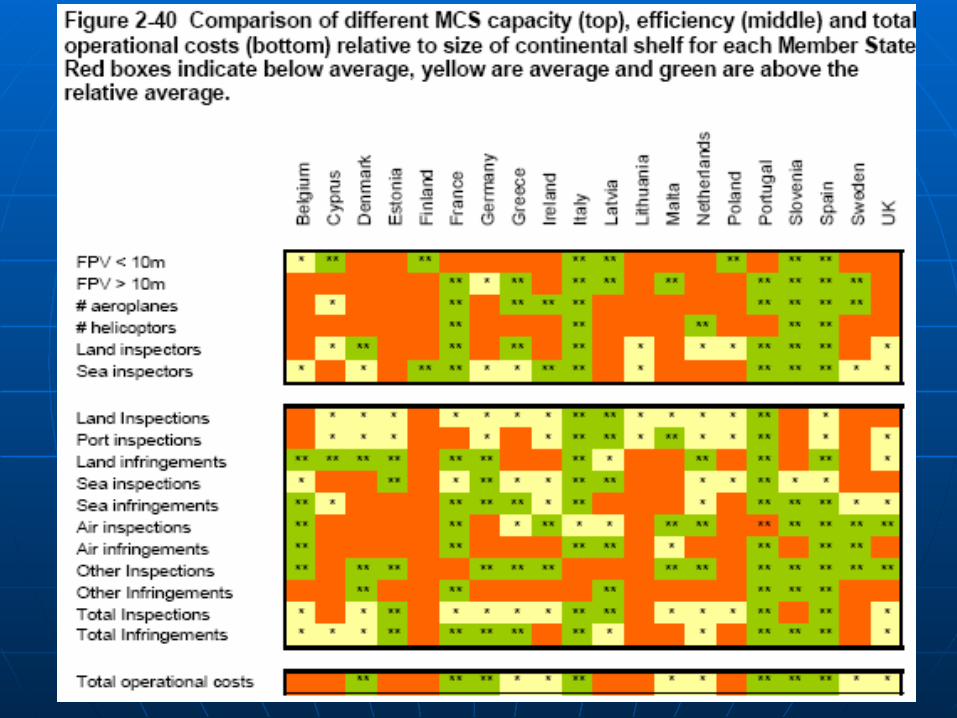
Current costs are related to EEZ Current costs are related to EEZ areaarea
PT
BE
SI
LTMT
CY
FI
PL
EE
DK
DE
LV
IT
SE
UK
NL
FR
ES
IE
EL
y = 0.7372x + 5.1735
R2 = 0.712
0.0
1.0
2.0
3.0
4.0
5.0
6.0
7.0
8.0
9.0
10.0
-4 -3 -2 -1 0 1 2 3 4 5
ln(total operational costs, M €)
ln(N
umbe
r of
ves
sels
>10
m)
PT
BE
SI
LT MTCY
FI
PL EE
DK
DELV
IT
SE
UK
NL
FR ES
IEEL
y = 1.0505x + 9.7733
R2 = 0.7714
0
2
4
6
8
10
12
14
16
-4 -2 0 2 4 6
ln(total operational costs, M €)
ln(E
EZ
, km
2 )
PT
BE
SI
LT
MT
CY
FI
PL
EE
DK
DELV
IT
SE
UK
NL
FR
ES
IE
EL
y = -0.1641x + 4.6406
R2 = 0.0213
-
1.00
2.00
3.00
4.00
5.00
6.00
7.00
8.00
-4 -2 0 2 4 6
ln(total operational costs, M €)
ln(t
ota
l ca
tch
pe
r ve
sse
l, to
nn
es)
PT
BE
SI
LT
MTCY
FI
PL
EE
DK
DE
LV
IT
SE
UK
NLFR
ES
IE
EL
y = 0.5367x + 9.5725
R2 = 0.1452
-
2.0
4.0
6.0
8.0
10.0
12.0
14.0
16.0
-4 -3 -2 -1 0 1 2 3 4 5
ln(total operational costs, M €)
ln(t
otal
cat
ch,
tonn
es)
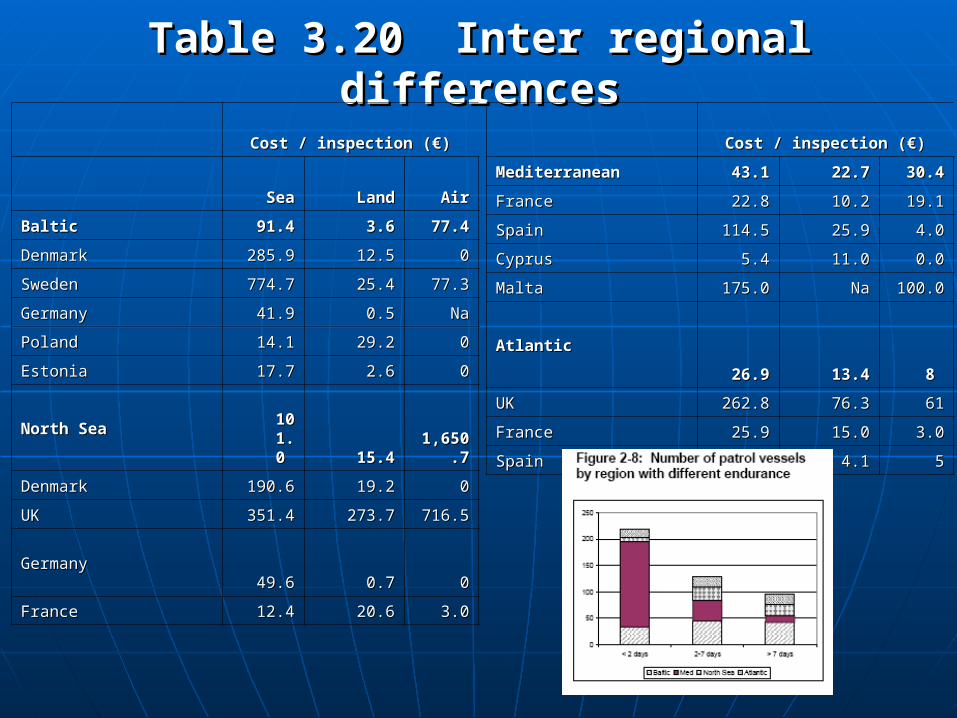
Table 3.20 Inter regional differencesTable 3.20 Inter regional differences
Cost / inspection (€)Cost / inspection (€)
SeaSea LandLand AirAir
BalticBaltic 91.491.4 3.63.6 77.477.4
DenmarkDenmark 285.9285.9 12.512.5 00
SwedenSweden 774.7774.7 25.425.4 77.377.3
GermanyGermany 41.941.9 0.50.5 NaNa
Poland Poland 14.114.1 29.229.2 00
EstoniaEstonia 17.717.7 2.62.6 00
North SeaNorth Sea 101.0 101.0
15.4 15.4 1,650.7 1,650.7
DenmarkDenmark 190.6190.6 19.219.2 00
UKUK 351.4351.4 273.7273.7 716.5716.5
GermanyGermany49.649.6
0.7 0.7 00
FranceFrance 12.412.4 20.620.6 3.03.0
Cost / inspection (€)Cost / inspection (€)
MediterraneanMediterranean 43.143.1 22.722.7 30.430.4
FranceFrance 22.822.8 10.210.2 19.119.1
SpainSpain 114.5114.5 25.925.9 4.04.0
CyprusCyprus 5.45.4 11.011.0 0.00.0
MaltaMalta 175.0175.0 NaNa 100.0100.0
AtlanticAtlantic26.926.9 13.413.4
8 8
UKUK 262.8262.8 76.376.3 6161
FranceFrance 25.925.9 15.015.0 3.03.0
SpainSpain 12.912.9 4.14.1 55
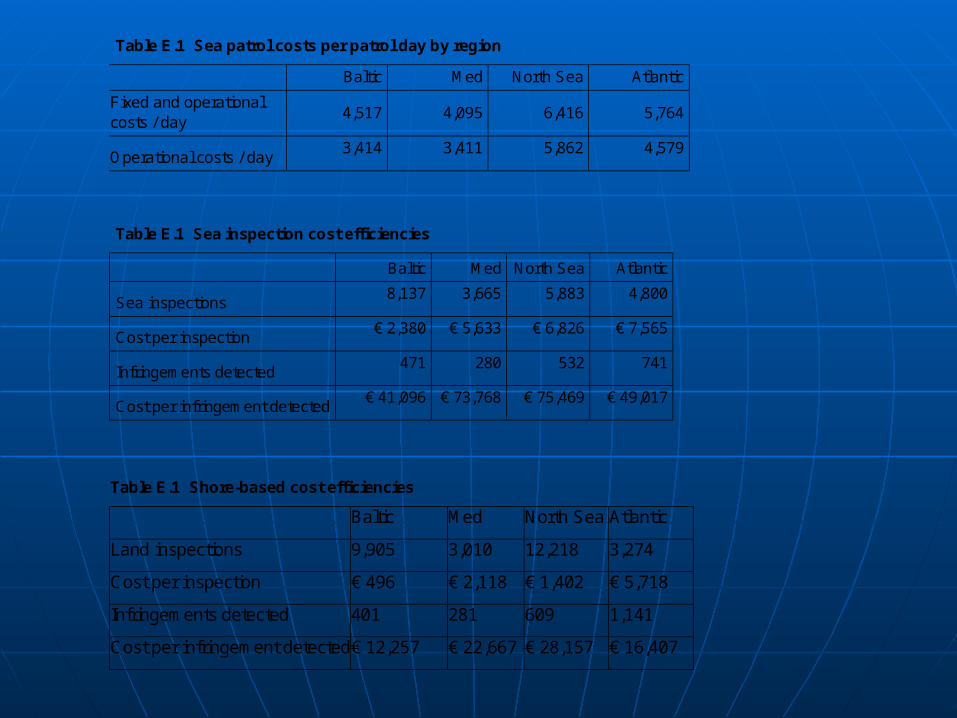
Table E.1 Sea patrol costs per patrol day by region
Baltic Med North Sea Atlantic
Fixed and operational costs / day
4,517 4,095 6,416 5,764
Operational costs / day 3,414 3,411 5,862 4,579
Table E.1 Sea inspection cost efficiencies
Baltic Med North Sea Atlantic
Sea inspections 8,137 3,665 5,883 4,800
Cost per inspection € 2,380 € 5,633 € 6,826 € 7,565
Infringements detected 471 280 532 741
Cost per infringement detected € 41,096 € 73,768 € 75,469 € 49,017
Table E.1 Shore-based cost efficiencies
Baltic Med North Sea Atlantic
Land inspections 9,905 3,010 12,218 3,274
Cost per inspection € 496 € 2,118 € 1,402 € 5,718
Infringements detected 401 281 609 1,141
Cost per infringement detected € 12,257 € 22,667 € 28,157 € 16,407
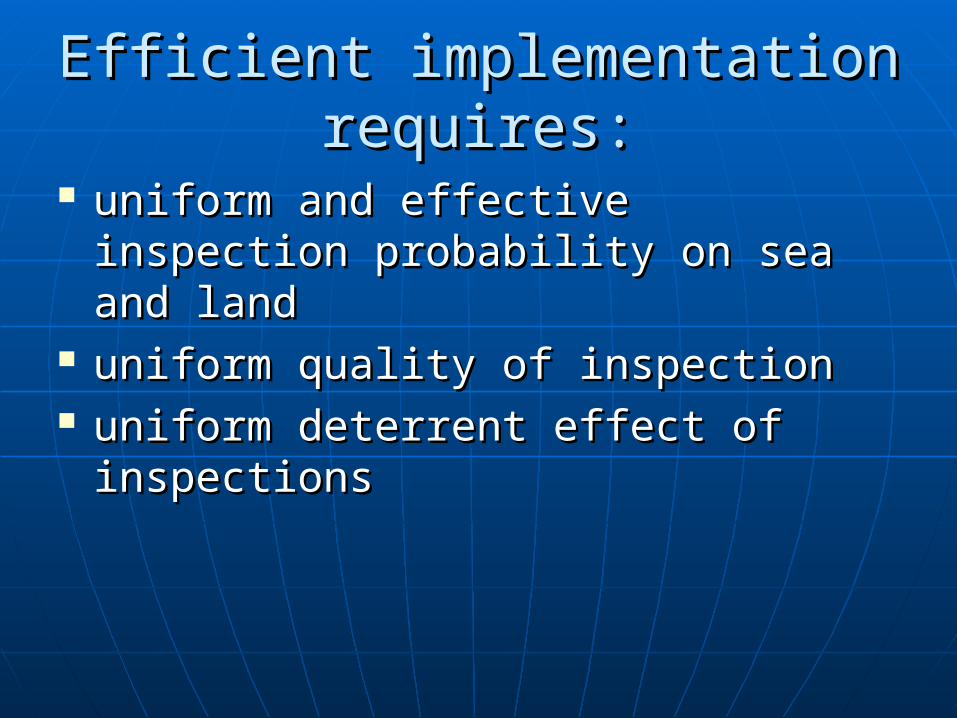
Efficient implementation Efficient implementation requires:requires:
uniform and effective inspection uniform and effective inspection probability on sea and landprobability on sea and land
uniform quality of inspectionuniform quality of inspection uniform deterrent effect of uniform deterrent effect of
inspectionsinspections
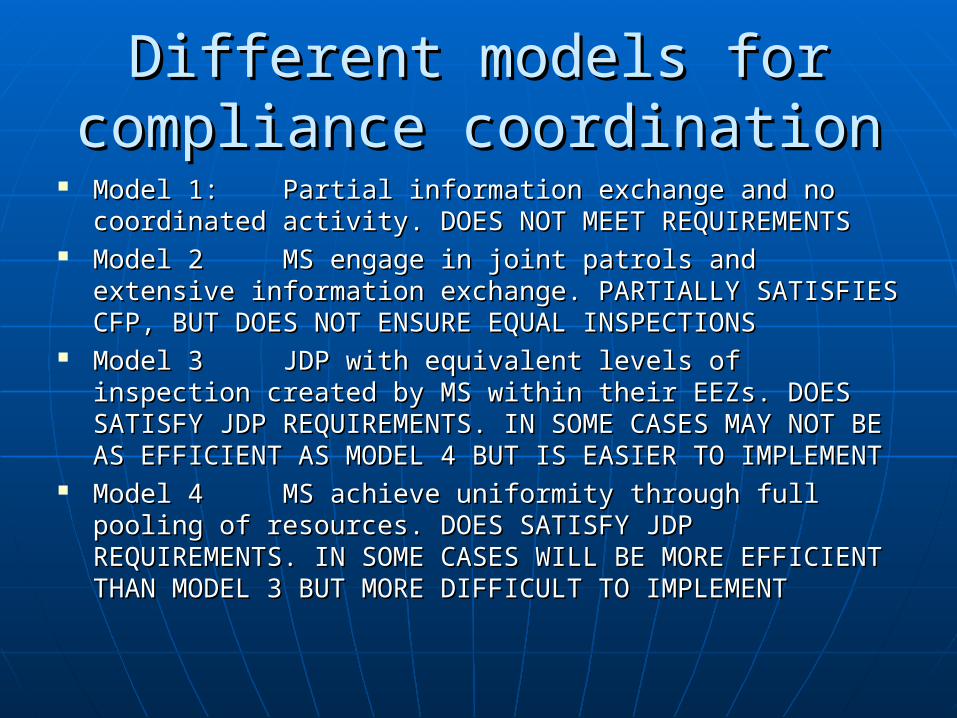
Different models for compliance Different models for compliance coordinationcoordination
Model 1: Model 1: Partial information exchange and no Partial information exchange and no coordinated activity. DOES NOT MEET REQUIREMENTScoordinated activity. DOES NOT MEET REQUIREMENTS
Model 2 Model 2 MS engage in joint patrols and extensive MS engage in joint patrols and extensive information exchange. PARTIALLY SATISFIES CFP, BUT DOES information exchange. PARTIALLY SATISFIES CFP, BUT DOES NOT ENSURE EQUAL INSPECTIONS NOT ENSURE EQUAL INSPECTIONS
Model 3 Model 3 JDP with equivalent levels of inspection JDP with equivalent levels of inspection created by MS within their EEZs. DOES SATISFY JDP created by MS within their EEZs. DOES SATISFY JDP REQUIREMENTS. IN SOME CASES MAY NOT BE AS EFFICIENT REQUIREMENTS. IN SOME CASES MAY NOT BE AS EFFICIENT AS MODEL 4 BUT IS EASIER TO IMPLEMENTAS MODEL 4 BUT IS EASIER TO IMPLEMENT
Model 4 Model 4 MS achieve uniformity through full pooling of MS achieve uniformity through full pooling of resources. DOES SATISFY JDP REQUIREMENTS. IN SOME resources. DOES SATISFY JDP REQUIREMENTS. IN SOME CASES WILL BE MORE EFFICIENT THAN MODEL 3 BUT MORE CASES WILL BE MORE EFFICIENT THAN MODEL 3 BUT MORE DIFFICULT TO IMPLEMENTDIFFICULT TO IMPLEMENT
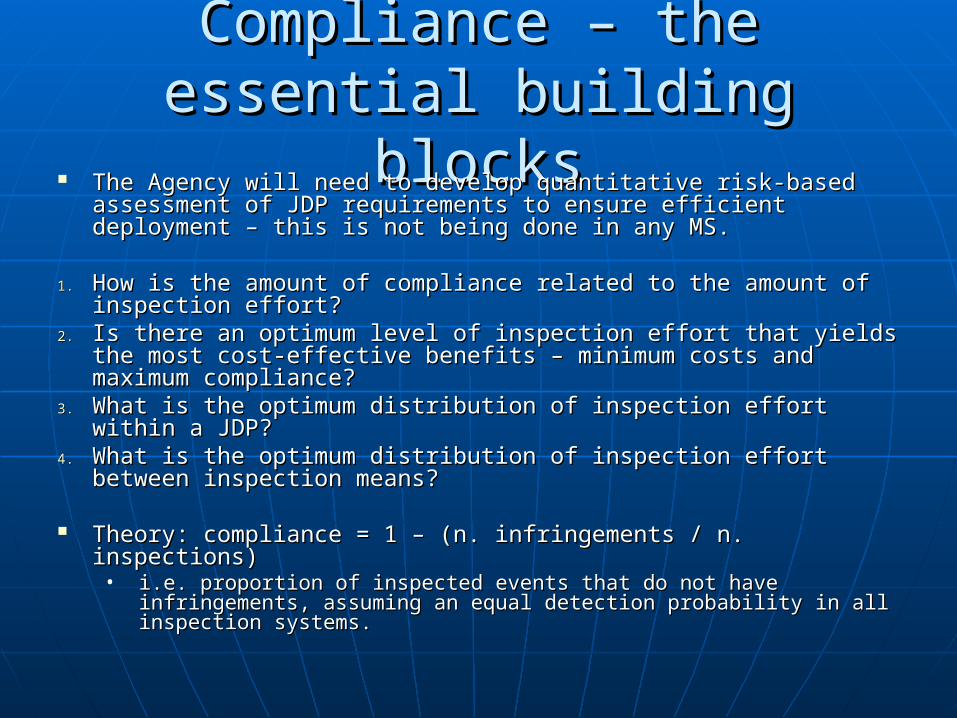
Compliance – the essential Compliance – the essential building blocksbuilding blocks
The Agency will need to develop quantitative risk-based The Agency will need to develop quantitative risk-based assessment of JDP requirements to ensure efficient deployment – assessment of JDP requirements to ensure efficient deployment – this is not being done in any MS.this is not being done in any MS.
1.1. How is the amount of compliance related to the amount of How is the amount of compliance related to the amount of inspection effort? inspection effort?
2.2. Is there an optimum level of inspection effort that yields the most Is there an optimum level of inspection effort that yields the most cost-effective benefits – minimum costs and maximum cost-effective benefits – minimum costs and maximum compliance?compliance?
3.3. What is the optimum distribution of inspection effort within a JDP?What is the optimum distribution of inspection effort within a JDP?4.4. What is the optimum distribution of inspection effort between What is the optimum distribution of inspection effort between
inspection means?inspection means?
Theory: compliance = 1 – (n. infringements / n. inspections)Theory: compliance = 1 – (n. infringements / n. inspections)• i.e. proportion of inspected events that do not have infringements, i.e. proportion of inspected events that do not have infringements,
assuming an equal detection probability in all inspection systems. assuming an equal detection probability in all inspection systems.
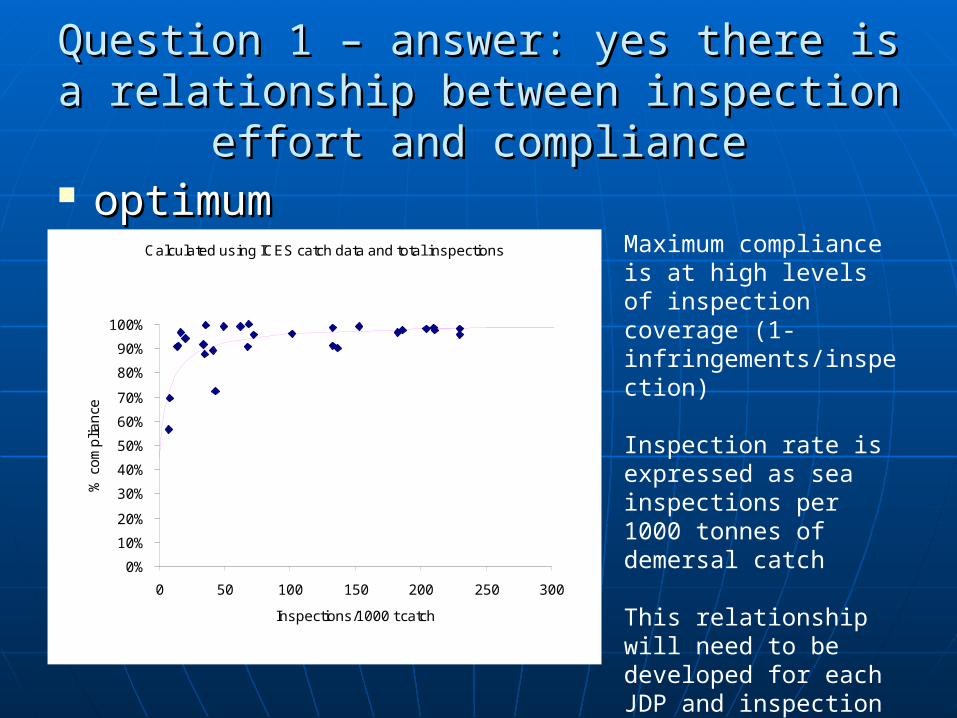
Question 1 – answer: yes there is a Question 1 – answer: yes there is a relationship between inspection effort and relationship between inspection effort and
compliancecompliance optimum optimum
complianccompliance is e is achieveachieve
Calculated using ICES catch data and total inspections
0%
10%
20%
30%
40%
50%
60%
70%
80%
90%
100%
0 50 100 150 200 250 300
Inspections/1000 t catch
% c
om
plia
nce
Maximum compliance is at high levels of inspection coverage (1-infringements/inspection)
Inspection rate is expressed as sea inspections per 1000 tonnes of demersal catch
This relationship will need to be developed for each JDP and inspection means by the Agency
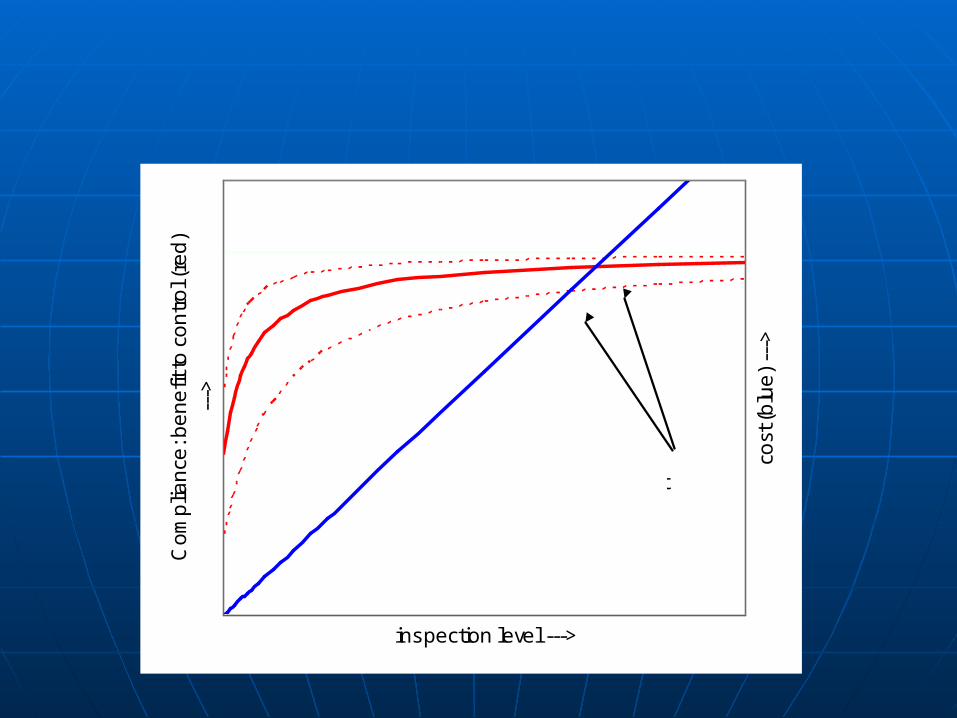
inspection level --->
Co
mp
lian
ce: b
en
efit
to c
on
tro
l (re
d)
--->
cost
(b
lue
) --
->
differentoptima
maximum

Question 3: the optimum distribution of Question 3: the optimum distribution of inspections is in direct proportion to fishing inspections is in direct proportion to fishing
effort (catches)effort (catches)
0
10
20
30
40
50
60
0% 20% 40% 60% 80%
% departure from ideal distribution of control effort
pe
rce
nta
ge
of
infr
ing
em
en
ts
density of inspection: 1 /1000 tdensity of inspection: 5 /1000 tdensity of inspection: 10 /1000 tdensity of inspection: 20 /1000 tdensity of inspection: 50 /1000 tdensity of inspection: 150 /1000 tdensity of inspection: 350 /1000 t
A 20% discrepancy between the current distribution of inspections, and the distribution of the catch, is predicted to lead to a 10% higher level of infringements than a perfectly distributed system
idealcurrent
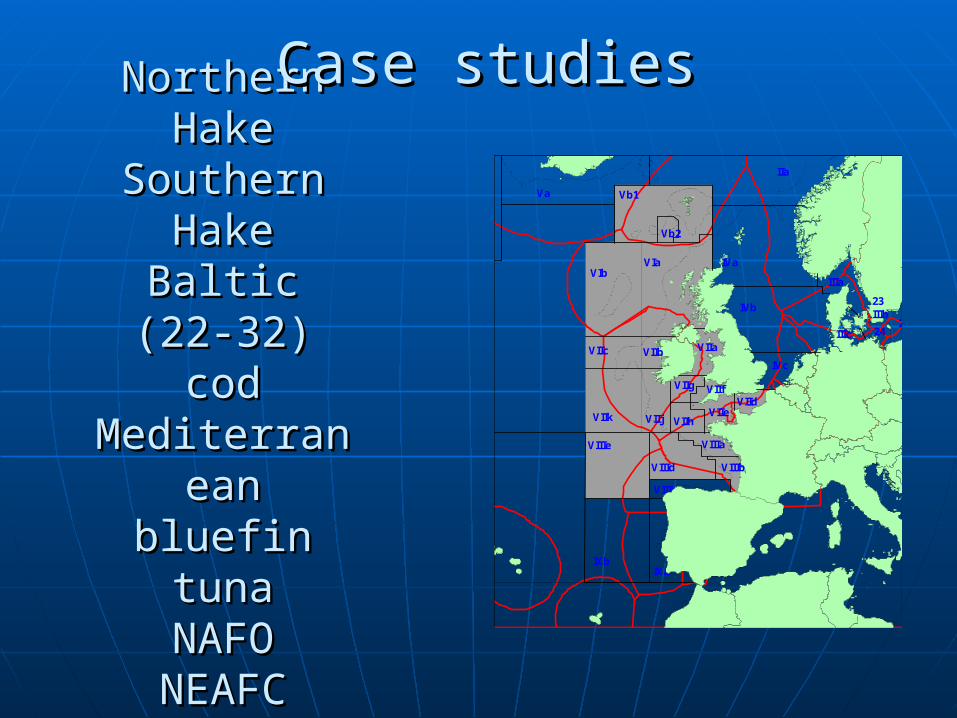
Northern Northern HakeHake
Southern Southern HakeHake
Baltic (22-32) Baltic (22-32) codcod
MediterraneaMediterranean bluefin tunan bluefin tuna
NAFONAFONEAFCNEAFC
IVa
IIIa
IIa
27
24
IVc
IIId
IIIc25
23IIIb
VIIIa
VIIk VIIj
VIIdVIIe
VIIIb
VIIg
VIIc VIIb VIIa
VIIf
IVb
XII
VIIIe
VIIId
VIIIc
VIIh
IXbIXa
Vb1
Vb2
VIbVIa
Va
Case studiesCase studies

Testing the application of criteria for Testing the application of criteria for allocation of responsibility (“interest”) allocation of responsibility (“interest”)
from the proposed regulationfrom the proposed regulation the quantity of fish landed on its territory as a proportion of the quantity of fish landed on its territory as a proportion of
the total landings from the fishery that is subject to the JDP;the total landings from the fishery that is subject to the JDP; the relative number of community fishing vessels flying its the relative number of community fishing vessels flying its
flag (engine power and gross tonnage) that are actively flag (engine power and gross tonnage) that are actively involved in the fishery that is subject to the JDP in relation involved in the fishery that is subject to the JDP in relation to the total number of vessels that are actively involved in to the total number of vessels that are actively involved in that fishery;that fishery;
the relative size of its quota allocation or, in the absence of the relative size of its quota allocation or, in the absence of a quota, its catch in a given reference period in respect of a quota, its catch in a given reference period in respect of that fishery;that fishery;
the relative extent of the waters subject to its sovereignty the relative extent of the waters subject to its sovereignty or jurisdiction, if any, that are covered by the plan.or jurisdiction, if any, that are covered by the plan.
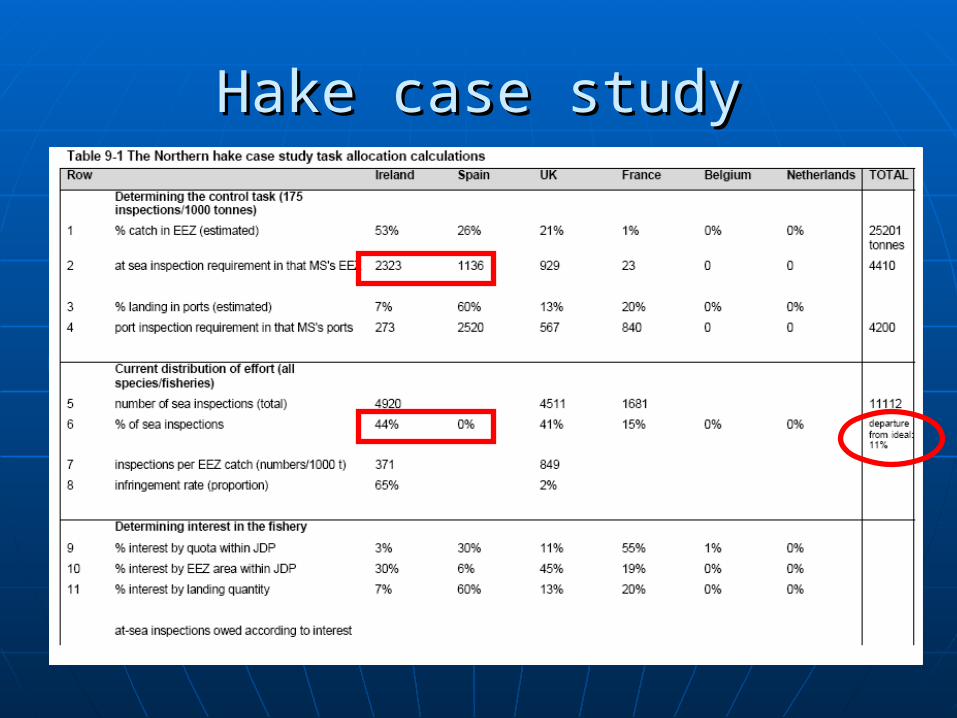
Hake case studyHake case study

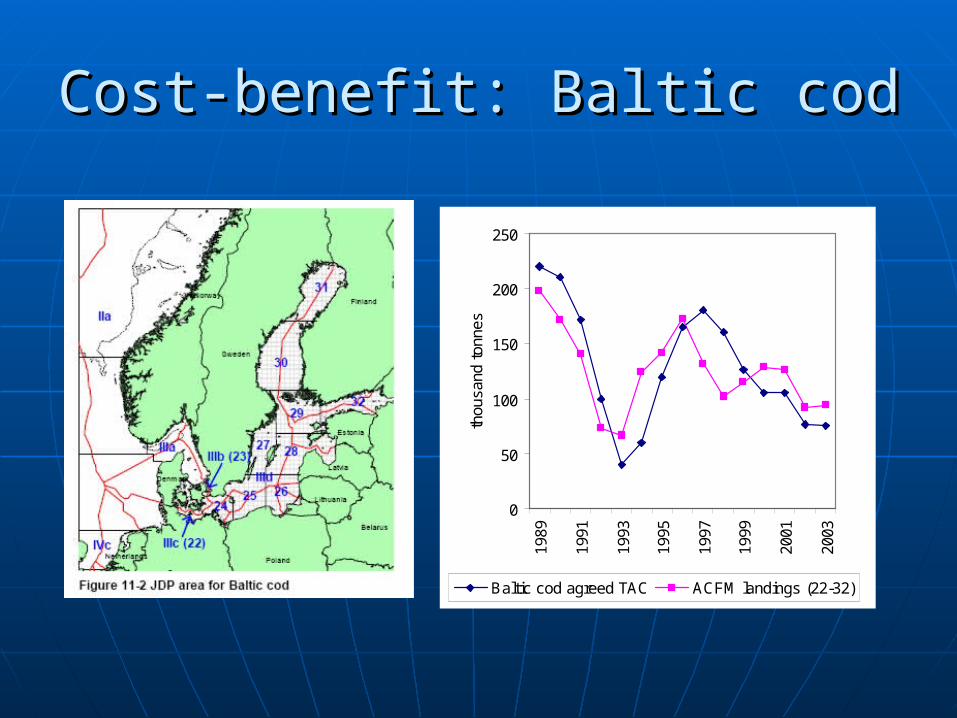
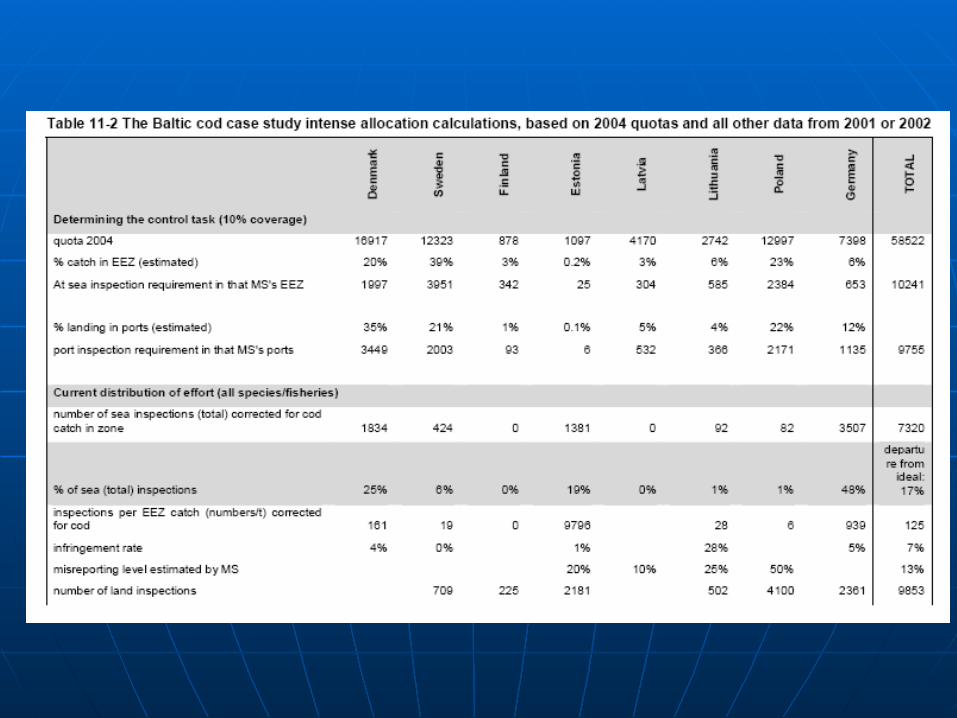
Cost-benefit: Baltic codCost-benefit: Baltic cod
0
50
100
150
200
250
1989
1991
1993
1995
1997
1999
2001
2003
thou
sand
ton
nes
Baltic cod agreed TAC ACFM landings (22-32)

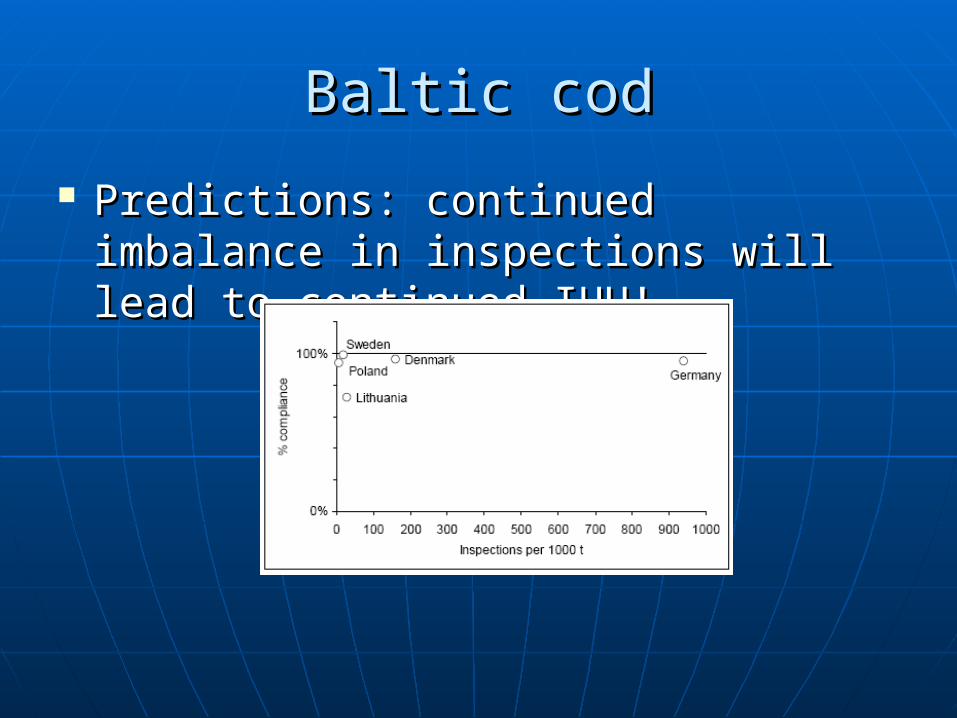
Baltic codBaltic cod
Predictions: continued imbalance in Predictions: continued imbalance in inspections will lead to continued inspections will lead to continued IUU!IUU!

Baltic cod –cost/benefit of JDPBaltic cod –cost/benefit of JDP Value of a JDP is the catch value accruing to legitimate vessels due to the elimination of Value of a JDP is the catch value accruing to legitimate vessels due to the elimination of
illegal (unreported) catches through better control in a JDPillegal (unreported) catches through better control in a JDP
Estimated JDP cost to the agency is €0.5 annually, included in these calculations.Estimated JDP cost to the agency is €0.5 annually, included in these calculations.
Improvements in compliance achieved byImprovements in compliance achieved by• Equalisation of inspections (current 17% imbalance: equalisation should reduce infringements from Equalisation of inspections (current 17% imbalance: equalisation should reduce infringements from
5% to 4% of inspections, i.e. reduction in IUU from 40% to 30%)5% to 4% of inspections, i.e. reduction in IUU from 40% to 30%)• Increasing inspections from 125/1000 tonnes to 175/1000 tonnes (reduce infringements from 5% Increasing inspections from 125/1000 tonnes to 175/1000 tonnes (reduce infringements from 5%
to 2.6%))to 2.6%))• Combined effect: IUU from 40% to 15%Combined effect: IUU from 40% to 15%

Answer 2: Cost benefit of a JDP – Answer 2: Cost benefit of a JDP – Baltic CodBaltic Cod
COST/BENEFIT OF THE ADDITIONAL COST OF A JDP
€ 0
€ 2,000,000
€ 4,000,000
€ 6,000,000
€ 8,000,000
€ 10,000,000
€ 12,000,000
€ 14,000,000
0 50 100 150 200 250
inspections / 1000 t cod
net
bene
fit o
f a
JDP
ove
r 5
year
s
Benefit of implementing a JDP (equalising inspections)retaining current levels of inspection.
optimum
inspection level --->
bene
fit (
incr
ease
s w
ith
com
plia
nce)
---
>
cost
(in
crea
ses
linea
rly)
--->
benefit from compliance cost of compliance
optimum
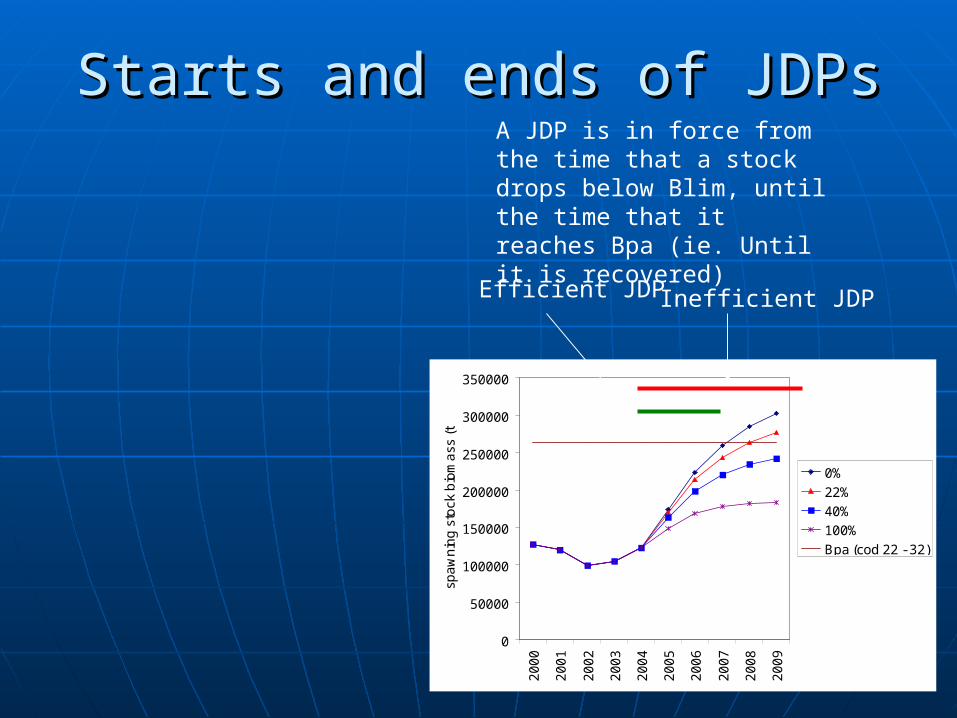
Starts and ends of JDPsStarts and ends of JDPs
0
50000
100000
150000
200000
250000
300000
350000
20
00
20
01
20
02
20
03
20
04
20
05
20
06
20
07
20
08
20
09
spa
wn
ing
sto
ck b
iom
ass
(t)
0%
22%
40%
100%
Bpa (cod 22 - 32)
A JDP is in force from the time that a stock drops below Blim, until the time that it reaches Bpa (ie. Until it is recovered)
Efficient JDP Inefficient JDP
Significant problemsSignificant problems
Quantifying relationshipsQuantifying relationships Predicting results of qualitative Predicting results of qualitative
improvementsimprovements• Baltic cod – real problem is Baltic cod – real problem is
ineffectiveness of Polish inspections, not ineffectiveness of Polish inspections, not just equalisationjust equalisation

Review of impacts of IUU Review of impacts of IUU fishing on developing country fishing on developing country
fisheriesfisheries
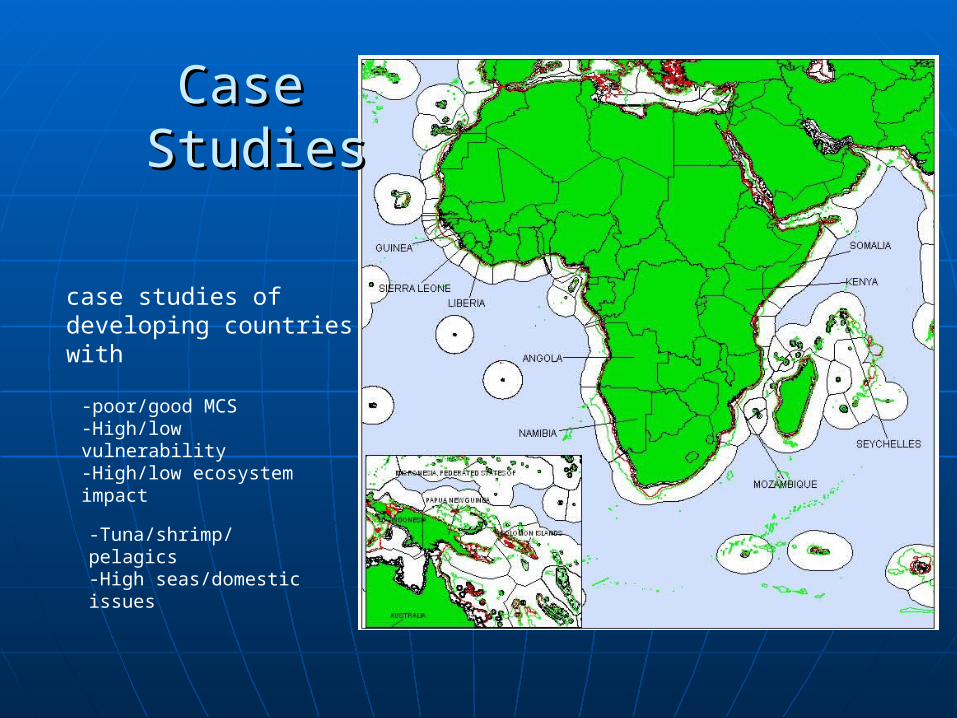
Case Case StudiesStudies
-poor/good MCS-High/low vulnerability-High/low ecosystem impact
-Tuna/shrimp/pelagics-High seas/domestic issues
case studies of developing countries with
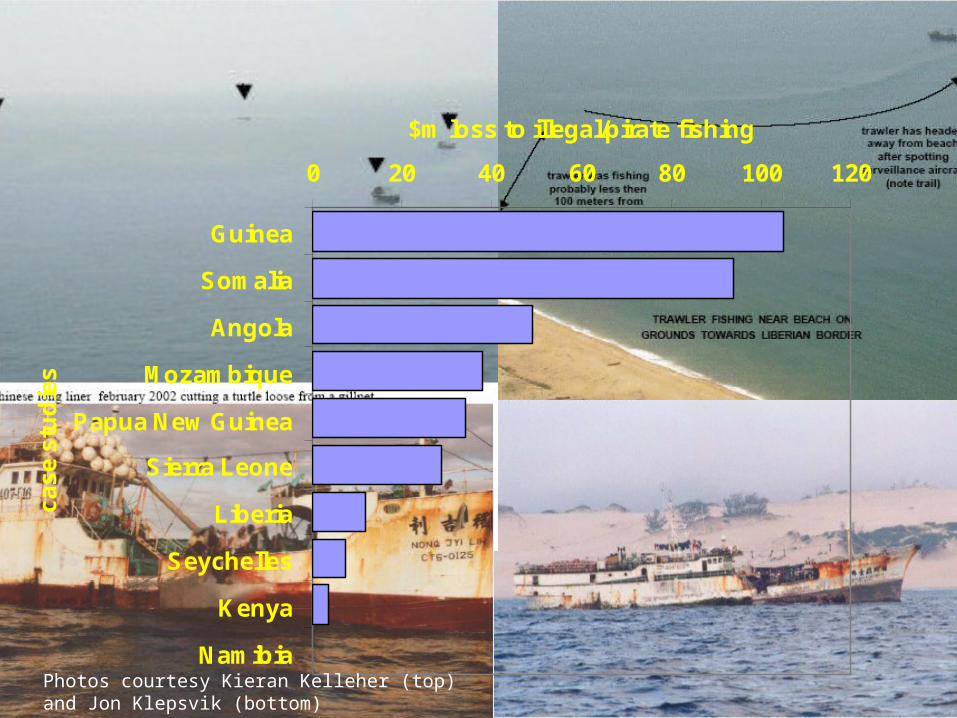
0 20 40 60 80 100 120
Namibia
Kenya
Seychelles
Liberia
Sierra Leone
Papua New Guinea
Mozambique
Angola
Somalia
Guinea
ca
se
stu
die
s
$m loss to illegal/pirate fishing
Photos courtesy Kieran Kelleher (top)and Jon Klepsvik (bottom)
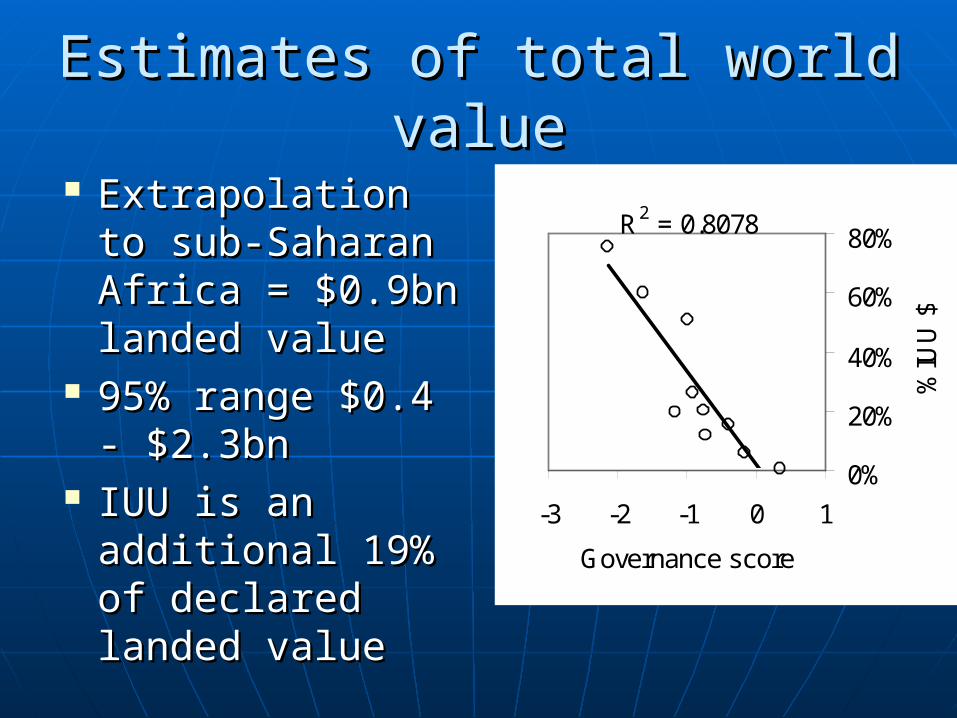
Estimates of total world valueEstimates of total world value
Extrapolation to Extrapolation to sub-Saharan sub-Saharan Africa = $0.9bn Africa = $0.9bn landed valuelanded value
95% range $0.4 - 95% range $0.4 - $2.3bn$2.3bn
IUU is an IUU is an additional 19% of additional 19% of declared landed declared landed valuevalue
R2 = 0.8078
0%
20%
40%
60%
80%
-3 -2 -1 0 1
Governance score
%IU
U $
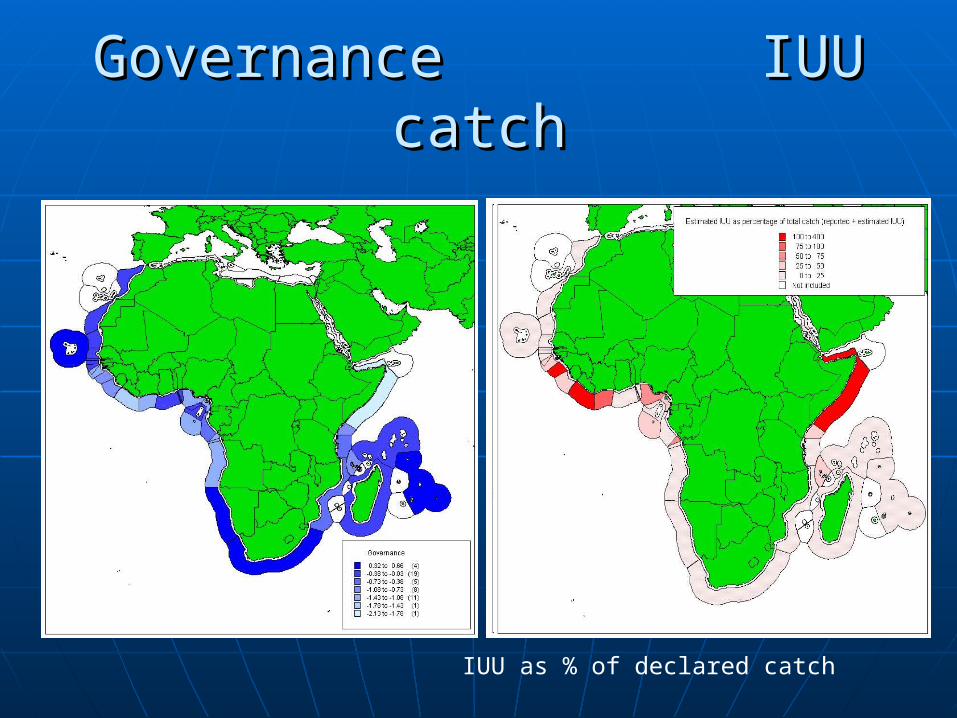
Governance IUU catchGovernance IUU catch
IUU as % of declared catch

Targeting Targeting resourcesresources
Country IUU as prop of FAO calculated totalIUU value potential increase based on %GNP to fisheries - outside calculationrank
Guinea 50% 105 0.9% 10Sierra Leone 37% 47 1.3% 6Liberia 71% 19 2.1% 2Angola 19% 49 0.8% 11Namibia 0% 0 0.0% 30Mozambique 19% 51 0.7% 12Kenya 20% 4 0.0% 29Somalia 75% 94 1.5% 4Seychelles 5% 8 1.0% 9Papa New Guinea 11% 34 0.1% 26
Morocco 9% 73 0.3% 21Mauritania 10% 21 1.2% 8Senegal 9% 40 0.2% 22Cape Verde 0% 0 0.0% 31Gambia 13% 3 1.5% 3Guinea-Bissau 32% 6 1.2% 7Cote D'Ivore 49% 48 0.4% 17Ghana 5% 15 0.1% 25Togo 35% 11 1.4% 5Benin 13% 2 0.1% 28Nigeria 43% 374 0.5% 15Cameroon 32% 17 0.3% 19Equatorial Guinea 41% 1 0.2% 23Sao Tome & Principe 13% 1 0.7% 13Gabon 18% 12 0.3% 20Congo 40% 18 0.5% 14DR Congo 59% 5 0.1% 27South Africa 0% 0 0.0% 32Madagascar 7% 18 0.5% 16Comoros 30% 10 4.6% 1Tanzania 18% 20 0.2% 24Eritrea 35% 7 0.3% 18Mauritius 0% 0 0.0% 33BIOT 25% 1112 0.0% 0Saint Helena & Ascension0% 0 0.0% 0Fisheries as % GDP