Embed Size (px)
Citation preview
Climatic Change (2013) 120:697–711DOI 10.1007/s10584-013-0840-2
Coasts, water levels, and climate change:A Great Lakes perspective
Andrew D. Gronewold · Vincent Fortin ·Brent Lofgren · Anne Clites · Craig A. Stow ·Frank Quinn
Received: 22 August 2012 / Accepted: 20 June 2013 / Published online: 1 August 2013© U.S. Government 2013
Abstract The North American Laurentian Great Lakes hold nearly 20 % of theearth’s unfrozen fresh surface water and have a length of coastline, and a coastalpopulation, comparable to frequently-studied marine coasts. The surface waterelevations of the Great Lakes, in particular, are an ideal metric for understandingimpacts of climate change on large hydrologic systems, and for assessing adaptionmeasures for absorbing those impacts. In light of the importance of the Great Lakesto the North American and global economies, the Great Lakes and the surroundingregion also serve as an important benchmark for hydroclimate research, and offeran example of successful adaptive management under changing climate conditions.Here, we communicate some of the important lessons to be learned from the GreatLakes by examining how the coastline, water level, and water budget dynamics of theGreat Lakes relate to other large coastal systems, along with implications for waterresource management strategies and climate scenario-derived projections of futureconditions. This improved understanding fills a critical gap in freshwater and marineglobal coastal research.
1 Introduction
Planning for expected changes in coastal water levels is essential for successfulclimate change adaptation. However, regional decision-making is hindered by un-certainties in down-scaled global projections (Kerr 2011; Willis and Church 2012).
A. D. Gronewold (B) · A. Clites · B. Lofgren · C. A. Stow · F. QuinnNOAA, Great Lakes Environmental Research Laboratory, Ann Arbor, MI, USAe-mail: [email protected]
V. FortinEnvironmental Numerical Weather Prediction Research Section,Meteorological Research Division, Environment Canada,Dorval, Quebec, Canada

698 Climatic Change (2013) 120:697–711
Coastal areas that have successfully withstood changing water levels, therefore,could provide guidance for ongoing planning in regions where uncertainty impedeseffective preparation (Nicholls et al. 1999; Holgate and Woodworth 2004; Willardand Bernhardt 2011). Since the 1930s, communities along the Laurentian GreatLakes coastline have endured both record high and low water levels. Experienceswith these pronounced fluctuations may offer useful perspectives for other coastalcommunities that must plan for uncertain water level changes (Keillor 1990).
The North American Laurentian Great Lakes (Fig. 1), collectively, have thelargest surface area (and second largest volume) of any unfrozen fresh surfacewater body on the planet (Table 1). The Great Lakes coastline along the UnitedStates (US) border (Fig. 2), approximately 4,500 miles long, is longer than the UScoastline along either the Atlantic Ocean, the Pacific Ocean, or the Gulf of Mexico(National Oceanic and Atmospheric Administration 1975). In addition to serving asa home and source of drinking water to over 30 million people (US EnvironmentalProtection Agency and Government of Canada 1995), the Great Lakes basin iscritically linked to the economic health of central North America by supporting abroad range of commercial, industrial, and recreational activities (Field et al. 2007).Buttle et al. (2004) and Millerd (2005), for example, underscore linkages between
Fig. 1 Map of the North American Laurentian Great Lakes including the Great Lakes drainagebasin (shaded in green), select cities and geographic boundaries, major tributaries, and interconnect-ing channels (source: U.S. Army Corps of Engineers, Detroit District)

Climatic Change (2013) 120:697–711 699
Table 1 Surface area and volume of the earth’s largest (by surface area) fresh surface water bodies(for details, see Herdendorf 1990; Lyons et al. 2010). Great Lakes water bodies are in bold font.Lakes Michigan and Huron are joined by the Straits of Mackinac and are therefore, from a large–scale hydrological perspective, typically viewed as a single system
Name Country Surface area Volume(km2) (km3)
Michigan–Huron U.S. and Canada 117,250 8,457Superior U.S. and Canada 82,100 12,230Victoria Multiple 68,460 2,700Tanganyika Multiple 32,900 18,900Baikal Russia 31,500 22,995Great Bear Lake Canada 31,326 2,381Malawi/Nyasa Multiple 29,400 7,720Great Slave Lake Canada 28,568 2,088Erie U.S. and Canada 25,657 483Winnipeg Canada 24,387 371Ontario U.S. and Canada 19,000 1,637
U.S. Great Lakes Coastline Comparison
Miles ofLake CoastlineLake Superior 1250Lake Michigan 1640Lake Huron 840Lake Erie 470Lake Ontario 330TOTAL 4530
Source: The Coastline of the United States. U.S. Dept.of Commerce, NOAA, NOAA/PA 71046 (Rev. 1975).
*All numbers rounded to the nearest 10 miles.
NA
TIO
NA
L O
CE
AN
IC AND ATMOSPHERIC AD
MIN
I STR
AT
ION
U.S. DEPARTMENT OF COMMERC
E Great Lakes Environmental Research LaboratoryGLERL
ATLANTIC = 2170
GULF OF MEXICO = 1630
PACIFIC = 1300
ALASKA/HAWAII = 6330
Fig. 2 Comparison between the length of Great Lakes and marine coastlines of the UnitedStates (from National Oceanic and Atmospheric Administration 1975). All distances are in miles(multiply by 1.61 to convert to kilometers). The green shaded area of the figure represents the GreatLakes drainage basin. The length of marine coastline is based on measurements collected by theNational Ocean Survey in 1915 and 1948 (‘general coastline’) using navigational charts and includesembayments, but does not account for tidal variability or offshore islands. Similarly, the Great Lakescoastline was measured in 1970 and includes connecting rivers and islands
700 Climatic Change (2013) 120:697–711
the Great Lakes and the regional shipping and hydropower industries, as well as thepotential impacts of changes in Great Lakes water levels on those industries. Theseand similar studies represent a growing body of literature that propagate historicaland potential future changes in regional climate, land use, and water resourcesmanagement practices into not just economic impacts, but into impacts on ecosystemservices, as well as human and environmental health (see, for example, Hartmann1990; Mortsch et al. 2000; Moulton and Cuthbert 2000).
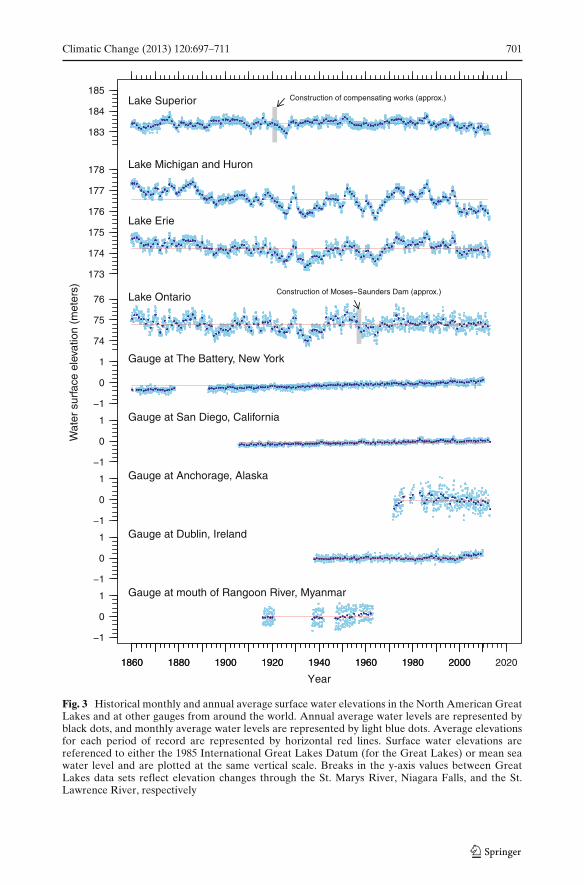
Great Lakes surface water elevation measurements (Fig. 3) are derived from aseries of shoreline gauging stations in both the US and Canada. Consequently, waterlevel assessments over different spatial and temporal scales require binational datacoordination. The precedent set by this collaborative effort is particularly significantto other large surface water bodies that share international borders (Table 1)but either do not have an extensive monitoring network, or operate networks asindependent nations. Specifically, the US gauge network in the Great Lakes wasestablished in the mid-1800s by the US Lake Survey District (also referred to asthe “Lake Survey”) of the Army Corps of Engineers, while the first use of multiplerecording Canadian gauges was initiated by the Department of Public Works in1906. The Great Lakes water level monitoring network is currently maintainedcollectively by the National Ocean Service (NOS) of the National Oceanic andAtmospheric Administration (NOAA) and by the Canadian Hydrographic Serviceof the Canadian Department of Fisheries and Oceans (Bunch 1970; CoordinatingCommittee on Great Lakes Basic Hydraulic and Hydrologic Data 1978; Woodford1991).
It is informative to recognize the magnitude of water level variability along theGreat Lakes coastline and how it compares to water level variability along othercoastlines. Each of the four Great Lake systems (Lakes Michigan and Huron have thesame long-term surface water elevation) fluctuate in response to multiple drivers (wedescribe these in greater detail in Section 2) across a range of temporal and spatialscales (Ghanbari and Bravo 2008; Hanrahan et al. 2009). Monthly, interannual, anddecadal Great Lakes coastal water level variability, for example (Fig. 3), is not onlyeither greater than, or comparable to, water level variability along other marinecoasts, but it is also documented in an unusually long and continuous record of mea-surements. In contrast to Great Lakes water levels, annual average water levelsat gauges in New York City (US), San Diego (US), and Dublin (Ireland) haveall experienced a gradual, approximately monotonic increase over the past severaldecades. Annual and monthly measurements at Anchorage (US) and at the mouthof the Rangoon River (Myanmar), while variable, are documented (Holgate et al.2012) in relatively short and discontinuous records relative to Great Lakes coastalwater level measurements.
Storm surges, tides, seiches, and other factors also influence both Great Lakes andmarine coastal water levels, but do so in different ways and at different temporalscales (for further discussion, see Donner 2012; Zhang and Church 2012). Forexample, intermittent storms on the Great Lakes can (particularly on Lake Erie, duein large part to its east-west orientation) lead to water level surges of a magnitudecomparable to tidal surges on marine coasts (Fig. 4), yet these storm-induced surgeson the Great Lakes are more challenging to predict (Schwab and Bedford 1994;Anderson et al. 2010). Hourly-scale Great Lakes water level dynamics can alsobe influenced by massive storms along the Atlantic Coast, as evidenced during
Climatic Change (2013) 120:697–711 701
Construction of compensating works (approx.)
Lake Superior
183
184
185
1860 1880 1900 1920 1940 1960 1980 2000 2020
Year
Wat
er s
urfa
ce e
leva
tion
(met
ers)
Lake Michigan and Huron
Lake Erie
173
174
175
176
177
178
1860 1880 1900 1920 1940 1960 1980 2000
Construction of Moses−Saunders Dam (approx.)
74
75
76 Lake Ontario
Gauge at The Battery, New York
−1
0
1
Gauge at San Diego, California
−1
0
1
Gauge at Anchorage, Alaska
−1
0
1
Gauge at Dublin, Ireland
−1
0
1
Gauge at mouth of Rangoon River, Myanmar
−1
0
1
Fig. 3 Historical monthly and annual average surface water elevations in the North American GreatLakes and at other gauges from around the world. Annual average water levels are represented byblack dots, and monthly average water levels are represented by light blue dots. Average elevationsfor each period of record are represented by horizontal red lines. Surface water elevations arereferenced to either the 1985 International Great Lakes Datum (for the Great Lakes) or mean seawater level and are plotted at the same vertical scale. Breaks in the y-axis values between GreatLakes data sets reflect elevation changes through the St. Marys River, Niagara Falls, and the St.Lawrence River, respectively

702 Climatic Change (2013) 120:697–711
172
174
176
178
HurricaneSandy
Fort Gratiot (Lake Huron)
Buffalo (Lake Erie)
Sur
face
wat
er e
lev.
(m
, IG
LD85
)
9 10 11 12 13 14 15 16 17 18 19 20 21 22 23 24 25 26 27 28 29 30 31 1 2 3 4 5 6 7 8 9
−2
−1
01
23
4
The Battery (New York)
Sur
face
wat
er e
lev.
(m
, MS
L)
October 2012 November 2012
Fig. 4 Times series of hourly water level gauge measurements from two gauges on the Great Lakes(top panel) and the gauge at The Battery (New York). The range of the vertical axis (6 m) is the samefor both panels
Hurricane Sandy (Fig. 4) when water levels at The Battery rose roughly 2–4 m, whilewater levels at the southern end of Lake Huron rose roughly 1–2 m. Aside from thefact that Hurricane Sandy was not centered over the Great Lakes, the surge in waterlevels on Lake Huron is intriguing because much of the water accumulating at FortGratiot was able to flow out of Lake Huron through the St. Clair River and (viaLake St. Clair and the Detroit River) into Lake Erie. Without this natural outlet, itis likely that the Hurricane Sandy-induced storm surge at Fort Gratiot would havebeen noticeably higher.
2 A Great Lakes perspective on drivers behind long-term coastal water levelvariability
Roughly one-third of the surface area of the Great Lakes basin is water and, becausethe Great Lakes are the largest fresh surface water on the planet, no similarly-sizedbasin has such a high proportion of surface water. More specifically, Lakes Victoria,Tanganyika, Baikal, and Malawi, for example (all of which reside in separate basins),each constitute between roughly 1 and 5 percent of their respective basin areas(Revenga et al. 1998; Lehner and Döll 2004). Consequently, unlike other large-lakesystems, the major components of the water budget (and the major drivers of surfacewater level dynamics) of the Great Lakes include overlake precipitation and overlakeevaporation, as well as land surface runoff. In addition to a long record of surfacewater elevation measurements, the Great Lakes region has a relatively long recordof these water budget components and other meteorological measurements as well

Climatic Change (2013) 120:697–711 703
Lake Superior
183
184
1860 1880 1900 1920 1940 1960 1980 2000
Year
Wat
er s
urfa
ce e
leva
tion
(met
ers)
600
1100
600
1100
600
1100
600
1100
Tota
l ann
ual b
asin
−w
ide
prec
ipita
tion
(mm
)
Lake Michigan and Huron
Lake Erie
173
174
175
176
177
178
1860 1880 1900 1920 1940 1960 1980 2000
74
75
76 Lake Ontario
Fig. 5 Historical gauge-based basin-wide precipitation estimates (in mm) for the North AmericanLaurentian Great Lakes and, for comparison, water level observations (for details, see Fig. 3).Green and orange bars represent annual basin-wide precipitation values (in mm) above and below(respectively) the average for the period of record
(Woodworth 1999; Ekman 1999). This historical record, synthesized in Quinn (1981)and Croley and Hunter (1994), underscores important linkages between changes inGreat Lakes regional climate, and how those changes propagate through changes inthe Great Lakes water budget and, ultimately, into changes in Great Lakes waterlevels.
Historical variability in annual basin-wide precipitation, for example, coincideswith annual water level fluctuations over much of the period of record (Fig. 5).Over the Lake Superior basin, annual precipitation follows a somewhat cyclicalpattern, with an increasing trend from the early 1900s toward the 1950s and 1960s,followed by a slight decreasing trend over the past 30 years. Water levels on LakeSuperior have followed a similar pattern. Precipitation over Michigan-Huron, Erie,and Ontario, however, has followed a different pattern, with annual averages since1970 consistently above the long-term average. While water levels on each of thesesystems rose significantly during the late 1960s and early 1970s, the water levels onthese systems also dropped significantly between 1997 and 2000 despite relativelystable annual precipitation (for further discussion, see Assel et al. 2004; Sellingeret al. 2007; Stow et al. 2008).
The drops in annual average water levels during the late 1990s do, however,coincide with significant increases in Great Lakes surface water temperatures (notshown) and overlake evaporation rates (Fig. 6). In particular, the steady increase in

704 Climatic Change (2013) 120:697–711
Lake Superior
183
184
1860 1880 1900 1920 1940 1960 1980 2000
Year
Wat
er s
urfa
ce e
leva
tion
(met
ers)
500
900
500
900
800
1100
500
900
Tota
l ann
ual o
ver−
lake
eva
pora
tion
(mm
)
Lake Michigan and Huron
Lake Erie
173
174
175
176
177
178
1860 1880 1900 1920 1940 1960 1980 2000
74
75
76 Lake Ontario
Fig. 6 Simulated annual overlake evaporation (in mm) based on Croley (1992) and Croley andAssel (1994) and historical annual lake-wide average water levels. Orange vertical bars representannual evaporation rates greater than the average over the simulation period (1948–2010), whilegreen vertical bars represent annual evaporation rates below the average
overlake evaporation over each of the lake systems for the past 50 years synthesizeslong-term changes in multiple regional climate variables including, most notably,the difference between air and surface water temperature (for details, see Austinand Colman 2007) as well as the decreasing areal extent and thickness of lake ice(Wang et al. 2010, 2012). In light of these changes, and of the recently recorded(January 2013) all-time record low water levels on Lake Michigan-Huron, one ofthe more challenging research questions facing the Great Lakes region at present is,“will water levels rebound, or have we entered a new hydrologic regime?” Responsesto this question depend, in part, on forecasts of regional climate variables, and ap-propriate interpretation of how those forecasts propagate into water level dynamics.Interpretation of these forecasts depends, in turn, on the context in which they arepresented. Importantly, this context rarely includes a comparison between historicalforecasts and data from the same period of record. This comparison is important, aswe discuss further in Section 3, because it provides an indication of model forecastingskill (Gronewold et al. 2011).
2.1 Great Lakes basin precipitation and evaporation monitoring
Basin-wide annual precipitation totals (Fig. 5) are derived from a network of land-based gauges in the US and Canada (using a methodology described in Croley

Climatic Change (2013) 120:697–711 705
and Hartmann 1985) that has evolved over time. Additional potential sources ofprecipitation data and model simulations for the Great Lakes region include satelliteimagery (Augustine et al. 1994), radar and combined radar and gauge-based products(Wilson 1977; Watkins Jr et al. 2007), and other reconstructed datasets including,most notably, the North American regional reanalysis, as described in Mesinger et al.(2006). Each of these sources could lead to a different representation of precipitationpatterns in Fig. 5, yet none of these relatively new analysis tools extrapolate precipi-tation estimates for the Great Lakes basin over the entire period of record for whichdirect (i.e. gauge-based) measurements are available. As indicated in Holman et al.(2012) and Gronewold et al. (2013), we view extending these new tools over therelatively long period of record for direct gauge-based measurements as a potentialarea for future research.
Historical Great Lakes surface water evaporation estimates (Fig. 6), in contrast,are based primarily on model simulations (Croley 1989; Croley and Assel 1994), inpart because direct measurements of the energy budget over the Great Lakes (and,subsequently, of evaporative loss) had not been collected until roughly five yearsago (Spence et al. 2011). Thus, while simulations of overlake evaporation provideimportant insights into potential causes of recent changes in Great Lakes waterlevels, they also underscore the critical need for supplementing model simulationswith additional monitoring. A robust evaporation monitoring infrastructure wouldnot only contribute to an improved historical record, but would also provide a basisfor calibrating, and improving forecasts from, models that simulate and forecast thewater budget and water levels of the Great Lakes (Gronewold et al. 2011; Gronewoldand Fortin 2012).
2.2 Other factors influencing Great Lakes water levels
Water level measurements are affected by several extrinsic factors that need tobe recognized in water level assessments and in the interpretation of historicalwater level data. Glacial isostatic rebound, which refers to ongoing changes inground surface elevation following the release of pressure from retreating glaciers(for details, see Mainville and Craymer 2005), is one example. Importantly, landsurface elevation changes that exceed the rate of elevation change at a lakeoutlet, known as differential glacial isostatic rebound, can be perceived as achange in water surface elevation. For example, relative to the outlet of LakeSuperior at Point Iroquois (Michigan), the shoreline at Duluth (Minnesota) isfalling at a rate of roughly 25 cm per 100 years, while the shoreline at Rossport,Ontario (the northern shore of Lake Superior) is rising at a rate of roughly 30 cm per100 years (Mainville and Craymer 2005). Assessments of long-term trends in GreatLakes water levels and water level forecasts must acknowledge that isostatic reboundis altering the Great Lakes coastline, and the studies that document this accountingprovide yet another basis for applying coastal water resource management practicesfrom the Great Lakes to other coastal systems.
Outflow regulations on Lakes Superior and Ontario also influence water leveldynamics, though to a lesser extent than the changes induced through the regionalclimate patterns. Regulation of Lake Ontario outflows, for example, is visually ap-parent in the time series data (Fig. 3) with sustained deviations from the overall meanbecoming infrequent after 1960. In contrast, regulation of Lake Superior (beginning

706 Climatic Change (2013) 120:697–711
in the early 1920s) is visually difficult to discern; despite regulation, water levelsin Superior reached a near-record high in 1986 and a near-record low in 2007. Toput these changes into perspective, ever since water levels in Lakes Superior andOntario have been regulated, the ranges of their annual averages (0.8 m and 0.9 m,respectively) have still exceeded the range of annual averages (0.5 m) experiencedat the Battery over the entire period of record. Additionally, the largest annualrise (<0.1 m) and fall (<0.1 m) recorded at the Battery is considerably less thanthe annual rise (0.5 m) and fall (0.5 m) that the Lake Michigan-Huron systemexperienced in nearly successive years (1927 and 1929).
3 Communicating climate change impacts on coastal water levels
Over the past 30 years, numerous studies have projected changes in the GreatLakes water budget under alternative climate scenarios (see, for example, Bruce1984; Cohen 1986; Croley 1990). The methodology pioneered by Croley (1990), inparticular, hereafter referred to as an “off-line” hydrological model, projected futurechanges in lake levels associated with changes in anthropogenic greenhouse gases.These changes, represented primarily by changes in precipitation and air temper-ature, were propagated through a cascade of lake thermodynamics (Croley 1989)and rainfall-runoff (Croley 2002) models to project the overall water budget of theGreat Lakes basin and, ultimately, water levels (Croley 2003). This suite of models iscollectively referred to as the Great Lakes Advanced Hydrologic Prediction System(or AHPS, as described in Gronewold et al. 2011). We refer to most of these modelsas “off-line” because their output is not fed back into the models that simulateprecipitation and temperature when, in reality, processes over the lakes themselvesdo have an influence on these regional drivers. Models that explicitly acknowledgethis feedback loop are often referred to as “coupled”.
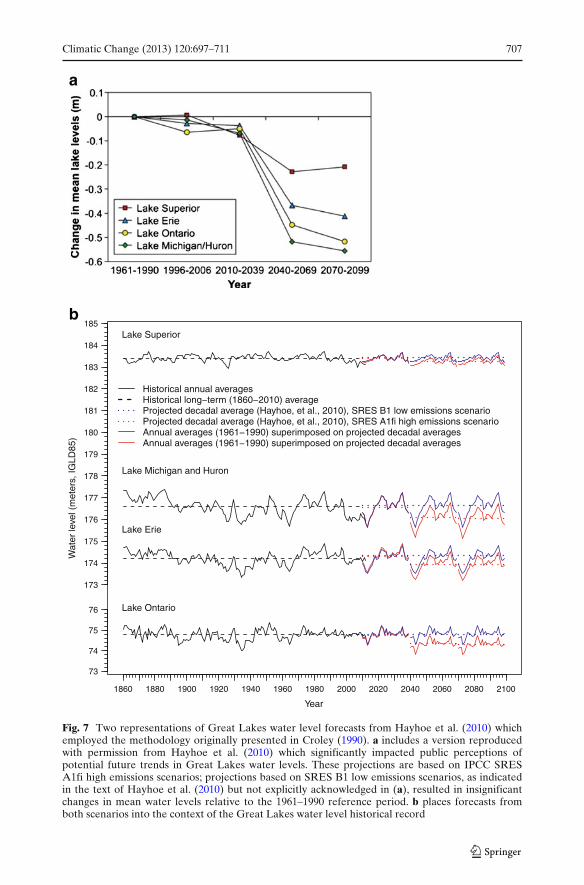
Of particular importance is the use of the Croley (1990) methodology in numerousfollow-on studies (Lofgren et al. 2002; Angel and Kunkel 2010; Hayhoe et al. 2010) toproject Great Lakes water levels using several general circulation models (GCMs) ofglobal climate as input. While the magnitude of projected water level change in eachof these studies differs depending on the GCM input, most projected drops in lakelevels, in many cases very large drops (Fig. 7a). These studies have been both widelyreported (Hartmann 1990; Changnon 1993; Magnuson et al. 1997) and used in manyprojections of climate change effects on the Great Lakes (Hobbs et al. 1997; Mortsch1998; Schwartz et al. 2004; Millerd 2011). Consequently, the notion that lower waterlevels will accompany future climate change is ingrained throughout the Great Lakesregion. Importantly, the use of multiple GCM simulations as input (Angel andKunkel 2010) has created the perception of independent verification of these results.However, the underlying hydrologic models and method of forcing them remainedthe same throughout all of these projections. Furthermore, these studies do notprovide a clear indication of the baseline water levels, nor do they offer reference tothe historical water level record as a context for these projections. Doing so (Fig. 7b)impacts perceptions of the relative magnitude of future water level changes and theextent to which those changes should guide water resource management planningdecisions relative to intrinsic interannual water level variability.
Climatic Change (2013) 120:697–711 707
Lake Superior
Lake Michigan and Huron
Lake Erie
Historical annual averagesHistorical long−term (1860−2010) averageProjected decadal average (Hayhoe, et al., 2010), SRES B1 low emissions scenarioProjected decadal average (Hayhoe, et al., 2010), SRES A1fi high emissions scenarioAnnual averages (1961−1990) superimposed on projected decadal averagesAnnual averages (1961−1990) superimposed on projected decadal averages
173
174
175
176
177
178
179
180
181
182
183
184
185
1860 1880 1900 1920 1940 1960 1980 2000 2020 2040 2060 2080 2100
Year
Wat
er le
vel (
met
ers,
IGLD
85)
73
74
75
76 Lake Ontario
a
b
Fig. 7 Two representations of Great Lakes water level forecasts from Hayhoe et al. (2010) whichemployed the methodology originally presented in Croley (1990). a includes a version reproducedwith permission from Hayhoe et al. (2010) which significantly impacted public perceptions ofpotential future trends in Great Lakes water levels. These projections are based on IPCC SRESA1fi high emissions scenarios; projections based on SRES B1 low emissions scenarios, as indicatedin the text of Hayhoe et al. (2010) but not explicitly acknowledged in (a), resulted in insignificantchanges in mean water levels relative to the 1961–1990 reference period. b places forecasts fromboth scenarios into the context of the Great Lakes water level historical record

708 Climatic Change (2013) 120:697–711
3.1 Note on advancements in Great Lakes climate-scale water level forecasting
Interestingly, there are numerous published projections of the Great Lakes waterbudget that do not employ “off-line” hydrologic models to project the Great Lakeswater budget. Manabe et al. (2004), Kutzbach et al. (2005), and Milly et al. (2005), forexample, all use relatively novel modeling tools which project increases in either theatmospheric moisture convergence or the net outflow from the Great Lakes basin.These are metrics that, in the long term, are equivalent to net basin supply, and nec-essarily imply rises in lake levels. However, because these (and similar) studies didnot propagate water budget projections explicitly into lake levels, their results gath-ered relatively little attention in both the regional research community and GreatLakes water level impacts assessments.
To resolve this gap in regional research, Lofgren et al. (2011) presented acritical assessment of the modeling approach originating in Croley (1990), lookingparticularly at the implications of alternative expressions of the energy budget of thesurface. They found that the surface energy budget implied in the land portions ofthe basin under the method of Croley (1990) differed substantially from the surfaceenergy budget of the GCMs that were driving the “off-line” hydrologic model. Putdifferently, the methods of Bruce (1984), Cohen (1986), and Croley (1990), whichall used air temperature as a proxy for potential evapotranspiration, projected largeincreases in evapotranspiration. As noted in Lofgren et al. (2011), however, GCMsimulations indicate that the energy required to support this magnitude of evapotran-spiration will likely not be available in the future, and that conventional approaches(i.e. those which employ “off-line” hydrological models) introduce inconsistenciesbetween these two components (i.e. energy and evapotranspiration) of the overallprojection (for further discussion, see Milly and Dunne 2011). Finally, Lofgren et al.(2011) proposed an alternate method with greater fidelity to the surface energybudget of the GCMs resulting in future water level scenarios ranging from smallerdecreases than those published previously to increases in projected water levels.
4 Concluding remarks
The Great Lakes comprise a large coastal system which continuously experiencesinterannual water levels increases and decreases that are of a greater magnitudethan the changes experienced by many marine coastal systems over the past century.Intrinsic dynamics of the Great Lakes and the Great Lakes regional climate haverequired a large proportion of the North American population to adapt to the typeof coastal water level variability projected for marine coasts over the next century.
The Great Lakes system includes two countries, two provinces, tribal nationals,and eight states with a focal point being the International Joint Commission betweenthe US and Canada. There is a long history of joint water resource managementincluding the regulation of Lakes Superior and Ontario and the diversion of watersinto and out of the lakes for public health, water supply, hydro-power, and naviga-tion. Over the last ten years, there has also been an effort to include environmentalimpacts in lake regulation. A current emphasis is to include climate change and vari-ability into developing adaptive management for both Lakes Superior and Ontario.This requires not only the existing long hydro-climate data base and the maintenance

Climatic Change (2013) 120:697–711 709
of the current monitoring infrastructure, but also a robust hydro-climate researchprogram. Research is necessary to examine and adapt to the impact of potentialclimate scenarios and to explain current climate surprises and their impact on waterresources.
Acknowledgements This paper is GLERL contribution number 1635. The authors thank ErikaWashburn and Bryan Comer, as well as two anonymous reviewers who, along with the handlingeditor, provided helpful comments which improved the clarity of the paper. Funding for this researchwas provided by the Great Lakes Restoration Initiative (GLRI) and the International Upper GreatLakes Study (IUGLS). We also thank Cathy Darnell for providing graphics and editorial support.
References
Anderson EJ, Schwab DJ, Lang GA (2010) Real-time hydraulic and hydrodynamic model of the St.Clair River, Lake St. Clair, Detroit River system. J Hydraul Eng 136(8):507–518
Angel J, Kunkel K (2010) The response of Great Lakes water levels to future climate scenarios withan emphasis on Lake Michigan-Huron. J Great Lakes Res 36:51–58
Assel R, Quinn F, Sellinger C (2004) Hydroclimatic factors of the recent record drop in LaurentianGreat Lakes water levels. Bull Am Meteorol Soc 85(8):1143–1151
Augustine J, Woodley W, Scott R, Changnon S (1994) Using geosynchronous satellite imagery toestimate summer-season rainfall over the Great Lakes. J Great Lakes Res 20(4):683–700
Austin JA, Colman SM (2007) Lake Superior summer water temperatures are increasing morerapidly than regional air temperatures: a positive ice-albedo feedback. Geophys Res Lett34(6):L06604
Bruce JP (1984) Great Lakes levels and flows: past and future. J Great Lakes Res 10(2):126–134Bunch J (1970) Mission of US Lake survey. Journal of the Surveying and Mapping Division
96(2):181–189Buttle J, Muir T, Frain J (2004) Economic impacts of climate change on the Canadian Great Lakes
hydro-electric power producers: a supply analysis. Can Water Resour J 29(2):89–110Changnon S (1993) Changes in climate and levels of Lake Michigan: shoreline impacts at Chicago.
Clim Chang 23(3):213–230Cohen SJ (1986) Impacts of CO2-induced climatic change on water resources in the Great Lakes
basin. Clim Chang 8(2):135–153Coordinating Committee on Great Lakes Basic Hydraulic and Hydrologic Data (1978) History of
water level gauges. Upper Great Lakes and the St. Clair - Detroit Rivers. Tech. rep., Chicago, ILand Cornwall, Ontario
Croley T (1989) Verifiable evaporation modeling on the Laurentian Great Lakes. Water Resour Res25(5):781–792
Croley T (1990) Laurentian Great Lakes double-CO2 climate change hydrological impacts. ClimChang 17(1):27–47
Croley T (1992) Long-term heat storage in the Great Lakes. Water Resour Res 28(1):69–81Croley T (2002) Large basin runoff model, chap 17. In: Singh V, Frevert D, Meyer S (eds) Mathe-
matical models of large watershed hydrology, pp 717–770Croley T (2003) Weighted-climate parametric hydrologic forecasting. J Hydrol Eng 8:171Croley T, Assel R (1994) A one-dimensional ice thermodynamics model for the Laurentian Great
Lakes. Water Resour Res 30(3):625–639Croley T, Hunter T (1994) Great Lakes monthly hydrologic data: Technical Memorandum 083. US
Dept. of Commerce, National Oceanic and Atmospheric Administration, Great Lakes Environ-mental Research Laboratory
Croley TE, Hartmann HC (1985) Resolving Thiessen polygons. J Hydrol 76(3–4):363–379Donner S (2012) Sea level rise and the ongoing Battle of Tarawa. Eos, Trans Am Geophys Union
93(17):169Ekman M (1999) Climate changes detected through the world’s longest sea level series. Global Planet
Chang 21(4):215–224Field C, Mortsch L, Brklacich M, Forbes D, Kovacs P, Patz J, Running S, Scott M (2007) North
America. In: Parry ML, Canziani OF, Palutikof JP, PJ van der Linden, Hanson CE (eds)Climate change 2007: impacts, adaptation and vulnerability. Contribution of working group II

710 Climatic Change (2013) 120:697–711
to the fourth assessment report of the intergovernmental panel on climate change. CambridgeUniversity Press, Cambridge, UK
Ghanbari R, Bravo H (2008) Coherence between atmospheric teleconnections, Great Lakes waterlevels, and regional climate. Adv Water Resour 31(10):1284–1298
Gronewold AD, Fortin V (2012) Advancing Great Lakes hydrological science through targetedbinational collaborative research. Bull Am Meteorol Soc 93(12):1921–1925
Gronewold AD, Clites A, Hunter T, Stow C (2011) An appraisal of the Great Lakes advancedhydrologic prediction system. J Great Lakes Res 37:577–583
Gronewold AD, Stow CA, Crooks JL, Hunter TS (2013) Quantifying parameter uncertainty andassessing the skill of exponential dispersion rainfall simulation models. Int J Climatol 33(3):746–757
Hanrahan J, Kravtsov S, Roebber P (2009) Quasi-periodic decadal cycles in levels of lakes Michiganand Huron. J Great Lakes Res 35(1):30–35
Hartmann HC (1990) Climate change impacts on Laurentian Great Lakes levels. Clim Chang17(1):49–67
Hayhoe K, VanDorn J, Croley T, Schlegal N, Wuebbles D (2010) Regional climate change projec-tions for Chicago and the US Great Lakes. J Great Lakes Res 36:7–21
Herdendorf CE (1990) Distribution of the world’s large lakes. Springer-VerlagHobbs B, Chao P, Venkatesh B (1997) Using decision analysis to include climate change in water
resources decision making. Clim Chang 37(1):177–202Holgate S, Woodworth P (2004) Evidence for enhanced coastal sea level rise during the 1990s.
Geophys Res Lett 31(7):L07, 305Holgate SJ, Matthews A, Woodworth PL, Rickards LJ, Tamisiea ME, Bradshaw E, Foden PR,
Gordon KM, Jevrejeva S, Pugh J (2012) New data systems and products at the permanent servicefor mean sea level. J Coast Res 29(3):493–504
Holman K, Gronewold A, Notaro M, Zarrin A (2012) Improving historical precipitation estimatesover the Lake Superior basin. Geophys Res Lett 39(3):L03, 405
Keillor J (1990) Planning for a wider range of water levels along Great Lakes and ocean coasts. CoastManag 18(1):91–103
Kerr R (2011) Vital details of global warming are eluding forecasters. Science 334(6053):173–174
Kutzbach JE, Williams JW, Vavrus SJ (2005) Simulated 21st century changes in regional waterbalance of the Great Lakes region and links to changes in global temperature and polewardmoisture transport. Geophys Res Lett 32:L17, 707
Lehner B, Döll P (2004) Development and validation of a global database of lakes, reservoirs andwetlands. J Hydrol 296(1):1–22
Lofgren B, Quinn F, Clites A, Assel R, Eberhardt A, Luukkonen C (2002) Evaluation of potentialimpacts on Great Lakes water resources based on climate scenarios of two GCMs. J Great LakesRes 28(4):537–554
Lofgren BM, Hunter TS, Wilbarger J (2011) Effects of using air temperature as a proxy for potentialevapotranspiration in climate change scenarios of Great Lakes basin hydrology. J Great LakesRes 37(4):744–752
Lyons R, Kroll C, Scholz C (2010) An energy-balance hydrologic model for the Lake Malawi RiftBasin, East Africa. Glob Planet Chang 75(1–2):83–97
Magnuson J, Webster K, Assel R, Bowser C, Dillon P, Eaton J, Evans H, Fee E, Hall R, Mortsch L,et al (1997) Potential effects of climate changes on aquatic systems: Laurentian Great Lakes andPrecambrian Shield Region. Hydrol Process 11(8):825–871
Mainville A, Craymer M (2005) Present-day tilting of the Great Lakes region based on water levelgauges. Geol Soc Am Bull 117(7–8):1070–1080
Manabe S, Wetherald R, Milly P, Delworth T, Stouffer R (2004) Century-scale change in wateravailability: CO2-quadrupling experiment. Clim Chang 64(1):59–76
Mesinger F, DiMego G, Kalnay E, Mitchell K, Shafran P, Ebisuzaki W, Jovic D, Woollen J, RogersE, Berbery E, et al (2006) North American regional reanalysis. Bull Am Meteorol Soc 87(3):343–360
Millerd F (2005) The economic impact of climate change on Canadian commercial navigation on theGreat Lakes. Can Water Resour J 30(4):269–280
Millerd F (2011) The potential impacts of climate change on Great Lakes international shipping.Clim Chang 104:629–652
Milly P, Dunne K (2011) On the hydrologic adjustment of climate-model projections: the potentialpitfall of potential evapotranspiration. Earth Interact 15(1):1–14

Climatic Change (2013) 120:697–711 711
Milly P, Dunne K, Vecchia A (2005) Global pattern of trends in streamflow and water availability ina changing climate. Nature 438(7066):347–350
Mortsch L (1998) Assessing the impact of climate change on the great lakes shoreline wetlands. ClimChang 40(2):391–416
Mortsch L, Hengeveld H, Lister M, Lofgren B, Quinn F, Slivitzky M, Wenger L (2000) Climatechange impacts on the hydrology of the Great Lakes-St. Lawrence system. Can Water Resour J25(2):153–179
Moulton RJ, Cuthbert DR (2000) Cumulative impacts/risk assessment of water removal or loss fromthe Great Lakes-St. Lawrence River system. Can Water Resour J 25(2):181–208
National Oceanic and Atmospheric Administration (1975) The coastline of the United States. Tech.Rep. NOAA/PA 71046 (Rev. 1975)
Nicholls RJ, Hoozemans FM, Marchand M (1999) Increasing flood risk and wetland losses due toglobal sea-level rise: regional and global analyses. Global Environ Chang 9:S69–S87
Quinn F (1981) Secular changes in annual and seasonal Great Lakes precipitation, 1854–1979, andtheir implications for Great Lakes water resource studies. Water Resour Res 17(6):1619–1624
Revenga C, Murray S, Abramovitz J, Hammond A, et al (1998) Watersheds of the world: ecologicalvalue and vulnerability. World Resources Institute
Schwab DJ, Bedford K (1994) Initial implementation of the Great Lakes forecasting system: areal-time system for predicting lake circulation and thermal structure. Water Pollut Res J Can29(2–3):203–220
Schwartz R, Deadman P, Scott D, Mortsch L (2004) Modeling the impacts of water level changes ona Great Lakes community. J Am Water Resour Assoc 40(3):647–662
Sellinger CE, Stow CA, Lamon EC, Qian SS (2007) Recent water level declines in the LakeMichigan-Huron system. Environ Sci Technol 42(2):367–373
Spence C, Blanken P, Hedstrom N, Fortin V, Wilson H (2011) Evaporation from Lake Superior: 2:spatial distribution and variability. J Great Lakes Res 37(4):717–724
Stow CA, Lamon E, Kratz T, Sellinger C (2008) Lake level coherence supports common driver. Eos,Trans Am Geophys Union 89(41):389
US Environmental Protection Agency, Government of Canada (1995) The Great Lakes: an envi-ronmental atlas and resource book. Great Lakes National Program Office, US EnvironmentalProtection Agency
Wang J, Bai X, Leshkevich G, Colton M, Clites A, Lofgren B (2010) Severe ice cover on Great Lakesduring winter 2008–2009. EOS 91(5):41–42
Wang J, Bai X, Hu H, Clites A, Colton M, Lofgren B (2012) Temporal and spatial variability ofGreat Lakes ice cover, 1973–2010. J Clim 25:1318–1329. doi:10.1175/2011JCLI4066.1
Watkins Jr D, Li H, Cowden J (2007) Adjustment of radar-based precipitation estimates for greatlakes hydrologic modeling. J Hydrol Eng 12:298
Willard DA, Bernhardt CE (2011) Impacts of past climate and sea level change on Evergladeswetlands: placing a century of anthropogenic change into a late-Holocene context. Clim Chang107(1–2):59–80
Willis J, Church J (2012) Regional sea-level projection. Science 336(6081):550–551Wilson J (1977) Effect of Lake Ontario on precipitation. Mon Weather Rev 105:207–214Woodford A (1991) Charting the inland seas: a history of the US Lake Survey. Wayne State Univ PrWoodworth P (1999) High waters at Liverpool since 1768: the UK’s longest sea level record. Geophys
Res Lett 26(11):1589–1592Zhang X, Church JA (2012) Sea level trends, interannual and decadal variability in the Pacific Ocean.
Geophys Res Lett 39(21):L21701