Embed Size (px)
Citation preview
COASTLINE CHANGE ANALYSIS USING RTK-GPS AND AERIAL PHOTO
Kim, Yong Suk a ·* Lee, Dong Min a · Hong, Soon Heon b · Chung, Chang Sik c · Lee, Kang Won d
a Dong-A University in South Korea b Pusan National University in South Korea
c Dong-Eui University in South Korea d Hanjin Information Systems & Telecommunication Co., Ltd. in South Korea
Commission VI WGs, WG VIII/6
KEY WORDS: Coastline, RTK-GPS, Qualitative analysis, Time series analysis ABSTRACT: According to the survey data during the Japanese Occupation Period, the length of South Korea's coastline is about 11,542km, including the coastlines of mainland and islands. To accurately revise/renew this coastline data through site survey, it will cost great money and time. Also, various development projects such as reclamation works on public waters, constructions of ports/harbors, etc. This paper used aerial photographs, satellite image data and GPS survey data with certain intervals to monitor the change in coastal areas of Songjeong, Haeundae, Kwanganri, Songdo and Dadaepo. The local area subjected for this research was limited to areas near Busan. The specific contents of this research include. Launching qualitative/time series analyses on the change of coastal areas using aerial photographs, satellite image data and RTK-GPS surveys.
* Corresponding author. Lee, Dong Min (E-mail: [email protected])
1. INTRODUCTION
It is the coastal area where the shape and property is constantly changed by natural and artificial behavior. But the data of most coastal area which korea possesses were so insignificant so we have been still using the surveying result from the Japanese Occupation Period. It is not only difficult that the existing coastal examination and the way of surveying gets us the exact date through the ground investigation of control point surveying , leveling , bathymetry , topographic surveying , tidal surveying , geological investigation , geographical investigation. Recently so as to solve the problem, Lidar is applied in even oceanic surveying field and then the information of the present circumstances is being built. Yet, the date-making of variable analysis for long term and topography analysis has to be accompanied by at the information net and untility of coastal area, but the research is still not enough in this field. As the study of the coastal variation sloop studied cusp and the coastal variation cross Florida seashore, USA in 1995. Gutierrez conducted the study considering the estimation of coastal settlement and brittle area before and after a storm in the use of Lidar data in 2001. And T. Kajimura conducted the study as to long-term seaside process revising the shrinkage and rotation of aerial photography in the using LSQ in 2001. Chen studied in abstracting coastline using the SPOT image of various periods for observing the tidal coastal variation in 1998. Thus the coastal variables for Pusan seaside areas on the basis of the exact information of the coastal areas and the reorganization of the seashore are analyzed in this study. The purpose of this study is that first the seashore is abstracted in various ways, second the coastal variables through qualitative and time series analysis are analyzed.
2. THE DEFINITION AND RANGE OF THE SEASHORE
2.1 The definition of seashore
The coastal date-making is chosen on the basis of related legal definition, the date are made according to the chosen items. As the international / national law and regulation related in the coast definition, there are the coast management laws, diagram application regulation of NGI , waterway task law. It is defined like below 2.1.1 The coast management laws: Indirect way to suggest consists of both the coastal area and coastal land, the coastal area is defined "from high water level to the coastal area enrolled in coastal records and from high water level to outer line seashore of the territorial waters." That is, high water level is defined as the seaside at the coast management laws ( no. 5913 ). 2.1.2 Regulation of NIS: Water open is defined that details of the water which is stayed underground like a river, a seaside when being high water level various kind display items of the coast and its subordinates are included Article 98. That is, the coast is defined as both the boundary between sea and ground and the water side line of high water level. 2.1.3 hydrographic working law: At the hydrographic working law Article 5 "Elevation is the height of average sea surface, the depth of water is the depth of standard level surface and we can put a mark of the rock which covers and uncovers as the height from standard level surface, the coast is marked as the boundary between sea and ground when being at the approx.h.h.w of surface." it is defined that.
689
The International Archives of the Photogrammetry, Remote Sensing and Spatial Information Sciences. Vol. XXXVII. Part B8. Beijing 2008
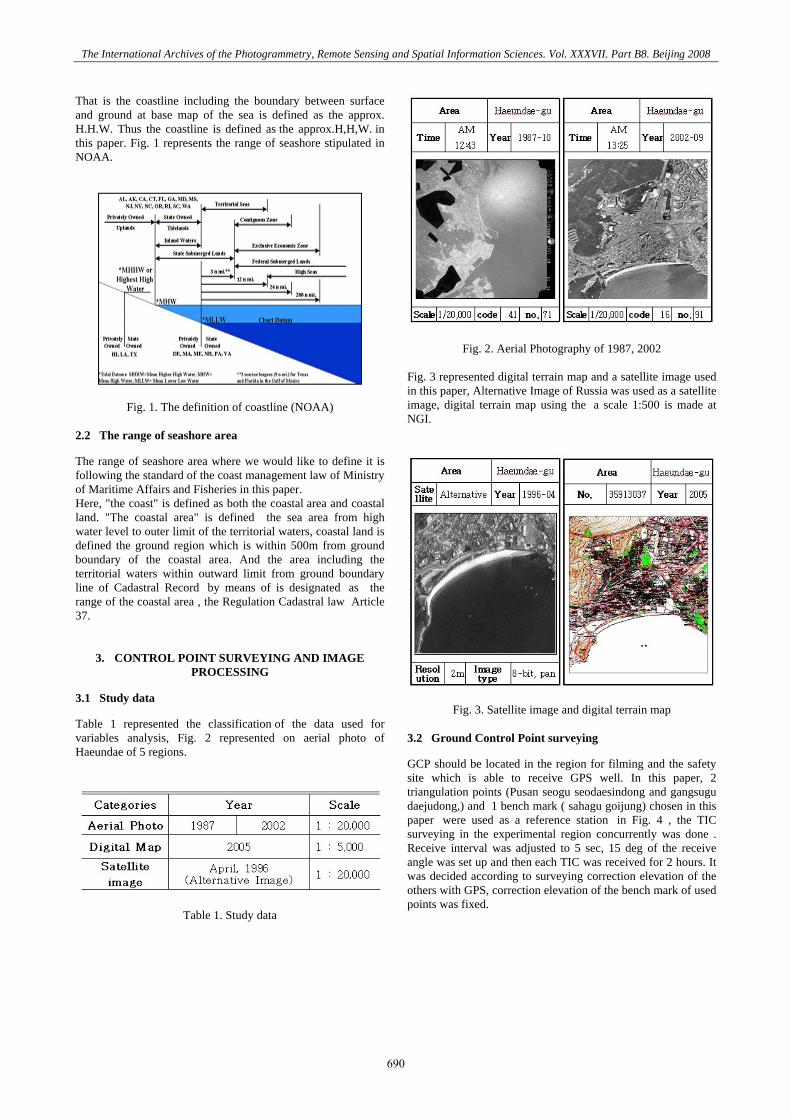
That is the coastline including the boundary between surface and ground at base map of the sea is defined as the approx. H.H.W. Thus the coastline is defined as the approx.H,H,W. in this paper. Fig. 1 represents the range of seashore stipulated in NOAA.
Fig. 1. The definition of coastline (NOAA) 2.2 The range of seashore area
The range of seashore area where we would like to define it is following the standard of the coast management law of Ministry of Maritime Affairs and Fisheries in this paper. Here, "the coast" is defined as both the coastal area and coastal land. "The coastal area" is defined the sea area from high water level to outer limit of the territorial waters, coastal land is defined the ground region which is within 500m from ground boundary of the coastal area. And the area including the territorial waters within outward limit from ground boundary line of Cadastral Record by means of is designated as the range of the coastal area , the Regulation Cadastral law Article 37.
3. CONTROL POINT SURVEYING AND IMAGE PROCESSING
3.1 Study data
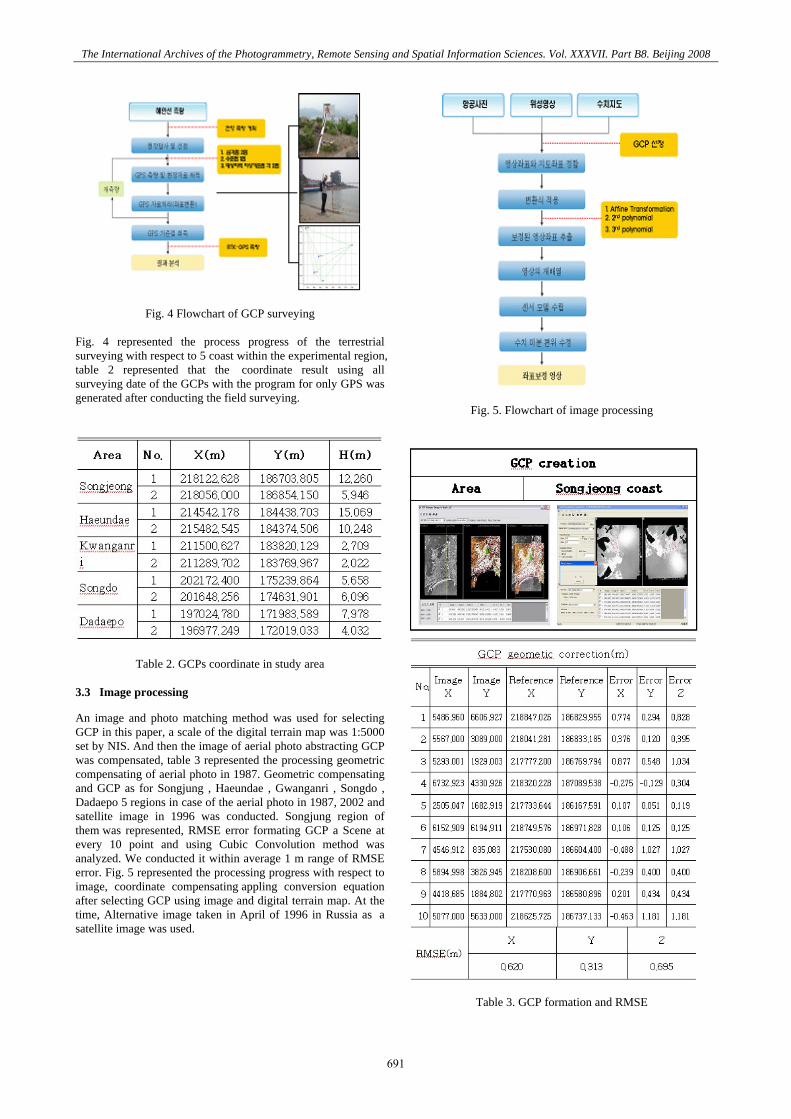
Table 1 represented the classification of the data used for variables analysis, Fig. 2 represented on aerial photo of Haeundae of 5 regions.
Table 1. Study data
Fig. 2. Aerial Photography of 1987, 2002 Fig. 3 represented digital terrain map and a satellite image used in this paper, Alternative Image of Russia was used as a satellite image, digital terrain map using the a scale 1:500 is made at NGI.
Fig. 3. Satellite image and digital terrain map 3.2 Ground Control Point surveying
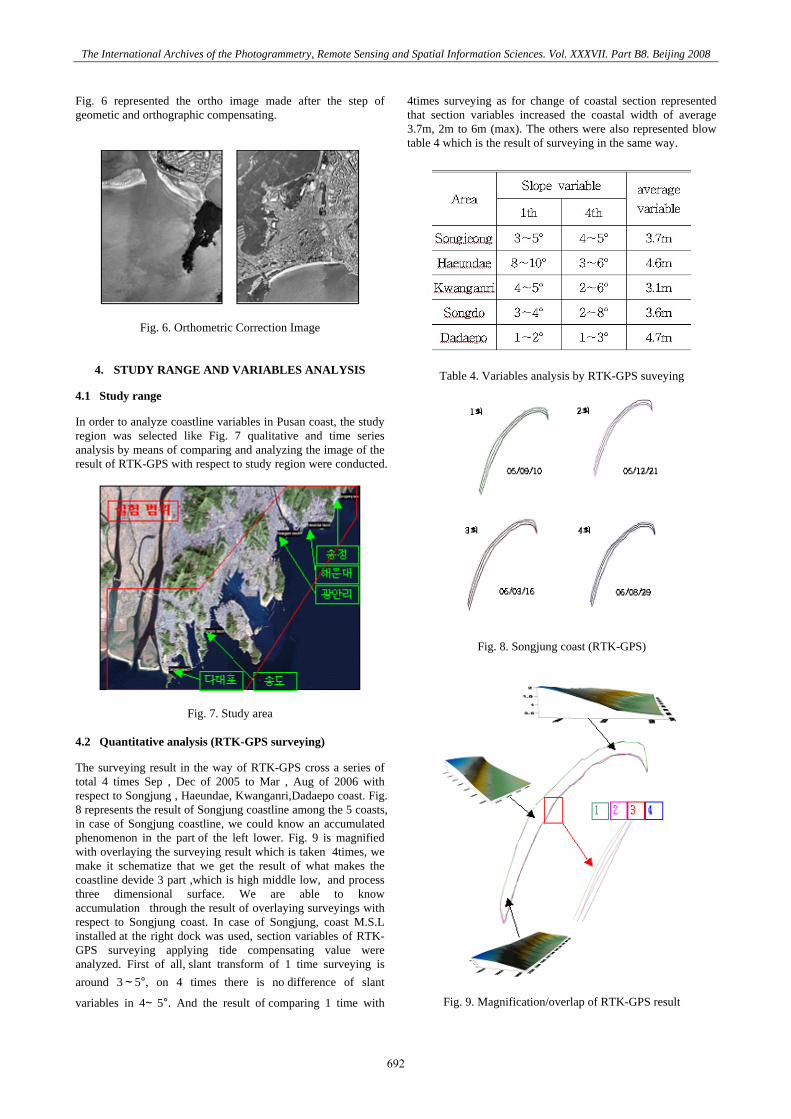
GCP should be located in the region for filming and the safety site which is able to receive GPS well. In this paper, 2 triangulation points (Pusan seogu seodaesindong and gangsugu daejudong,) and 1 bench mark ( sahagu goijung) chosen in this paper were used as a reference station in Fig. 4 , the TIC surveying in the experimental region concurrently was done . Receive interval was adjusted to 5 sec, 15 deg of the receive angle was set up and then each TIC was received for 2 hours. It was decided according to surveying correction elevation of the others with GPS, correction elevation of the bench mark of used points was fixed.
690
The International Archives of the Photogrammetry, Remote Sensing and Spatial Information Sciences. Vol. XXXVII. Part B8. Beijing 2008
Fig. 4 Flowchart of GCP surveying Fig. 4 represented the process progress of the terrestrial surveying with respect to 5 coast within the experimental region, table 2 represented that the coordinate result using all surveying date of the GCPs with the program for only GPS was generated after conducting the field surveying.
Table 2. GCPs coordinate in study area 3.3 Image processing
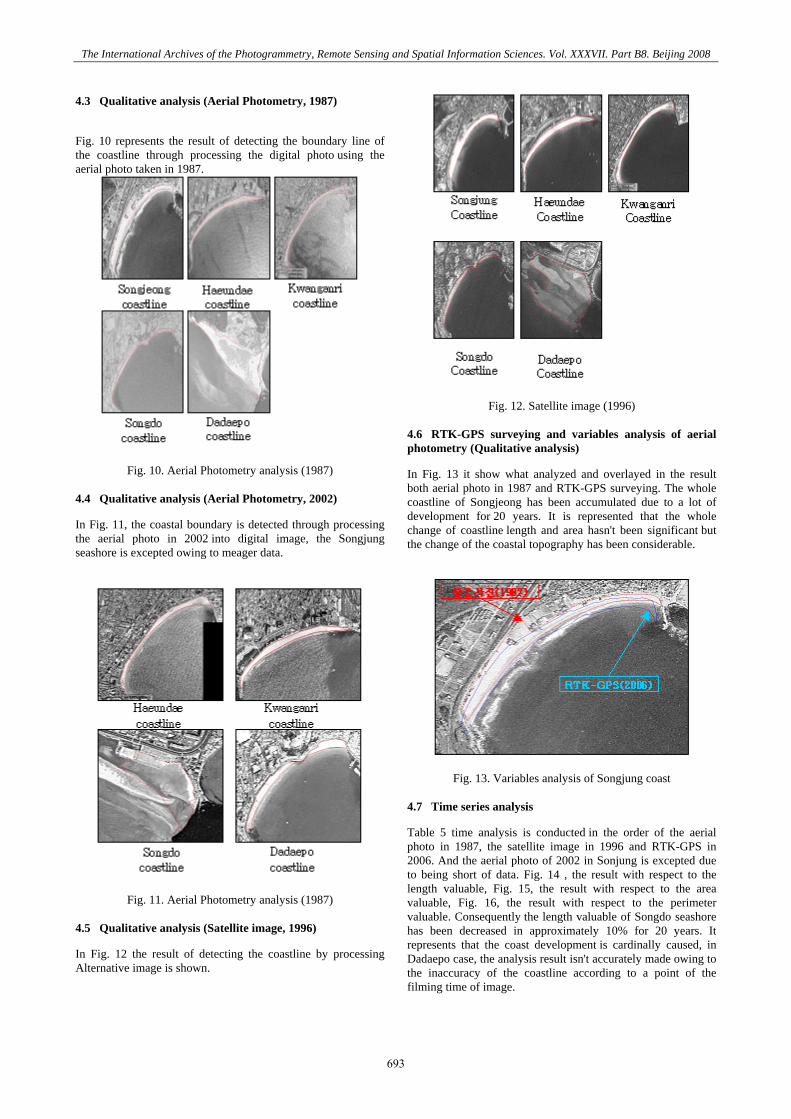
An image and photo matching method was used for selecting GCP in this paper, a scale of the digital terrain map was 1:5000 set by NIS. And then the image of aerial photo abstracting GCP was compensated, table 3 represented the processing geometric compensating of aerial photo in 1987. Geometric compensating and GCP as for Songjung , Haeundae , Gwanganri , Songdo , Dadaepo 5 regions in case of the aerial photo in 1987, 2002 and satellite image in 1996 was conducted. Songjung region of them was represented, RMSE error formating GCP a Scene at every 10 point and using Cubic Convolution method was analyzed. We conducted it within average 1 m range of RMSE error. Fig. 5 represented the processing progress with respect to image, coordinate compensating appling conversion equation after selecting GCP using image and digital terrain map. At the time, Alternative image taken in April of 1996 in Russia as a satellite image was used.
Fig. 5. Flowchart of image processing
Table 3. GCP formation and RMSE
691
The International Archives of the Photogrammetry, Remote Sensing and Spatial Information Sciences. Vol. XXXVII. Part B8. Beijing 2008
Fig. 6 represented the ortho image made after the step of geometic and orthographic compensating.
Fig. 6. Orthometric Correction Image
4. STUDY RANGE AND VARIABLES ANALYSIS
4.1 Study range
In order to analyze coastline variables in Pusan coast, the study region was selected like Fig. 7 qualitative and time series analysis by means of comparing and analyzing the image of the result of RTK-GPS with respect to study region were conducted.
Fig. 7. Study area 4.2 Quantitative analysis (RTK-GPS surveying)
The surveying result in the way of RTK-GPS cross a series of total 4 times Sep , Dec of 2005 to Mar , Aug of 2006 with respect to Songjung , Haeundae, Kwanganri,Dadaepo coast. Fig. 8 represents the result of Songjung coastline among the 5 coasts, in case of Songjung coastline, we could know an accumulated phenomenon in the part of the left lower. Fig. 9 is magnified with overlaying the surveying result which is taken 4times, we make it schematize that we get the result of what makes the coastline devide 3 part ,which is high middle low, and process three dimensional surface. We are able to know accumulation through the result of overlaying surveyings with respect to Songjung coast. In case of Songjung, coast M.S.L installed at the right dock was used, section variables of RTK-GPS surveying applying tide compensating value were analyzed. First of all, slant transform of 1 time surveying is around 3~5°, on 4 times there is no difference of slant
variables in 4∼ 5°. And the result of comparing 1 time with
4times surveying as for change of coastal section represented that section variables increased the coastal width of average 3.7m, 2m to 6m (max). The others were also represented blow table 4 which is the result of surveying in the same way.
Table 4. Variables analysis by RTK-GPS suveying
Fig. 8. Songjung coast (RTK-GPS)
Fig. 9. Magnification/overlap of RTK-GPS result
692
The International Archives of the Photogrammetry, Remote Sensing and Spatial Information Sciences. Vol. XXXVII. Part B8. Beijing 2008
4.3 Qualitative analysis (Aerial Photometry, 1987)
Fig. 10 represents the result of detecting the boundary line of the coastline through processing the digital photo using the aerial photo taken in 1987.
Fig. 10. Aerial Photometry analysis (1987) 4.4 Qualitative analysis (Aerial Photometry, 2002)
In Fig. 11, the coastal boundary is detected through processing the aerial photo in 2002 into digital image, the Songjung seashore is excepted owing to meager data.
Fig. 11. Aerial Photometry analysis (1987) 4.5 Qualitative analysis (Satellite image, 1996)
In Fig. 12 the result of detecting the coastline by processing Alternative image is shown.
Fig. 12. Satellite image (1996) 4.6 RTK-GPS surveying and variables analysis of aerial photometry (Qualitative analysis)
In Fig. 13 it show what analyzed and overlayed in the result both aerial photo in 1987 and RTK-GPS surveying. The whole coastline of Songjeong has been accumulated due to a lot of development for 20 years. It is represented that the whole change of coastline length and area hasn't been significant but the change of the coastal topography has been considerable.
Fig. 13. Variables analysis of Songjung coast 4.7 Time series analysis
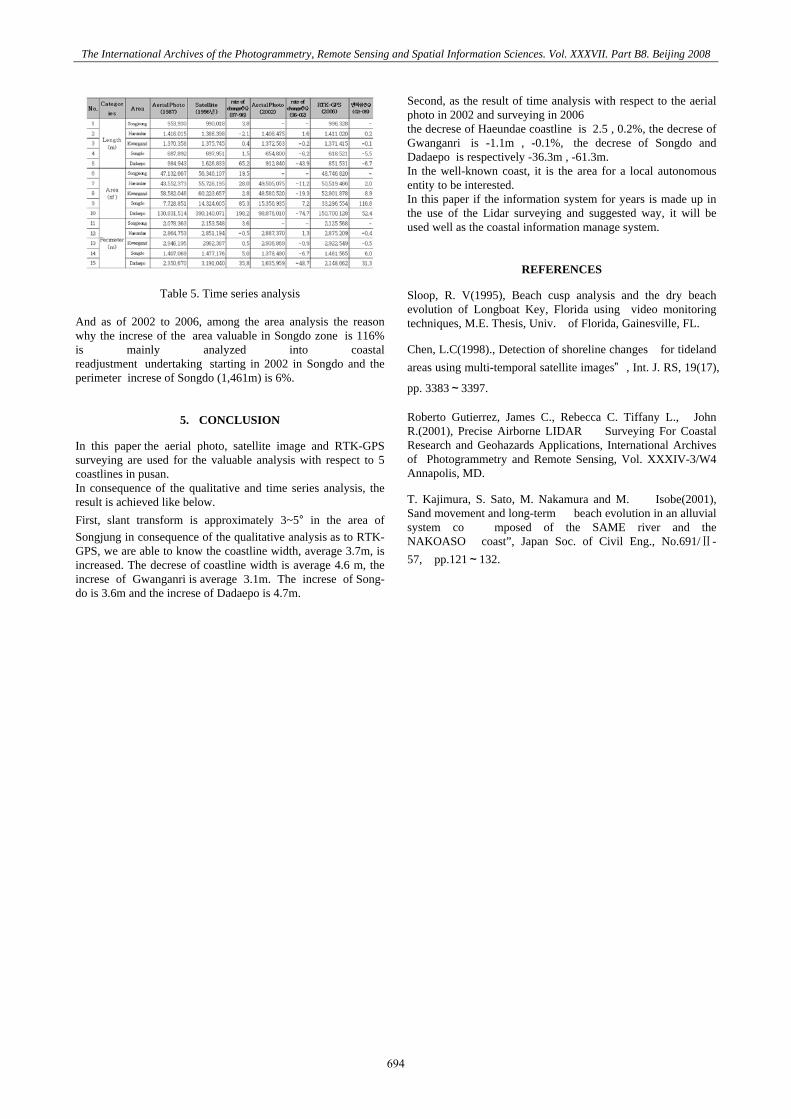
Table 5 time analysis is conducted in the order of the aerial photo in 1987, the satellite image in 1996 and RTK-GPS in 2006. And the aerial photo of 2002 in Sonjung is excepted due to being short of data. Fig. 14 , the result with respect to the length valuable, Fig. 15, the result with respect to the area valuable, Fig. 16, the result with respect to the perimeter valuable. Consequently the length valuable of Songdo seashore has been decreased in approximately 10% for 20 years. It represents that the coast development is cardinally caused, in Dadaepo case, the analysis result isn't accurately made owing to the inaccuracy of the coastline according to a point of the filming time of image.
693
The International Archives of the Photogrammetry, Remote Sensing and Spatial Information Sciences. Vol. XXXVII. Part B8. Beijing 2008
Table 5. Time series analysis And as of 2002 to 2006, among the area analysis the reason why the increse of the area valuable in Songdo zone is 116% is mainly analyzed into coastal readjustment undertaking starting in 2002 in Songdo and the perimeter increse of Songdo (1,461m) is 6%.
5. CONCLUSION
In this paper the aerial photo, satellite image and RTK-GPS surveying are used for the valuable analysis with respect to 5 coastlines in pusan. In consequence of the qualitative and time series analysis, the result is achieved like below. First, slant transform is approximately 3~5° in the area of Songjung in consequence of the qualitative analysis as to RTK-GPS, we are able to know the coastline width, average 3.7m, is increased. The decrese of coastline width is average 4.6 m, the increse of Gwanganri is average 3.1m. The increse of Song-do is 3.6m and the increse of Dadaepo is 4.7m.
Second, as the result of time analysis with respect to the aerial photo in 2002 and surveying in 2006 the decrese of Haeundae coastline is 2.5 , 0.2%, the decrese of Gwanganri is -1.1m , -0.1%, the decrese of Songdo and Dadaepo is respectively -36.3m , -61.3m. In the well-known coast, it is the area for a local autonomous entity to be interested. In this paper if the information system for years is made up in the use of the Lidar surveying and suggested way, it will be used well as the coastal information manage system.
REFERENCES
Sloop, R. V(1995), Beach cusp analysis and the dry beach evolution of Longboat Key, Florida using video monitoring techniques, M.E. Thesis, Univ. of Florida, Gainesville, FL.
Chen, L.C(1998)., Detection of shoreline changes for tideland areas using multi-temporal satellite images” , Int. J. RS, 19(17),
pp. 3383~3397.
Roberto Gutierrez, James C., Rebecca C. Tiffany L., John R.(2001), Precise Airborne LIDAR Surveying For Coastal Research and Geohazards Applications, International Archives of Photogrammetry and Remote Sensing, Vol. XXXIV-3/W4 Annapolis, MD.
T. Kajimura, S. Sato, M. Nakamura and M. Isobe(2001), Sand movement and long-term beach evolution in an alluvial system co mposed of the SAME river and the NAKOASO coast”, Japan Soc. of Civil Eng., No.691/Ⅱ-57, pp.121~132.
694