Embed Size (px)
Citation preview

-- D- i --
Feasibility Report and
Environmental Impact Statement
Coastal Storm Damage Reduction
SURF CITY AND NORTH TOPSAIL BEACH, NORTH CAROLINA
Appendix D
Coastal Engineering

-- D- ii --
Appendix D: Coastal Engineering
Table of Contents
1. Plans Investigated D-1 a. Dune-and-Berm Plans D-1
1) Description D-1 2) Dune-and-Berms Evaluated D-1
b. Berm-Only Plans D-1 1) Description D-1 2) Berms Evaluated D-1
c. Construction Line D-3
2. Description of Recommended Plan D-3 a. Plan Description D-3 b. Project Data D-6
3. Alternative Evaluation Process D-6
a. Study Limits D-6 b. Alternatives Addressed D-6
1) Berm-Only Plans D-7 2) Dune-and-Berm Plans D-7 3) Refinement of Study Limits D-7 4) Refinement of Alternatives D-7 5) Nonstructural Alternative D-8
4. Shoreline Analysis D-9
a. Closure Depth D-9 b. Wave Climate D-9 c. Local Bathymetry D-11 d. Shoreline Adjustments D-12 e. Long-Term Shoreline Change Rates D-13
1) Computed Shoreline Change Rates D-13 2) Comparison with Other Data D-14 3) Sea Level Rise Impacts D-15
5. Shoreline Modeling D-15
a. Sediment Budget D-15 b. Regional Sediment Management Draft Results D-16 c. Beachfill Evolution and Transition Modeling D-17 d. Sensitivity of Erosion Rates in GRANDUC Simulations D-20

-- D- iii --
6. Storm Damage Analysis D-21 a. General D-21 b. SBEACH Analysis D-21
1) Beach Profiles D-22 2) Storm Surge D-23 3) Storm Waves D-24
c. Storm Response Parameters D-25 d. EST Analysis D-26
1) Frequency Curves D-26 2) Modifications to EST Frequency Curves D-27
e. Storm History Simulations D-27
7. Selection of the Periodic Renourishment Interval D-28 a. Optimum Periodic Renourishment Interval D-28 b. Periodic Renourishment Interval Considerations D-29
1) Dredging Window D-29 2) Scarping D-29
c. Recommended Renourishment Interval D-30
8. Borrow Sand Requirements D-30
9. Risk and Uncertainty D-31 a. Background D-31 b. Guidance D-31 c. Analysis Requirements D-32 d. Uncertainty D-32 e. Risk Results for Alternatives Evaluated D-32
Addendum D:1 - GRANDUC Documentation D-34 Addendum D:2 – Sea Level Rise Sensitivity Analysis D-50 Addendum D:3 – Dredging Research Program Storm Surge Database D-57 Addendum D:4 – Overview of EST Process D-61 Addendum D:5 – Beach Profiles D-65
List of Tables Table D-1 Summary of Federal Coastal Storm Damage Reduction Projects in North Carolina D - 7 Table D-2 Summary of Erosion Rate Sensitivity D-20 Table D-3 SBEACH Input Parameters D-22 Table D-4 Summary of Total Costs & Net Benefits for Various Renourishment Intervals D-29 Table D-5 Borrow Sand Requirements D-31 Table D-6 Percent Chance of Having Positive Net Benefits D-33

Surf City and North Topsail Beach, NC Appendix D - Coastal Engineering
-- D – iv --
List of Figures Figure D-1 Typical “Dune-and-Berm” Template D-2 Figure D-2 Typical “Berm-Only” Template D-2 Figure D-3 Typical NED Plan Beachfill Profile D-3 Figure D-4 Schematic of Transition Scenarios D-5 Figure D-5 Location of WIS Station 292 D-9 Figure D-6 All WIS Data 1990-1999 D-10 Figure D-7 Seasonal Variation of Wave Direction/Height D-11 Figure D-8 Nearshore Bathymetry Contours D-12 Figure D-9 1963-2002 Shoreline Change Rates D-13 Figure D-10 Shoreline Change Rate Comparison to NCDCM Rates D-15 Figure D-11 Sediment Budget Cell Definition from 1989 report D-16 Figure D-12 Sediment Budget From 1989 Report D-16 Figure D-13 Preliminary Regional Sediment Transport Results D-17 Figure D-14 Input Parameters for Planform Evolution Model D-18 Figure D-15 Graphical Output from Planform Evolution Model D-19 Figure D-16 Erosion Rates Used in GRANDUC Simulations D-19 Figure D-17 With/Without Project Damages & Benefits with Reduced Erosion Rates D-20 Figure D-18 Example SBEACH Input Profile D-23 Figure D-19 Example SBEACH Storm Input Parameters D-24 Figure D-20 Typical SBEACH Output Parameter Plot D-26 Figure D-21 Example of Escarped Dune D-28 Figure D-22 Escarpment Length vs. Renourishment Interval D-30

Surf City and North Topsail Beach, NC Appendix D - Coastal Engineering
-- D - 1 --
Appendix D: Coastal Engineering 1. Plans Investigated
Two general alternative beachfill plans were evaluated for this study: 1) a dune-and-berm plan and 2) a berm-only plan. Numerous templates for each of these plans were evaluated and are described below.
a. Dune-and-Berm Plans
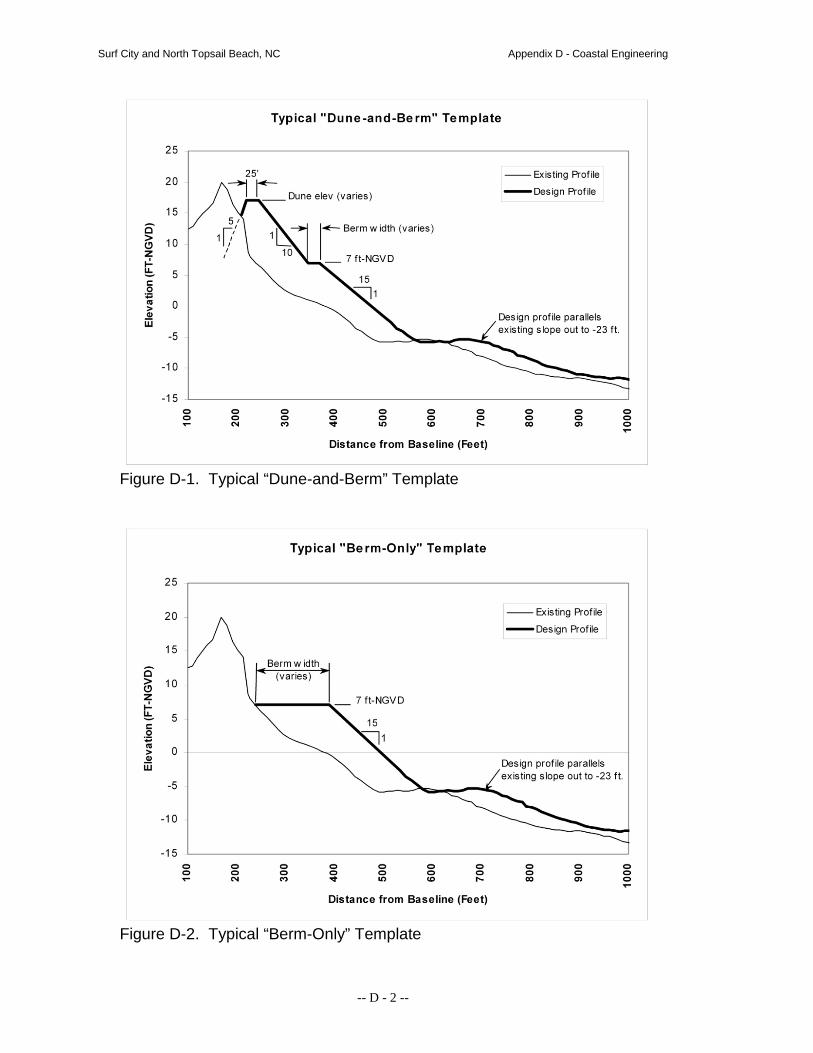
1) Description. Existing dunes were assumed to remain in place, with the design dunes tying into them where appropriate. The design dune templates were tied to a construction line, which is based on both the existing shoreline and the existing development. The landward slope of the dune template is 5 horizontal to 1 vertical; the top of the dune is 25 feet wide; and the seaward slope is 10 horizontal to 1 vertical. The berm elevation is 7 feet-NGVD, with berm width measured from the toe of the constructed dune. The seaward slope of the berm is 15 horizontal to 1 vertical extending down to MLW elevation (-1.9 feet-NGVD), below which the with-project profile parallels the existing profile out to a closure depth of -23 feet-NGVD. Fill material is expected to be fully compatible with existing beach material.
2) Dune-and-Berms Evaluated. Initially dune-and-berm templates with
dune elevations of 11, 13, and 15 feet-NGVD were evaluated, each with 25-, 50-, and 75-foot berm widths at elevation 7 feet-NGVD. In order to envelop the NED plan, additional plans with dune elevations up to 17 feet-NGVD were evaluated. A typical dune-and-berm profile is shown in Figure D-1.
b. Berm-Only Plans
1) Description. The berm-only template is a fill extending seaward from the existing profile with an elevation of 7 feet-NGVD, which is approximately the elevation of the existing natural berm. Berm width is measured seaward along the top of the berm from the point where it intersects the natural profile. The seaward slope of the design berm is 15 horizontal to 1 vertical extending down to MLW elevation (-1.9 feet-NGVD), below which the with-project profile parallels the existing profile out to a closure depth of -23 feet-NGVD. Fill material is expected to be fully compatible with existing beach material.
2) Berms Evaluated. At the feasibility level, 50-, 100-, and 150-foot
berm-only plans were evaluated. Each used a berm elevation of 7 feet-NGVD. A typical berm-only profile is shown in Figure D-2.
Surf City and North Topsail Beach, NC Appendix D - Coastal Engineering
-- D - 2 --
Figure D-1. Typical “Dune-and-Berm” Template
Figure D-2. Typical “Berm-Only” Template

Surf City and North Topsail Beach, NC Appendix D - Coastal Engineering
-- D - 3 --
c. Construction Line The construction line was established to: a) minimize impacts on existing development and b) minimize erosion of the project by aligning the seaward edge of the berm parallel to the existing shoreline to the maximum extent practical. Additionally, the construction line needed to account for the easement line that is located an additional 20 feet landward of the construction tie-in line to ensure adequate room for initial project construction and re-construction in the event of severe storm damage. Another constraint was that the landward toe of the beachfill needed to tie into the existing profile at a minimum elevation of 7 feet-NGVD along the construction line. The resulting construction tie-in line is shown on the Beachfill Plan Layout plates (Appendix A, Figure A-8) as the landward edge of the hachured beachfill area.
2. Description of Recommended Plan
a. Plan Description
The recommended plan is the 1550 dune-and-berm template that consists of a 25-foot-wide dune crest at an elevation of 15 feet-NGVD and a 50-foot-wide berm at an elevation of 7 feet-NGVD. The dune has a landward side slope of 5 horizontal to 1 vertical and a seaward side slope of 10 horizontal to 1 vertical. A typical 1550 dune-and-berm profile for the NED plan is displayed on Figure D-3.
Figure D-3. Typical NED Plan Beachfill Profile
-15
-10
-5
0
5
10
15
20
25
100
200
300
400
500
600
700
800
900
1000
Ele
vatio
n (F
T-N
GV
D)
Distance from Baseline (Feet)
NED Plan - Typical Profile1550 Dune-and-Berm
Existing Profile
1550 Dune-and-Berm
50'
25'
15.0 ft-NGVD
Design profile parallelsexisting slope out to -23 ft.
151
110
51
Plan Construction Line (varies)Building Line (varies)
Surf City and North Topsail Beach, NC Appendix D - Coastal Engineering
-- D - 4 --
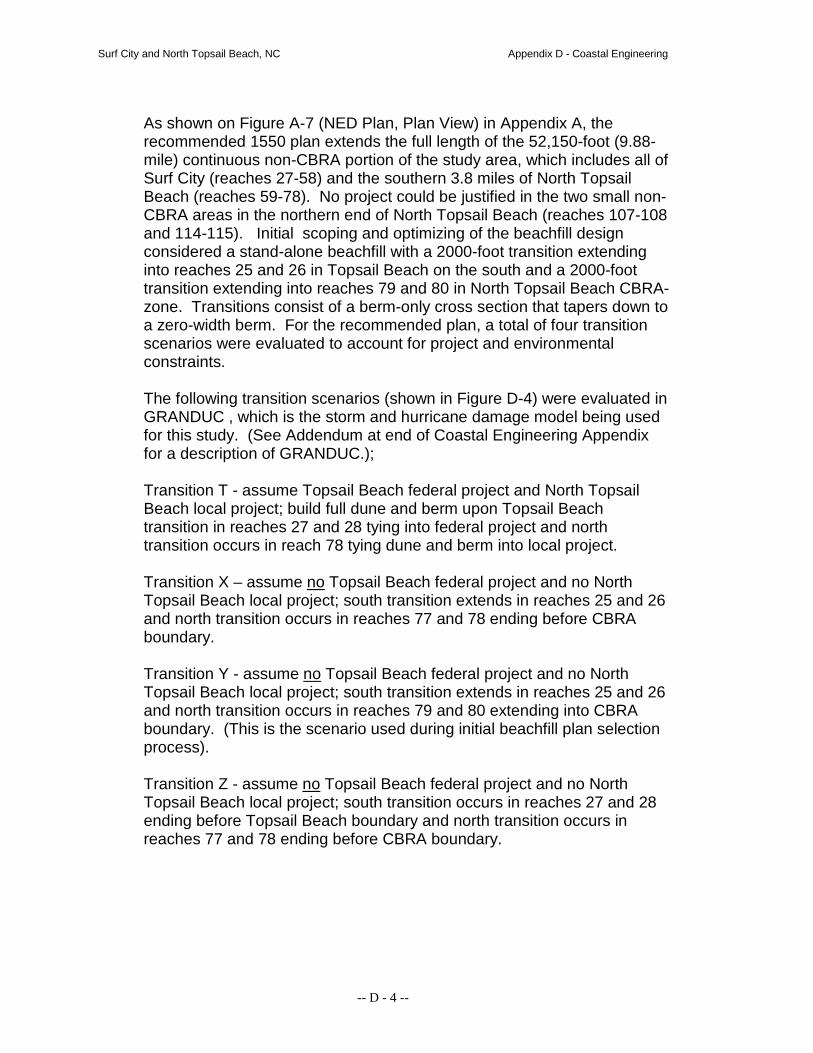
As shown on Figure A-7 (NED Plan, Plan View) in Appendix A, the recommended 1550 plan extends the full length of the 52,150-foot (9.88-mile) continuous non-CBRA portion of the study area, which includes all of Surf City (reaches 27-58) and the southern 3.8 miles of North Topsail Beach (reaches 59-78). No project could be justified in the two small non-CBRA areas in the northern end of North Topsail Beach (reaches 107-108 and 114-115). Initial scoping and optimizing of the beachfill design considered a stand-alone beachfill with a 2000-foot transition extending into reaches 25 and 26 in Topsail Beach on the south and a 2000-foot transition extending into reaches 79 and 80 in North Topsail Beach CBRA-zone. Transitions consist of a berm-only cross section that tapers down to a zero-width berm. For the recommended plan, a total of four transition scenarios were evaluated to account for project and environmental constraints. The following transition scenarios (shown in Figure D-4) were evaluated in GRANDUC , which is the storm and hurricane damage model being used for this study. (See Addendum at end of Coastal Engineering Appendix for a description of GRANDUC.); Transition T - assume Topsail Beach federal project and North Topsail Beach local project; build full dune and berm upon Topsail Beach transition in reaches 27 and 28 tying into federal project and north transition occurs in reach 78 tying dune and berm into local project. Transition X – assume no Topsail Beach federal project and no North Topsail Beach local project; south transition extends in reaches 25 and 26 and north transition occurs in reaches 77 and 78 ending before CBRA boundary. Transition Y - assume no Topsail Beach federal project and no North Topsail Beach local project; south transition extends in reaches 25 and 26 and north transition occurs in reaches 79 and 80 extending into CBRA boundary. (This is the scenario used during initial beachfill plan selection process). Transition Z - assume no Topsail Beach federal project and no North Topsail Beach local project; south transition occurs in reaches 27 and 28 ending before Topsail Beach boundary and north transition occurs in reaches 77 and 78 ending before CBRA boundary.

Surf City and North Topsail Beach, NC Appendix D - Coastal Engineering
-- D - 5 --
Figure D-4 Schematic of Transition Scenarios
The GRANDUC model was run on each of the scenarios and the benefits/cost statisitics provided for further economic evaluation. As expected, Transition T, which ties into beachfill projects on each end provides the most favorable benefits/cost ratio. Appendix A also contains the more detailed Beachfill Plan Layout plates showing the physical location of the main project and transition on aerial photography of the study area. As shown on the typical NED plan profile in Figure D-3, the design profile is assumed to parallel the natural contour below MLW (-1.9 feet-NGVD) out to a closure depth of -23 feet-NGVD. The initial construction profile will extend seaward of the final design berm profile a variable distance (about 100 to 200 feet) providing the required material volume which will equilibrate and redistribute along the active profile (out to about -23 feet NGVD). This equilibration process is highly

Surf City and North Topsail Beach, NC Appendix D - Coastal Engineering
-- D - 6 --
dependent upon the wave climate during and after placement and therefore equilibration time will vary. Experience with nearby beachfill projects shows that the equilibration will take place within one-year of initial placement (Bogue Banks, NC, annual surveys). Once sand redistribution along the foreshore occurs, the equilibrated profile shape will resemble the design berm profile.
b. Project Data
The recommended plan requires about 11.8 million cubic yards of borrow material during initial construction. This borrow volume quantity is actually 15 percent greater than the desired in-place template volume to account for placement losses during initial construction, which equates to an average overfill factor of 1.15. This overfill factor is based upon the characteristics of the borrow material. Placement losses are defined as the extra volume of material that must be removed from the borrow area in order to realize the required in-place volume of material on the beach. Project maintenance requirements for each 6-year renourishment cycle are about 2.6 million cubic yards of borrow material, and that volume includes about 21 percent of additional borrow material to offset material characteristics and placement losses. In total, about 32.3 million cubic yards of borrow material will be required for the 50-year project.
3. Alternative Evaluation Process
a. Study Limits
The Surf City and North Topsail Beach study limits for preliminary assessment of alternatives included all of Surf City (6.0 miles) and the non-CBRA portion of North Topsail Beach’s shoreline (4.6 miles), for a total shoreline length of 10.6 miles. North Topsail Beach’s non-CBRA shoreline was comprised of its southern 3.8-mile section bordering Surf City and two smaller (less than one-half mile each) sections in the northern end of North Topsail Beach near New River Inlet. The contiguous 9.8 miles of the study area consisting of Surf City and the southern portion of North Topsail Beach was divided into 52 reaches (27 through 78)each of which were about 1000 feet wide, except for the southernmost reach (27) which was 1300 feet wide. The two separate, smaller non-CBRA sections were each divided into 2 smaller reaches of varying lengths (reaches 107-108 and 114-115).
b. Alternatives Addressed
With the study limits defined, a systematic procedure for evaluating alternatives was developed. Knowing that the volume of beachfill is a

Surf City and North Topsail Beach, NC Appendix D - Coastal Engineering
-- D - 7 --
strong indicator of storm and hurricane damage protection to be expected and knowing the history of optimum protection along the North Carolina coastline, an array of three berm-only plans and nine dune-and-berm plans were initially addressed.
1) Berm-Only Plans. The berm-only plans evaluated included the 50-,
100-, and 150-foot wide berms that tied directly into the existing dune face and relied solely on the existing dune protection. Evaluations were made using GRANDUC, which is the storm and hurricane damage model being used for this study. (See Addendum at end of Coastal Engineering Appendix for a description of GRANDUC.) In spite of a fairly substantial existing dune, these berm-only plans did not provide the level of storm damage protection as did the dune-and-berm plans, resulting in significantly lower total net benefits and did not warrant further consideration.
2) Dune-and-Berm Plans. Historical projects in place along the North
Carolina coast have dune heights of about 13-feet above NGVD with a berm width of about 50 feet. Therefore, in addition to the 13-foot dune with a 50-foot berm, a higher 15-foot and lower 11-foot dune, each with a 25-, 50-, and 75-foot berm at 7 feet-NGVD, were selected for initial evaluation. A fixed dune width of 25 feet was used for all plans. See below table for a summary of other Federal Coastal Storm Damage Reduction projects along the North Carolina coast (for information only).
Table D-1 Summary of Federal Coastal Storm Damage Reduction Projects in NC
3) Refinement of Study Limits. The project limits were refined by
evaluating the economic feasibility of constructing a project in every reach of the study area. As a result, the two separate study segments in the northern end of North Topsail Beach (reaches 107-108 and 114-114) were not shown to be feasible for a project due primarily to the expected high end losses of material from these short segments.
4) Refinement of Alternatives. The initial array of dune-and-berm plans
using the reduced project limits was evaluated. Dune elevations of 11,
In-Place Borrow Measure
Wrightsville Beach 1965 25' / 13.5' 10H:1V 50' / 6.0' * 14,000 - 210 2,993,100Carolina Beach 1965 25' / 13.5' 10H:1V 50' / 6.5' * 14,000 120 250 3,597,400
Kure Beach 1997 25' / 13.5' 10H:1V 50' / 6.5' * 18,000 - 190 3,372,000Sea Turtle Habitat,
Oak Island2001 20' / 11.0' 5H:1V 70' / 8.0' 10,000 - 260 2,650,000
Dare County Beaches N/A 25' / 13.0' 10H:1V 50' / 7.0' 75,000 147 180 12,340,000
Topsail Beach (NED) N/A 25' / 15.0' 10H:1V 50' / 7.0' 25,000 140 - 3,420,000Topsail Beach (LPP) N/A 25' /12.0' 10H:1V 50' / 7.0' 25,000 100 - 2,387,000
* Berm elevation given represents construction berm since project designed with a stepped dune
Borrow Volume, cy
Fill Density cy/lfProject Date
ConstructedDune
Width/ElevationDune
ForeslopeBerm
Width/Elevation Length, ft

Surf City and North Topsail Beach, NC Appendix D - Coastal Engineering
-- D - 8 --
13, and 15 ft. were evaluated for berm widths of 25, 50, and 75 ft. That analysis was based on using identical unit construction costs across all plans. Although the initial analysis indicated that 25 ft. plans on average had the highest net benefits (about 2 percent higher on average than 50-ft. plans), it was determined that borrow unit costs for implementing a 25-ft. plan were underestimated by at least 8 percent as compared to 50-ft. and greater width plans. One of the primary reasons for the greater unit cost under a 25-ft. plan is the additional equipment and operators that are needed to move pipe along the beach as the dredge is pumping, because the narrow berm width does not allow pumping at one location for as long. For a pipeline, a 25-ft berm is too narrow to use a ‘Y’ valve (which would allow equipment time to prepare pipe for the next reach once adequate sand is placed on the beach template) to be in place on the beach. On a 25-ft berm, a ‘T’ valve used with hoppers means pipe would have to be added faster, require more ‘T’ setups and more often because of the switching back and forth between the ‘T’ valve on the beach for each Hopper pump out location. It is estimated that for at 25-ft berm, 3 dozers and 2 loaders would be needed for construction, as opposed to 2 dozers and 1 loader for the larger plans. Therefore, on the basis of that reassessment of unit costs, the 50–ft. berm plans had the highest net benefits. Next, additional dune elevations were evaluated with the 50-ft. berm width. Dune elevations between 11 and 17 ft. were all found to be economically feasible. The 15 ft dune, 50 ft berm plan was found to have the maximum net benefits.
5) Nonstructural Alternative. An alternative to beachfill that was
evaluated is the nonstructural plan, which includes a combination of retreat, relocation, and demolition to avoid or delay damage to structures by removing them from the hazard area. For this GRANDUC analysis all of the oceanfront structures were eliminated from the structure database. The without project damages were then recomputed using this revised structure database to estimate residual damages for the nonstructural plan. Benefits were determined as the difference in residual damages between the without project GRANDUC runs for the original and modified structure database. However, the nonstructural plan yielded negative net benefits overall and was eliminated from continued consideration. For additional details of the nonstructural plan, including associated costs, refer to Section 5.05.1 and Appendix P.

Surf City and North Topsail Beach, NC Appendix D - Coastal Engineering
-- D - 9 --
4. Shoreline Analysis
a. Closure Depth The seaward limit of changes in depth over long-time periods due to movement of sediment is referred to as the “closure depth” and this depth is used for several calculations in the coastal analysis. Ideally, several years of coastal profile data are compared to observe the depth at which the profile appears stable or constant. Historical profile data is not available so, this analysis used wave height data to calculate a closure depth (USACE Coastal Engineering Manual, EM 1110-2-1100 (Part III).
Closure depth = 1.57 * He (formula reference III-3-12) Where He is the effective significant wave height, a relationship of the mean significant wave height (H), and standard deviation of significant wave height (σH) He = H + 5.6 * σH (formula reference III-3-11)
Significant wave height at WIS Phase II Station 43 is 3.28‘with a standard deviation of 1.97’ giving a closure depth of -23’ NGVD. This value is in-line with nearby beaches at Wrightsville Beach (-24’), Carolina Beach (-24’) and Kure Beach (-24’) [all NGVD datum].
b. Wave Climate
The source of the wave information is from updated hindcast data for the period 1990-1999 for the WIS Level 3 Station 292, located about 10 miles offshore of Topsail Island as shown in the figure below.
Figure D-5 Location of WIS Station 292

Surf City and North Topsail Beach, NC Appendix D - Coastal Engineering
-- D - 10 --
Statistical analysis results of the wave data are shown in the below graphs and show that the predominate wave direction is from the ESE.
Figure D-6 All WIS Data 1990 - 1999
Seasonal wave statistics shown indicate Fall and Winter seasons typically experience larger waves more from the easterly direction while Spring and Summer seasons bring smaller waves from the more southerly directions.

Surf City and North Topsail Beach, NC Appendix D - Coastal Engineering
-- D - 11 --
Figure D-7 Seasonal Variation of Wave Direction/Height
c. Local Bathymetry The below map shows the project area and bathymetric contours (NGVD datum, 5-foot interval). The contours landward of the closure depth (-23 ft NGVD) are generally parallel.

Surf City and North Topsail Beach, NC Appendix D - Coastal Engineering
-- D - 12 --
Figure D-8 Nearshore Bathymetry Contours
Localized deepening of offshore borrow areas can potentially have impacts on wave conditions; however, these changes are not expected to be significant as borrow areas are excavated. Simplified irregular wave transformation calculations were made to look at the sensitivity of deepening the ocean floor by 5-feet (to simulate excavating borrow) on wave heights (Goda’s Method – Automated Coastal Engineering System (ACES) application package). Findings indicate absolute wave height differences of less than 0.1-feet due to deepening for a range of the most commonly occurring wave heights and periods. Even considering possible greater excavation depths up to 15 feet in the borrow areas, negligible changes in wave conditions were found in the analysis.
d. Shoreline Adjustments
Immediately after the project is constructed there will be major adjustments to the beachfill profile that will occur naturally in response to the existing wave environment and may take several months or longer to finally stabilize. (See Beachfill Evolution and Transition Modeling section later in this appendix). As explained earlier in the report, the initial construction berm width will extend 100 to 200 feet beyond the final design width. When stable, the final profile should approximate and parallel the pre-fill profile. Simultaneously, there will be erosion to the profile caused by longshore transport and offshore migration of the sand placed on the beach.

Surf City and North Topsail Beach, NC Appendix D - Coastal Engineering
-- D - 13 --
e. Long-Term Shoreline Change Rates
1) Computed Shoreline Change Rates. Long-term erosion rates were
determined by comparing the 2002 MHW (+2.1 feet-NGVD) shoreline position for each reach to a historical 1963 Corps of Engineers shoreline survey of Topsail Island, a period of 40 years. The 1963 topographic survey was conducted during the month of August while the 2002 profile/photogrametric surveys were done in March. The 1963 MHW shoreline (approximated using the +2 feet-NGVD contour) was digitized using MicroStation to readily allow comparison of shoreline position for each reach. The 2002 MHW shoreline was available from photogrammetric digital mapping of Topsail Island conducted for this study at a scale of 1”=200’ with 1.0’ contour intervals, along with validation using 26 beach profile surveys taken every 1000 feet. Shoreline positions within each reach were determined every 250 feet and then averaged with shoreline positions in the two adjacent reaches to determine the average long-term shoreline change rate for each reach. Figure D-9 is a plot of the long-term shoreline change rates that were computed.
Figure D-9. 1963-2002 Shoreline Change Rates
Between 1963 and 2002, erosion rates were relatively low (less than one foot per year) in the southern half of the main study area (reaches 27-43); however, erosion rates in the northern half of the main study area (reaches 44-78) averaged nearly 2 feet per year. This change in
Surf City and North Topsail Beach, NC Appendix D - Coastal Engineering
-- D - 14 --
erosion rates may indicate the presence of a sediment transport reversal in this area. Section 5 of this appendix discusses ongoing regional sediment management studies which, when completed, will help clarify the sediment transport processes and the presence of transport reversals. Erosion rates increased significantly to over 5 feet per year in portions of the non-study CBRA area (reaches 79-106), but decreased to 2 to 3 feet per year in reaches 107-108 study segment. Shoreline changes in reaches 114-115 study segment begin to be significantly influenced by inlet processes as erosion precipitously changed to minor accretion and then back to significant erosion within a span of only a few reaches as you move towards New River Inlet. Other than the inlet area influence, erosion rates are relatively even. This, along with the parallel bathymetry contours indicates continuity of the shoreline along the project length.
2) Comparison with Other Data. Shoreline change rates computed for
this study were compared to the North Carolina Division of Coastal Management’s (NCDCM) long-term shoreline change rates, as shown in Figure D-10. The USACE analysis utilized measurements using actual survey data as opposed to the NCDCM data which was approximated with aerial photography. The NCDCM data shown is also based on end points (1940’s to 1989, i.e. not including storms of the 1990’s) and the accretionary areas are not corroborated by observed shoreline geometry (bulges or salient features along the shoreline). . The NCDCM rates generally show lower erosion rates than the 1963-2002 rates computed for this study, even showing significant accretion in the northern end of the main study area (reaches 50-58). Since the NCDCM data only extended through 1989 and do not reflect the severe storm activity the region experienced during the 1990s, this is not unreasonable.

Surf City and North Topsail Beach, NC Appendix D - Coastal Engineering
-- D - 15 --
Figure D-10. Shoreline Change Rate Comparison to NCDCM Rates
3) Sea Level Rise Impacts. Inherent in these historic shoreline change rates is about 0.2 feet per year of shoreline erosion due to Sea Level Rise (SLR). This is based on NOS historical sea level rise for the Wilmington, NC station (No. 865810) which indicates sea level rise of about 0.008 feet per year from 1953 to 1993. Accelerated SLR scenarios would result in increased shoreline erosion and are discussed in more detail in Addendum D:2 Sea Level Rise Sensitivity Analysis at the end of this appendix.
5. Shoreline Modeling
a. Sediment Budget
A sediment budget for Topsail Island had been developed for the Final Feasibility Report and Environmental Impact Statement on Hurricane Protection and Beach Erosion Control, West Onslow Beach and New River Inlet North Carolina (Topsail Beach) dated November 1989 (Topsail Beach FR/EIS 1989). This sediment budget was not updated with this report, but is presented below to provide additional understanding of the shore processes along Topsail Island. This project study areas lie within Cells 2 and 3 and the resulting project lies within Cell 2. In Cell 2 (74,000 feet in length) the net sediment transport rate is about 48,000 cy/yr to the north/east and an

Surf City and North Topsail Beach, NC Appendix D - Coastal Engineering
-- D - 16 --
estimated 28,000 cy/yr lost offshore yielding a net deficient of about 76,000 cy/yr.
Figure D-11 Sediment Budget Cell Definition from 1989 report
Figure D-12 Sediment Budget from 1989 report
b. Regional Sediment Management Draft Results
A regional sediment management study is currently underway for Onslow Bay, NC, covering more than 100 miles of beaches, 11 inlets, and five counties from Cape Lookout to Cape Fear, NC. This study is just beginning and results are very preliminary. These preliminary results indicate a sediment transport reversal along Topsail Island with an overall
Surf City and North Topsail Beach, NC Appendix D - Coastal Engineering
-- D - 17 --
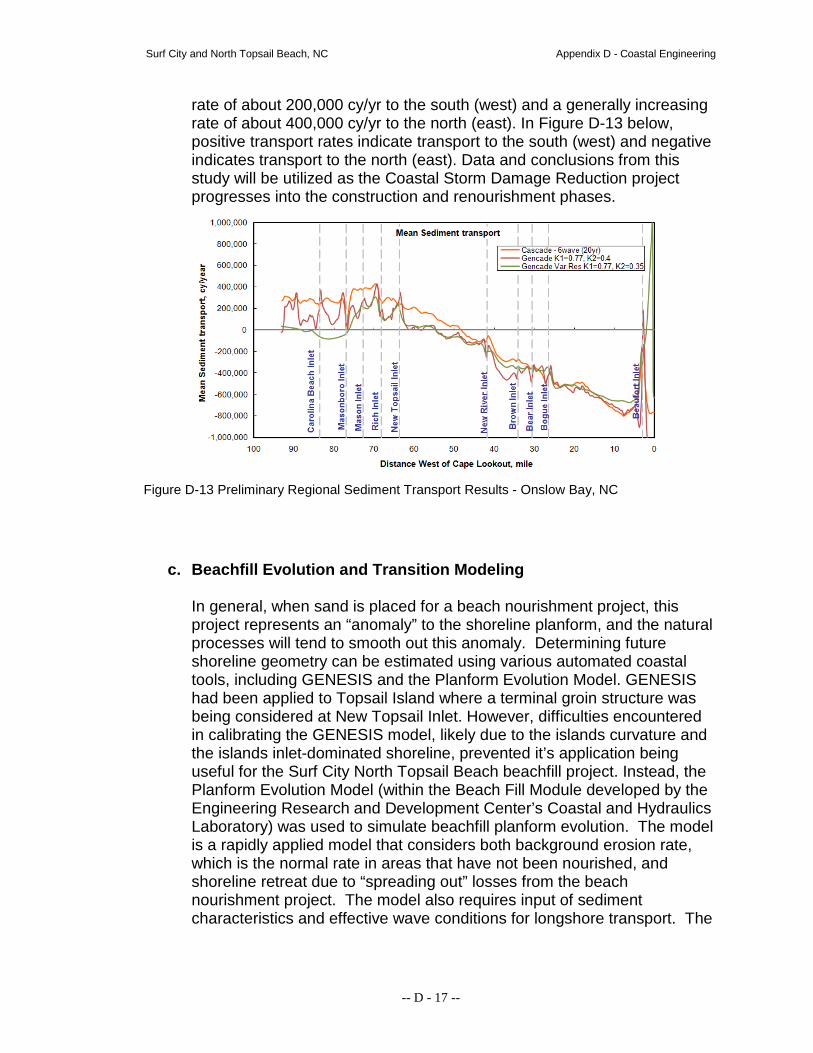
rate of about 200,000 cy/yr to the south (west) and a generally increasing rate of about 400,000 cy/yr to the north (east). In Figure D-13 below, positive transport rates indicate transport to the south (west) and negative indicates transport to the north (east). Data and conclusions from this study will be utilized as the Coastal Storm Damage Reduction project progresses into the construction and renourishment phases.
Figure D-13 Preliminary Regional Sediment Transport Results - Onslow Bay, NC
c. Beachfill Evolution and Transition Modeling In general, when sand is placed for a beach nourishment project, this project represents an “anomaly” to the shoreline planform, and the natural processes will tend to smooth out this anomaly. Determining future shoreline geometry can be estimated using various automated coastal tools, including GENESIS and the Planform Evolution Model. GENESIS had been applied to Topsail Island where a terminal groin structure was being considered at New Topsail Inlet. However, difficulties encountered in calibrating the GENESIS model, likely due to the islands curvature and the islands inlet-dominated shoreline, prevented it’s application being useful for the Surf City North Topsail Beach beachfill project. Instead, the Planform Evolution Model (within the Beach Fill Module developed by the Engineering Research and Development Center’s Coastal and Hydraulics Laboratory) was used to simulate beachfill planform evolution. The model is a rapidly applied model that considers both background erosion rate, which is the normal rate in areas that have not been nourished, and shoreline retreat due to “spreading out” losses from the beach nourishment project. The model also requires input of sediment characteristics and effective wave conditions for longshore transport. The

Surf City and North Topsail Beach, NC Appendix D - Coastal Engineering
-- D - 18 --
effective wave conditions consist of a single set of the average wave parameters. Input data is displayed in the screen captures below.
Figure D-14 Input Parameters for Planform Evolution Model
Model output consists of shoreline positions at user-specified time intervals along with sediment transport rates.

Surf City and North Topsail Beach, NC Appendix D - Coastal Engineering
-- D - 19 --
Figure D-15 Graphical Output from Planform Evolution Model, 6-Year Duration
Post-processing of the output was performed to compute shoreline change rates associated with the project. Based on typical transition lengths of 2000 feet, shoreline change rates and associated volumetric losses were determined over a 10 year period and this data used to derive an annual erosion rate. These erosion rates were then input to GRANDUC to determine the NED plan and optimum renourishment cycle. Figure D-15 shows the results of detailed planform evolution analysis performed on the selected plan (6-year renourishment). These losses were especially severe in the two separated and discontinuous short study reaches in the north end of North Topsail Beach, which resulted in elimination of these reaches. Final erosion rates for GRANDUC simulations are shown in the figure below.
Figure D-16 Erosion Rates Used in GRANDUC Simulations
-14.0
-12.0
-10.0
-8.0
-6.0
-4.0
-2.0
0.0
Eros
ion
Rate
(ft/
yr)
Reach
Long Term (LT) Erosion Rates Used in GRANDUC Simulations
LT Erosion Rate, 3-rch avg
W/Project LT Erosion Rate
Surf City and North Topsail Beach, NC Appendix D - Coastal Engineering
-- D - 20 --
d. Sensitivity of Erosion Rates in GRANDUC Simulations
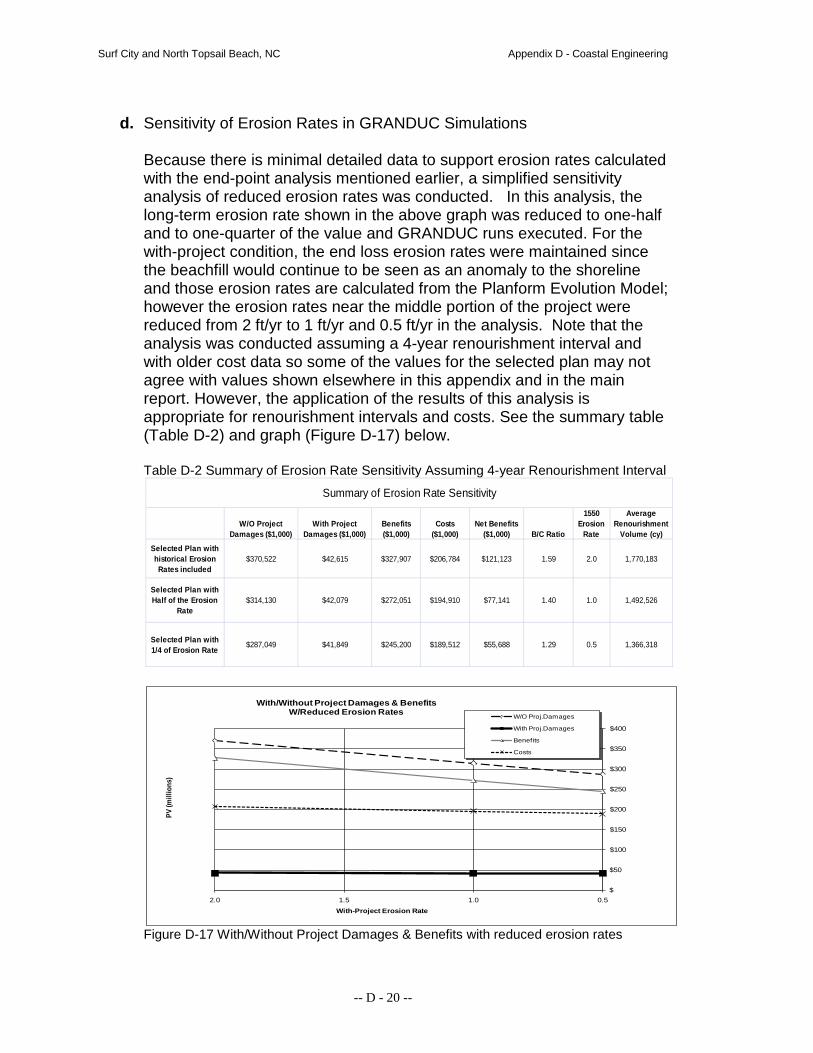
Because there is minimal detailed data to support erosion rates calculated with the end-point analysis mentioned earlier, a simplified sensitivity analysis of reduced erosion rates was conducted. In this analysis, the long-term erosion rate shown in the above graph was reduced to one-half and to one-quarter of the value and GRANDUC runs executed. For the with-project condition, the end loss erosion rates were maintained since the beachfill would continue to be seen as an anomaly to the shoreline and those erosion rates are calculated from the Planform Evolution Model; however the erosion rates near the middle portion of the project were reduced from 2 ft/yr to 1 ft/yr and 0.5 ft/yr in the analysis. Note that the analysis was conducted assuming a 4-year renourishment interval and with older cost data so some of the values for the selected plan may not agree with values shown elsewhere in this appendix and in the main report. However, the application of the results of this analysis is appropriate for renourishment intervals and costs. See the summary table (Table D-2) and graph (Figure D-17) below. Table D-2 Summary of Erosion Rate Sensitivity Assuming 4-year Renourishment Interval
Figure D-17 With/Without Project Damages & Benefits with reduced erosion rates
W/O Project Damages ($1,000)
With Project Damages ($1,000)
Benefits ($1,000)
Costs ($1,000)
Net Benefits ($1,000) B/C Ratio
1550 Erosion
Rate
Average Renourishment
Volume (cy)
Selected Plan with historical Erosion Rates included
$370,522 $42,615 $327,907 $206,784 $121,123 1.59 2.0 1,770,183
Selected Plan with Half of the Erosion
Rate$314,130 $42,079 $272,051 $194,910 $77,141 1.40 1.0 1,492,526
Selected Plan with 1/4 of Erosion Rate $287,049 $41,849 $245,200 $189,512 $55,688 1.29 0.5 1,366,318
Summary of Erosion Rate Sensitivity
$
$50
$100
$150
$200
$250
$300
$350
$400
0.51.01.52.0
PV (m
illio
ns)
With-Project Erosion Rate
With/Without Project Damages & Benefits W/Reduced Erosion Rates W/O Proj.Damages
With Proj.Damages
Benefits
Costs

Surf City and North Topsail Beach, NC Appendix D - Coastal Engineering
-- D - 21 --
It can be seen from the results that as erosion rate is decreased, the without-project damages and benefits are reduced at about the same rate. The costs and with-project damages are reduced at a much less rate. The smaller change in costs is due to the continued need for renourishment volumes which are not reduced in the same proportions as the erosion rates (1/2 and ¼). As mentioned, the end losses and spreading out losses would continue even if the long term erosion rate is reduced thus requiring renourishment to provide continued protection. The small change in with-project damages indicates that the project would continue to perform and the benefit-cost ratios in the table indicate the economics of the project would continue to be robust even with lower erosion rates.
6. Storm Damage Analysis
a. General
The economic analysis of storm damages for the range of beach conditions throughout the study area requires development of frequency-of-occurrence relationships for water levels, wave conditions, and erosion distances. In order to account for risks and uncertainties inherent to the analysis procedure, methods were selected to express storm damages in a probabilistic manner. In other words, the results were required in the form of erosion distance or water levels versus frequency-of-occurrence relationships. A suite of storm events was used to assess the performance of alternatives in reducing potential damages due to erosion, wave attack, and inundation. Profiles were developed to characterize the alternatives dimensions and serve as input to the storm damage calculations. The numerical model SBEACH (Storm Induced BEAch CHange) was used to transform the waves from an approximate depth of 30 feet into the nearshore across proposed alternatives and simulate beach profile change, including the formation and movement of major morphological features such as longshore bars, troughs, and berms, under varying storm waves and water levels. In addition to computing beach profile response, the wave transformation algorithms within SBEACH were utilized to characterize incident wave conditions and total water levels (including wave setup) for each storm. Key response parameters from the SBEACH output were extracted for each storm and used to generate frequency of occurrence relationships using the Empirical Simulation Technique (EST) model. The frequency of occurrence relationships for erosion distances and other parameters serve as input to the GRANDUC model for computation of storm damages.
b. SBEACH Analysis
Surf City and North Topsail Beach, NC Appendix D - Coastal Engineering
-- D - 22 --
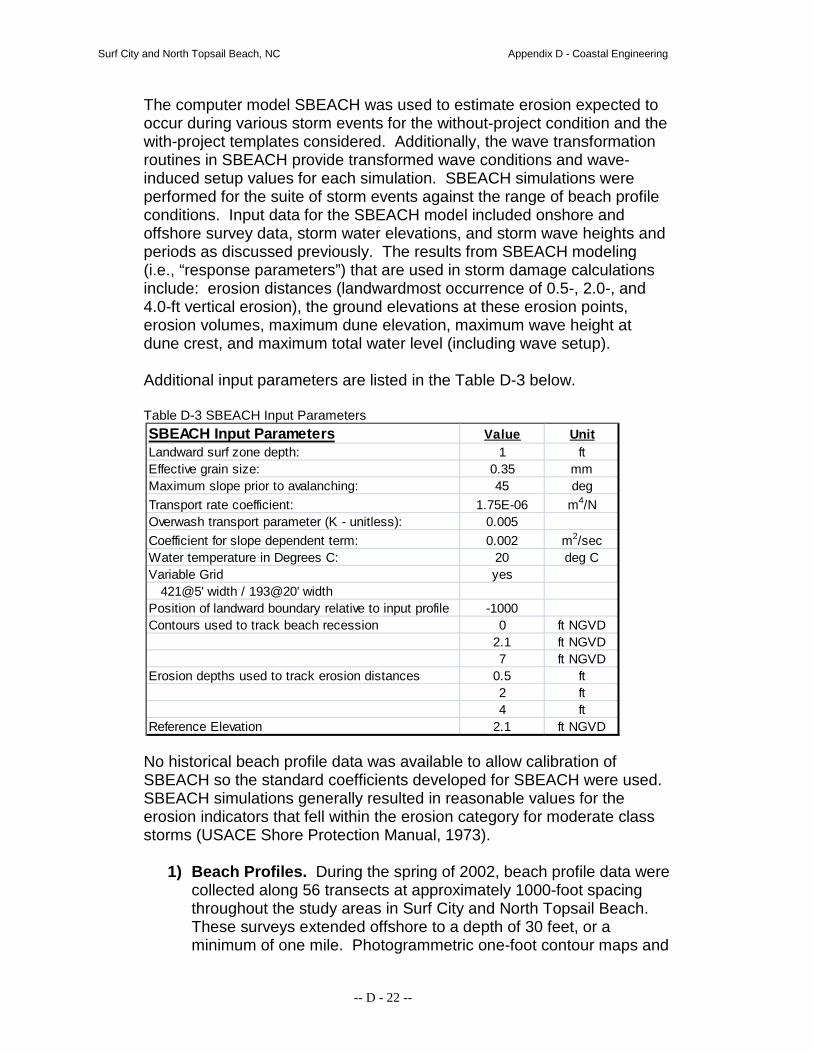
The computer model SBEACH was used to estimate erosion expected to occur during various storm events for the without-project condition and the with-project templates considered. Additionally, the wave transformation routines in SBEACH provide transformed wave conditions and wave-induced setup values for each simulation. SBEACH simulations were performed for the suite of storm events against the range of beach profile conditions. Input data for the SBEACH model included onshore and offshore survey data, storm water elevations, and storm wave heights and periods as discussed previously. The results from SBEACH modeling (i.e., “response parameters”) that are used in storm damage calculations include: erosion distances (landwardmost occurrence of 0.5-, 2.0-, and 4.0-ft vertical erosion), the ground elevations at these erosion points, erosion volumes, maximum dune elevation, maximum wave height at dune crest, and maximum total water level (including wave setup). Additional input parameters are listed in the Table D-3 below. Table D-3 SBEACH Input Parameters
No historical beach profile data was available to allow calibration of SBEACH so the standard coefficients developed for SBEACH were used. SBEACH simulations generally resulted in reasonable values for the erosion indicators that fell within the erosion category for moderate class storms (USACE Shore Protection Manual, 1973).
1) Beach Profiles. During the spring of 2002, beach profile data were collected along 56 transects at approximately 1000-foot spacing throughout the study areas in Surf City and North Topsail Beach. These surveys extended offshore to a depth of 30 feet, or a minimum of one mile. Photogrammetric one-foot contour maps and
SBEACH Input Parameters Value UnitLandward surf zone depth: 1 ftEffective grain size: 0.35 mmMaximum slope prior to avalanching: 45 degTransport rate coefficient: 1.75E-06 m4/NOverwash transport parameter (K - unitless): 0.005Coefficient for slope dependent term: 0.002 m2/secWater temperature in Degrees C: 20 deg CVariable Grid yes 421@5' width / 193@20' widthPosition of landward boundary relative to input profile -1000Contours used to track beach recession 0 ft NGVD
2.1 ft NGVD7 ft NGVD
Erosion depths used to track erosion distances 0.5 ft2 ft4 ft
Reference Elevation 2.1 ft NGVD

Surf City and North Topsail Beach, NC Appendix D - Coastal Engineering
-- D - 23 --
digital orthophotos of the study areas were also generated to complement the beach profile surveys. Representative profile selection was conducted in a rather straightforward manner. The profiles were arranged sequentially and graphically compared and grouped with considerations of dune height, berm and nearshore profile. Groupings of profiles with similar features were further reviewed. The groupings generally consisted of profiles adjacent to one another. Groupings included as few as 2 profiles and as many as 7 profiles. One of the profiles from each of the grouping was selected as the representative profile. Of the 52 beach profiles within the selected plan limits, 16 were used as representative profiles. Although the 2002 profiles likely are continuing to show effects of the storms of the 1990’s, no other profile data is available for comparison. Figure D-18 shows typical SBEACH profile input. Addendum D:5 –Beach Profiles shows all of the surveyed profiles grouped by the representative profile.
Figure D-18 Example SBEACH input profile
2) Storm Surge. Storm surges are storm-induced rises above normal
water levels due to the action of wind stress on the water surface and also atmospheric pressure reduction during hurricanes. Storm surge time-series were developed for all significant hurricanes in the Atlantic Ocean from 1890 to 1990 as part of the Dredging Research Program (DRP-1-17, Scheffner, 1994). The ADCIRC
-50
-40
-30
-20
-10
0
10
20
-1000 0 1000 2000 3000 4000 5000 6000
Elev
atio
n (ft
)
Distance Offshore (ft)
SBEACH Example Input Profile - Hurricane Floyd
Input Profile NTB-2_1550_DUNE

Surf City and North Topsail Beach, NC Appendix D - Coastal Engineering
-- D - 24 --
model was used to update the hindcast to include recent hurricanes through from 1999, including named hurricanes Bertha, Fran, Dennis, Floyd, Bonnie, and Irene. Time-series of storm surge were coupled with astronomical tide data to serve as input to SBEACH for the storm damage assessment. For the 100-plus years of coverage, 37 events were identified using a minimum storm surge threshold of one foot. In addition to the tropical storm surge database, extratropical storm surge values for 23 events were calculated for the dates from 1976 to 1993. See Addendum, Dredging Research Program Storm Surge Database and Recent Hurricane Modeling for additional details about storm surge modeling.
3) Storm Waves. Wave heights and periods corresponding to the
storm surge events discussed above were determined from WIS hindcast data . Combined with the water level time-series, these wave height and period time-series will serve as the storm input to SBEACH for the damage analysis. See Figure D-19 for example storm input parameters.
Figure D-19 Example SBEACH Storm input parameters

Surf City and North Topsail Beach, NC Appendix D - Coastal Engineering
-- D - 25 --
c. Storm Response Parameters Simulation of storm events yields various responses. The parameters that directly impact storm damage include nearshore wave height, total water level, storm surge, wave setup, runup, erosion distances, dune lowering, dune recession, and volumetric changes above MHW. Select parameters were extracted from the SBEACH analysis and used to characterize the performance of the alternatives against each storm event. Figure D-20 displays example SBEACH output for an extreme event for existing conditions and with-project conditions at North Topsail Beach. The plots display initial and final profile conditions, along with maximum water elevations (includes storm surge and wave setup) and maximum wave height observed throughout the simulation. The profile response over the simulation, as indicated by the difference between initial and final profiles, provides an indicator of the severity of the storm on potential offshore losses.

Surf City and North Topsail Beach, NC Appendix D - Coastal Engineering
-- D - 26 --
Figure D-20 Typical SBEACH Output Parameter Plot
d. EST Analysis 1) Frequency Curves. The EST (Empirical Simulation Technique,
Scheffner and Borgman, 1992) utilizes observed and computed parameters associated with site-specific historical events as a basis for developing multiple life-cycle simulations of storm activity and the effects associated with each simulated event. The first step in EST is an analysis of historical events that have impacted a specific locale.

Surf City and North Topsail Beach, NC Appendix D - Coastal Engineering
-- D - 27 --
The storm events simulated (as described previously) were parameterized to define the characteristics of each event and the impacts of that event. Parameters that define the event are referred to as input vectors. Response vectors define storm-related impacts such as total water level and shoreline/dune erosion. These input and response vectors were then used as a basis for generating life-cycle simulations of storm-event activity with corresponding impacts. Results of the multiple repetitions were post-processed to generate frequency-of-occurrence relationships. These relationships were developed for all profile conditions (existing and alternatives) and all response parameters. Select return periods were extracted from each frequency-of-occurrence relationship and provided as input to the GRANDUC model used to calculate storm-induced damages. See the Addendum, Overview of EST Process at the end of this appendix for additional details.
2) Modifications to EST Frequency Curves. Water level frequency
curves generated by EST for low frequency events (50-, 100-, and 500-year events) were unreasonable and exceed FEMA surge level estimates for Topsail Beach by 10 to 20 percent. Adjustments were made to these response curves so that they better reflected the FEMA surge elevations. Also, the EST erosion distance frequency curves were “smoothed” in some cases to result in more uniform and expected erosion responses. An additional analysis using Automated Coastal Engineering System (ACES) software module Extremal Significant Wave Height Analysis corroborated the FEMA extrapolated values.
e. Storm History Simulations
From the response frequency curves, one-thousand different equally-likely storm series were generated as actual input to GRANDUC. A program was written to use the response parameter frequency curves, a Poisson distribution with an average number of storms per year of one, and a random number generator to create the storm histories for the multitude of GRANDUC simulations to be run. For each year of a simulation, the program generates a random number and uses it with the Poisson distribution to determine the number of storms for that year. Then, for each storm, another random number is generated that is used with each of the variable frequency curves to determine the parameters for that storm.

Surf City and North Topsail Beach, NC Appendix D - Coastal Engineering
-- D - 28 --
7. Selection of the Periodic Renourishment Interval
a. Optimum Periodic Renourishment Interval
An analysis of various renourishment intervals from 2 to 7 years was conducted in the GRANDUC model. Longer renourishment intervals increase the risks between renourishment events of allowing accumulated erosion to create escarpments (for instance, it is projected that the escarpment would be nearly two miles longer under a 7 versus a 4 year renourishment cycle), narrow the non-dune portion of the beachfill, erode the toe of the dune, and damage dune vegetation, resulting in an unnatural beach profile. Large scarps also create potential safety hazards (Figure D-21). For renourishment cycles beyond 4 years, an additional hopper dredge would be needed in order to complete dredging during the environmental hopper dredging window of December 1 to March 31. Net benefits increase as a function of renourishment interval from 2 to 4 years (Table D-4). Beyond 4 years, the differences in benefits are insignificant. Therefore, the 6 year renourishment interval, which had the lowest cost, was selected. (Note: this analysis was conducted with older cost data; however, the application of the results is appropriate for determining an optimum renourishment interval).
Figure D-21 Example of escarped dune and eroded berm

Surf City and North Topsail Beach, NC Appendix D - Coastal Engineering
-- D - 29 --
Table D-4. Summary of total costs and net benefits of various renourishment intervals
Renourishment interval (years)
Total cost ($)
Total net benefit ($)
2 129,594,587 158,481,504
3 115,058,012 165,298,498
4 111,479,241 168,712,045
5 111,931,664 167,731,332
6 109,549,340 169,771,051
7 109,637,064 169,032,905
b. Periodic Renourishment Interval Considerations
1) Dredging Window. Because of the limited sand thicknesses of the
offshore borrow sites available for renourishment, it is likely that a hopper dredge will be used. The environmental dredging window for hopper dredging to avoid the possible presence of sea turtles in the borrow area is December 1 to March 31. Additional hopper dredge(s) would be needed to accommodate the renourishment volumes required for intervals greater than 4 years. These additional mob/demob costs were factored into the optimum analysis results shown in Table D-4.
2) Scarping. For such long renourishment intervals, impacts are likely on
turtle nesting, recreation, and storm protection due to loss of the berm and scarping of the dune. This is particularly true for the reaches near the ends of the project, whose estimated with-project erosion rates are 10 to 13 feet per year based on planform evolution analysis. No advanced nourishment is included in this life-cycle design, so the storm berm erodes back to the base of the dune, escarping the dune. Based on a 6-yr renourishment cycle, over three times the length of scarping would occur compared to a 4-yr renourishment cycle. An example of an eroded berm with escarped dune is shown in the Figure D-21. This situation is more likely to occur under the longer renourishment intervals.

Surf City and North Topsail Beach, NC Appendix D - Coastal Engineering
-- D - 30 --
In addition, escarpment length jumps most rapidly when increasing the interval from 4- to 5-years (see below figure).
Figure D-22 Escarpment Length vs. Renourishment Interval
c. Recommended Renourishment Interval. The 6-year renourishment
interval was chosen since it has the lowest cost. Annual surveys will also be used to monitor the project performance. Should monitoring indicate that renourishment is not needed after 6 years (perhaps due to less severe storm activity or other reasons), renourishment can be delayed beyond 6 years as appropriate provided factors such as excessive dune scarping or loss of sea turtle nesting habitat are adequately considered.
8. Borrow Sand Requirements
Table D-5 shows the borrow sand requirements for the initial construction volume and 6-year periodic nourishment volumes for the Surf City and North Topsail Beach NED plan (15 feet-NGVD dune elevation and 50-foot berm). Volumes shown are borrow quantities that have been adjusted for the required overfill factors. Initial beachfill volumes were computed geometrically using the representative profiles. The dune and berm profile was superimposed upon the representative profile (as shown in Figure D-1) and unit volumes computed (cy/lf). These unit volumes were increased by the overfill factor to account for losses and multiplied by the reach lengths to compute the borrow volume required. The recommended borrow plan for initial construction calls for 11,860,000 cubic yards of material to be pumped by hopper dredges from offshore borrow areas. Various transition scenarios result in a difference of no more than about 1 million cubic yards. During periodic renourishment, the plan calls for about 2,642,000 cubic yards of material to be hopper dredged from
0
2,000
4,000
6,000
8,000
10,000
12,000
4 Yrs 5 Yrs 6 Yrs 7 Yrs
Esti
mat
ed E
scar
pmen
t (f
eet)
Estimated Escarpment Length (ft) vs. Renourishment Interval

Surf City and North Topsail Beach, NC Appendix D - Coastal Engineering
-- D - 31 --
multiple offshore borrow sites over the course of the periodic renourishments (based on a 6-year cycle).
Table D-5
Borrow Sand Requirements (cubic yards)
Initial Construction
Volume
6-Year Periodic Renourishment
Volume
50-year Periodic Renourishment
Volume
Total Project Volume
11,860,000 2,642,000 20,477,000 32,300,000
9. Risk and Uncertainty
a. Background
Analysis of coastal storm damage reduction projects has moved from the traditional deterministic approach to a more comprehensive probabilistic, risk-based methodology. Coastal storm damage reduction projects are now formulated to provide economical protection for storm and erosion prone areas, selecting the plan that maximizes net economic benefits consistent with acceptable risk and functional performance. The technical task of any risk-based analysis is to balance the risk of design exceedance with damages prevented, uncertainty of storm characteristics with design accommodations, and to provide for safe, predictable performance. Risk-based analysis enables risk issues and uncertainty in critical data to be explicitly included in project formulation and evaluation. The uncertainties associated with the sequencing of storms and natural recovery and those associated with storm damages and erosion losses can now take on a very large number of values. Evaluating the effects of each sequence of storms becomes a life cycle analysis problem and many lifecycles must be evaluated in order to quantify the distribution of economic losses both without a coastal storm damage reduction project and with each alternative formulated. The use of the lifecycle approach helps explain the evaluation process for erosion and nourishment much more easily since the lifecycle approach is more realistic and more closely mimics the dynamic coastal conditions.
b. Guidance
A major design consideration for this project was to incorporate risk and uncertainty as an integral part of the formulation process. Chapter 6 of ER 1105-2-100, entitled “Risk-Based Analysis for Evaluation of Hydrology/Hydraulics and Economics in Shore Protection Studies” specifies the analysis requirements for coastal storm damage reduction

Surf City and North Topsail Beach, NC Appendix D - Coastal Engineering
-- D - 32 --
projects, the fundamental requirement being that all shore protection analysis adopt a life cycle approach. The Wilmington District model, GRANDUC, which was used for this study incorporates the life cycle approach into the formulation process.
c. Analysis Requirements
ER 1105-2-100 also specifies that the analysis be risk-based and that the following variables be explicit in the analysis and some, by implication, be considered as uncertain:
1) the erosion damage function 2) the stage damage function 3) the wave damage function 4) storm-related parameters 5) wave height above the dune 6) wave penetration 7) shoreline retreat or eroded volume 8) natural post-storm recovery All of these variables are explicitly covered in the GRANDUC model.
d. Uncertainty
The GRANDUC model is currently programmed to measure uncertainty using the following three variables:
1) erosion distance – plus or minus 5.0 feet 2) structure distance – plus or minus 2.0 feet 3) structure elevation – plus or minus 0.1 feet
These three variables utilized are considered a reasonable measure of uncertainty for this study. A triangular distribution has been chosen to represent the variance for each variable.
e. Risk Results for Alternatives Evaluated
Given the probabilistic nature of the analysis, dune-and-berm alternatives were evaluated to determine the percent chance that the given alternative would have positive net benefits. These evaluations are summarized below in Table D-6.

Surf City and North Topsail Beach, NC Appendix D - Coastal Engineering
-- D - 33 --
Table D-6 Percent Chance of Having Positive Net Benefits
Dune-and-Berm Plans Percent Chance
11-ft Dune Elev / 50-ft Berm 100
13-ft Dune Elev / 50-ft Berm 100
14-ft Dune Elev / 50-ft Berm 100
15-ft Dune Elev / 50-ft Berm 99.8
16-ft Dune Elev / 50-ft Berm 99.8
17-ft Dune Elev / 50-ft Berm 99.4 For the above-listed alternatives, risk-based analysis using GRANDUC shows that a feasible project (i.e., net benefits greater than 0) could be justified in nearly all of the lifecycles performed. (GRANDUC performs a total of 1000 lifecycles for each run, with a lifecycle being the 50-year economic life of the project.) In fact, none of the lifecycles performed for the 11, 13, and 14 foot dunes resulted in negative net benefits. The NED plan (15-ft dune elevation with 50-ft berm) had a 99.8 percent chance of having positive net benefits.
Surf City and North Topsail Beach, NC Appendix D - Coastal Engineering
-- D - 34 --
Addendum D:1 - GRANDUC Documentation
Table of Contents
1.Introduction D-35 2.Data Requirements D-35
a. Project Reaches D-35 b. Structure Database D-37 c. Life Cycle Storm Histories D-37 d. Global Data D-39 e. Reach Data D-39 f. Flood Damage Curves D-40 g. Erosion Damage Curves D-40
3.Program Operation D-40 4. Recent Model Enhancements D-45
a. Storm Responses D-45 b. Structure Replacement D-46
5.Surf City and North Topsail Beach GRANDUC Input D-47
a. Global Data D-47 b. Reach Data D-47 c. Life Cycle Storm Histories D-48 d. Structure Database D-48 e. Flood Damage Curves D-49 f. Erosion Damage Curves D-49
List of Tables
Table 1 Sample Life Cycle Storm Histories D-38 Table 2 Partial Results for the Sample Project D-43
List of Figures Figure 1 Sample Reach D-36 Figure 2 Sample Flood Damage Curve D-40 Figure 3 Program Operation Flow Chart D-42 Figure 4 Sample Project Profile D-44 Figure 5 Sample Frequency Plot D-45 Figure 6 Sample Cumulative Probability Distribution D-46

Surf City and North Topsail Beach, NC Appendix D - Coastal Engineering
-- D - 35 --
Addendum D:1 GRANDUC Documentation
GRANDUC Generalized Risk AND Uncertainty - Coastal
1. Introduction
GRANDUC is a group of numerical programs that estimates the benefits and costs associated with coastal storm damage reduction projects and provide a measure of the risk and uncertainty associated with them. The programs are driven by storm water elevation, the associated erosion distances, erosion volumes, and ground elevations. They calculate damages due to storm erosion, annual erosion (sea level rise, littoral sand deficits, etc.), inundation, and wave attack. Structure, contents, and land loss damages are determined along with nourishment costs. Present worth values for benefits and costs are calculated for each simulated life cycle. The life cycle storm data is generated by the Empirical Simulation Technique (EST). Armoring is modeled (if applicable) and an option to track all of the damages associated with one structure for one life cycle is available. 2. Data Requirements
The following is general information on data requirements for the programs. The specific information on running the programs is contained in the program documentation.
a. Project Reaches
The criteria for selecting reaches are as follows:
1) Straight Shoreline: The shoreline in each reach must be straight enough to satisfy the model assumption that the shoreline retreats uniformly.
2) Similar Beach Profile: The beach profile along the reach should not have large variations. This allows one set of storm response predictions to be applied to the reach.
3) Resolution: Long reaches make it difficult to determine the length of the project or how a limited quantity of sand should be distributed. Reach lengths of 500 to 1000 feet have been used satisfactorily.
Figure 1 is a sample reach that is 1000 feet long and contains 40
structures. A reference line and a shoreline are shown in the Figure 1. The reference line is the location from which the structure distances are measured, and the shoreline is the location from which the erosion is measured.

Surf City and North Topsail Beach, NC Appendix D - Coastal Engineering
-- D - 36 --
Figure 1. Sample Reach

Surf City and North Topsail Beach, NC Appendix D - Coastal Engineering
-- D - 37 --
b. Structure Database
The structure database contains the following information:
1) Reach Number 2) Structure ID 3) Distance from the Reference Line to the Ocean Front of the Lot 4) Lot Length 5) Lot Width 6) Distance from the Reference Line to the Front of the Structure 7) Structure Length 8) Attack Angle Ratio - this is the cosine of the angle between the lot orientation and
the direction of erosion 9) Structure Type - determines which flood damage curve to use 10) Structure Value 11) Contents Value 12) Ground Elevation - at the structure 13) First Floor Elevation 14) Active Flag: +1 the structure is used in the damage calculations -1 the structure is not used in the damage calculations 15) Erosion Type - determines which erosion damage curve to use 16) Armor Flag: +1 the structure is armored -1 the structure is not armored 17) Erosion Indicator - indicates whether to use the 0.5-, 2.0-, or 4.0-foot erosion
distances.
c. Life Cycle Storm Histories
Each of the 1000 life cycle simulations needs a sequence of storms and storm responses to be generated for it. These sequences are generated by the Empirical Simulation Technique (EST) which uses a historic storm data base, a storm response model such as SBEACH, and a multi-dimensional interpolation procedure to generate a multitude of new storm histories. The data generated for each storm is: 1) Simulation Number - the number of the life cycle to which the storm belongs
(ranging from 0 to 999) 2) Life Cycle Year - the year in the life cycle in which the storm occurred 3) Erosion Distances – calculated using SBEACH; the landward most occurrence of
0.5-, 2.0-, and 4.0-foot vertical profile erosion measured from the specified shoreline reference.
4) Erosion Volume - the volume of sand eroded by the storm 5) Surge Elevation - the peak storm water elevation 6) Wave Setup - the nearshore setup as calculated in the Coastal Engineering
Manual (formerly Shore Protection Manual) 7) Ground Elevation - the ground elevation at the erosion point Table 1 contains a sample 50-year life cycle storm history.

Surf City and North Topsail Beach, NC Appendix D - Coastal Engineering
-- D - 38 --
Table 1. Sample Life Cycle Storm Histories Simulation
Life Cycle
Erosion
Erosion
Surge
Wave
Ground
Nu
Year
Distance
Volume
Elevation
Setup
Elevation
1 2
78
10.2
6.7
2.3
9.6
1 4
29
4.3
6.2
1.4
13.7
1 7
87
11.1
7.2
2.4
9.3
1
11
14
2.5 6.0
1.1 15.0 1
11
60
8.1
6.5
1.9
11.0
1
14
70
9.3
6.6
2.1
10.3 1
16
33
4.8
6.2
1.4
13.3
1
21
35 5.0
6.2
1.5
13.2 1
25
14
2.5 6.0
1.1
14.9
1
29
20
3.2
6.1
1.2
14.5 1
33
21
3.3
6.1
1.2
14.4
1
35
57
7.7
6.5
1.9
11.3 1
37
61
8.2
6.5
1.9 11.0
1
40
69
9.2
6.6
2.1
10.3 1
41
50
6.9
6.4
1.7
11.9
1
50
30
4.5
6.2
1.4
13.6 1
53
70
9.3
6.6
2.1
10.2
Surf City and North Topsail Beach, NC Appendix D - Coastal Engineering
-- D - 39 --
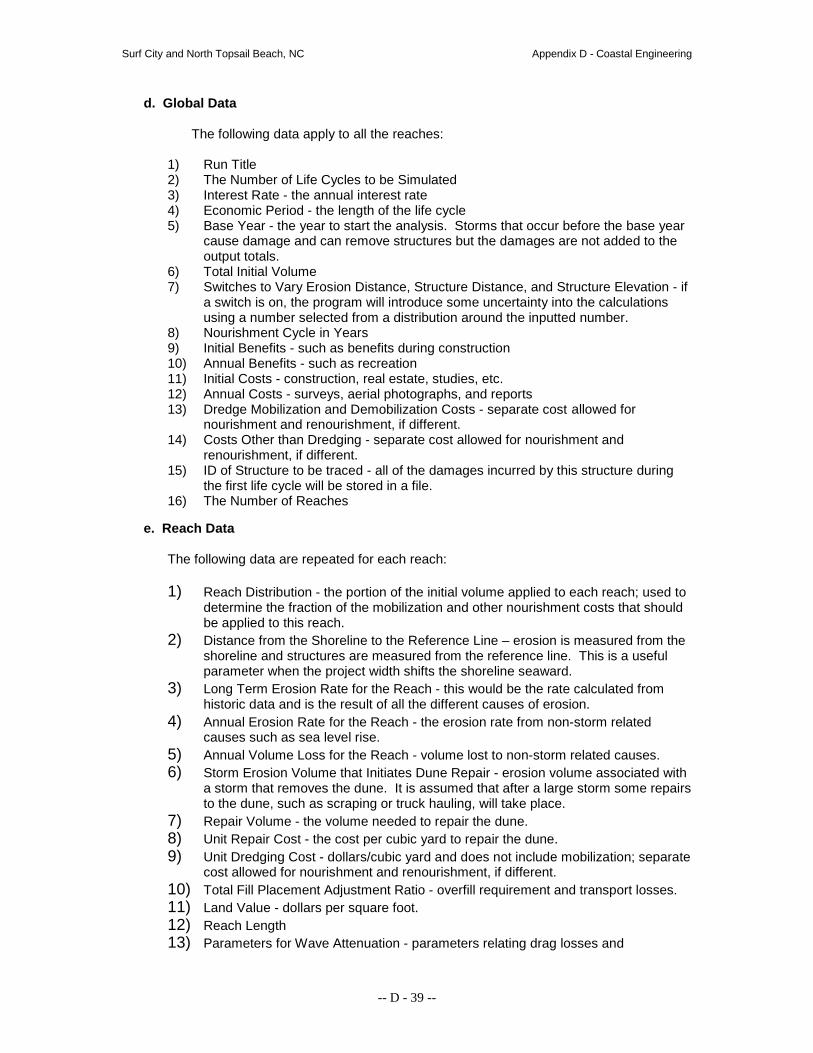
d. Global Data
The following data apply to all the reaches: 1) Run Title 2) The Number of Life Cycles to be Simulated 3) Interest Rate - the annual interest rate 4) Economic Period - the length of the life cycle 5) Base Year - the year to start the analysis. Storms that occur before the base year
cause damage and can remove structures but the damages are not added to the output totals.
6) Total Initial Volume 7) Switches to Vary Erosion Distance, Structure Distance, and Structure Elevation - if
a switch is on, the program will introduce some uncertainty into the calculations using a number selected from a distribution around the inputted number.
8) Nourishment Cycle in Years 9) Initial Benefits - such as benefits during construction 10) Annual Benefits - such as recreation 11) Initial Costs - construction, real estate, studies, etc. 12) Annual Costs - surveys, aerial photographs, and reports 13) Dredge Mobilization and Demobilization Costs - separate cost allowed for
nourishment and renourishment, if different. 14) Costs Other than Dredging - separate cost allowed for nourishment and
renourishment, if different. 15) ID of Structure to be traced - all of the damages incurred by this structure during
the first life cycle will be stored in a file. 16) The Number of Reaches
e. Reach Data
The following data are repeated for each reach: 1) Reach Distribution - the portion of the initial volume applied to each reach; used to
determine the fraction of the mobilization and other nourishment costs that should be applied to this reach.
2) Distance from the Shoreline to the Reference Line – erosion is measured from the shoreline and structures are measured from the reference line. This is a useful parameter when the project width shifts the shoreline seaward.
3) Long Term Erosion Rate for the Reach - this would be the rate calculated from historic data and is the result of all the different causes of erosion.
4) Annual Erosion Rate for the Reach - the erosion rate from non-storm related causes such as sea level rise.
5) Annual Volume Loss for the Reach - volume lost to non-storm related causes. 6) Storm Erosion Volume that Initiates Dune Repair - erosion volume associated with
a storm that removes the dune. It is assumed that after a large storm some repairs to the dune, such as scraping or truck hauling, will take place.
7) Repair Volume - the volume needed to repair the dune. 8) Unit Repair Cost - the cost per cubic yard to repair the dune. 9) Unit Dredging Cost - dollars/cubic yard and does not include mobilization; separate
cost allowed for nourishment and renourishment, if different. 10) Total Fill Placement Adjustment Ratio - overfill requirement and transport losses. 11) Land Value - dollars per square foot. 12) Reach Length 13) Parameters for Wave Attenuation - parameters relating drag losses and

Surf City and North Topsail Beach, NC Appendix D - Coastal Engineering
-- D - 40 --
obstructions. 14) Wave Zone - this is a 200 to 300 foot zone from the erosion line in which a wave
reduction is applied for an effective row of structures. The wave reduction is calculated using all the structures located within this zone as a row of structures.
f. Flood Damage Curves
Two curves are given for each type of structure. One curve is for the structure damage and the second curve is for the content damage. The curves are the distance that the water is above or below the first floor elevation versus the percent damage. Figure 2 displays a sample curve.
g. Erosion Damage Curves
Two curves are given for each type of structure. One curve is for the structure damage and the second curve is for the content damage. The curves are a representation of the percent undermining of the structure (the ratio of the erosion distance under the structure over the structure length) versus the percent damage.
3. Program Operation
The program starts by reading the global data and damage curves. Next a reach loop is begun in which reach data is read and all of the simulations are performed on the structures in the reach before proceeding to the next reach. Then the data for the next reach is read and all of the simulations are repeated on this reach. The loop proceeds until all of the reaches are analyzed. See Figure 3.
Figure 2. Sample Flood Damage Curve At the beginning of the reach loop, the program reads in the long-term erosion data and the parameters used in calculating the flood profile. The structure is read in and the random number generators are reset.

Surf City and North Topsail Beach, NC Appendix D - Coastal Engineering
-- D - 41 --
The program then begins the life cycle simulation loop. Damage values are set to zero and all parameters are set to their initial value. All storms associated with this life cycle are then read in and for the without project runs the net storm erosion recovery factor is calculated as follows:
This equation forces the net storm erosion to be consistent with the observed long-term erosion rate. Project runs require this parameter to be entered as input data. Project profiles may have a different recovery factor, however, the average of the calculated net storm erosion values is printed out and can be used if other information is unavailable. The program then enters a year loop. At the beginning of the loop all structures that can be repaired are restored to their original value. The program checks if there has been storm. If there has been a storm, the erosion value is varied if this option was chosen. The flood profile is calculated by going to the point of erosion and using the storm surge, wave setup, and ground elevation to calculate the water depth and largest wave that can exist at that point. The wave height and wave setups are then reduced at landward points on the profile using the drag coefficient and obstruction parameters read in for the reach. In order to calculate the wave reduction due to a row of structures, the structures are sorted according to distance from the reference line. The structure distances are then summed until the distance between two structures is greater than the row distance parameter. If a distance is greater than the row distance parameter, then the distances of the previously summed structures are averaged and a wave reduction factor is applied. This procedure continues until all structures are checked. Since most of the wave activity can happen in the first couple of hundred feet of the erosion point and structures can be staggered which could prevent the row distance from being exceeded, a wave reduction is calculated using the structures located in the wave zone as defined by the input parameter wave zone. The wave crest is used to define the flood profile. A wave impact profile is defined for areas where the wave height exceeds 3 feet and is two feet below the wave crest. Having calculated the storm characteristics, a structure loop is begun. Erosion, flood, and wave damages are calculated for each structure. The maximum of these damages is multiplied by a present worth factor and is added to a cumulative variable. However, if the life cycle year is earlier than the base year, no damages are recorded. If the structure is armored, erosion is stopped at the armor line until the armor is outflanked. The value of the structure and its contents is reduced by the maximum storm damage amount. This is done to prevent double counting in case there are multiple storms in one year or if at the end of the year the structure is lost to long term erosion. Structures totally destroyed are assumed to be replaced only once during a life cycle. Future damages to these replacement structures for the remainder of the life cycle are based on updated erosion and flood damage curves appropriate for the replacement structure.
onStormErosiCumulative
urationLifeCycleD x ion)AnnualErosrosion(LongTermE =r osionFactoNetStormEr
−

Surf City and North Topsail Beach, NC Appendix D - Coastal Engineering
-- D - 42 --
Figure 3. Program Operation Flow Chart

Surf City and North Topsail Beach, NC Appendix D - Coastal Engineering
-- D - 43 --
At the end of the year loop, the shoreline is adjusted for net storm erosion and annual erosion. Land losses are calculated and undermined structures are made inactive. At the end of each life cycle, the total damage is printed out. Runs with projects differ from base condition runs in that there is no land loss and there is a periodic nourishment cycle. At the end of each periodic nourishment cycle, annual and storm erosion damage is repaired. During the periodic nourishment cycle, only minor repairs are made to the project after major storms that reduce project protection by causing the shoreline to retreat. The output for project runs includes project costs, partial benefits, and damages.
A separate program compares the damages from a project run and the base run to calculate benefits and outputs a probability versus net benefits table. Figure 4 contains a sample project profile, which was applied to the reach shown in Figure 1. Runs with and without the project are made and compared. Sample results for the first 15 life cycles are shown in Table 2.
Table 2. Partial Results for the Sample Project
Benefits Costs BCR Net Benefits 1,758,779 723,043 2.43 1,035,736 1,922,766 710,440 2.71 1,212,326 1,758,698 714,167 2.46 1,044,531 2,699,991 783,825 3.44 1,916,166 1,662,882 714,438 2.33 948,444 1,859,573 710,070 2.62 1,149,503 2,672,781 724,054 3.69 1,948,727 1,942,507 70,8590 2.74 1,233,917 1,091,978 696,686 1.57 395,292 1,942,585 716,308 2.71 1,226,277 761,246 675,450 1.13 85,796 971,021 666,249 1.46 304,772 790,800 685,589 1.15 105,211 1,450,528 715,683 2.03 73,4845 1,041,401 683,001 1.52 358,400 1,880,998 710,466 2.65 1,170,532

Surf City and North Topsail Beach, NC Appendix D - Coastal Engineering
-- D - 44 --
Figure 4. Sample Project Profile
Figure 5 is a sample frequency plot of the net benefits output for 7,000 life cycles. The range of the net benefit outputs was divided into $50,000 intervals. The number of times a net benefit result occurred within an interval was tallied to produce the frequency plot. The frequencies in Figure 5 can be converted into probabilities by dividing them by the total number of life cycles. The probabilities can then be totaled to produce a cumulative probability distribution as shown in Figure 6. There are some negative net benefits results in this sample. These negative net benefits result from life cycle simulations in which there are few storms and no years in which there are more than one storm. It is difficult to read the probability from the graph but the data for this sample shows that there is less than a 3% chance that the net benefits will be negative.
SAMPLE PROJECT
-10
-5
0
5
10
15
0 100 200 300 400 500 600 700 800
DISTANCE FROM REFERENCE LINE (feet)
ELE
VA
TIO
N (f
eet N
GV
D)
PROJECT PROFILEPRE-PROJECT PROFILE
12 ft wide dune at 9.5 ft 50 ft wide berm at 7.0 ft NGVD

Surf City and North Topsail Beach, NC Appendix D - Coastal Engineering
-- D - 45 --
Figure 5. Sample Frequency Plot
4. Recent Model Enhancements
Significant enhancements made to the model since the Alternative Formulation Briefing have had a significant impact on plan formulation. These changes are summarized below.
a. Storm Responses
GRANDUC has been revised to allow for a secondary set of storm responses to be triggered for the remainder of a renourishment cycle, at
FREQUENCY DISTRIBUTION
0
50
100
150
200
250
300
-225000 275000 775000 1275000 1775000 2275000 2775000 3275000 3775000 4275000
NET BENEFITS (DOLLARS)
NU
MB
ER
OF
OC
CU
RR
EN
CE
S
The standard deviation = $604,127 The average = $903,294 The mode = $625,000 The number of pts = 7000 The size of the intervals = $50,000 Max value = $4,403,164 Min value = -$215,346

Surf City and North Topsail Beach, NC Appendix D - Coastal Engineering
-- D - 46 --
Figure 6. Sample Cumulative Probability Distribution
which time GRANDUC would revert then back to the primary set of storm responses. This allows for a switch-over from the primary “beachfill” responses to the secondary “existing condition” responses, triggered by either an erosion distance or a storm erosion volume. First, this allows for GRANDUC to more realistically model the diminished shore protection following major storm damage until the project template can be re-established during the subsequent renourishment. Second, since the “existing condition” at Surf City and North Topsail Beach is basically that of a reconstructed dune (following the extensive damage of hurricanes in the late 90s), switching over to these secondary responses allows GRANDUC to simulate this interim dune rebuilding as part of its operating scheme.
b. Structure Replacement
Previous versions of GRANDUC allowed for structures that were taken out by storm damage to be replaced multiple times with an identical structure, as long as the structure was not taken out by long-term erosion. GRANDUC has been revised to incorporate the following more realistic criteria:
• Structures are replaced only if adequate buildable lot depth remains (100-foot minimum distance from back of lot).
• Only one structure replacement per lot is allowed. • Residential structures taken out by storm damage are replaced with new
residential structures that conform to the latest building codes. While the replacement structures have a higher value, they are also more resistant to storm damage, which will be reflected in their revised erosion damage curve.

Surf City and North Topsail Beach, NC Appendix D - Coastal Engineering
-- D - 47 --
• Non-residential structures are replaced with structures of the same type and value, however, the first-floor elevation will be set at "ground" plus 10 feet. This assumption will exceed the 100-yr storm surge elevation and it is predicated on actual current building practices. Revised erosion damage curves will limit total structure damages to 20 percent maximum and only when the erosion indicator is 100 percent through the structure footprint.
5. Surf City and North Topsail Beach GRANDUC Input
a. Global Data
1) Number of Life Cycles: To achieve model stability, 1000 life cycles were
simulated. 2) Interest Rate: An interest rate of 4.125% is used for this analysis. 3) Economic Period: A 50-year length of life cycle is used. 4) Base Year: The base year for GRANDUC analysis is the first year the project is in
place. Adjustments were made to the shoreline and structure database to reflect project in-place conditions.
5) Uncertainty: Uncertainty was introduced into the model via three variables:
erosion distance, structure distance, and first floor structure elevation. A variance of ± 5 feet is used for erosion distance, ± 2 feet for structure distance, and ± 0.1 feet for first-floor structure elevation.
6) Nourishment Cycle: A 6-year periodic nourishment cycle is used. 7) Initial Benefits: No initial benefits were included in the GRANDUC analyses. 8) Initial Costs, Annual Costs, Dredging Mobilization and Demobilization Cost
during Nourishment: Study team members provided cost input data.
b. Reach Data
1) Reaches: The contiguous main portion of the Surf City and North Topsail Beach study area was subdivided into a total of 52 reacheseach of these reaches were approximately 1000 feet in length, except the southernmost reach at the Topsail Beach/Surf City town limit, which was about 1300 feet in length. The two smaller, separate non-CBRA areas in the northern end of North Topsail Beach both had lengths of less than 2000 feet and each was subdivided into two smaller reaches of varying lengths.
2) Shoreline and Reference Line: The existing mean high water line (+2.1 feet-
NGVD) was used as both the shoreline and the reference line. Erosion is measured from the shoreline and structure setbacks are measured from the reference line.
3) Long Term Erosion Rates: For pre-project (base) conditions, long-term erosion
rates were computed using historic surveys. For project conditions, long-term erosion losses were calibrated using the Planform Evolution Model.
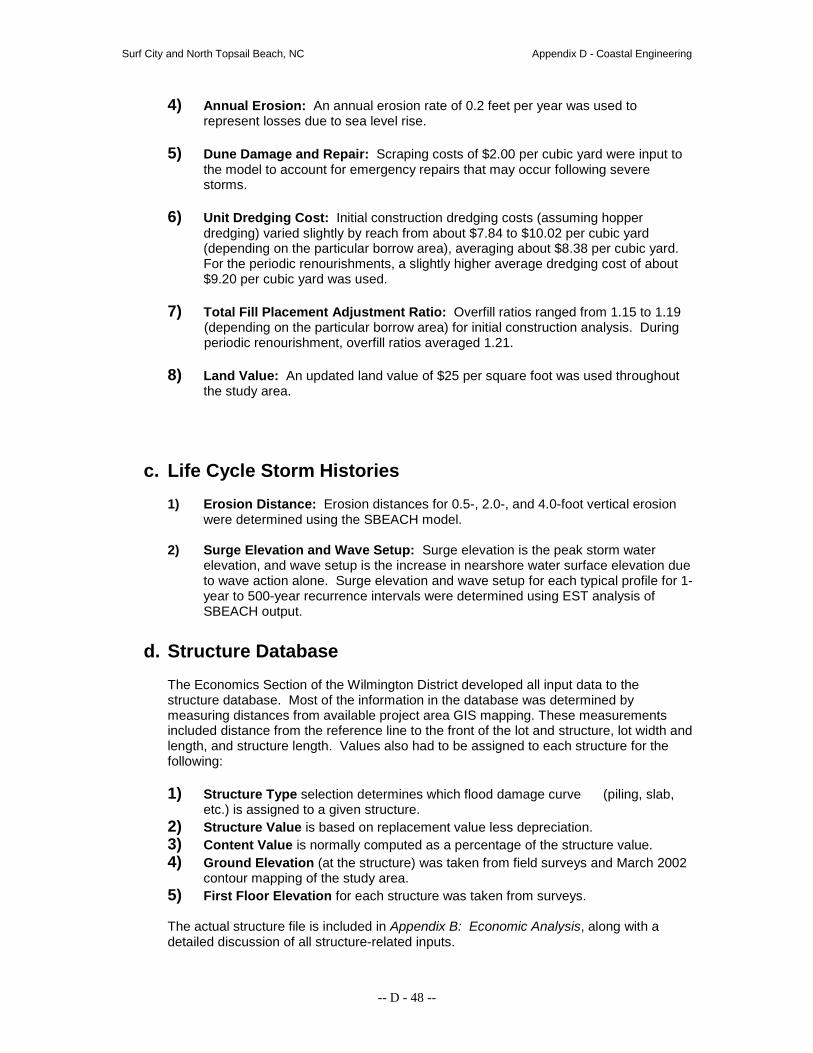
Surf City and North Topsail Beach, NC Appendix D - Coastal Engineering
-- D - 48 --
4) Annual Erosion: An annual erosion rate of 0.2 feet per year was used to represent losses due to sea level rise.
5) Dune Damage and Repair: Scraping costs of $2.00 per cubic yard were input to
the model to account for emergency repairs that may occur following severe storms.
6) Unit Dredging Cost: Initial construction dredging costs (assuming hopper
dredging) varied slightly by reach from about $7.84 to $10.02 per cubic yard (depending on the particular borrow area), averaging about $8.38 per cubic yard. For the periodic renourishments, a slightly higher average dredging cost of about $9.20 per cubic yard was used.
7) Total Fill Placement Adjustment Ratio: Overfill ratios ranged from 1.15 to 1.19
(depending on the particular borrow area) for initial construction analysis. During periodic renourishment, overfill ratios averaged 1.21.
8) Land Value: An updated land value of $25 per square foot was used throughout
the study area.
c. Life Cycle Storm Histories
1) Erosion Distance: Erosion distances for 0.5-, 2.0-, and 4.0-foot vertical erosion were determined using the SBEACH model.
2) Surge Elevation and Wave Setup: Surge elevation is the peak storm water
elevation, and wave setup is the increase in nearshore water surface elevation due to wave action alone. Surge elevation and wave setup for each typical profile for 1-year to 500-year recurrence intervals were determined using EST analysis of SBEACH output.
d. Structure Database
The Economics Section of the Wilmington District developed all input data to the structure database. Most of the information in the database was determined by measuring distances from available project area GIS mapping. These measurements included distance from the reference line to the front of the lot and structure, lot width and length, and structure length. Values also had to be assigned to each structure for the following:
1) Structure Type selection determines which flood damage curve (piling, slab,
etc.) is assigned to a given structure. 2) Structure Value is based on replacement value less depreciation. 3) Content Value is normally computed as a percentage of the structure value. 4) Ground Elevation (at the structure) was taken from field surveys and March 2002
contour mapping of the study area. 5) First Floor Elevation for each structure was taken from surveys.
The actual structure file is included in Appendix B: Economic Analysis, along with a detailed discussion of all structure-related inputs.
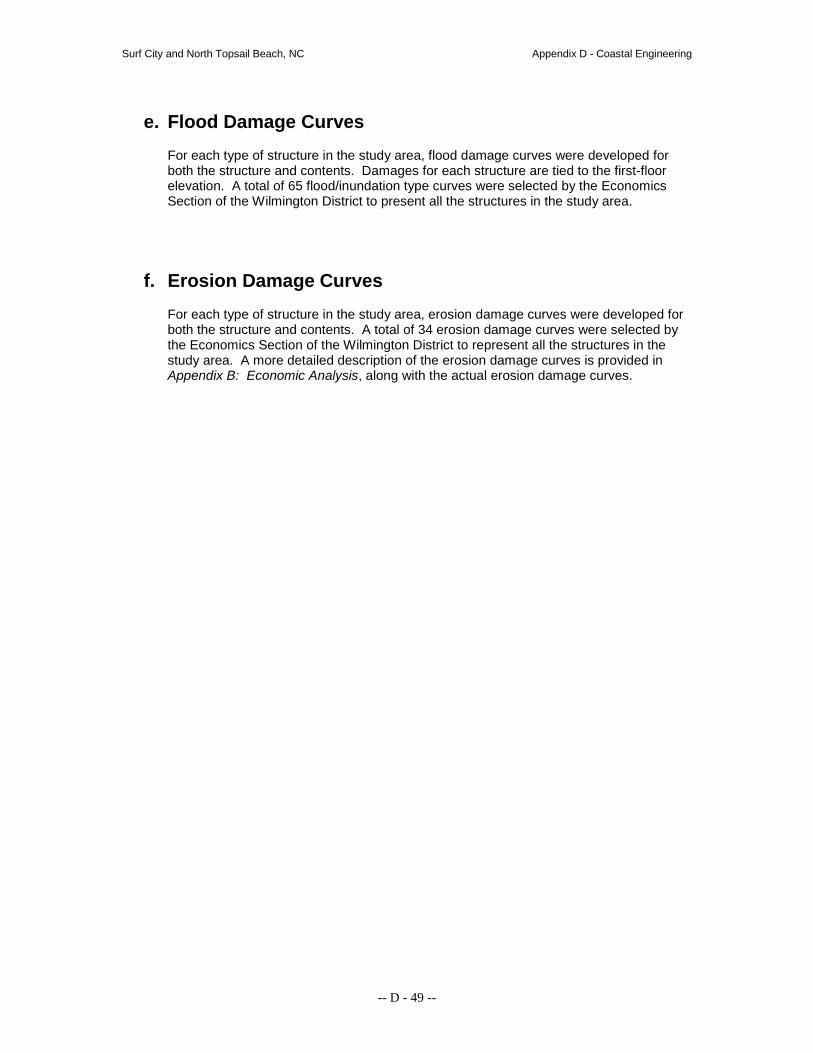
Surf City and North Topsail Beach, NC Appendix D - Coastal Engineering
-- D - 49 --
e. Flood Damage Curves
For each type of structure in the study area, flood damage curves were developed for both the structure and contents. Damages for each structure are tied to the first-floor elevation. A total of 65 flood/inundation type curves were selected by the Economics Section of the Wilmington District to present all the structures in the study area.
f. Erosion Damage Curves
For each type of structure in the study area, erosion damage curves were developed for both the structure and contents. A total of 34 erosion damage curves were selected by the Economics Section of the Wilmington District to represent all the structures in the study area. A more detailed description of the erosion damage curves is provided in Appendix B: Economic Analysis, along with the actual erosion damage curves.
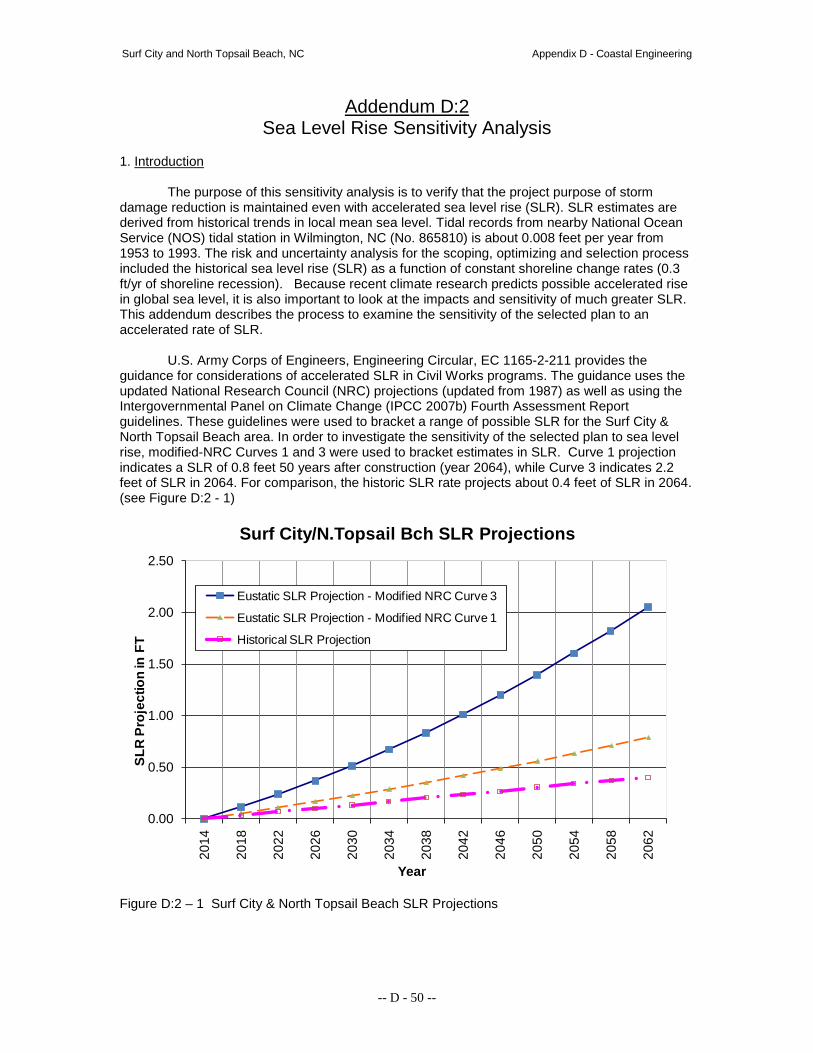
Surf City and North Topsail Beach, NC Appendix D - Coastal Engineering
-- D - 50 --
Addendum D:2 Sea Level Rise Sensitivity Analysis
1. Introduction
The purpose of this sensitivity analysis is to verify that the project purpose of storm
damage reduction is maintained even with accelerated sea level rise (SLR). SLR estimates are derived from historical trends in local mean sea level. Tidal records from nearby National Ocean Service (NOS) tidal station in Wilmington, NC (No. 865810) is about 0.008 feet per year from 1953 to 1993. The risk and uncertainty analysis for the scoping, optimizing and selection process included the historical sea level rise (SLR) as a function of constant shoreline change rates (0.3 ft/yr of shoreline recession). Because recent climate research predicts possible accelerated rise in global sea level, it is also important to look at the impacts and sensitivity of much greater SLR. This addendum describes the process to examine the sensitivity of the selected plan to an accelerated rate of SLR.
U.S. Army Corps of Engineers, Engineering Circular, EC 1165-2-211 provides the guidance for considerations of accelerated SLR in Civil Works programs. The guidance uses the updated National Research Council (NRC) projections (updated from 1987) as well as using the Intergovernmental Panel on Climate Change (IPCC 2007b) Fourth Assessment Report guidelines. These guidelines were used to bracket a range of possible SLR for the Surf City & North Topsail Beach area. In order to investigate the sensitivity of the selected plan to sea level rise, modified-NRC Curves 1 and 3 were used to bracket estimates in SLR. Curve 1 projection indicates a SLR of 0.8 feet 50 years after construction (year 2064), while Curve 3 indicates 2.2 feet of SLR in 2064. For comparison, the historic SLR rate projects about 0.4 feet of SLR in 2064. (see Figure D:2 - 1)
Figure D:2 – 1 Surf City & North Topsail Beach SLR Projections
0.00
0.50
1.00
1.50
2.00
2.50
2014
2018
2022
2026
2030
2034
2038
2042
2046
2050
2054
2058
2062
SLR
Pro
ject
ion
in F
T
Year
Surf City/N.Topsail Bch SLR Projections
Eustatic SLR Projection - Modified NRC Curve 3
Eustatic SLR Projection - Modified NRC Curve 1
Historical SLR Projection

Surf City and North Topsail Beach, NC Appendix D - Coastal Engineering
-- D - 51 --
2. Beach Profile Storm Response Sensitivity
The approach to simulating various SLR rates for the Surf City/North Topsail Beach project involved investigating the sensitivity of storm response changes due to SLR. According to the Bruun Rule (Bruun, 1962), as sea level rises, the beach profile will attempt to reestablish the same bottom depths relative to the surface of the sea that existed prior to sea level change. In other words, the natural profile will be translated upward and shoreward to maintain equilibrium (the beach berm rises).
In order to check the sensitivity of storm responses to a raised berm, storm responses of the original proposed project berm profile were compared with those of a proposed project with a raised berm. Two typical profiles from the project area were selected representing a healthy dune system and a weaker dune system. The original design template was modeled along with a modified template with a raised berm. Both large and moderate storms were selected for the simulation. SBEACH runs were made on the modified (raised berm) profile and compared with storm responses for the original profile. Figure D:2 - 2 shows typical graphical profile output from SBEACH for one of the runs. Results for all of the sample runs are tabulated in the below Table D:2 - 1. Results indicate that the storm responses are not significantly sensitive to the higher berm elevation.
Figure D:2 - 2 – Sample SBEACH Profiles for Storm Response Sensitivity

Surf City and North Topsail Beach, NC Appendix D - Coastal Engineering
-- D - 52 --
Table D:2 - 1 – SBEACH Results
Selected Storms and Profiles Tested
Volume Change (cy/ft)
Max H20 elev + setup (ft)
Max Runup elev (ft)
Position 0.5' Eros
(ft) * 0.5' Eros Dist (ft) **
Position 2.0' Eros
(ft) * 2.0 Eros Dist
(ft) **
Position 4.0' Eros
(ft) * 4.0 Eros Dist
(ft) **
Max Recession of 0' contour (ft)
Max Recession of 2.1' contour
(ft)
Max Recession of 7' contour
(ft) 1929 storm
NTB-3 Original -1.5 8.23 10.66 331 111.5 356 86.5 n/a n/a 17.69 29.69 47.37 NTB-3 Berm Raised 1' -1.5 8.36 10.63 326 121.5 351 96.5 n/a n/a 19.45 31.39 44.74
SC-2 Original -1.5 8.23 10.45 265 102.5 295 72.5 n/a n/a 6.83 19.56 42.95 SC-2 Berm Raised 1' -1.5 8.33 10.46 255 117.5 285 87 n/a n/a 7.81 20.95 36.3
1954 storm NTB-3 Original 0 15.79 18.11 56 386.5 151 291.5 166 276.5 3.02 12.46 32.92
NTB-3 Berm Raised 1' 0 15.89 18.84 51 396.5 156 291.5 166 281.5 4.2 12.8 34.88
SC-2 Original 0 16.25 19.69 50 317.5 n/a n/a n/a n/a 1.99 5.44 32.22 SC-2 Berm Raised 1' 0 16.25 19.64 50 322.5 n/a n/a n/a n/a 2.72 6.73 30.91
1960 storm NTB-3 Original -0.1 11.8 14.25 346 96.5 n/a n/a n/a n/a 11.53 23.22 33.32
NTB-3 Berm Raised 1' -0.1 11.825 14.16 341 106.5 n/a n/a n/a n/a 13.47 24.91 28.32
SC-2 Original -0.1 11.8 14.15 275 92.5 n/a n/a n/a n/a 3.01 14.3 30.85 SC-2 Berm Raised 1' -0.1 11.81 13.95 270 102.5 n/a n/a n/a n/a 3.76 15.42 20.23
1999 storm NTB-3 Original -1.8 15.86 18.88 -149 591.5 41 401.5 161 281.5 6.29 17.74 85.49
NTB-3 Berm Raised 1' -1.8 15.95 19.95 -174 621.5 -94 541.5 161 286.5 7.17 17.41 58.66
SC-2 Original -1.7 16.75 20.86 25 342.5 45 322.5 n/a n/a 0 7.8 30.42 SC-2 Berm Raised 1' -1.7 16.73 20.87 25 347.5 45 327.5 n/a n/a 0 9.11 30.73
Results of SBEACH Runs on Selected Storms & Profiles to Examine Beach Project Storm Responses of a Higher Berm due to Rise in Sea Level
* Position of landward most occurrence of xx ft. erosion depth ** Distance from position of reference elevation on initial profile to position of landward most occurrence of a xx ft erosion depth

Surf City and North Topsail Beach, NC Appendix D - Coastal Engineering
-- D - 53 --
3. Shoreline Recession Due to Sea Level Rise With a rise in sea level the beach berm will rise and the beach profile down to the depth
of closure will adjust to the rise in sea level. The volume of sand needed for the profile adjustment will cause the beach to erode (Bruun Rule). Additionally, it is expected that the storm surge elevations of the accelerated SLR modeled storms would increase relative to those storm surge elevations originally modeled using historical SLR. To simulate the increase in storm surge elevation, the storm input used for the GRANDUC program was adjusted to reflect the increased storm elevations and therefore more frequent occurrence of all storm parameters.
The erosion rates input to GRANDUC required adjusting due to sea level rise. The Bruun Rule was applied to make adjustments to simulate accelerated SLR. As stated by Bruun, with a rise in sea level the storm berm will rise, and erosion of the shoreline will occur to make up sand volume needed for the higher storm berm. The quantity of material required to re-establish the nearshore slope must come from erosion of the shore (assuming longshore littoral transport in and out of the shoreline is equal). Bruun developed an equation to estimate shoreline recession, X, resulting from SLR.
X = S L / (h + B) Where S is sea level rise, L is the width of the active profile (distance from depth of closure (B) to top of berm) and h is elevation of berm. In this case, L = 1,100 ft, h = 7 ft, and B = 23 ft. The resulting shoreline recession varies from 0.3 ft/yr, to 0.6 ft/yr, to 1.6 ft/yr for historical, modified-NRC Curve 1, and modified-NRC Curve 3 rates, respectively. 4. GRANDUC Simulations With Sea Level Rise
Sea level rise-adjusted shoreline erosion rates and sea level rise-adjusted storm input parameters were applied to GRANDUC for various SLR cases, with and without beach project, and output was compared with the selected plan output. Cost levels and interest rates were kept consistent with those of the initial plan selection analysis. Instead of the gradual increase of sea level as shown in Figure 1, these GRANDUC runs assumed a simplified, but worse-case scenario in that the erosion rates and storm response files were stepped immediately to the full extent of SLR. A range of total SLR values were tested. These values included 0.8’ and 2.2’ which correspond to modified-NRC Curves 1 and 3, respectively. Results are shown below in tabular and graphic form (see Table D:2 - 2 and Figure D:2 - 3)
The economic values, both costs and estimated damages over the period of analysis, are discounted to the present value using the same interest rate for all conditions. The amounts calculated in the GRANDUC model and shown in the comparative tables represent the accumulated present value of all amounts over the period of analysis. These values are valid for comparison purposes. In the feasibility report, however, values are converted to average annual equivalent amounts. The relative comparison of alternative SLR scenarios remains the same with both approaches. As present-worth economics is used in GRANDUC analyses, the worse-case scenario economics results are much more extreme compared to the present-worth results of a SLR that occurs gradually over 50 years.
Results show that the net benefits of a shoreline protection project increase as sea level
rises. With any degree of SLR the without-project damages are on average six-times the with-project damages. For a SLR from 0.4 ft (historical projection) to 0.8 ft (modified-NRC Curve 1) the without-project damages increase $153 M while the with-project damages increase only $22 M. Estimated increase in with-project costs for the same SLR comes to about $19 M. Although costs increase as the renourishment volume increases with 0.8 ft of SLR, the damages prevented are about eight-times greater than the cost increase.
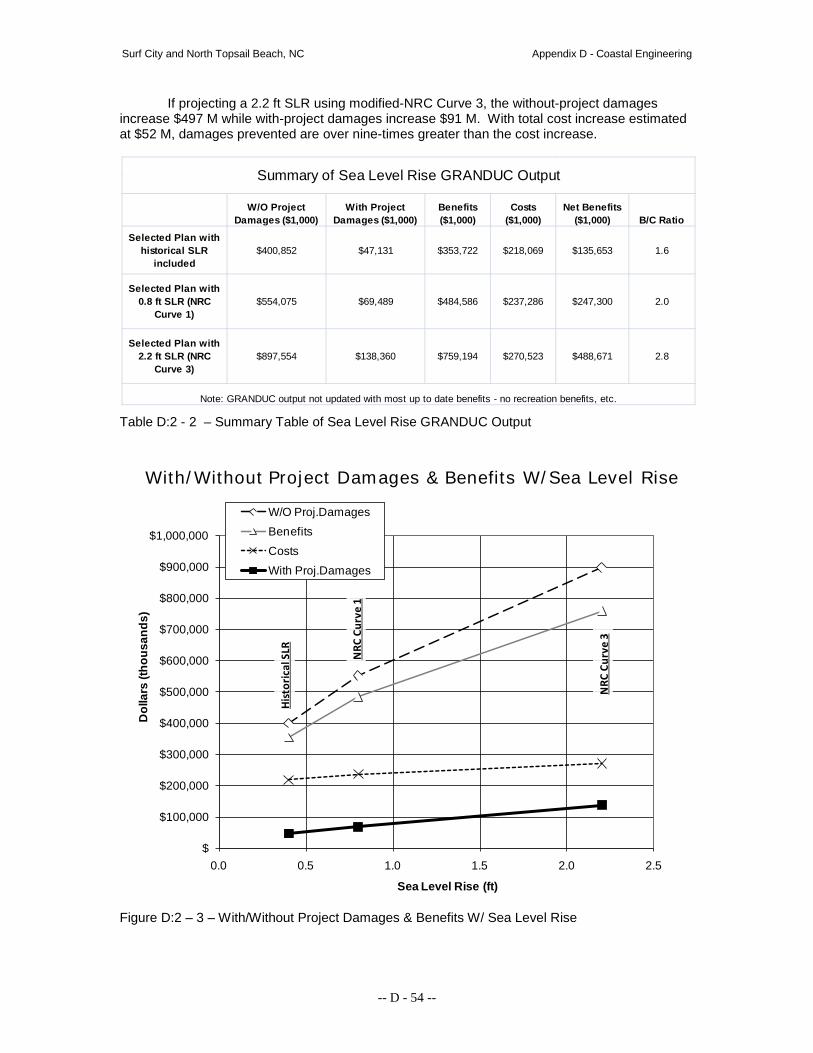
Surf City and North Topsail Beach, NC Appendix D - Coastal Engineering
-- D - 54 --
If projecting a 2.2 ft SLR using modified-NRC Curve 3, the without-project damages increase $497 M while with-project damages increase $91 M. With total cost increase estimated at $52 M, damages prevented are over nine-times greater than the cost increase.
Table D:2 - 2 – Summary Table of Sea Level Rise GRANDUC Output
Figure D:2 – 3 – With/Without Project Damages & Benefits W/ Sea Level Rise
W/O Project Damages ($1,000)
With Project Damages ($1,000)
Benefits ($1,000)
Costs ($1,000)
Net Benefits ($1,000) B/C Ratio
Selected Plan with historical SLR
included$400,852 $47,131 $353,722 $218,069 $135,653 1.6
Selected Plan with 0.8 ft SLR (NRC
Curve 1)$554,075 $69,489 $484,586 $237,286 $247,300 2.0
Selected Plan with 2.2 ft SLR (NRC
Curve 3)$897,554 $138,360 $759,194 $270,523 $488,671 2.8
Summary of Sea Level Rise GRANDUC Output
Note: GRANDUC output not updated with most up to date benefits - no recreation benefits, etc.
$
$100,000
$200,000
$300,000
$400,000
$500,000
$600,000
$700,000
$800,000
$900,000
$1,000,000
0.0 0.5 1.0 1.5 2.0 2.5
Dol
lars
(tho
usan
ds)
Sea Level Rise (ft)
W/O Proj.DamagesBenefitsCostsWith Proj.Damages
His
tori
cal S
LR NRC
Curv
e 1
NRC
Curv
e 3
With/Without Project Damages & Benefits W/Sea Level Rise
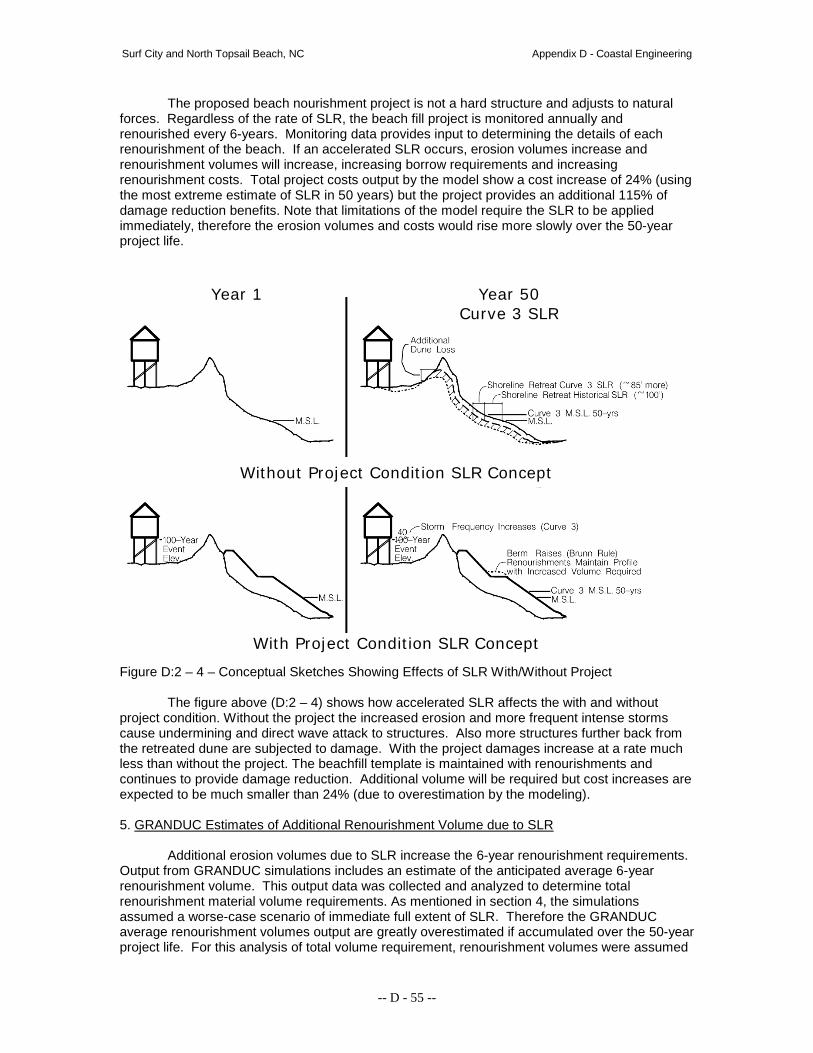
Surf City and North Topsail Beach, NC Appendix D - Coastal Engineering
-- D - 55 --
The proposed beach nourishment project is not a hard structure and adjusts to natural forces. Regardless of the rate of SLR, the beach fill project is monitored annually and renourished every 6-years. Monitoring data provides input to determining the details of each renourishment of the beach. If an accelerated SLR occurs, erosion volumes increase and renourishment volumes will increase, increasing borrow requirements and increasing renourishment costs. Total project costs output by the model show a cost increase of 24% (using the most extreme estimate of SLR in 50 years) but the project provides an additional 115% of damage reduction benefits. Note that limitations of the model require the SLR to be applied immediately, therefore the erosion volumes and costs would rise more slowly over the 50-year project life.
Figure D:2 – 4 – Conceptual Sketches Showing Effects of SLR With/Without Project
The figure above (D:2 – 4) shows how accelerated SLR affects the with and without project condition. Without the project the increased erosion and more frequent intense storms cause undermining and direct wave attack to structures. Also more structures further back from the retreated dune are subjected to damage. With the project damages increase at a rate much less than without the project. The beachfill template is maintained with renourishments and continues to provide damage reduction. Additional volume will be required but cost increases are expected to be much smaller than 24% (due to overestimation by the modeling). 5. GRANDUC Estimates of Additional Renourishment Volume due to SLR
Additional erosion volumes due to SLR increase the 6-year renourishment requirements. Output from GRANDUC simulations includes an estimate of the anticipated average 6-year renourishment volume. This output data was collected and analyzed to determine total renourishment material volume requirements. As mentioned in section 4, the simulations assumed a worse-case scenario of immediate full extent of SLR. Therefore the GRANDUC average renourishment volumes output are greatly overestimated if accumulated over the 50-year project life. For this analysis of total volume requirement, renourishment volumes were assumed
Without Project Condition SLR Concept
Year 1 Year 50 Curve 3 SLR
With Project Condition SLR Concept

Surf City and North Topsail Beach, NC Appendix D - Coastal Engineering
-- D - 56 --
to vary linearly over the 50-year project life (also a more conservative assumption than the SLR projection curves). The initial renourishment volume is assumed to be from historical SLR and increases linearly until reaching the average renourishment volume for that scenario of SLR (see Figure D:2 - 5).
Figure D:2 – 5 – SLR Effects on 6-yr Renourishment Volume Requirements During Project Life
Estimated increase in total cumulative renourishment volume requirements range from an increase of about 2.6 MCY for SLR of 0.8 ft to an increase of about 7.2 MCY for SLR of 2.2 ft. Discussion of the effects of the increase of volume requirements can be found in the main report. References: Bruun 1962 Bruun, P.M (1962) Sea-Level Rise as a Cause of Shore Erosion. Journal of Coastal Engineering, vol. 7, no. 1, p. 77-89 National Research Council 1987
Responding to Changes in Sea Level: Engineering Implications. National Academy Press: Washington, D.C. http://www.nap.edu/catalog.php?record_id=1006
U.S. Army Corps of Engineers, Engineering Circular, EC1165-2-211
Water Resource Policies and Authorities Incorporating Sea-Level Change Considerations in Civil Works Programs – 1 July 2009
2.5
2.7
2.9
3.1
3.3
3.5
3.7
3.9
4.1
4.3
2014 2062
MCY
Year
SLR Effects on Renourishment Volume Requirements During Project Life
SLR 2.2 ft
SLR 0.8 ft
Historical
Curve 3
Curve 1

Surf City and North Topsail Beach, NC Appendix D - Coastal Engineering
-- D - 57 --
Addendum D:3 Dredging Research Program, Storm Surge Database
and Recent Hurricane Modeling 1. Introduction The tropical storm database, consisting of surge elevation and current hydrographs corresponding to selected WIS and nearshore stations along the east and Gulf coasts of the United States and Puerto Rico, was developed as part of the Dredging Research Program (Scheffner and others, 1994). The database was constructed by numerically simulating 134 historically based hurricanes that have impacted the eastern and Gulf coasts of the United States during the period 1890 to 1990. The source of data for these simulations is the National Oceanic and Atmospheric Administration’s National Hurricane Centers HURDAT (HURricane DATabase), described by Jarvinen, Neumann, and Davis (1988). Wave Information Study (WIS) stations were utilized for storm surge data. Significant tropical events were extracted from the database based on storm surge values exceeding select threshold conditions. For the 100-plus years of coverage, 37 events were identified using a minimum storm surge threshold of 1 ft. In addition to the tropical storm surge database, extratropical storm surge values were calculated for the same locations for the dates from 1976 to 1993. Instead of the storm specific time series, a continuous hourly time series was developed for the non-tropical season times of the year (September through March). Discrete event time series were extracted from the continuous time series using a combination of storm surge and wave height threshold criteria along with visual analysis to identify the start/stop times. There were 23 extratropical events identified over the 16-years of data coverage. 2. Recent Hurricane Storm Surge Modeling The magnitude of the recent hurricanes to impact North Carolina since the mid-1990’s required the storm surge database to be updated. Generation of hurricane storm surge values required two major tasks, each using a numerical model. In the first task, hurricane-induced wind and atmospheric pressure fields are generated to replicate those hurricanes (Bertha, Fran, Dennis, Floyd, Bonnie and Irene) that have impacted the study area. Using these wind and pressure fields, storm-surge events are simulated in the second task using a long-wave hydrodynamic model to obtain water-surface levels. Wind and Atmospheric Pressure Model The Planetary Boundary Layer (PBL) wind field model was selected for simulating hurricane-generated wind and atmospheric pressure fields. The PBL hurricane wind model requires a series of “snapshots” for input consisting of a set of meteorological storm parameters defining the storm at various stages in its development or at particular times during its life. These parameters include latitude and longitude of the storm’s eye, track direction and forward speed measured at the eye, radius to maximum winds, central and peripheral atmospheric pressures, and an estimate of the geostrophic wind speed and direction. Some meteorological storm parameters were obtained from the hurricane database developed by the National Oceanic and Atmospheric Administration (NOAA)’s National Hurricane Center (NHC). This database summarizes all hurricanes and tropical storms that occurred in the North Atlantic Ocean over the 104-year period from 1886 through 1989. Information contained in this database is provided at 0000, 0600, 1200, and 1800 hr Greenwich Mean Time (GMT) and includes latitude and longitude of the storm, central pressure, and maximum wind speed. Radius to maximum winds is approximated using a function that incorporates the maximum wind speed and atmospheric pressure anomaly. Track directions and forward speeds required by the PBL model are approximated hourly, using cubic

Surf City and North Topsail Beach, NC Appendix D - Coastal Engineering
-- D - 58 --
spline interpolation technique, from the storm’s 6 hr latitudinal and longitudinal positions provided in the database. Hourly wind and atmospheric pressure fields are computed for each snapshot and interpolated using a nonlinear blending algorithm that produces a smooth transition from one snapshot to the next. Hourly wind and pressure fields are then interpolated from the PBL grid onto the hydrodynamic grid and subsequently stored for use by the hydrodynamic model. Storm Surge Model The ADvanced CIRCulation (ADCIRC) numerical model was chosen for simulating the long-wave hydrodynamic processes in the study area. Imposing the wind and atmospheric pressure fields computed with the PBL model, the ADCIRC model can accurately replicate hurricane-induced storm-surge levels. The ADCIRC model was developed in the USACE Dredging Research Program (DRP) as a family of two-and three-dimensional finite element-based models (Luettich, Westerink, and Scheffner 1992; Westerink et al. 1992). ADCIRC is a finite element long-wave hydrodynamic model applied for simulating water-surface elevation and circulation over the entire model domain as a function of tidal forcing, freshwater inflow, wave stress forcing, and wind forcing. The finite element formulation has the advantage of great flexibility in resolution over the calculation domain. Coarse resolution can be specified in areas distant from the local region of interest, and fine resolution can be specified locally to meet project requirements. For instance, channels and structures can be defined for accurate calculation of flow through and around them. The basis for the model bathymetry was an ADCIRC grid developed by the Corps of Engineers Waterways Experimental Station for the North Atlantic Ocean and the East Coast of the United States. The grid was modified to include only the areas of interest for this project. A finite element mesh was developed for the modeled area, as shown in Figure D:3 - 1. The recent storms (Bertha, Fran, Dennis, Floyd, Bonnie and Irene) were simulated with the storm-surge model. Starting and ending times of each storm simulation corresponds to the first and last entry contained in the NHC database for that particular storm. Furthermore, each storm-surge simulation began with the hurricane residing at its initial position listed in the database and concluded at its ending position. Thus, each simulation began when the hurricane was far away from the study area. For all hurricanes, a temporal “ramp” was used to slowly increase, over a 1-day period, wind stresses and pressure gradients from zero to their measured intensity. Using this ramp eliminates spurious modes of oscillation caused by suddenly imposing full-force winds and pressure gradients on the flow field. All storm-surge simulations were performed independently of tidal action, eliminating the task of extracting surge levels from a time-series of combined tide-and surge-induced water-surface elevations. Figure D:3 - 2 displays surge values at select output locations for the Hurricane Fran simulation. Astronomical tide conditions were generated for each event using NOS derived tidal constituents at Triple S Pier and combined with storm- surge values to produce a Total Water Level (TWL) time series. The TWL served as input into SBEACH for storm-induced beach profile response modeling.

Surf City and North Topsail Beach, NC Appendix D - Coastal Engineering
-- D - 59 --
Figure D:3 – 1 - ADCIRC Model Domain
Figure D:3 – 2 - ADCIRC Model Output for Hurricane Fran Simulation

Surf City and North Topsail Beach, NC Appendix D - Coastal Engineering
-- D - 60 --
Storm-surge elevations computed in this task can be considered as approximations of the historical events. Although the frequencies associated with their maximum surge may be considered relatively accurate, the value of the peak surge may not correspond to historically observed surge elevations. The hydrographs should therefore not be considered hindcast of the historical events due to the fact that the hurricane parameters estimated from the storm database are only approximate; all information necessary to numerically simulate each event is unknown and has not been calibrated. For example, values of central pressure, radius to maximum winds, and far-field pressure are not known and were estimated from available data or observations. Because little data exist for the earlier storms, a consistent approach for selecting storm parameters was developed. This approach may not produce an accurate surge elevation for a particular event; however, it is felt that the final full population of storm data from which storm statistics are computed is representative of the range of historical events and should produce reliable and accurate hurricane stage-frequency relationships.

Surf City and North Topsail Beach, NC Appendix D - Coastal Engineering
-- D - 61 --
Addendum D:4 Overview of EST Process
This addendum provides with greater detail input and output from the Empirical Simulation Technique (EST) analysis (Scheffner and Borgman, 1992) used to develop multiple life-cycle simulations of storm activity and the effects associated with each simulated event. SBEACH output reports contain narrative of storm input and beach response for various parameters. A Matlab routine reads and parses out the significant information from these reports and reformat to input files for EST runs. Examples of SBEACH report and reformatted EST input files are shown in Figures D:4 - 1 and D:4 - 2 below. The output from the EST program includes frequency analysis of each of the 11 response parameters captured from SBEACH. Of these, seven were ultimately processed and used to generate the storm files for use in the GRANDUC process. A Matlab routine took each of the 11 output files from EST for each typical profile and consolidated them into a single file (for each design template) with mean values of the following parameters 1) landward most occurrence of a 0.5’ vertical erosion, 2) landward most occurrence of a 2.0’ vertical erosion, 3) landward most occurrence of a 4.0’ vertical erosion, 4) surge, 5) setup, 6) dune elevation reduction and 7) erosion volume. These mean values represented frequencies of 1, 5, 10, 25, 50, 100, and 500-yrs. The consolidated files are then used to generate 1000, 50-yr storm simulations (see GRANDUC documentation). See Figure D:4 - 3 for example consolidated file.

Surf City and North Topsail Beach, NC Appendix D - Coastal Engineering
-- D - 62 --
Report for run: Reach: NTB-7_1550_DUNE Storm: 19990916PT Report Project: Untitled Reach: NTB-7_1550_DUNE Storm: 19990916PT MODEL CONFIGURATION INPUT UNITS (SI=1, AMERICAN CUST.=2): 2 NUMBER OF CALCULATION CELLS: 672 GRID TYPE (CONSTANT=0, VARIABLE=1): 1 NUMBER OF GRID CELL REGIONS: 2 NUMBER CELLS AND CELL WIDTH IN REGION 1: 500, 5.0 NUMBER CELLS AND CELL WIDTH IN REGION 2: 172, 20.0 NUMBER OF TIME STEPS AND VALUE OF TIME STEP IN MINUTES: 2821, 1.0 NO COMPARSION WITH MEASURED PROFILE. PROFILE ELEVATION CONTOUR 1: 0.00 PROFILE ELEVATION CONTOUR 2: 2.10 PROFILE ELEVATION CONTOUR 3: 7.00 PROFILE EROSION DEPTH 1: 0.50 PROFILE EROSION DEPTH 2: 2.00 PROFILE EROSION DEPTH 3: 4.00 REFERENCE ELEVATION: 2.10 TRANSPORT RATE COEFFICIENT (m^4/N): 1.75E-6 COEFFICIENT FOR SLOPE DEPENDENT TERM (m^2/s): 0.0020 TRANSPORT RATE DECAY COEFFICIENT MULTIPLIER: 0.50 WATER TEMPERATURE IN DEGREES C : 20.0 WAVE TYPE (MONOCHROMATIC=1, IRREGULAR=2): 2 WAVE HEIGHT AND PERIOD INPUT (CONSTANT=0, VARIABLE=1): 1 TIME STEP OF VARIABLE WAVE HEIGHT AND PERIOD INPUT IN MINUTES: 60.0 WAVE ANGLE INPUT (CONSTANT=0, VARIABLE=1): 0 CONSTANT WAVE ANGLE: 0.0 WATER DEPTH OF INPUT WAVES (DEEP WATER = 0.0): 0.0 SEED VALUE FOR WAVE HEIGHT RANDOMIZER AND % VARIABILITY: 3626, 20.0 TOTAL WATER ELEVATION INPUT (CONSTANT=0, VARIABLE=1): 1 TIME STEP OF VARIABLE TOTAL WATER ELEVATION INPUT IN MINUTES: 60.0 WIND SPEED AND ANGLE INPUT (CONSTANT=0, VARIABLE=1): 0 CONSTANT WIND SPEED AND ANGLE: 0.0, 0.0 TYPE OF INPUT PROFILE (ARBITRARY=1, SCHEMATIZED=2): 1 DEPTH CORRESPONDING TO LANDWARD END OF SURF ZONE: 1.00 EFFECTIVE GRAIN SIZE DIAMETER IN MILLIMETERS: 0.35 MAXIMUM PROFILE SLOPE PRIOR TO AVALANCHING IN DEGREES: 45.0 NO BEACH FILL IS PRESENT. NO SEAWALL IS PRESENT. NO HARD BOTTOM IS PRESENT. _______________________________________________________________________________ COMPUTED RESULTS DIFFERENCE IN TOTAL VOLUME BETWEEN FINAL AND INITIAL PROFILES: -9.8 yd^3/ft MAXIMUM VALUE OF WATER ELEVATION + SETUP FOR SIMULATION 16.22 ft TIME STEP AND POSITION ON PROFILE AT WHICH MAXIMUM VALUE OF WATER ELEVATION + SETUP OCCURRED 1918, -883.0 ft MAXIMUM ESTIMATED RUNUP ELEVATION: 21.92 ft (REFERENCED TO VERTICAL DATUM) POSITION OF LANDWARD MOST OCCURRENCE OF A 0.50 ft EROSION DEPTH: 172.0 ft DISTANCE FROM POSITION OF REFERENCE ELEVATION ON INITIAL PROFILE TO POSITION OF LANDWARD MOST OCCURRENCE OF A 0.50 ft EROSION DEPTH: 396.5 ft POSITION OF LANDWARD MOST OCCURRENCE OF A 2.00 ft EROSION DEPTH: 317.0 ft DISTANCE FROM POSITION OF REFERENCE ELEVATION ON INITIAL PROFILE TO POSITION OF LANDWARD MOST OCCURRENCE OF A 2.00 ft EROSION DEPTH: 251.5 ft POSITION OF LANDWARD MOST OCCURRENCE OF A 4.00 ft EROSION DEPTH: 327.0 ft DISTANCE FROM POSITION OF REFERENCE ELEVATION ON INITIAL PROFILE TO POSITION OF LANDWARD MOST OCCURRENCE OF A 4.00 ft EROSION DEPTH: 241.5 ft MAXIMUM RECESSION OF THE 0.00 ft ELEVATION CONTOUR: 19.93 ft MAXIMUM RECESSION OF THE 2.10 ft ELEVATION CONTOUR: 29 97 ft
Figure D:4 - 1. Example SBEACH output.
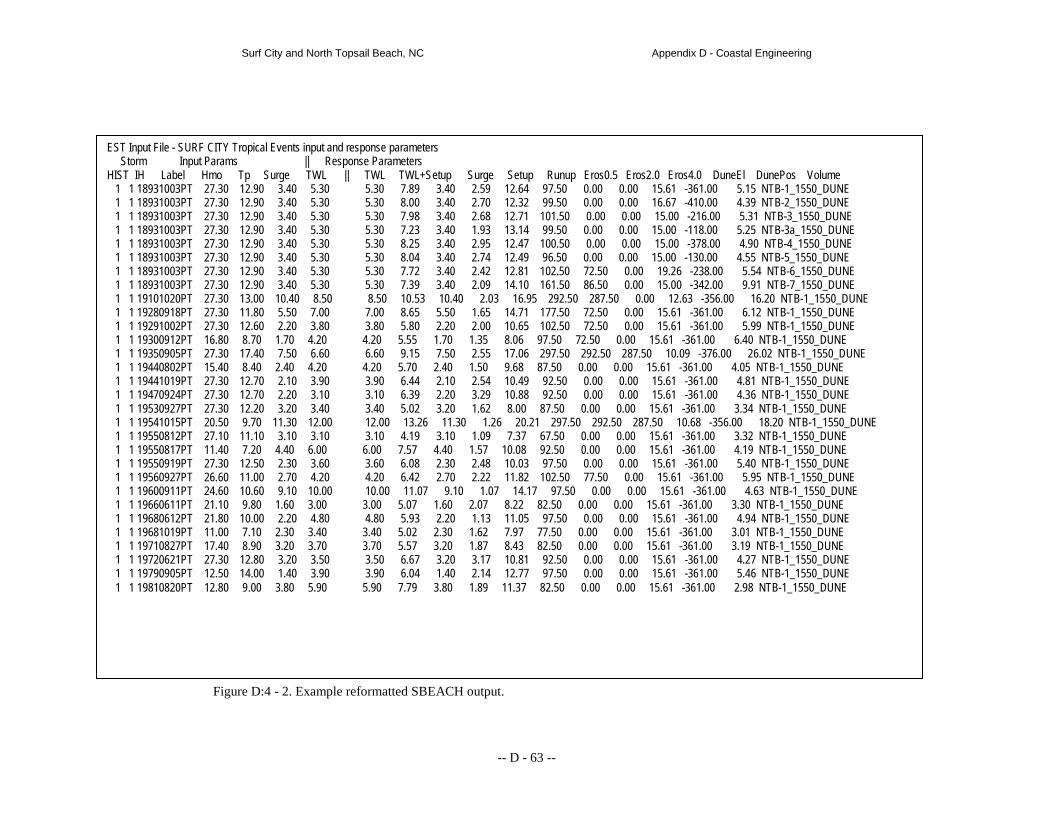
Surf City and North Topsail Beach, NC Appendix D - Coastal Engineering
-- D - 63 --
EST Input File - SURF CITY Tropical Events input and response parameters Storm Input Params || Response Parameters HIST IH Label Hmo Tp Surge TWL || TWL TWL+Setup Surge Setup Runup Eros0.5 Eros2.0 Eros4.0 DuneEl DunePos Volume 1 1 18931003PT 27.30 12.90 3.40 5.30 5.30 7.89 3.40 2.59 12.64 97.50 0.00 0.00 15.61 -361.00 5.15 NTB-1_1550_DUNE 1 1 18931003PT 27.30 12.90 3.40 5.30 5.30 8.00 3.40 2.70 12.32 99.50 0.00 0.00 16.67 -410.00 4.39 NTB-2_1550_DUNE 1 1 18931003PT 27.30 12.90 3.40 5.30 5.30 7.98 3.40 2.68 12.71 101.50 0.00 0.00 15.00 -216.00 5.31 NTB-3_1550_DUNE 1 1 18931003PT 27.30 12.90 3.40 5.30 5.30 7.23 3.40 1.93 13.14 99.50 0.00 0.00 15.00 -118.00 5.25 NTB-3a_1550_DUNE 1 1 18931003PT 27.30 12.90 3.40 5.30 5.30 8.25 3.40 2.95 12.47 100.50 0.00 0.00 15.00 -378.00 4.90 NTB-4_1550_DUNE 1 1 18931003PT 27.30 12.90 3.40 5.30 5.30 8.04 3.40 2.74 12.49 96.50 0.00 0.00 15.00 -130.00 4.55 NTB-5_1550_DUNE 1 1 18931003PT 27.30 12.90 3.40 5.30 5.30 7.72 3.40 2.42 12.81 102.50 72.50 0.00 19.26 -238.00 5.54 NTB-6_1550_DUNE 1 1 18931003PT 27.30 12.90 3.40 5.30 5.30 7.39 3.40 2.09 14.10 161.50 86.50 0.00 15.00 -342.00 9.91 NTB-7_1550_DUNE 1 1 19101020PT 27.30 13.00 10.40 8.50 8.50 10.53 10.40 2.03 16.95 292.50 287.50 0.00 12.63 -356.00 16.20 NTB-1_1550_DUNE 1 1 19280918PT 27.30 11.80 5.50 7.00 7.00 8.65 5.50 1.65 14.71 177.50 72.50 0.00 15.61 -361.00 6.12 NTB-1_1550_DUNE 1 1 19291002PT 27.30 12.60 2.20 3.80 3.80 5.80 2.20 2.00 10.65 102.50 72.50 0.00 15.61 -361.00 5.99 NTB-1_1550_DUNE 1 1 19300912PT 16.80 8.70 1.70 4.20 4.20 5.55 1.70 1.35 8.06 97.50 72.50 0.00 15.61 -361.00 6.40 NTB-1_1550_DUNE 1 1 19350905PT 27.30 17.40 7.50 6.60 6.60 9.15 7.50 2.55 17.06 297.50 292.50 287.50 10.09 -376.00 26.02 NTB-1_1550_DUNE 1 1 19440802PT 15.40 8.40 2.40 4.20 4.20 5.70 2.40 1.50 9.68 87.50 0.00 0.00 15.61 -361.00 4.05 NTB-1_1550_DUNE 1 1 19441019PT 27.30 12.70 2.10 3.90 3.90 6.44 2.10 2.54 10.49 92.50 0.00 0.00 15.61 -361.00 4.81 NTB-1_1550_DUNE 1 1 19470924PT 27.30 12.70 2.20 3.10 3.10 6.39 2.20 3.29 10.88 92.50 0.00 0.00 15.61 -361.00 4.36 NTB-1_1550_DUNE 1 1 19530927PT 27.30 12.20 3.20 3.40 3.40 5.02 3.20 1.62 8.00 87.50 0.00 0.00 15.61 -361.00 3.34 NTB-1_1550_DUNE 1 1 19541015PT 20.50 9.70 11.30 12.00 12.00 13.26 11.30 1.26 20.21 297.50 292.50 287.50 10.68 -356.00 18.20 NTB-1_1550_DUNE 1 1 19550812PT 27.10 11.10 3.10 3.10 3.10 4.19 3.10 1.09 7.37 67.50 0.00 0.00 15.61 -361.00 3.32 NTB-1_1550_DUNE 1 1 19550817PT 11.40 7.20 4.40 6.00 6.00 7.57 4.40 1.57 10.08 92.50 0.00 0.00 15.61 -361.00 4.19 NTB-1_1550_DUNE 1 1 19550919PT 27.30 12.50 2.30 3.60 3.60 6.08 2.30 2.48 10.03 97.50 0.00 0.00 15.61 -361.00 5.40 NTB-1_1550_DUNE 1 1 19560927PT 26.60 11.00 2.70 4.20 4.20 6.42 2.70 2.22 11.82 102.50 77.50 0.00 15.61 -361.00 5.95 NTB-1_1550_DUNE 1 1 19600911PT 24.60 10.60 9.10 10.00 10.00 11.07 9.10 1.07 14.17 97.50 0.00 0.00 15.61 -361.00 4.63 NTB-1_1550_DUNE 1 1 19660611PT 21.10 9.80 1.60 3.00 3.00 5.07 1.60 2.07 8.22 82.50 0.00 0.00 15.61 -361.00 3.30 NTB-1_1550_DUNE 1 1 19680612PT 21.80 10.00 2.20 4.80 4.80 5.93 2.20 1.13 11.05 97.50 0.00 0.00 15.61 -361.00 4.94 NTB-1_1550_DUNE 1 1 19681019PT 11.00 7.10 2.30 3.40 3.40 5.02 2.30 1.62 7.97 77.50 0.00 0.00 15.61 -361.00 3.01 NTB-1_1550_DUNE 1 1 19710827PT 17.40 8.90 3.20 3.70 3.70 5.57 3.20 1.87 8.43 82.50 0.00 0.00 15.61 -361.00 3.19 NTB-1_1550_DUNE 1 1 19720621PT 27.30 12.80 3.20 3.50 3.50 6.67 3.20 3.17 10.81 92.50 0.00 0.00 15.61 -361.00 4.27 NTB-1_1550_DUNE 1 1 19790905PT 12.50 14.00 1.40 3.90 3.90 6.04 1.40 2.14 12.77 97.50 0.00 0.00 15.61 -361.00 5.46 NTB-1_1550_DUNE 1 1 19810820PT 12.80 9.00 3.80 5.90 5.90 7.79 3.80 1.89 11.37 82.50 0.00 0.00 15.61 -361.00 2.98 NTB-1_1550_DUNE
Figure D:4 - 2. Example reformatted SBEACH output.

Surf City and North Topsail Beach, NC Appendix D - Coastal Engineering
-- D -64--
NTB2_1550 Number of Simulations 1000 Simulation Period 50 Average Number of Storms Per Year 1.000000 Shoreline Adjustment Factor HF, LF 9.999999, 9.999999 Long Term Erosion 9.999999 Erosion and Volume Factors - High 4 sum 999.999999, 999.999999 First Erosion Frequency Curve 0.00000 81.59 0.80000 109.15 0.90000 127.46 0.96000 242.25 0.98000 320.38 0.99000 385.83 1.00000 507.24 Second Erosion Frequency Curve 0.00000 0.00 0.80000 0.00 0.90000 0.00 0.96000 61.10 0.98000 274.49 0.99000 432.14 1.00000 687.38 Third Erosion Frequency Curve 0.00000 0.00 0.80000 0.00 0.90000 0.00 0.96000 27.69 0.98000 213.82 0.99000 394.88 1.00000 730.02 Surge Frequency Curve 0.00000 3.11 0.80000 4.55 0.90000 5.68 0.96000 8.05 0.98000 10.12 0.99000 12.16 1.00000 16.33 Setup Frequency Curve 0.00000 1.89 0.80000 2.79 0.90000 2.88 0.96000 2.43 0.98000 2.05 0.99000 1.80 1.00000 1.58 Ground Elevation Frequency Curve 0.00000 16.70 0.80000 16.70 0.90000 16.70 0.96000 15.80 0.98000 12.96 0.99000 10.47 1.00000 5.23 Erosion Volume Frequency Curve 0.00000 2.93 0.80000 5.07 0.90000 6.02 0.96000 9.29 0.98000 15.80 0.99000 22.39 1.00000 36.85
Figure D:4 - 3. Example consolidated EST output.

Surf City and North Topsail Beach, NC Appendix D - Coastal Engineering
-- D -65--
Addendum D:5 Beach Profiles
This addendum displays the surveyed beach profiles and is grouped by the representative profile. The representative profiles were selected based upon the similarity of features such as dune height, berm and nearshore profile. Each representative profile group is displayed in an overview and detailed view.

Surf City and North Topsail Beach, NC Appendix D - Coastal Engineering
-- D -66--
SC-1 Representative Profile based upon profile TI 028 (overview and detail views)

Surf City and North Topsail Beach, NC Appendix D - Coastal Engineering
-- D -67--
SC-2 Representative Profile based upon profile TI 031 (overview and detail views)

Surf City and North Topsail Beach, NC Appendix D - Coastal Engineering
-- D -68--
SC-3 Representative Profile based upon profile TI 036 (overview and detail views)

Surf City and North Topsail Beach, NC Appendix D - Coastal Engineering
-- D -69--
SC-4 Representative Profile based upon profile TI 039 (overview and detail views)

Surf City and North Topsail Beach, NC Appendix D - Coastal Engineering
-- D -70--
SC-5 Representative Profile based upon profile TI 045 (overview and detail views)

Surf City and North Topsail Beach, NC Appendix D - Coastal Engineering
-- D -71--
SC-6 Representative Profile based upon profile TI 048 (overview and detail views)

Surf City and North Topsail Beach, NC Appendix D - Coastal Engineering
-- D -72--
SC-7 Representative Profile based upon profile TI 053 (overview and detail views)

Surf City and North Topsail Beach, NC Appendix D - Coastal Engineering
-- D -73--
SC-8 Representative Profile based upon profile TI 057 (overview and detail views)

Surf City and North Topsail Beach, NC Appendix D - Coastal Engineering
-- D -74--
NTB-1 Representative Profile based upon profile TI 059 (overview and detail views)

Surf City and North Topsail Beach, NC Appendix D - Coastal Engineering
-- D -75--
NTB-2 Representative Profile based upon profile TI 063 (overview and detail views)

Surf City and North Topsail Beach, NC Appendix D - Coastal Engineering
-- D -76--
NTB-3 Representative Profile based upon profile TI 068 (overview and detail views)

Surf City and North Topsail Beach, NC Appendix D - Coastal Engineering
-- D -77--
NTB-3a Representative Profile based upon profile TI 072 (overview and detail views)

Surf City and North Topsail Beach, NC Appendix D - Coastal Engineering
-- D -78--
NTB-4 Representative Profile based upon profile TI 076 (overview and detail views)