Embed Size (px)
Citation preview
COASTAL COMPARTMENTS, SEDIMENT CELLS AND
VULNERABILITY ASSESSMENT: A Progress Report
Presentation to
WALIS MARINE GROUP
MATT ELIOT AND IAN ELIOTDamara Pty Ltd, Innaloo , WA
19 July 2011
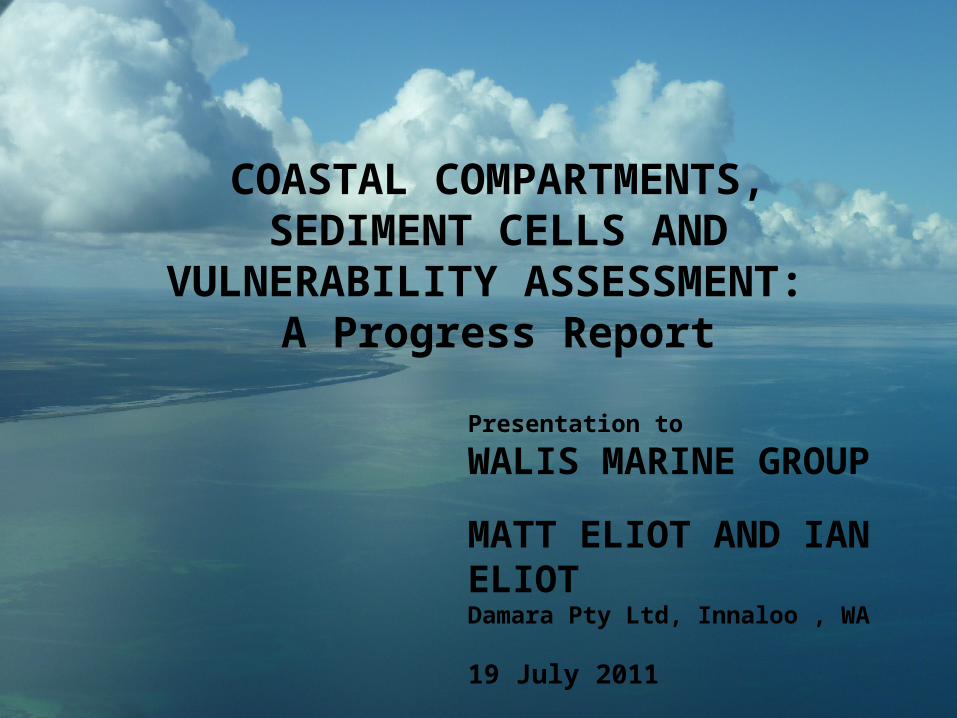
BASIC CONCEPTS
• The project develops a hierarchy of planning units, based on the geologic framework of the coast.
• At the broadest planning levels the planning units comprise a set of discrete coastal compartments determined by geologic boundaries, structures, landforms and coastal aspect together with the landforms they contain.
• At the most detailed planning levels the planning units are identified as sediment cells in which sediments sources, transport pathways and sinks can be clearly defined.
• Together, coastal compartments and sediment cells provide a framework for a variety of applications including:
(a) planning and management of natural resources within the nearshore marine and coastal environment; and
(b) assessment of vulnerability to coastal hazards, climate change and rise in sea level.
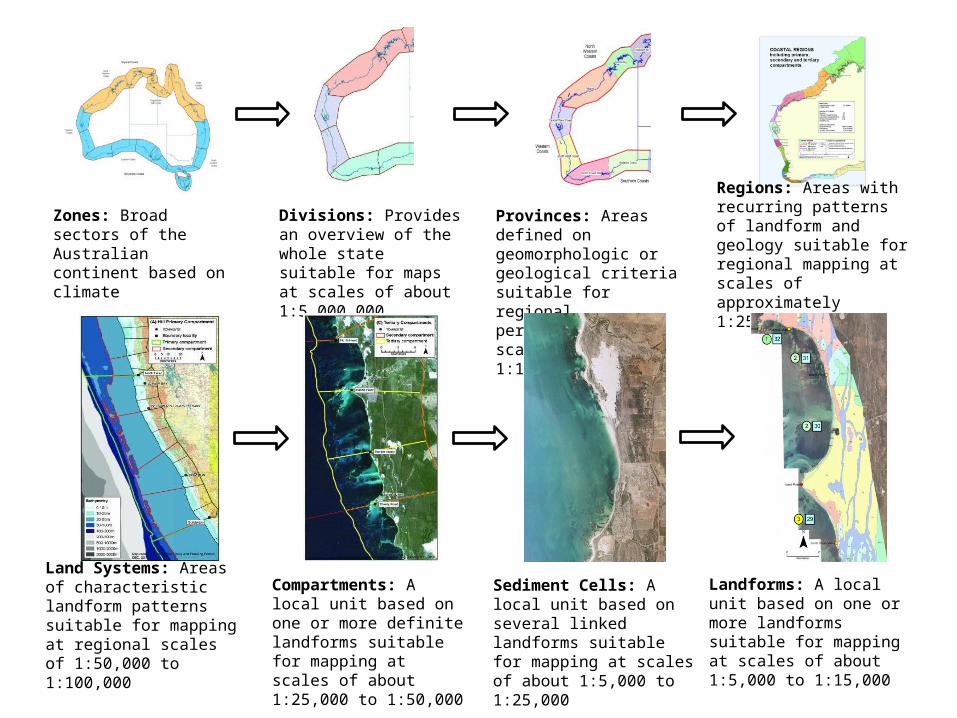
Zones: Broad sectors of the Australian continent based on climate
Divisions: Provides an overview of the whole state suitable for maps at scales of about 1:5,000,000
Provinces: Areas defined on geomorphologic or geological criteria suitable for regional perspectives at scales of about 1:1,000,000
Regions: Areas with recurring patterns of landform and geology suitable for regional mapping at scales of approximately 1:250,000
Land Systems: Areas of characteristic landform patterns suitable for mapping at regional scales of 1:50,000 to 1:100,000
Compartments: A local unit based on one or more definite landforms suitable for mapping at scales of about 1:25,000 to 1:50,000
Landforms: A local unit based on one or more landforms suitable for mapping at scales of about 1:5,000 to 1:15,000
Sediment Cells: A local unit based on several linked landforms suitable for mapping at scales of about 1:5,000 to 1:25,000
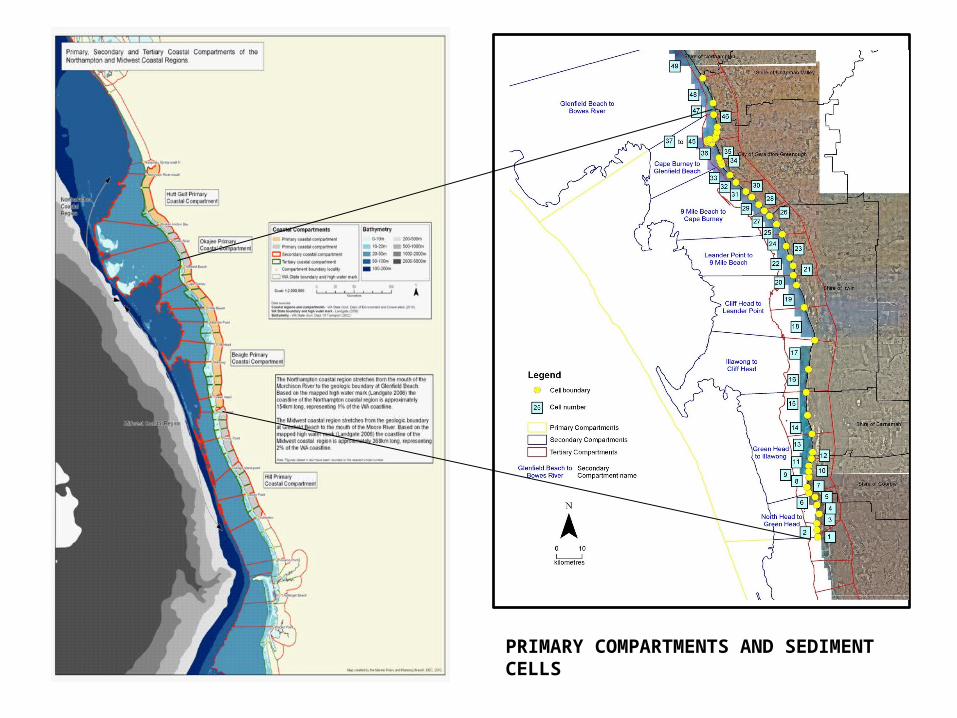
PRIMARY COMPARTMENTS AND SEDIMENT CELLS
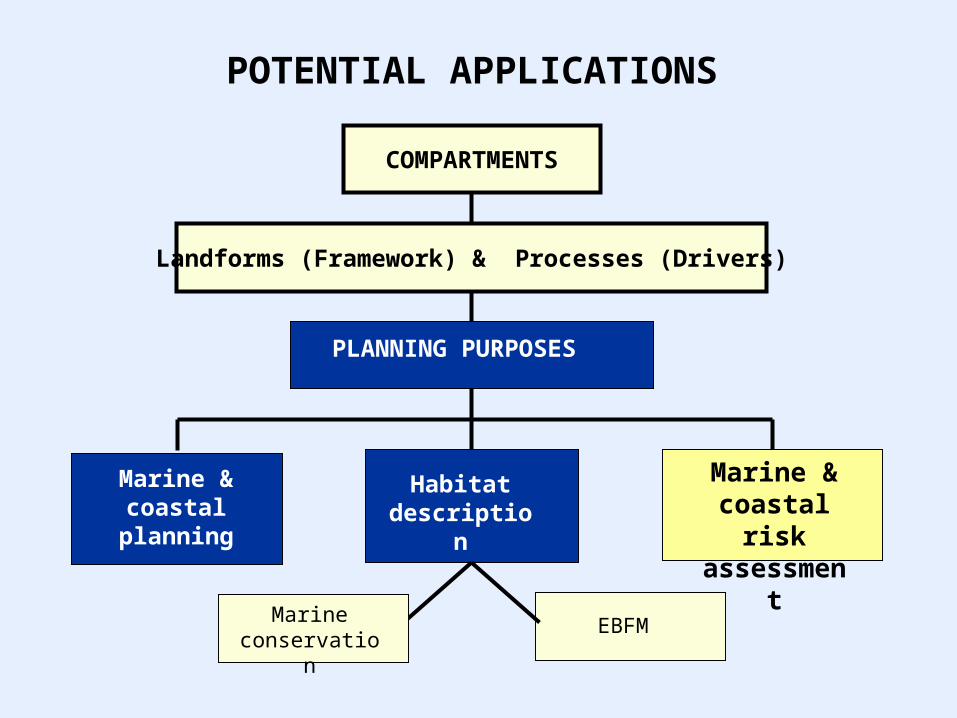
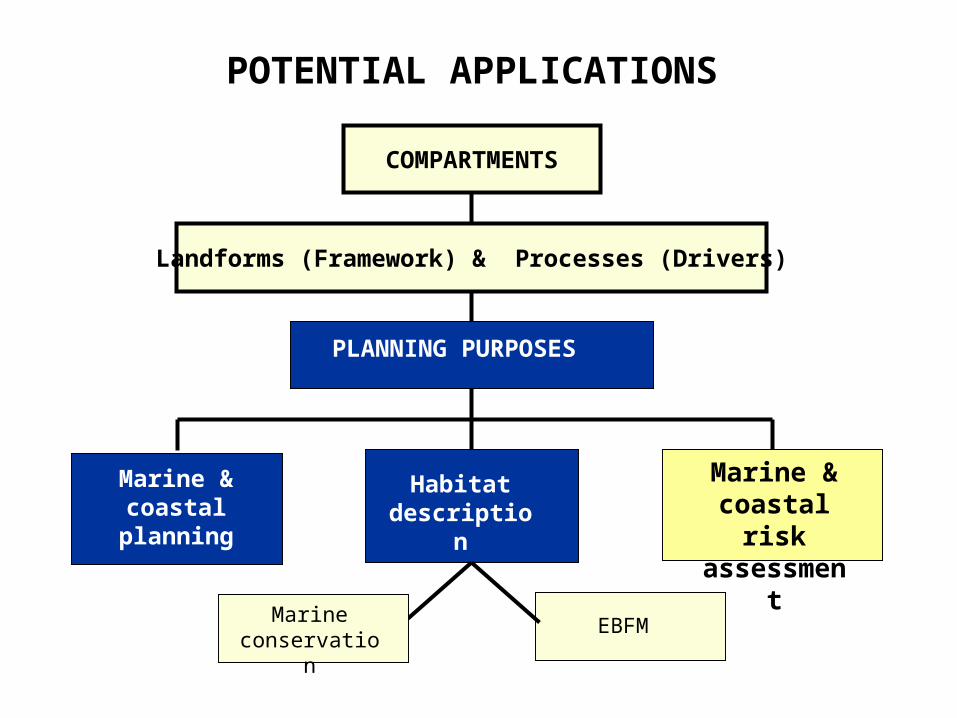
POTENTIAL APPLICATIONS
COMPARTMENTS
Landforms (Framework) & Processes (Drivers)
PLANNING PURPOSES
Marine & coastal
planning
Habitat descriptio
n
Marine & coastal
risk assessme
ntMarine
conservationEBFM
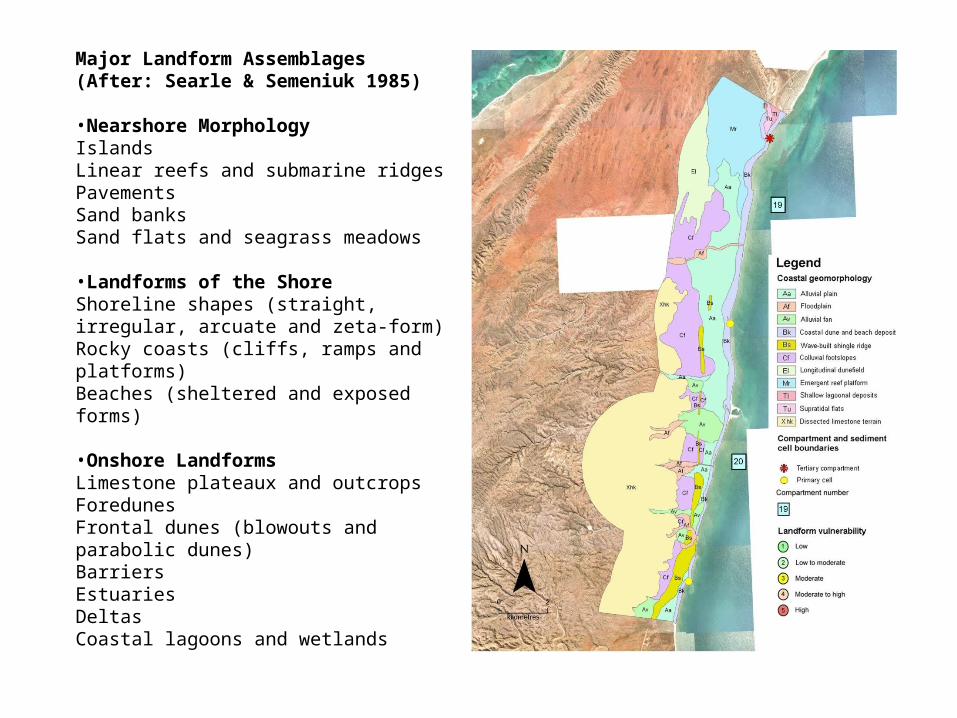
Major Landform Assemblages(After: Searle & Semeniuk 1985)
•Nearshore MorphologyIslandsLinear reefs and submarine ridgesPavementsSand banks Sand flats and seagrass meadows
•Landforms of the Shore Shoreline shapes (straight, irregular, arcuate and zeta-form)Rocky coasts (cliffs, ramps and platforms)Beaches (sheltered and exposed forms)
•Onshore LandformsLimestone plateaux and outcropsForedunes Frontal dunes (blowouts and parabolic dunes)Barriers EstuariesDeltasCoastal lagoons and wetlands
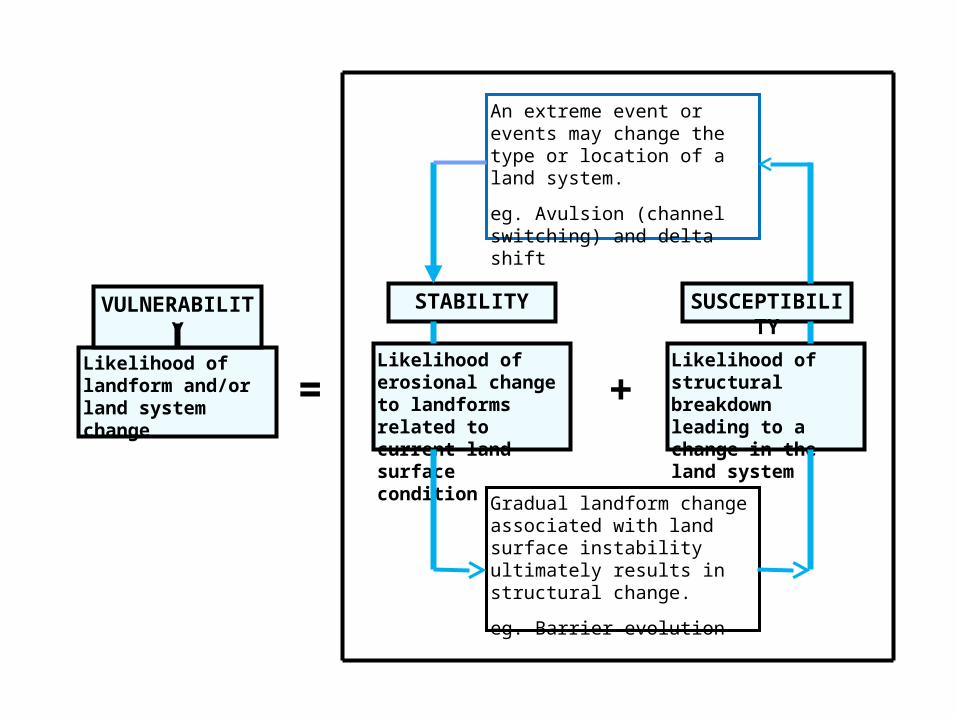
An extreme event or events may change the type or location of a land system.
eg. Avulsion (channel switching) and delta shift
Gradual landform change associated with land surface instability ultimately results in structural change.
eg. Barrier evolution
STABILITY SUSCEPTIBILITY
Likelihood of erosional change to landforms related to current land surface condition
Likelihood of structural breakdown leading to a change in the land system
Likelihood of landform and/or land system change
VULNERABILITY
= +
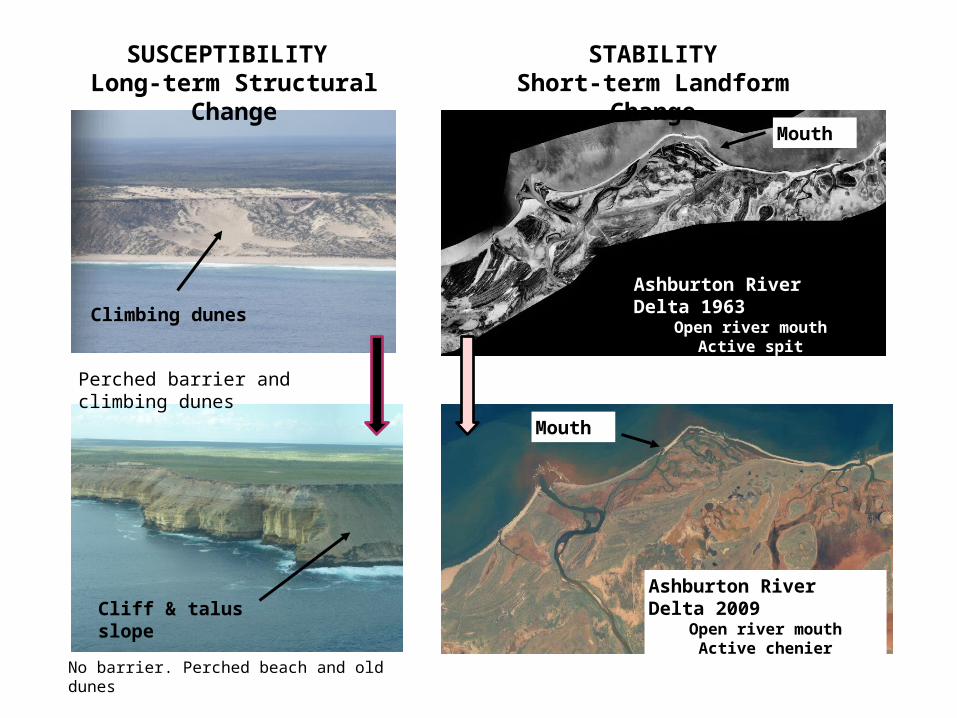
SUSCEPTIBILITY Long-term Structural
Change
Cliff & talus slope
Climbing dunes
Ashburton River Delta 1963
Open river mouthActive spit
Spit
Perched barrier and climbing dunes
No barrier. Perched beach and old dunes
Ashburton River Delta 2009
Open river mouthActive chenier
STABILITYShort-term Landform
ChangeMouth
Mouth
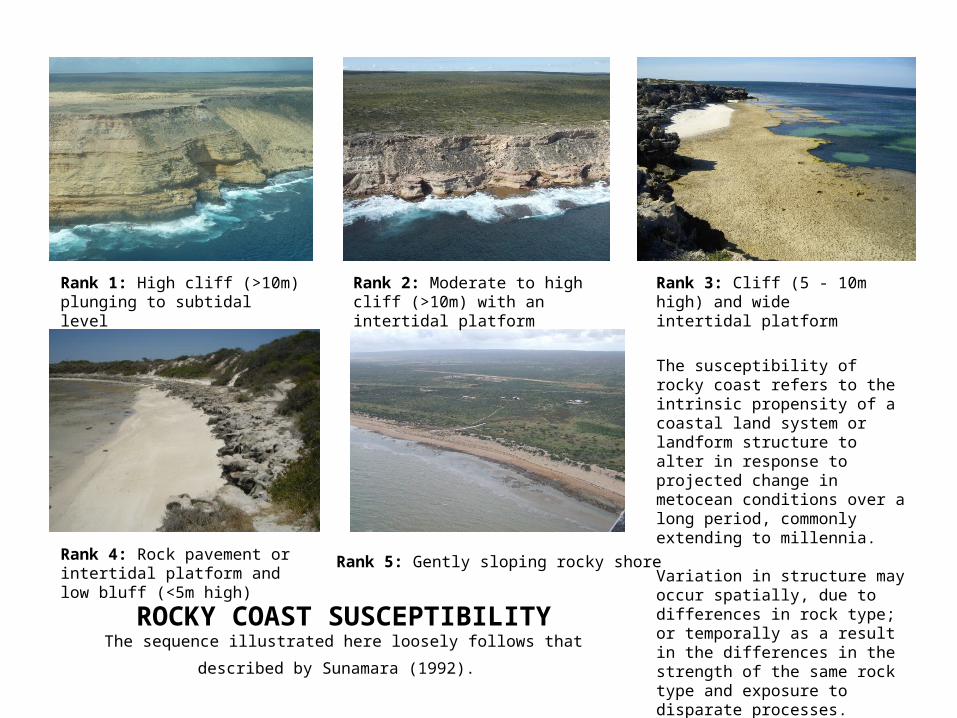
The susceptibility of rocky coast refers to the intrinsic propensity of a coastal land system or landform structure to alter in response to projected change in metocean conditions over a long period, commonly extending to millennia.
Variation in structure may occur spatially, due to differences in rock type; or temporally as a result in the differences in the strength of the same rock type and exposure to disparate processes.
Rank 1: High cliff (>10m) plunging to subtidal level
Rank 2: Moderate to high cliff (>10m) with an intertidal platform
Rank 4: Rock pavement or intertidal platform and low bluff (<5m high)
Rank 3: Cliff (5 - 10m high) and wide intertidal platform
Rank 5: Gently sloping rocky shore
ROCKY COAST SUSCEPTIBILITYThe sequence illustrated here loosely follows that described by
Sunamara (1992).
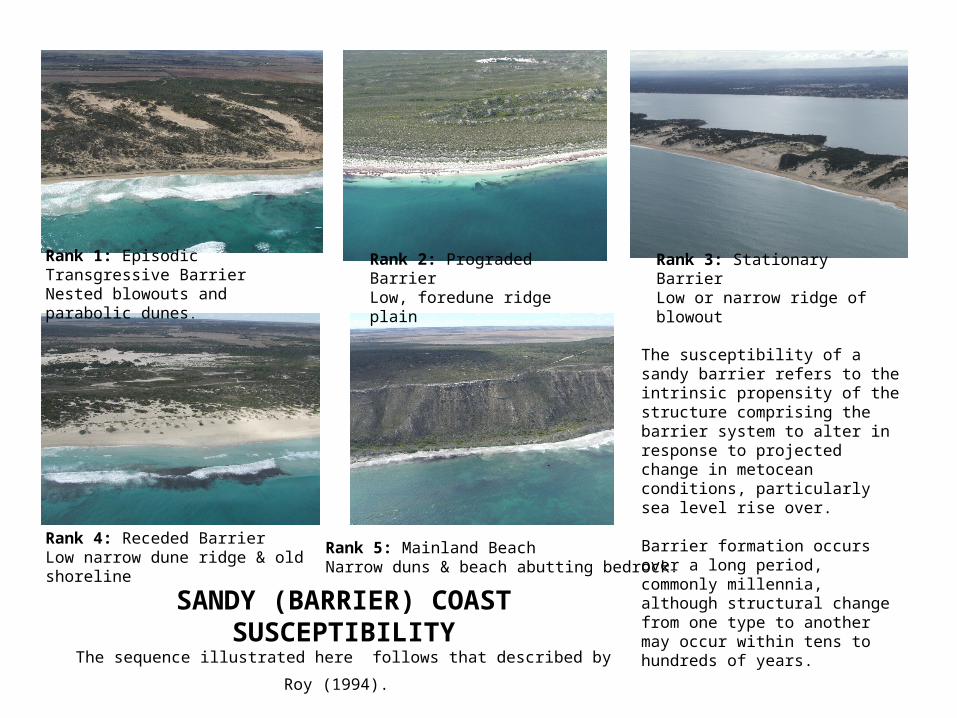
SANDY (BARRIER) COAST SUSCEPTIBILITY
The sequence illustrated here follows that described by Roy (1994).
The susceptibility of a sandy barrier refers to the intrinsic propensity of the structure comprising the barrier system to alter in response to projected change in metocean conditions, particularly sea level rise over.
Barrier formation occurs over a long period, commonly millennia, although structural change from one type to another may occur within tens to hundreds of years.
Rank 1: Episodic Transgressive BarrierNested blowouts and parabolic dunes.
Rank 2: Prograded BarrierLow, foredune ridge plain
Rank 3: Stationary BarrierLow or narrow ridge of blowout
Rank 4: Receded BarrierLow narrow dune ridge & old shoreline
Rank 5: Mainland BeachNarrow duns & beach abutting bedrock.
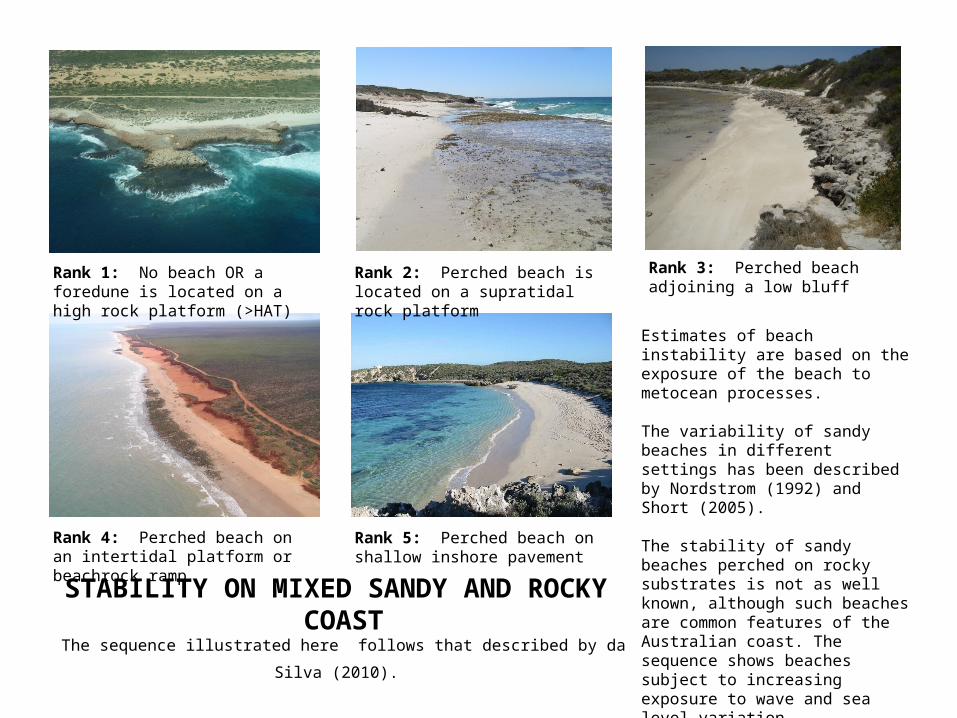
STABILITY ON MIXED SANDY AND ROCKY COAST
The sequence illustrated here follows that described by da Silva
(2010).
Estimates of beach instability are based on the exposure of the beach to metocean processes.
The variability of sandy beaches in different settings has been described by Nordstrom (1992) and Short (2005).
The stability of sandy beaches perched on rocky substrates is not as well known, although such beaches are common features of the Australian coast. The sequence shows beaches subject to increasing exposure to wave and sea level variation.
Rank 1: No beach OR a foredune is located on a high rock platform (>HAT)
Rank 2: Perched beach is located on a supratidal rock platform
Rank 3: Perched beach adjoining a low bluff
Rank 4: Perched beach on an intertidal platform or beachrock ramp
Rank 5: Perched beach on shallow inshore pavement
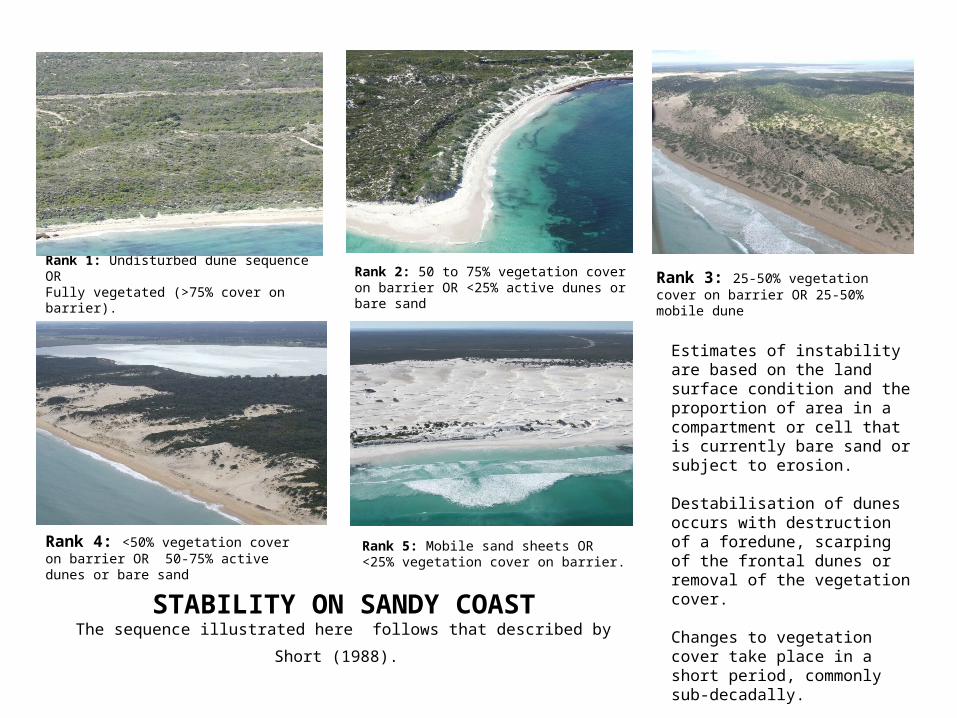
Rank 1: Undisturbed dune sequence OR Fully vegetated (>75% cover on barrier).
Rank 2: 50 to 75% vegetation cover on barrier OR <25% active dunes or bare sand
Rank 3: 25-50% vegetation cover on barrier OR 25-50% mobile dune
Rank 4: <50% vegetation cover on barrier OR 50-75% active dunes or bare sand
Rank 5: Mobile sand sheets OR <25% vegetation cover on barrier.
STABILITY ON SANDY COASTThe sequence illustrated here follows that described by Short (1988).
Estimates of instability are based on the land surface condition and the proportion of area in a compartment or cell that is currently bare sand or subject to erosion.
Destabilisation of dunes occurs with destruction of a foredune, scarping of the frontal dunes or removal of the vegetation cover.
Changes to vegetation cover take place in a short period, commonly sub-decadally.
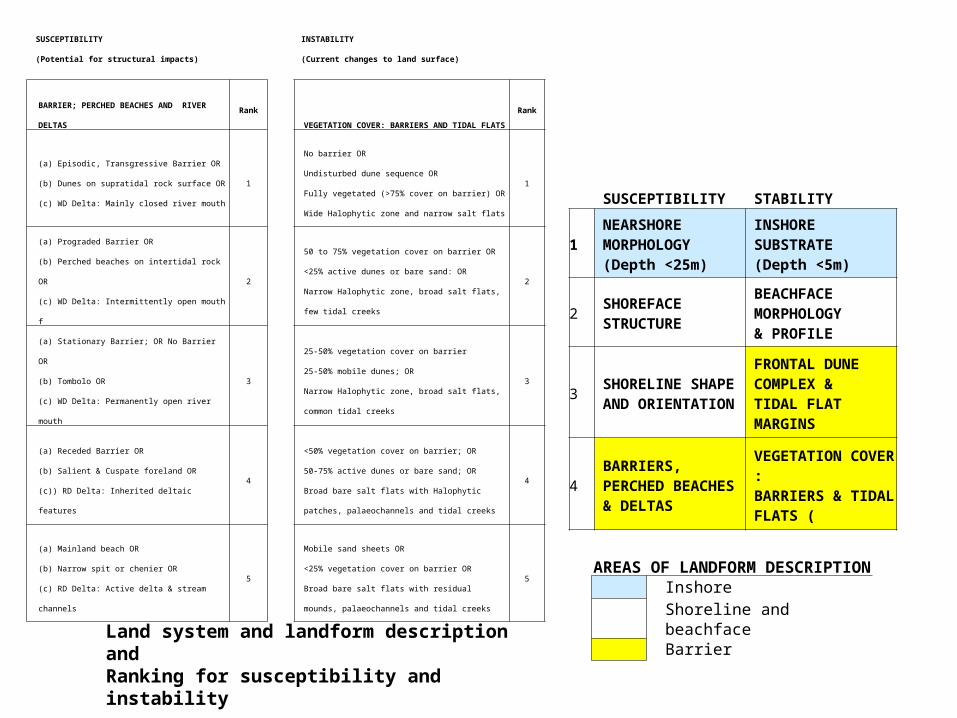
SUSCEPTIBILITY STABILITY
1 NEARSHORE MORPHOLOGY (Depth <25m)
INSHORE SUBSTRATE (Depth <5m)
2 SHOREFACE STRUCTURE
BEACHFACE MORPHOLOGY & PROFILE
3 SHORELINE SHAPE AND ORIENTATION
FRONTAL DUNE COMPLEX &TIDAL FLAT MARGINS
4
BARRIERS, PERCHED BEACHES & DELTAS
VEGETATION COVER :BARRIERS & TIDAL FLATS (
SUSCEPTIBILITY
(Potential for structural impacts)
INSTABILITY
(Current changes to land surface)
BARRIER; PERCHED BEACHES AND RIVER
DELTAS
RankVEGETATION COVER: BARRIERS AND TIDAL
FLATS
Rank
(a) Episodic, Transgressive Barrier OR
(b) Dunes on supratidal rock surface OR
(c) WD Delta: Mainly closed river mouth
1
No barrier OR
Undisturbed dune sequence OR
Fully vegetated (>75% cover on barrier) OR
Wide Halophytic zone and narrow salt flats
1
(a) Prograded Barrier OR
(b) Perched beaches on intertidal rock OR
(c) WD Delta: Intermittently open mouth f
2
50 to 75% vegetation cover on barrier OR <25%
active dunes or bare sand: OR
Narrow Halophytic zone, broad salt flats, few tidal
creeks
2
(a) Stationary Barrier; OR No Barrier OR
(b) Tombolo OR
(c) WD Delta: Permanently open river mouth
3
25-50% vegetation cover on barrier
25-50% mobile dunes; OR
Narrow Halophytic zone, broad salt flats, common
tidal creeks
3
(a) Receded Barrier OR
(b) Salient & Cuspate foreland OR
(c)) RD Delta: Inherited deltaic features
4
<50% vegetation cover on barrier; OR
50-75% active dunes or bare sand; OR
Broad bare salt flats with Halophytic patches,
palaeochannels and tidal creeks
4
(a) Mainland beach OR
(b) Narrow spit or chenier OR
(c) RD Delta: Active delta & stream channels
5
Mobile sand sheets OR
<25% vegetation cover on barrier OR
Broad bare salt flats with residual mounds,
palaeochannels and tidal creeks
5
Land system and landform description andRanking for susceptibility and instability
AREAS OF LANDFORM
DESCRIPTIONInshoreShoreline and beachfaceBarrier
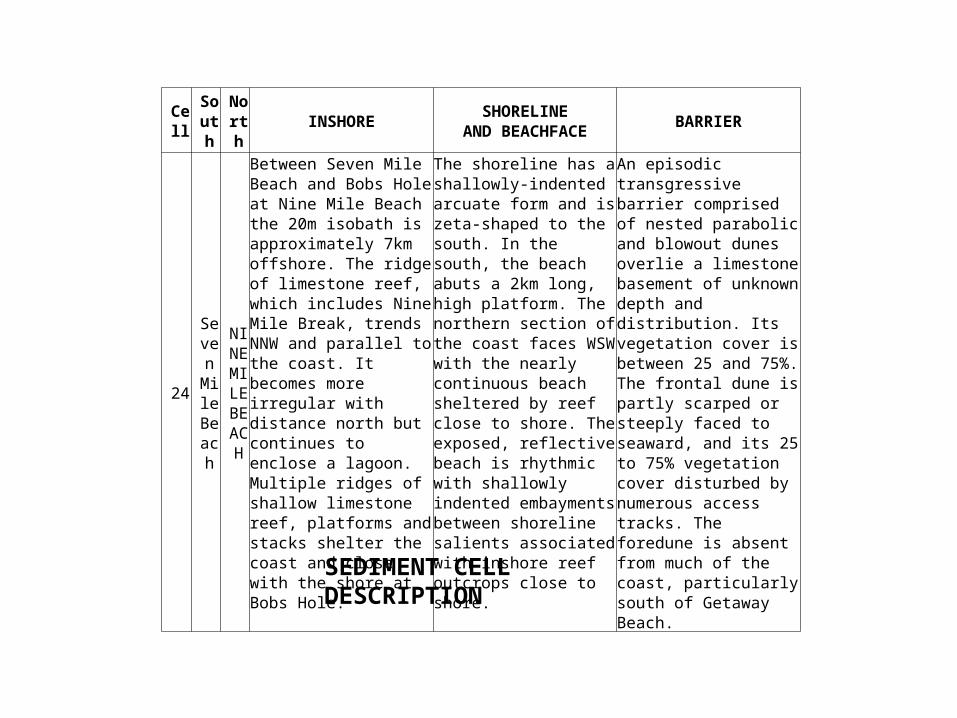
Cell
South
North
INSHORESHORELINE
AND BEACHFACEBARRIER
24
Seven Mile Beach
NINE MILE BEACH
Between Seven Mile Beach and Bobs Hole at Nine Mile Beach the 20m isobath is approximately 7km offshore. The ridge of limestone reef, which includes Nine Mile Break, trends NNW and parallel to the coast. It becomes more irregular with distance north but continues to enclose a lagoon. Multiple ridges of shallow limestone reef, platforms and stacks shelter the coast and close with the shore at Bobs Hole.
The shoreline has a shallowly-indented arcuate form and is zeta-shaped to the south. In the south, the beach abuts a 2km long, high platform. The northern section of the coast faces WSW with the nearly continuous beach sheltered by reef close to shore. The exposed, reflective beach is rhythmic with shallowly indented embayments between shoreline salients associated with inshore reef outcrops close to shore.
An episodic transgressive barrier comprised of nested parabolic and blowout dunes overlie a limestone basement of unknown depth and distribution. Its vegetation cover is between 25 and 75%. The frontal dune is partly scarped or steeply faced to seaward, and its 25 to 75% vegetation cover disturbed by numerous access tracks. The foredune is absent from much of the coast, particularly south of Getaway Beach.
SEDIMENT CELL DESCRIPTION
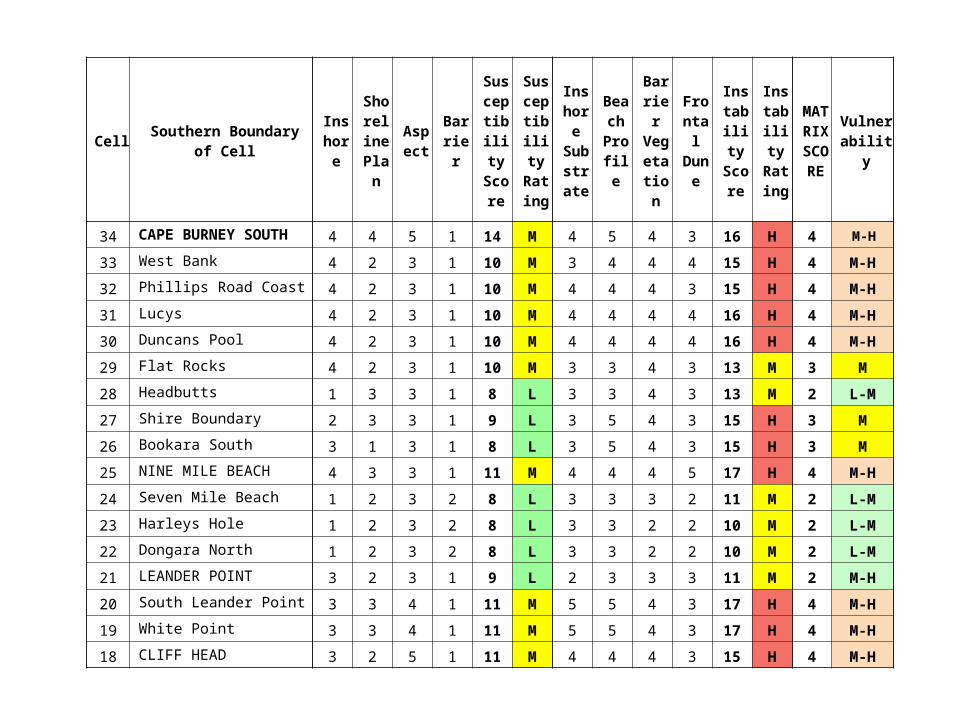
CellSouthern Boundary
of Cell
Inshore
Shoreline Plan
Aspect
Barrier
Susceptibility Score
Susceptibility Rating
Inshore
Substrate
Beach Profile
Barrier Vegetation
Frontal Dune
Instability Score
Instability Rating
MATRIX SCORE
Vulnerabilit
y
34 CAPE BURNEY SOUTH 4 4 5 1 14 M 4 5 4 3 16 H 4
33 West Bank 4 2 3 1 10 M 3 4 4 4 15 H 4 M-H
32 Phillips Road Coast 4 2 3 1 10 M 4 4 4 3 15 H 4 M-H
31 Lucys 4 2 3 1 10 M 4 4 4 4 16 H 4 M-H
30 Duncans Pool 4 2 3 1 10 M 4 4 4 4 16 H 4 M-H
29 Flat Rocks 4 2 3 1 10 M 3 3 4 3 13 M 3 M
28 Headbutts 1 3 3 1 8 L 3 3 4 3 13 M 2 L-M
27 Shire Boundary 2 3 3 1 9 L 3 5 4 3 15 H 3 M
26 Bookara South 3 1 3 1 8 L 3 5 4 3 15 H 3 M
25 NINE MILE BEACH 4 3 3 1 11 M 4 4 4 5 17 H 4 M-H
24 Seven Mile Beach 1 2 3 2 8 L 3 3 3 2 11 M 2 L-M
23 Harleys Hole 1 2 3 2 8 L 3 3 2 2 10 M 2 L-M
22 Dongara North 1 2 3 2 8 L 3 3 2 2 10 M 2 L-M
21 LEANDER POINT 3 2 3 1 9 L 2 3 3 3 11 M 2 M-H
20 South Leander Point 3 3 4 1 11 M 5 5 4 3 17 H 4 M-H
19 White Point 3 3 4 1 11 M 5 5 4 3 17 H 4 M-H
18 CLIFF HEAD 3 2 5 1 11 M 4 4 4 3 15 H 4 M-H
M-H
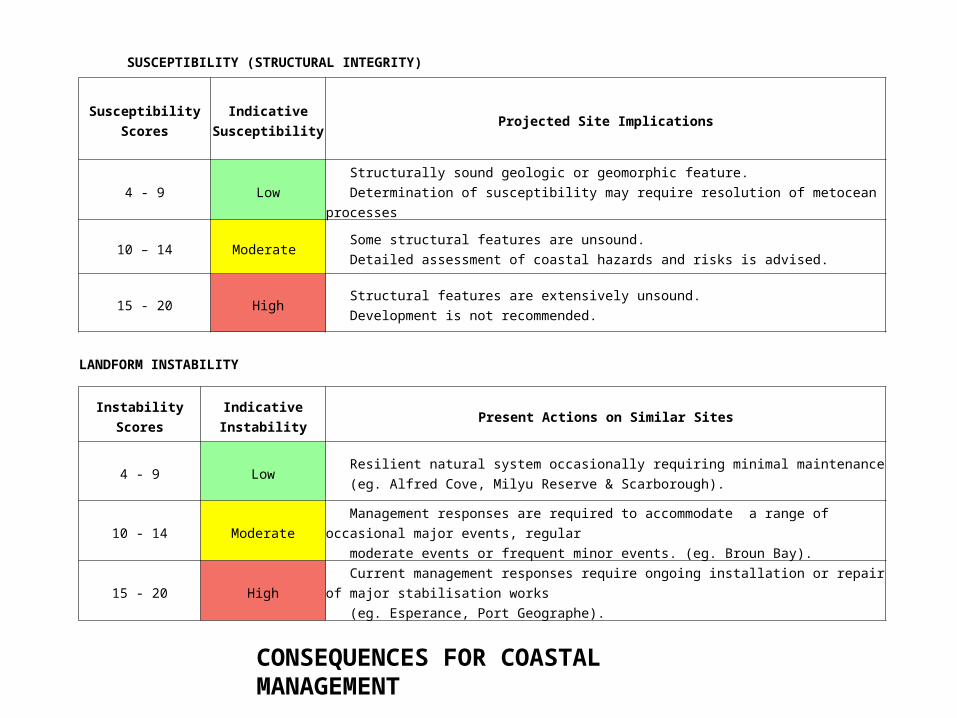
SUSCEPTIBILITY (STRUCTURAL INTEGRITY)
Susceptibility
Scores
Indicative
SusceptibilityProjected Site Implications
4 - 9 Low Structurally sound geologic or geomorphic feature.
Determination of susceptibility may require resolution of metocean processes
10 – 14 Moderate Some structural features are unsound.
Detailed assessment of coastal hazards and risks is advised.
15 - 20 High Structural features are extensively unsound.
Development is not recommended.
LANDFORM INSTABILITY
Instability
Scores
Indicative
InstabilityPresent Actions on Similar Sites
4 - 9 Low Resilient natural system occasionally requiring minimal maintenance
(eg. Alfred Cove, Milyu Reserve & Scarborough).
10 - 14 Moderate
Management responses are required to accommodate a range of occasional
major events, regular
moderate events or frequent minor events. (eg. Broun Bay).
15 - 20 High
Current management responses require ongoing installation or repair of major
stabilisation works
(eg. Esperance, Port Geographe).
CONSEQUENCES FOR COASTAL MANAGEMENT
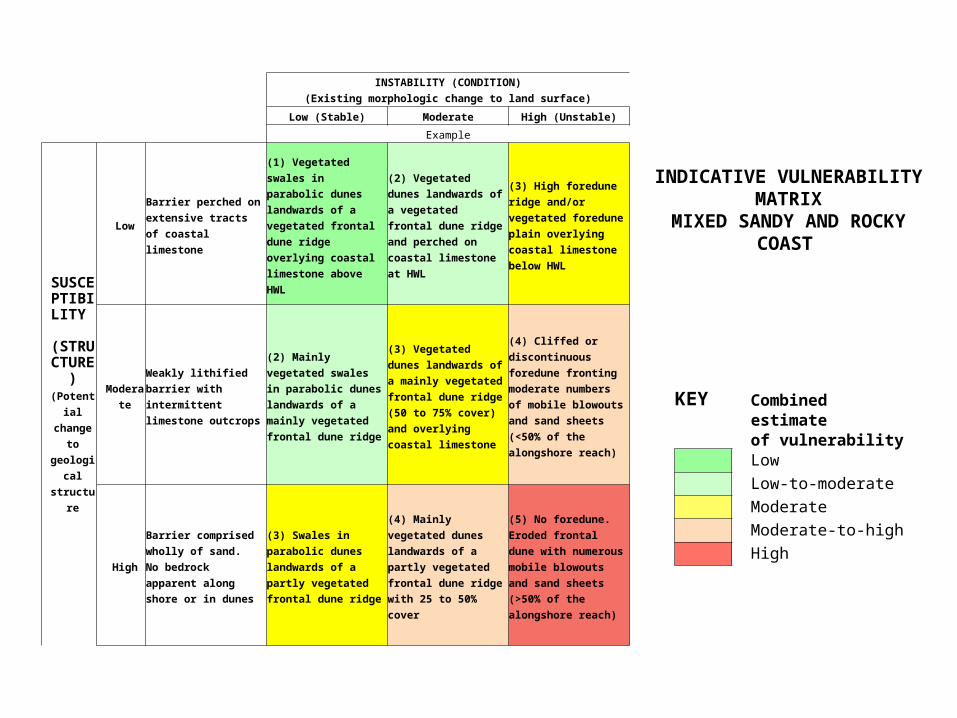
INSTABILITY (CONDITION)
(Existing morphologic change to land surface)
Low (Stable) Moderate High (Unstable)
Example
SUSCEPTIBILITY
(STRUCTURE)
(Potent
ial
change
to
geologi
cal
structu
re
Low
Barrier perched on
extensive tracts of
coastal limestone
(1) Vegetated
swales in parabolic
dunes landwards of
a vegetated frontal
dune ridge
overlying coastal
limestone above
HWL
(2) Vegetated
dunes landwards of
a vegetated frontal
dune ridge and
perched on coastal
limestone at HWL
(3) High foredune
ridge and/or
vegetated foredune
plain overlying
coastal limestone
below HWL
Moder
ate
Weakly lithified
barrier with
intermittent
limestone outcrops
(2) Mainly
vegetated swales in
parabolic dunes
landwards of a
mainly vegetated
frontal dune ridge
(3) Vegetated
dunes landwards of
a mainly vegetated
frontal dune ridge
(50 to 75% cover)
and overlying
coastal limestone
(4) Cliffed or
discontinuous
foredune fronting
moderate numbers
of mobile blowouts
and sand sheets
(<50% of the
alongshore reach)
High
Barrier comprised
wholly of sand.
No bedrock
apparent along
shore or in dunes
(3) Swales in
parabolic dunes
landwards of a
partly vegetated
frontal dune ridge
(4) Mainly
vegetated dunes
landwards of a
partly vegetated
frontal dune ridge
with 25 to 50%
cover
(5) No foredune.
Eroded frontal dune
with numerous
mobile blowouts
and sand sheets
(>50% of the
alongshore reach)
KEY Combined estimate of vulnerability Low Low-to-moderate Moderate Moderate-to-high High
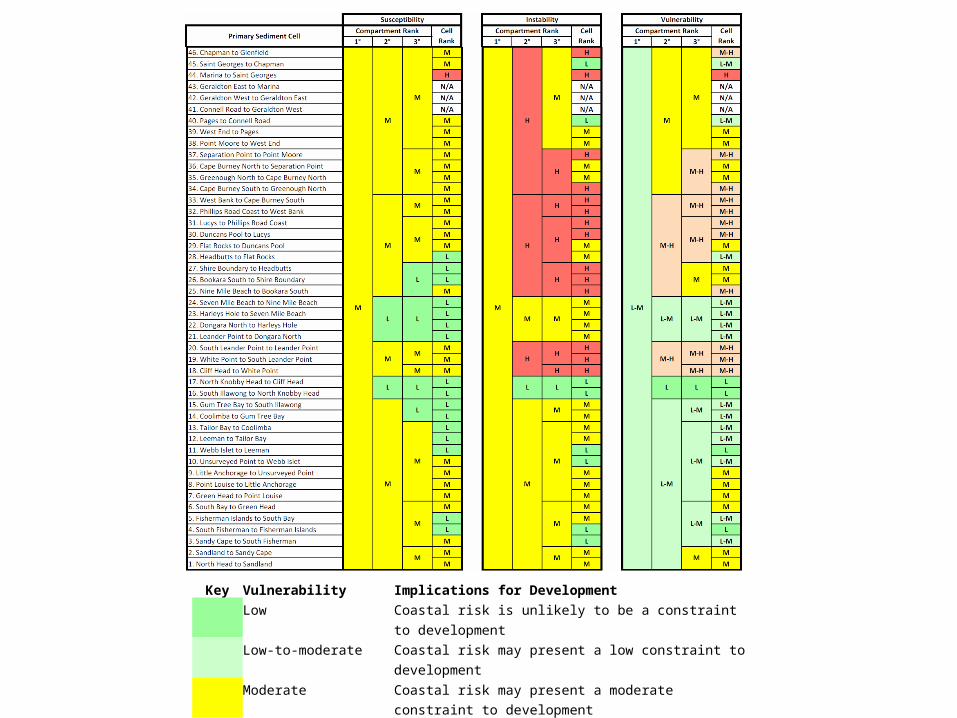
INDICATIVE VULNERABILITY MATRIX
MIXED SANDY AND ROCKY COAST
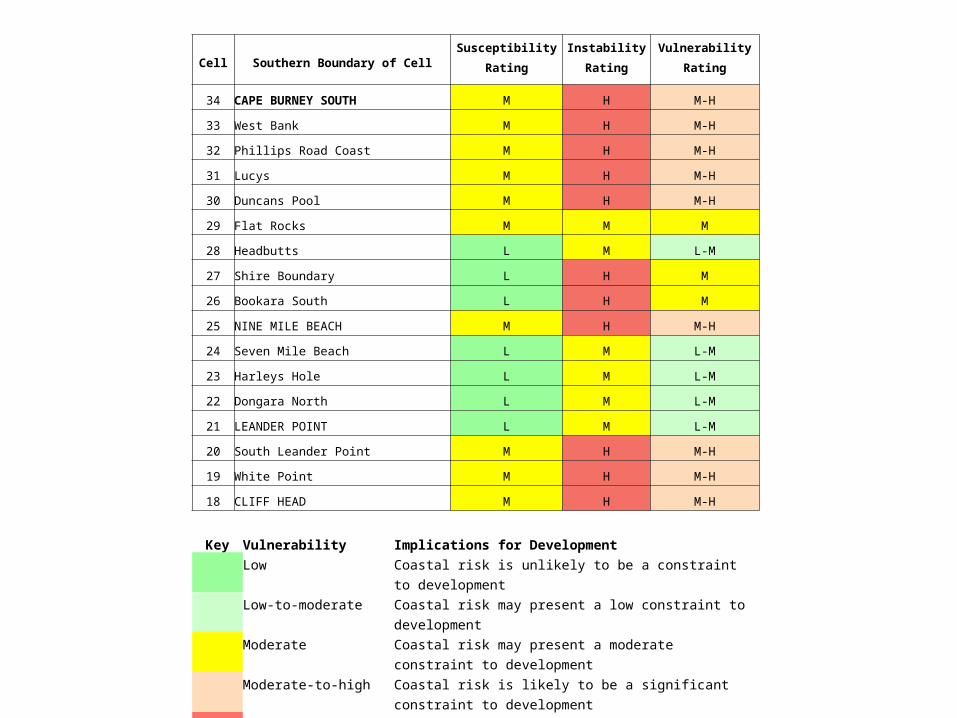
Cell Southern Boundary of CellSusceptibility
Rating
Instability
Rating
Vulnerability
Rating
34 CAPE BURNEY SOUTH M H M-H
33 West Bank M H M-H
32 Phillips Road Coast M H M-H
31 Lucys M H M-H
30 Duncans Pool M H M-H
29 Flat Rocks M M M
28 Headbutts L M L-M
27 Shire Boundary L H M
26 Bookara South L H M
25 NINE MILE BEACH M H M-H
24 Seven Mile Beach L M L-M
23 Harleys Hole L M L-M
22 Dongara North L M L-M
21 LEANDER POINT L M L-M
20 South Leander Point M H M-H
19 White Point M H M-H
18 CLIFF HEAD M H M-H
Key Vulnerability Implications for Development
Low Coastal risk is unlikely to be a constraint to
development
Low-to-moderate Coastal risk may present a low constraint to
development
Moderate Coastal risk may present a moderate constraint to
development
Moderate-to-high Coastal risk is likely to be a significant constraint to
development
High Coastal risk is a highly significant constraint to
development
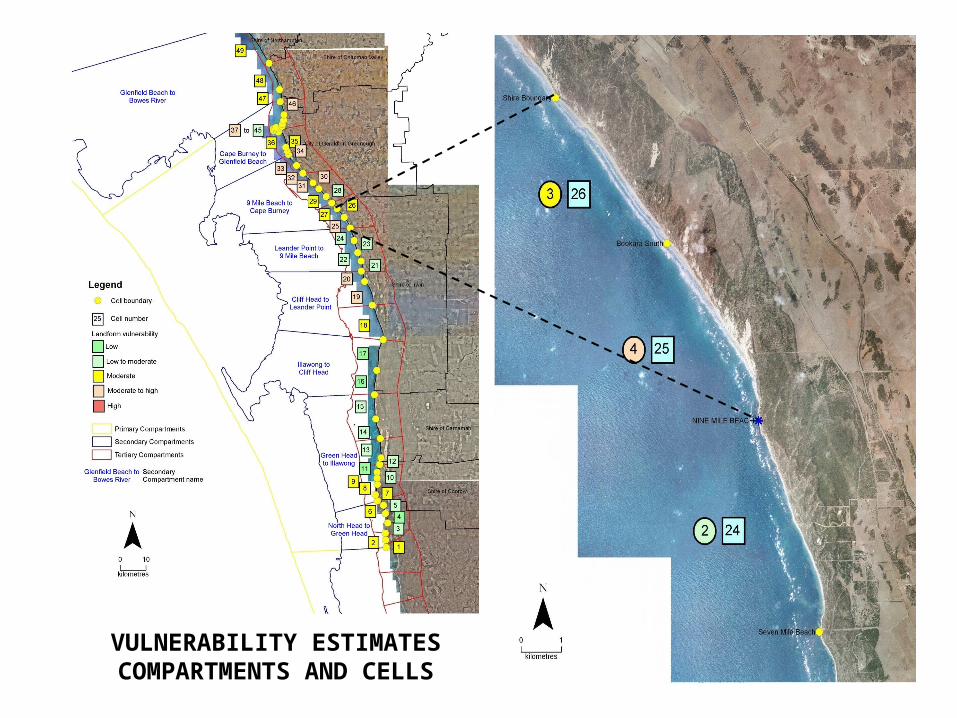
VULNERABILITY ESTIMATESCOMPARTMENTS AND CELLS
KEY Ranked estimate
Low
Low to Moderate
Moderate
Moderate to high
High
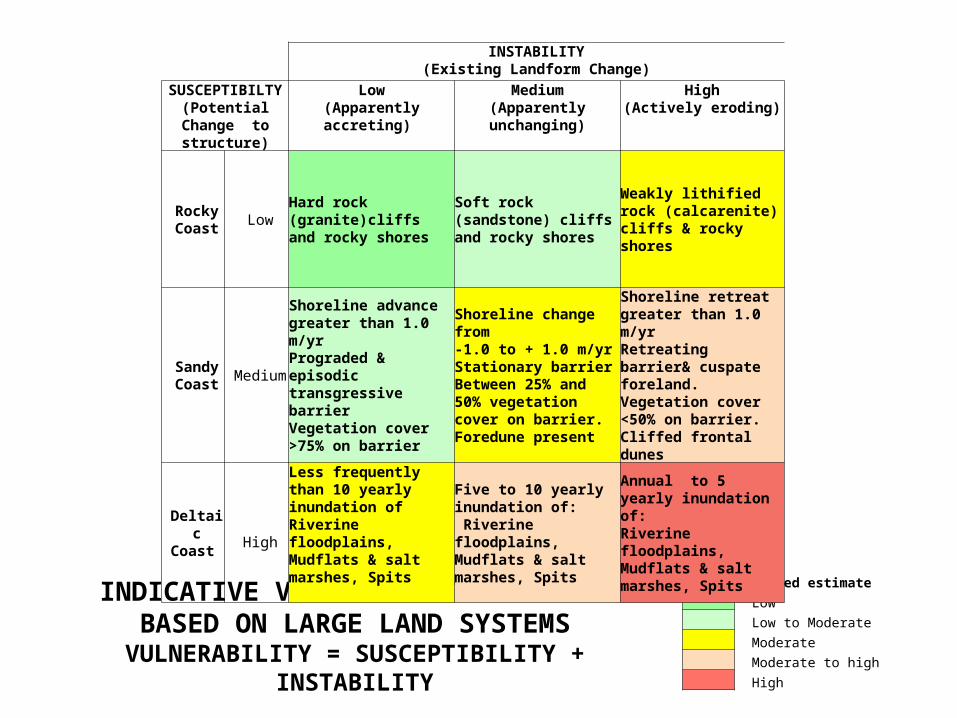
INDICATIVE VULNERABILITY MATRIX BASED ON LARGE LAND SYSTEMSVULNERABILITY = SUSCEPTIBILITY +
INSTABILITY
INSTABILITY
(Existing Landform Change)SUSCEPTIBILT
Y(Potential Change to structure)
Low(Apparently accreting)
Medium(Apparently unchanging)
High(Actively eroding)
Rocky Coast
LowHard rock (granite)cliffs and rocky shores
Soft rock (sandstone) cliffs and rocky shores
Weakly lithified rock (calcarenite) cliffs & rocky shores
Sandy Coast
Medium
Shoreline advance greater than 1.0 m/yrPrograded & episodic transgressive barrierVegetation cover >75% on barrier
Shoreline change from -1.0 to + 1.0 m/yrStationary barrierBetween 25% and 50% vegetation cover on barrier. Foredune present
Shoreline retreat greater than 1.0 m/yrRetreating barrier& cuspate foreland. Vegetation cover <50% on barrier.Cliffed frontal dunes
Deltaic
Coast High
Less frequently than 10 yearly inundation ofRiverine floodplains, Mudflats & salt marshes, Spits
Five to 10 yearly inundation of: Riverine floodplains, Mudflats & salt marshes, Spits
Annual to 5 yearly inundation of:Riverine floodplains, Mudflats & salt marshes, Spits
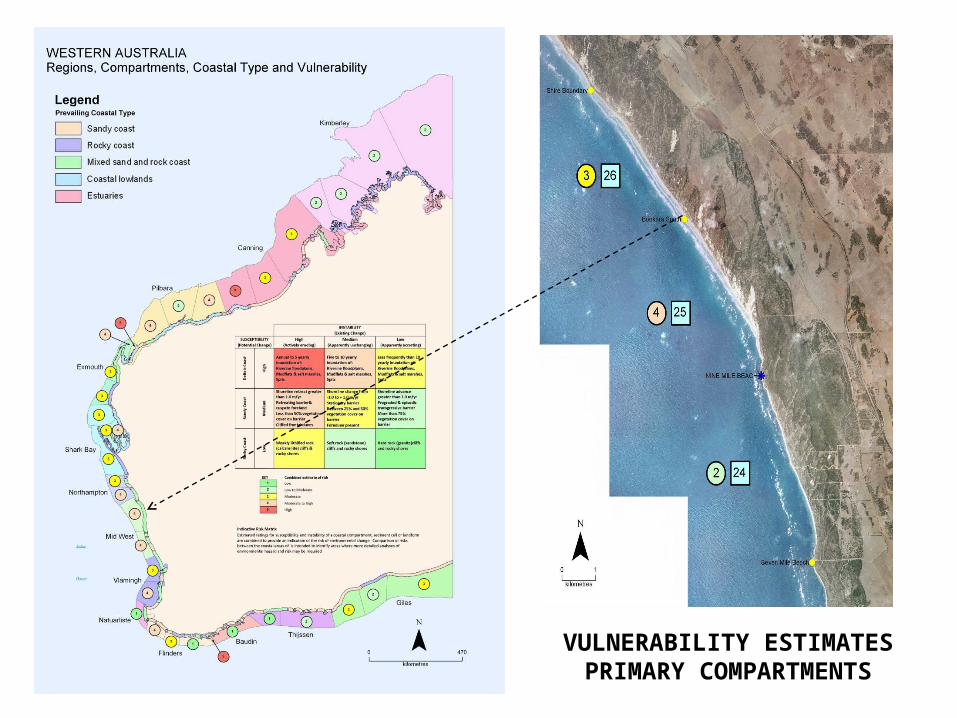
VULNERABILITY ESTIMATESPRIMARY COMPARTMENTS
POTENTIAL APPLICATIONS
COMPARTMENTS
Landforms (Framework) & Processes (Drivers)
PLANNING PURPOSES
Marine & coastal
planning
Habitat descriptio
n
Marine & coastal
risk assessme
ntMarine
conservationEBFM
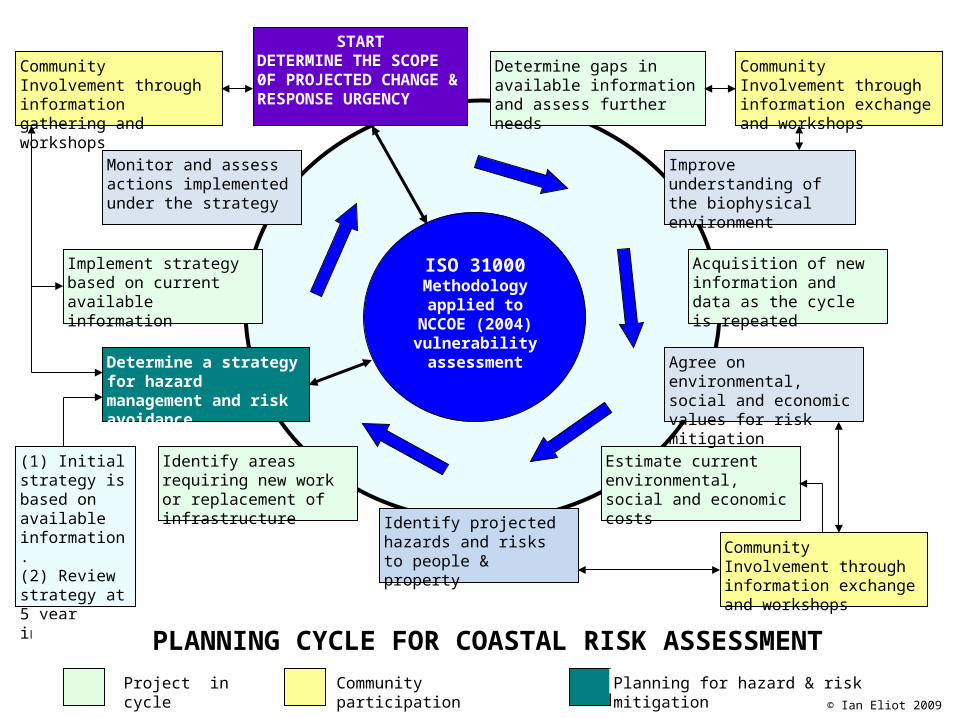
ISO 31000 Methodology
applied to NCCOE (2004) vulnerability
assessment
Improve understanding of the biophysical environment
Determine gaps in available information and assess further needs
Implement strategy based on current available information
Identify areas requiring new work or replacement of infrastructure
Estimate current environmental, social and economic costs
Acquisition of new information and data as the cycle is repeated
Determine a strategy for hazard management and risk avoidance
Monitor and assess actions implemented under the strategy
STARTDETERMINE THE SCOPE 0F PROJECTED CHANGE & RESPONSE URGENCY
Agree on environmental, social and economic values for risk mitigation
Identify projected hazards and risks to people & property
Community Involvement through information exchange and workshops
Community Involvement through information exchange and workshops
Community Involvement through information gathering and workshops
(1) Initial strategy is based on available information.(2) Review strategy at 5 year intervals
PLANNING CYCLE FOR COASTAL RISK ASSESSMENT
Project in cycle Community participation Planning for hazard & risk mitigation© Ian Eliot 2009
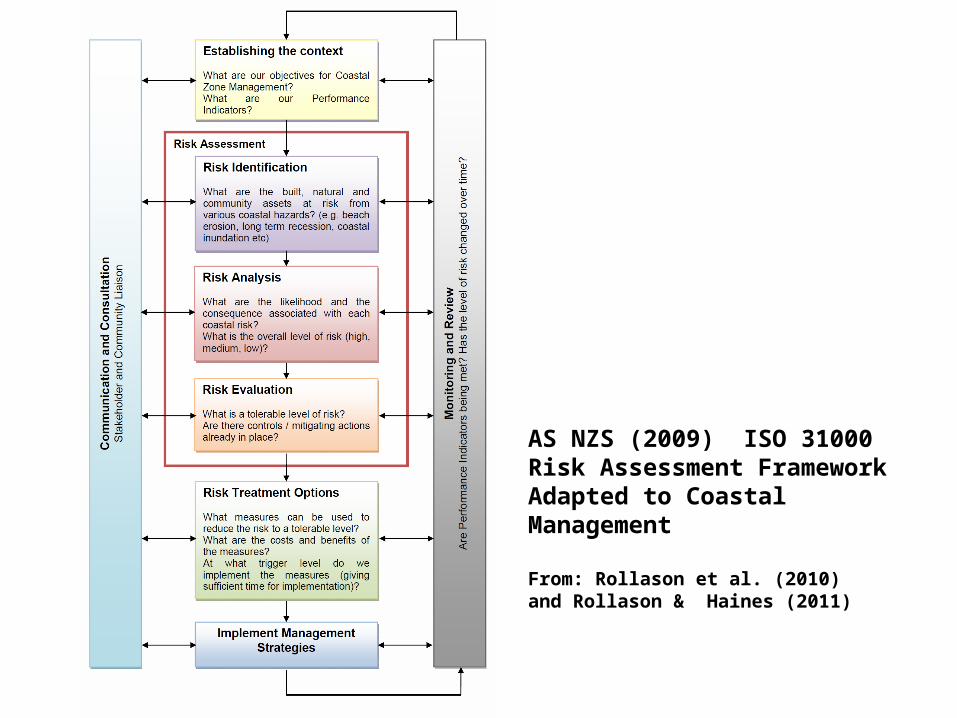
AS NZS (2009) ISO 31000Risk Assessment Framework Adapted to Coastal Management
From: Rollason et al. (2010) and Rollason & Haines (2011)
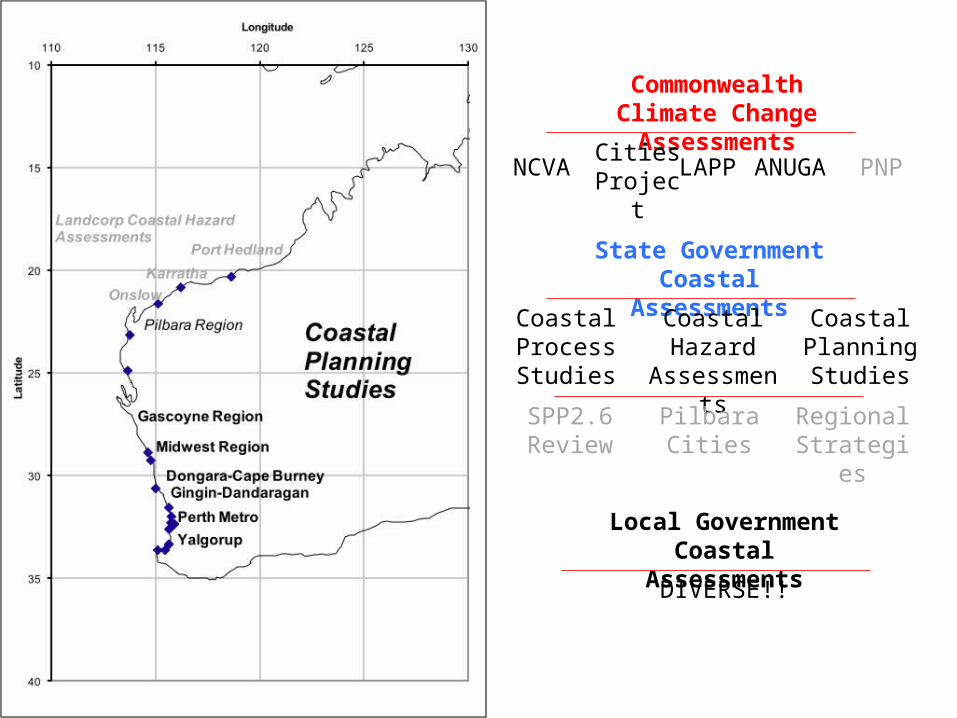
Commonwealth Climate Change
AssessmentsNCVA LAPP ANUGA PNP
State Government Coastal
Assessments
SPP2.6 Review
Coastal Process Studies
Coastal Planning Studies
Coastal Hazard
AssessmentsPilbara
Cities
Cities Project
Regional Strategie
s
Local Government Coastal
AssessmentsDIVERSE!!

Thanks for your attention