Embed Size (px)
Citation preview

1
Statistics Netherlands, The Hague 2010 National Accounts Department
PO box 24500
2490 HA Den Haag, Netherlands
CO2 emissions on quarterly basis
Project and report commissioned by the European Community
Project of DG-Eurostat/E3 Grant Agreement No 50304.2009.001-2009.259
Final report
Maarten van Rossum Sjoerd Schenau
December 2010
Remark: The views expressed in this report are those of the authors and do not necessarily reflect the opinion of Statistics Netherlands. The authors would like to thank their colleagues for useful comments and suggestions. __________________________________________________________________________ Project number: 208360/02 Date: December 2010

2
1. Introduction There is mounting scientific evidence indicating that the emission of greenhouse gasses by human activities contributes to climate change (IPCC, 2007). Over the past centuries atmospheric greenhouse gas concentrations have increased, leading to a disrupted balance of the climate system. Climate change could affect ecosystems and economies all over the world. Many national and international agreements and regulations to reduce climate change have been formulated. Accurate and timely measurements of the amount and origin of the emitted greenhouse gasses are essential to help governments achieve their objectives. Data on national greenhouse gas emissions (national emission inventory and environmental accounts) usually become available nine months after the end of the year under review. Quarterly based CO2emission data could serve as a short term indicator for policymakers and researchers to assess how the greenhouse gas emissions change in response to economic growth or decline, as carbon dioxide is the most important anthropogenic greenhouse gas. The main purpose of air emission accounts for carbon dioxide on a quarterly basis is to have data for the most important greenhouse gas available much earlier. Quarterly based CO2emission data will help to detect timely breaking points in currently estimated trends for emitted greenhouse gasses. In addition, quarterly emission data allow an in-depth analysis of the drivers of climate change. As the data are compatible with national accounts, CO2emissions can be linked directly to economic output allowing the comparison of the environmental performance of different industries. This new information could support national policy. Also, reporting the data to Eurostat could be advanced in time. More importantly, the general public can be informed on a timely and more regular basis whether emissions have grown or declined in a particular period in time. The interrelationship between the economy and the environment, in other words the mechanisms at work, can be made explicit and communicated on a regular basis. Presenting the tension between economic growth and environmental pressure on a timelier basis can raise awareness among the general public. Communicating the mechanisms at work on a timelier and more frequent basis may lead to understanding them and entice consumers and producers into making more sustainable choices in the future. At present, Statistics Netherlands compiles annual air emission data for several air pollutants, among which greenhouse gasses. In the air emission accounts the same concepts and definitions are used as in the national accounts (see UN et al., 2003;). Also, air emissions are attributed to different industries, households and other sources according to the same classification systems. By using the same framework as the system of national accounts the impact of the economy on the environment can be derived directly. Generally, the first data of the air emission accounts are published nine months after the year under review1. By contrast, economic data from the national accounts are published 45 and 90 days after the end of each quarter. The aim of this study is to investigate whether it is possible to compile CO2 air emission accounts for the Netherlands on a quarterly basis. First we describe the methodology developed, using quarterly data from the energy statistics and national accounts to estimate quarterly CO2 emissions. We compared the results and checked them with the annual air emission accounting data in order to evaluate the robustness of the methodology applied.
1 The first publication of air emissions according to the IPCC definitions (Kyoto protocol) also occurs at this moment in time.
3
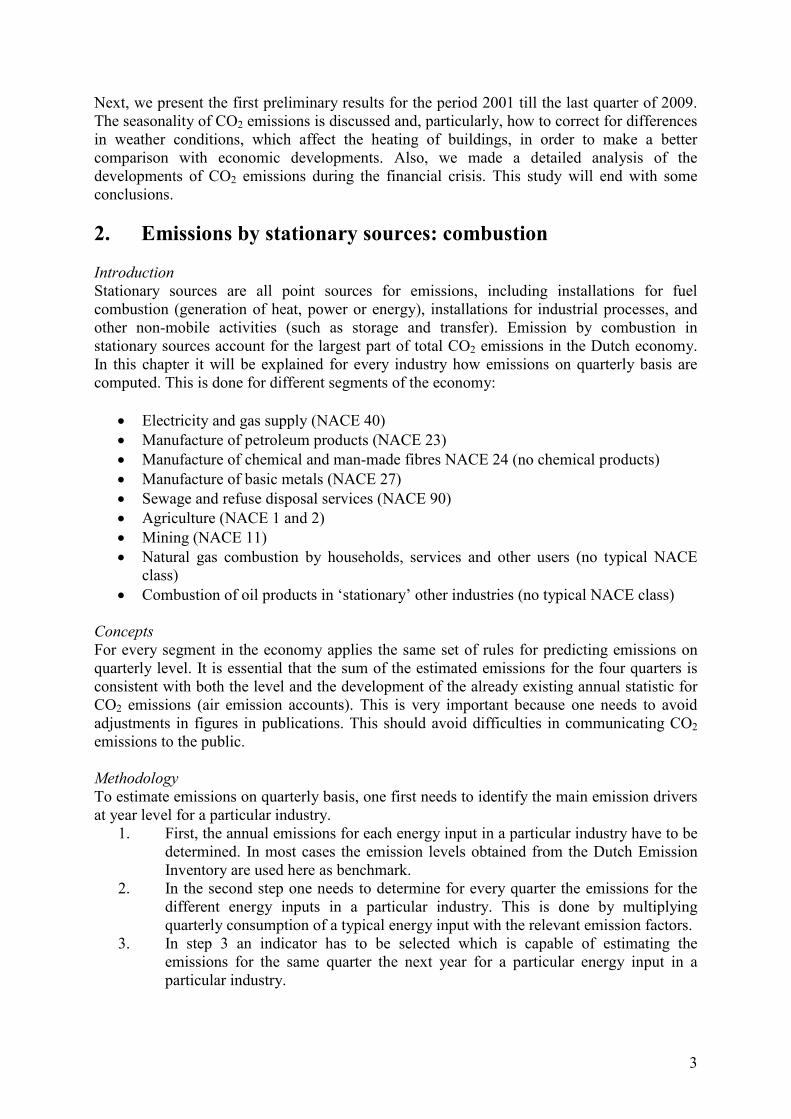
Next, we present the first preliminary results for the period 2001 till the last quarter of 2009. The seasonality of CO2 emissions is discussed and, particularly, how to correct for differences in weather conditions, which affect the heating of buildings, in order to make a better comparison with economic developments. Also, we made a detailed analysis of the developments of CO2 emissions during the financial crisis. This study will end with some conclusions. 2. Emissions by stationary sources: combustion Introduction Stationary sources are all point sources for emissions, including installations for fuel combustion (generation of heat, power or energy), installations for industrial processes, and other non-mobile activities (such as storage and transfer). Emission by combustion in stationary sources account for the largest part of total CO2 emissions in the Dutch economy. In this chapter it will be explained for every industry how emissions on quarterly basis are computed. This is done for different segments of the economy:
• Electricity and gas supply (NACE 40) • Manufacture of petroleum products (NACE 23) • Manufacture of chemical and man-made fibres NACE 24 (no chemical products) • Manufacture of basic metals (NACE 27) • Sewage and refuse disposal services (NACE 90) • Agriculture (NACE 1 and 2) • Mining (NACE 11) • Natural gas combustion by households, services and other users (no typical NACE
class) • Combustion of oil products in ‘stationary’ other industries (no typical NACE class)
Concepts For every segment in the economy applies the same set of rules for predicting emissions on quarterly level. It is essential that the sum of the estimated emissions for the four quarters is consistent with both the level and the development of the already existing annual statistic for CO2 emissions (air emission accounts). This is very important because one needs to avoid adjustments in figures in publications. This should avoid difficulties in communicating CO2emissions to the public. Methodology To estimate emissions on quarterly basis, one first needs to identify the main emission drivers at year level for a particular industry.
1. First, the annual emissions for each energy input in a particular industry have to be determined. In most cases the emission levels obtained from the Dutch Emission Inventory are used here as benchmark.
2. In the second step one needs to determine for every quarter the emissions for the different energy inputs in a particular industry. This is done by multiplying quarterly consumption of a typical energy input with the relevant emission factors.
3. In step 3 an indicator has to be selected which is capable of estimating the emissions for the same quarter the next year for a particular energy input in a particular industry.

4
4. In step 4 one needs to sum up the estimated emissions of the four quarters. For every year it has to be assured that the level and the development of the computed year emissions, which are based upon the four quarters, are close by or equal to that of the year figures of the already existing year statistic.
5. Finally, after carrying out the estimation for the four quarters, one has to rebase the sum of the four quarters with the ‘real’ emissions at year-level before one can make new estimations for the new quarters.
2.1 Electricity and gas supply Introduction On a yearly basis the electricity and gas supply industry is responsible for 51 billion kilogram of CO2 emissions. This is equal to almost 25 percent of total CO2 emissions of the Dutch economy (totals from the air emissions accounts). This means that this industry is a very important industry regarding total emissions in the Netherlands. This also means that for this particular industry it is very important to have very robust estimation methods and to apply well defined concepts. The intake and combustion of natural gas and coal are the main drivers for CO2 emissions in this industry. Other important drivers are the combustion of biomass, blast furnace gas and refinery gas.
Data sources Energy input Indicator for estimation Source ItemCoal Coal input in energy companies Energy Statistics Coal balanceNatural gas Natural gas input in energy companies Energy Statistics Gas balanceBlast furnace gas Intake of blast furnace gas Energy Statistics Energy production intakeBiomass Production of renewable energy in energy companies by biomass Energy Statistics Renewable energy statisticsRefinery gas Other users of refinery gas Energy Statistics Oil products balance
Energy input Publication Quality level of indicator Data availabilityCoal monthly A 2000-2009Natural gas monthly A 2000-2009Blast furnace gas monthly B 2000-2009Biomass quarterly B 2005-2009Refinery gas monthly B 2000-2009
Table 1- Data sources for Electricity and gas supply Technical remarks The emission factor for refinery gas is very volatile over time. Accurate measures for emission factors for this typical kind of energy input are only available in a very late stage of the statistical production process. In an early stage one is solely depended on energy statistics. The annual figures of the Emission Registration use information of the Environmental reports (MJV’s) to monitor refinery gas emissions. This information is not available on quarterly basis. This omission can introduce a difference between the quarterly emissions and the annual emissions.

5
Results and disussion
CO2 emissions of electricity and gas supply, combustion
-10.00%
-8.00%
-6.00%
-4.00%
-2.00%
0.00%
2.00%
4.00%
6.00%
8.00%
10.00%
2001
2002
2003
2004
2005
2006
2007
2008
Sum of 4 quarters, development
Development year statistics
Difference in development
Figure 2-Emissions of Electricity and gas supply, combustion The mutations of the year statistics have in every year the same sign as the mutations of the summed quarterly emissions. The percentage deviation between the two indicators is between 0.1 and 1.5 percentage points. There is no bias in the estimations. One year the adjustment is positive while in other years the adjustment is negative. It seems particularly difficult to make good estimations for CO2 emissions from biomass combustion. For the years 2000-2008 only information on renewable electricity production is available to make predictions for biomass combustion. This is an output indicator. For the years 2009 and onwards information is available on the input side regarding biomass combustion. The input of solid and liquid biomass (measured in TJ) will be monitored on quarterly basis and this information can be used as an indicator for predicting biomass combustion emissions. This input indicator is more accurate than the output indicator. There are little or no problems related to estimating the quarterly emissions from the combustion of natural gas, blast furnace gas, refinery gas and coal. For refinery gas holds that the emission factor can change over time. The year statistic makes use of the information in environmental reports. The emission factor for refinery gas in these reports can deviate from ‘standard’ emission factors published by Senternovem (2009). Concluding, one could state that the methodology for quarterly emissions for energy companies is reliable enough to integrate the computed figures in the total emissions of the Dutch economy aggregate. It is also advocated to publish the computed emissions of this particular industry. This is mainly the result of having good information for the different energy inputs The problems related to refinery gas combustion are small and the problems related to biomass combustion are solved for the years after 2008. These are important arguments for publishing quarterly statistics for this particular industry.
6
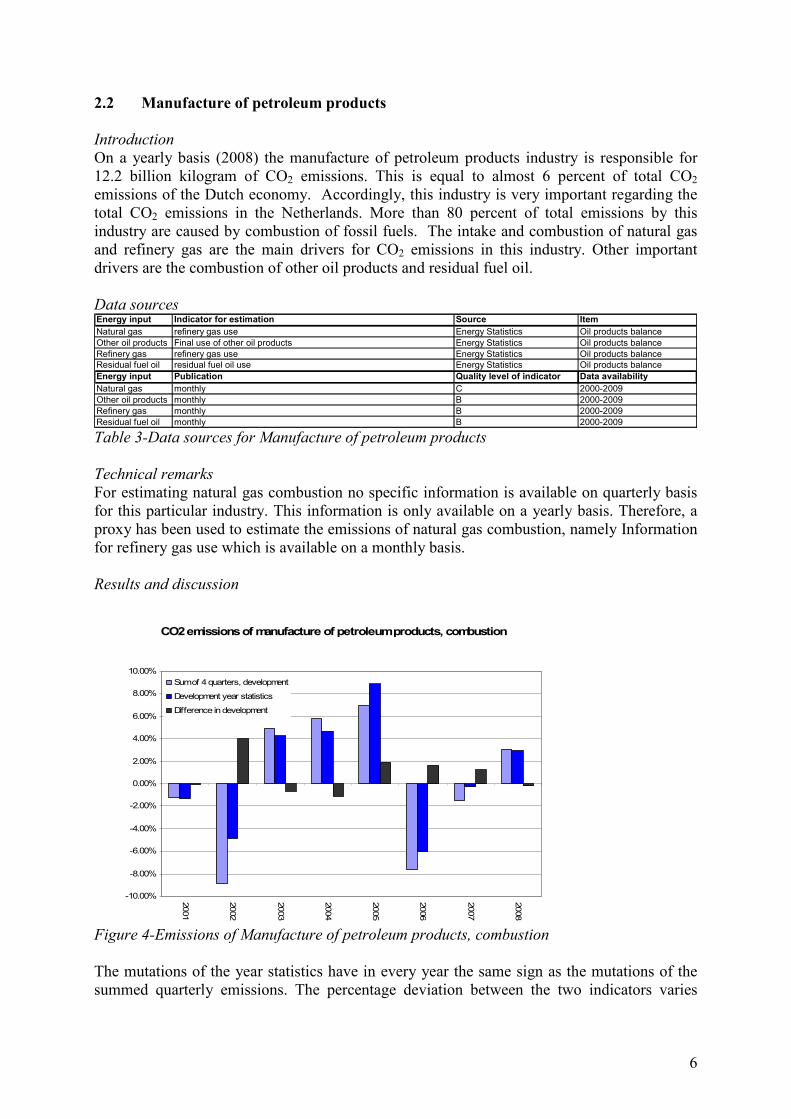
2.2 Manufacture of petroleum products Introduction On a yearly basis (2008) the manufacture of petroleum products industry is responsible for 12.2 billion kilogram of CO2 emissions. This is equal to almost 6 percent of total CO2emissions of the Dutch economy. Accordingly, this industry is very important regarding the total CO2 emissions in the Netherlands. More than 80 percent of total emissions by this industry are caused by combustion of fossil fuels. The intake and combustion of natural gas and refinery gas are the main drivers for CO2 emissions in this industry. Other important drivers are the combustion of other oil products and residual fuel oil. Data sources Energy input Indicator for estimation Source ItemNatural gas refinery gas use Energy Statistics Oil products balanceOther oil products Final use of other oil products Energy Statistics Oil products balanceRefinery gas refinery gas use Energy Statistics Oil products balanceResidual fuel oil residual fuel oil use Energy Statistics Oil products balanceEnergy input Publication Quality level of indicator Data availabilityNatural gas monthly C 2000-2009Other oil products monthly B 2000-2009Refinery gas monthly B 2000-2009Residual fuel oil monthly B 2000-2009
Table 3-Data sources for Manufacture of petroleum products Technical remarks For estimating natural gas combustion no specific information is available on quarterly basis for this particular industry. This information is only available on a yearly basis. Therefore, a proxy has been used to estimate the emissions of natural gas combustion, namely Information for refinery gas use which is available on a monthly basis. Results and discussion
CO2 emissions of manufacture of petroleum products, combustion
-10.00%
-8.00%
-6.00%
-4.00%
-2.00%
0.00%
2.00%
4.00%
6.00%
8.00%
10.00%
2001
2002
2003
2004
2005
2006
2007
2008
Sum of 4 quarters, development
Development year statistics
Difference in development
Figure 4-Emissions of Manufacture of petroleum products, combustion The mutations of the year statistics have in every year the same sign as the mutations of the summed quarterly emissions. The percentage deviation between the two indicators varies

7
between 0.1 and 4.0 percentage points. There is no bias in the estimations. One year the adjustment is positive while in other years the adjustment is negative. It seems particularly difficult to make good estimations for CO2 emissions for natural gas combustion. Improvements are very welcome here. On the other hand, there are little or no problems related to the estimation of quarterly CO2 emissions from the combustion of refinery gas, other oil products and residual fuel oil. Concluding, one could state that the methodology for quarterly emissions for manufacture of petroleum products is reliable enough to integrate the computed figures in the total emissions of the Dutch economy aggregate. However, it is not advocated to publish the computed emissions of this particular industry. This is mainly the result of having no particular information on emissions related to natural gas combustion. Also the problems related to changing emission factors for refinery gas combustion are an important argument against publishing quarterly emissions for this particular industry. A possible way out is to publish statistics for this industry in which natural gas combustion is excluded. The computed figures are still well suited for compiling Dutch economy aggregates. 2.3 Manufacture of basic chemicals and man-made fibres Introduction On a yearly basis (2008) the manufacture of basic chemicals and man-made fibres industry is responsible for 15.4 billion kilogram of CO2 emissions. This is equal to almost 8 percent of the total CO2 emissions of the Dutch economy. This industry is a very important industry regarding the total CO2 emissions in the Netherlands. Almost 80 percent of total emissions by this industry are caused by combustion of fossil fuels. The intake and combustion of natural gas and refinery gas are the main drivers for CO2 emissions in this industry. Another important driver is the combustion other oil products. Data sources Energy input Indicator for estimation Source ItemNatural gas Growth of production National accounts Production growthOther oil products Final use of other oil products Energy Statistics Oil products balanceRefinery gas refinery gas use Energy Statistics Oil products balance
Energy input Publication Quality level of indicator Data availabilityNatural gas quarterly C 2000-2009Other oil products monthly B 2000-2009Refinery gas monthly B 2000-2009
Table 5-Data sources for Manufacture of basic chemicals and man-made fibres Technical remarks For estimating natural gas combustion no specific information for natural gas is available for this particular industry on quarterly basis. This information is only available on a yearly basis for this industry. Therefore, a proxy has been used to estimate the emissions of natural gas combustion. Information on economic growth is available on a quarterly basis. Economic growth for this industry is the basis for prediction for natural gas combustion in this industry.

8
Results and discussion
CO2 emissions of chemical industry, combustion
-15.00%
-10.00%
-5.00%
0.00%
5.00%
10.00%
15.00%
20.00%
2001
2002
2003
2004
2005
2006
2007
2008
Sum of 4 quarters, development
Development year statistics
Difference in development
Figure 6-Emissions of Manufacture of basic chemicals and man-made fibres The mutations of the annual emissions have in almost every year the same sign as the mutations of the summed quarterly emissions (2001 is an exception here). The percentage deviation between the two indicators is between 0.2 and 11.6 percentage points. There is no bias in the estimations. One year the adjustment is positive while in other years the adjustment is negative. It seems particularly difficult to make good estimations for CO2 emissions of natural gas combustion. Improvements are very welcome here. On the other hand, there are little or no problems related to estimating the emission from the combustion of refinery gas and other oil products. Concluding, one could state that the methodology for quarterly emissions for manufacture of basic chemicals and man-made fibres is reliable enough to integrate the computed figures in the total emissions of the Dutch economy aggregate. It is not advocated to publish the computed emissions for this particular industry. This is mainly the result of having no particular information on emissions related to natural gas combustion. Also the problems related to changing emission factors for refinery gas combustion are an important argument against publishing statistics for this particular industry. A possible way out is to publish statistics for this industry in which natural gas combustion is excluded. The computed figures are still well suited for compiling Dutch economy aggregates. 2.4 Manufacture of basic metals Introduction On a yearly basis (2008) the manufacture of basic metals industry is responsible for 7.3 billion kilogram of CO2 emissions. This is equal to almost 4 percent of the total CO2emissions of the Dutch economy. Approximately 65 percent of total emissions by this industry are caused by combustion of fossil fuels.

9
Data sources Energy input Indicator for estimation Source ItemNatural gas Coal input in energy companies Energy Statistics Coal balanceBlast furnace gas Coal input in energy companies Energy Statistics Coal balance
Energy input Publication Quality level of indicator Data availabilityNatural gas monthly C 2000-2009Blast furnace gas monthly C 2000-2009
Table 7-Data sources for Manufacture of basic metals Technical remarks For estimating natural gas combustion no specific information is available on quarterly basis for this particular industry. This information is only available on a yearly basis. Therefore, a proxy has been used to estimate the emissions of natural gas combustion. Information on coal input is available on a quarterly basis. Coal input for this industry is the basis for prediction for natural gas combustion. Results and discussion
CO2 emissions in manufacture of basic metals
-8.00%
-6.00%
-4.00%
-2.00%
0.00%
2.00%
4.00%
6.00%
8.00%
10.00%
12.00%
14.00%
2001
2002
2003
2004
2005
2006
2007
2008
Sum of 4 quarters, development
Development year statistics
Difference in development
Figure 8-Emissions of Manufacture of basic metals The mutations of the annual emissions have not in every year the same sign as the mutations of the summed quarterly emissions. There is no bias in the estimations. One year the adjustment is positive while in other years the adjustment is negative. The percentage deviations are large and sometimes the development of the year statistic is opposite to that of the sum of the four quarters. It seems that the emissions regarding combustion in this industry are very hard to estimate using the available information. It turns out that coal input is no good indicator for natural gas input. Also economic growth is no good indicator for natural gas input in this particular industry. Improvements are very welcome here. There are little or no problems related to estimating the emission for the combustion of blast furnace gas. In conclusion, one could state that the methodology for quarterly emissions of manufacture of basic metal products is reliable enough to integrate the computed figures in the total emissions of the Dutch economy aggregate. It is not advocated to publish the computed emissions of this particular industry. This is mainly the result of having no particular information on emissions related to natural gas combustion. The computed figures are still well suited for compiling Dutch economy aggregates.
10
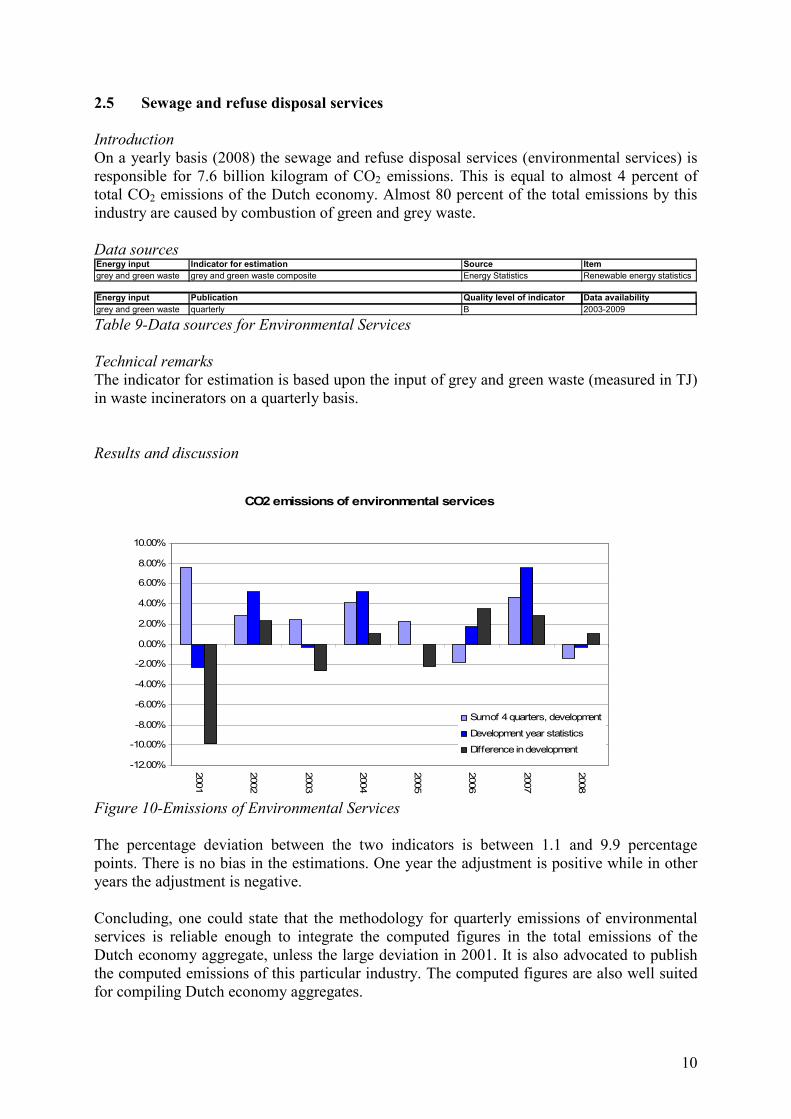
2.5 Sewage and refuse disposal services Introduction On a yearly basis (2008) the sewage and refuse disposal services (environmental services) is responsible for 7.6 billion kilogram of CO2 emissions. This is equal to almost 4 percent of total CO2 emissions of the Dutch economy. Almost 80 percent of the total emissions by this industry are caused by combustion of green and grey waste. Data sources Energy input Indicator for estimation Source Itemgrey and green waste grey and green waste composite Energy Statistics Renewable energy statistics
Energy input Publication Quality level of indicator Data availabilitygrey and green waste quarterly B 2003-2009
Table 9-Data sources for Environmental Services Technical remarks The indicator for estimation is based upon the input of grey and green waste (measured in TJ) in waste incinerators on a quarterly basis.
Results and discussion
CO2 emissions of environmental services
-12.00%
-10.00%
-8.00%
-6.00%
-4.00%
-2.00%
0.00%
2.00%
4.00%
6.00%
8.00%
10.00%
2001
2002
2003
2004
2005
2006
2007
2008
Sum of 4 quarters, development
Development year statistics
Difference in development
Figure 10-Emissions of Environmental Services The percentage deviation between the two indicators is between 1.1 and 9.9 percentage points. There is no bias in the estimations. One year the adjustment is positive while in other years the adjustment is negative. Concluding, one could state that the methodology for quarterly emissions of environmental services is reliable enough to integrate the computed figures in the total emissions of the Dutch economy aggregate, unless the large deviation in 2001. It is also advocated to publish the computed emissions of this particular industry. The computed figures are also well suited for compiling Dutch economy aggregates.
11
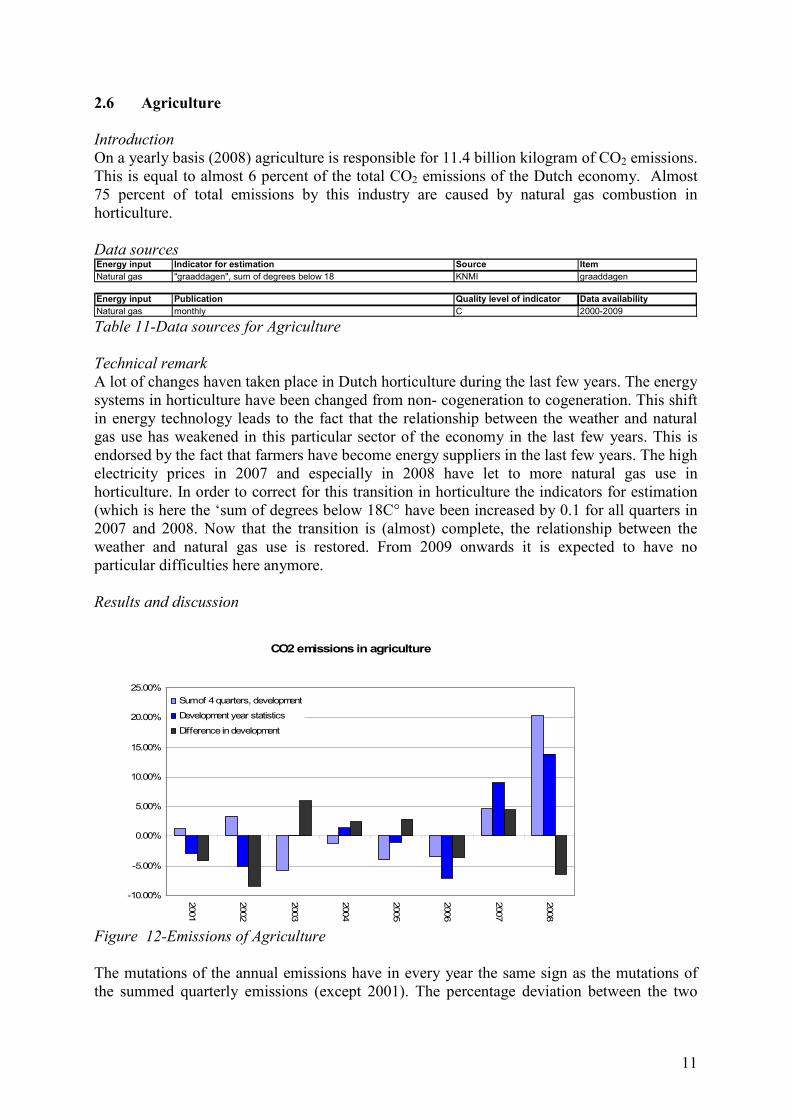
2.6 Agriculture Introduction On a yearly basis (2008) agriculture is responsible for 11.4 billion kilogram of CO2 emissions. This is equal to almost 6 percent of the total CO2 emissions of the Dutch economy. Almost 75 percent of total emissions by this industry are caused by natural gas combustion in horticulture. Data sources Energy input Indicator for estimation Source ItemNatural gas "graaddagen", sum of degrees below 18 KNMI graaddagen
Energy input Publication Quality level of indicator Data availabilityNatural gas monthly C 2000-2009
Table 11-Data sources for Agriculture Technical remark A lot of changes haven taken place in Dutch horticulture during the last few years. The energy systems in horticulture have been changed from non- cogeneration to cogeneration. This shift in energy technology leads to the fact that the relationship between the weather and natural gas use has weakened in this particular sector of the economy in the last few years. This is endorsed by the fact that farmers have become energy suppliers in the last few years. The high electricity prices in 2007 and especially in 2008 have let to more natural gas use in horticulture. In order to correct for this transition in horticulture the indicators for estimation (which is here the ‘sum of degrees below 18C° have been increased by 0.1 for all quarters in 2007 and 2008. Now that the transition is (almost) complete, the relationship between the weather and natural gas use is restored. From 2009 onwards it is expected to have no particular difficulties here anymore. Results and discussion
CO2 emissions in agriculture
-10.00%
-5.00%
0.00%
5.00%
10.00%
15.00%
20.00%
25.00%
2001
2002
2003
2004
2005
2006
2007
2008
Sum of 4 quarters, development
Development year statistics
Difference in development
Figure 12-Emissions of Agriculture The mutations of the annual emissions have in every year the same sign as the mutations of the summed quarterly emissions (except 2001). The percentage deviation between the two
12
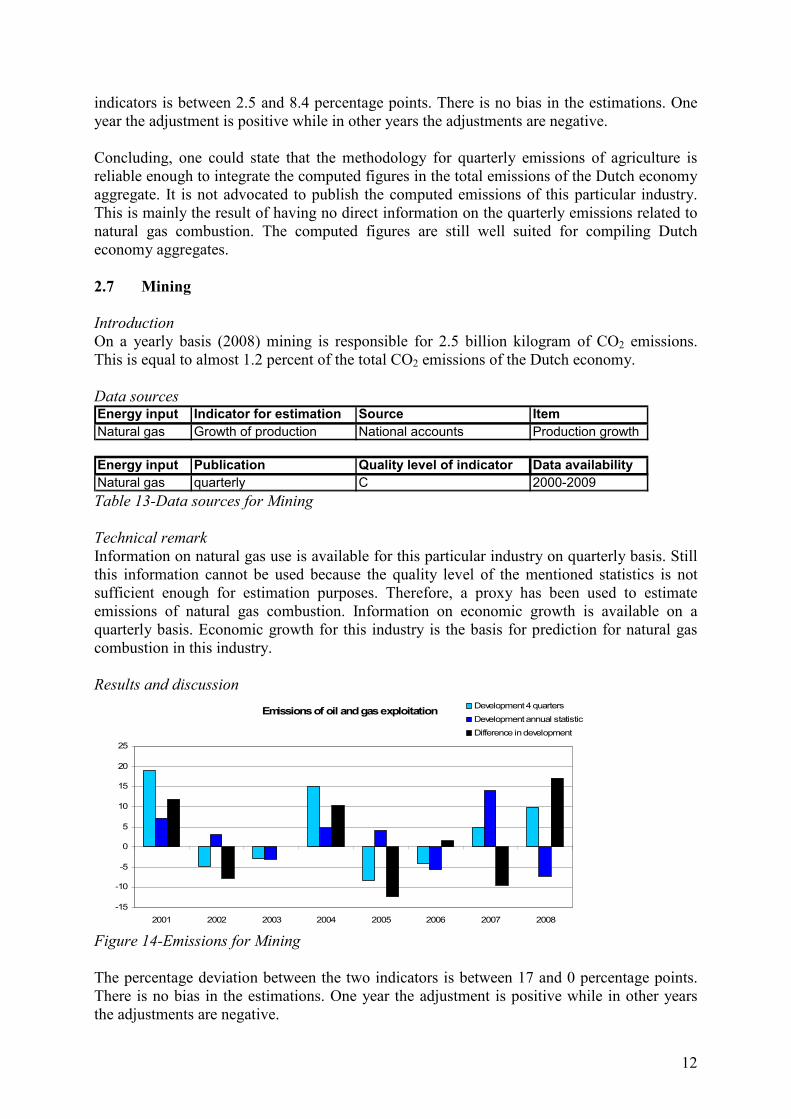
indicators is between 2.5 and 8.4 percentage points. There is no bias in the estimations. One year the adjustment is positive while in other years the adjustments are negative. Concluding, one could state that the methodology for quarterly emissions of agriculture is reliable enough to integrate the computed figures in the total emissions of the Dutch economy aggregate. It is not advocated to publish the computed emissions of this particular industry. This is mainly the result of having no direct information on the quarterly emissions related to natural gas combustion. The computed figures are still well suited for compiling Dutch economy aggregates. 2.7 Mining Introduction On a yearly basis (2008) mining is responsible for 2.5 billion kilogram of CO2 emissions. This is equal to almost 1.2 percent of the total CO2 emissions of the Dutch economy. Data sources Energy input Indicator for estimation Source ItemNatural gas Growth of production National accounts Production growth
Energy input Publication Quality level of indicator Data availabilityNatural gas quarterly C 2000-2009Table 13-Data sources for Mining Technical remark Information on natural gas use is available for this particular industry on quarterly basis. Still this information cannot be used because the quality level of the mentioned statistics is not sufficient enough for estimation purposes. Therefore, a proxy has been used to estimate emissions of natural gas combustion. Information on economic growth is available on a quarterly basis. Economic growth for this industry is the basis for prediction for natural gas combustion in this industry. Results and discussion
Emissions of oil and gas exploitation
-15
-10
-5
0
5
10
15
20
25
2001 2002 2003 2004 2005 2006 2007 2008
Development 4 quarters
Development annual statistic
Difference in development
Figure 14-Emissions for Mining The percentage deviation between the two indicators is between 17 and 0 percentage points. There is no bias in the estimations. One year the adjustment is positive while in other years the adjustments are negative.

13
Concluding, one could state it is not advocated to publish the computed emissions of this particular industry. This is mainly the result of having no direct and accurate information on the quarterly emissions related to natural gas combustion. The computed figures are still well suited for compiling Dutch economy aggregates. 2.8 Natural gas combustion by households, services and other users Introduction In the Netherlands natural gas is a very important energy input for the economy. Information related to natural gas use is available on a monthly and quarterly basis at macro level only. On a monthly and quarterly basis there is only more detailed information available for energy companies. Natural gas is also used in manufacture of petroleum products, manufacture of basic chemicals and man-made fibres and manufacture of basic metals and agriculture. As discussed, for these industries there is no specific information for natural gas use available on a monthly and quarterly basis. The information on macro level can be used to compute total emissions by natural gas combustion (taking into account only energetic use of natural gas) in the Dutch economy. For the emissions intensive industries (manufacture of petroleum products, manufacture of basic chemicals and man-made fibres and manufacture of basic metals, mining and agriculture) estimations have been made for emissions related to natural gas combustion on a quarterly basis. These emissions have been deducted from the computed emissions on macro level. The remainder, or balance item, represents the emissions related to natural gas combustion by households, services and other users of natural gas. Balance item
2001 2002 2003 2004 2005 2006 2007 2008Q 1 14895 13958 15715 14858 14808 15068 11673 13236Q 2 6151 7420 6164 6171 6570 6689 5228 6241Q 3 4867 5108 4326 5351 4809 4402 5065 5316Q 4 11217 11783 11937 12328 11151 9475 11823 11114 Table 15-Balance item emissions of natural gas combustion The emissions of the balance item will be distributed to households, services and other users of natural gas. Households The CO2 emissions of households are estimated by the indicator ‘supply by regional energy networks’ The base line level for emissions for households for heating houses is the annual figure of the Emission Registration. This baseline level is divided into four quarters based upon information of gas consumption of the national accounts. Estimations for the next quarter are made with use of the change in ‘supply by regional energy networks ’. Change in ‘supply by regional energy networks’ is the indicator for estimation of household natural gas combustion.
2001 2002 2003 2004 2005 2006 2007 2008Q 1 8833 7655 8481 7921 7914 9028 6410 7231Q 2 3636 3328 3031 2957 3243 3667 2675 3423Q 3 2331 2322 2132 2567 2252 1646 1994 1941Q 4 6171 6973 7293 6416 6036 4977 6204 6366year total 20971 20279 20937 19861 19445 19317 17284 18960 Table 16-Emissions of households

14
Emissions of households, natural gas combustion Emissions natural
gas combustion, households
-10
-8
-6
-4
-2
0
2
4
6
8
10
12
2001 2002 2003 2004 2005 2006 2007 2008
year
percentage change Sum of four quarters, developmentDevelopment year statistics
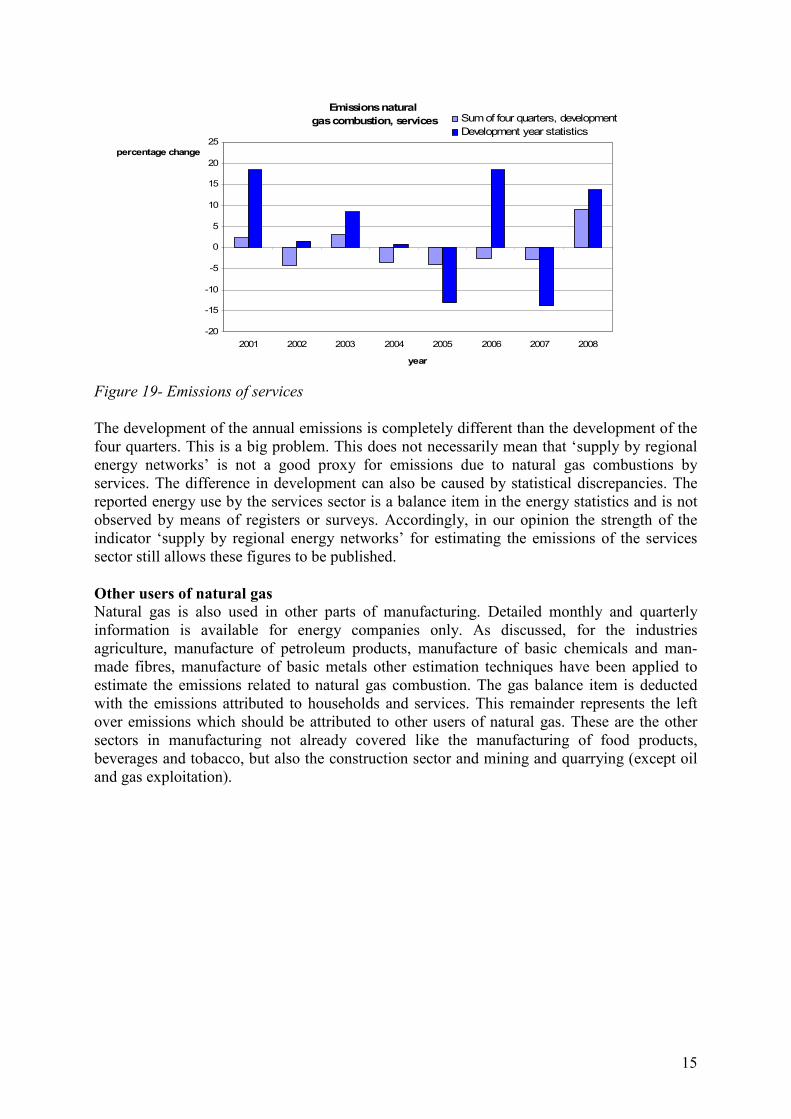
Figure 17-Emissions of households The indicator ‘supply by regional energy networks’ is a good proxy for estimating quarterly emissions due to natural gas combustion by households. These figures can be published. Services The emissions of Services are estimated by the indicator ‘supply by regional energy networks’ (see discussion above). The base line level for emissions of services for heating offices is the annual figure of the Emission Registration. This baseline level is divided into four quarters with use of information on gas consumption of the National accounts. Estimations for the next quarter are made with use of the change in ‘supply by regional energy networks’. The change in ‘supply by regional energy networks’ is the indicator for estimation of services natural gas consumption. The change in ‘supply by regional energy networks’ is the best available indicator for estimation. Another possible indicator, which is the employment number, turns out to be a less accurate estimator for CO2 emissions. This is argumented by the fact that the correlation between employment and energy use is less strong than the correlation between energy use and graaddagen.
2001 2002 2003 2004 2005 2006 2007 2008Q 1 3297 3261 3869 3847 3926 3584 3089 3416Q 2 1893 1978 1928 2004 2244 2020 1800 2063Q 3 1177 1338 1316 1687 1511 1423 2127 1931Q 4 2617 3376 3780 3541 3403 2771 4559 3786year total 8984 9953 10892 11079 11084 9798 11575 11196 Table 18-Emissions of services, natural gas combustion
15
Emissions natural gas combustion, services
-20
-15
-10
-5
0
5
10
15
20
25
2001 2002 2003 2004 2005 2006 2007 2008
year
percentage change
Sum of four quarters, developmentDevelopment year statistics
Figure 19- Emissions of services The development of the annual emissions is completely different than the development of the four quarters. This is a big problem. This does not necessarily mean that ‘supply by regional energy networks’ is not a good proxy for emissions due to natural gas combustions by services. The difference in development can also be caused by statistical discrepancies. The reported energy use by the services sector is a balance item in the energy statistics and is not observed by means of registers or surveys. Accordingly, in our opinion the strength of the indicator ‘supply by regional energy networks’ for estimating the emissions of the services sector still allows these figures to be published. Other users of natural gas Natural gas is also used in other parts of manufacturing. Detailed monthly and quarterly information is available for energy companies only. As discussed, for the industries agriculture, manufacture of petroleum products, manufacture of basic chemicals and man-made fibres, manufacture of basic metals other estimation techniques have been applied to estimate the emissions related to natural gas combustion. The gas balance item is deducted with the emissions attributed to households and services. This remainder represents the left over emissions which should be attributed to other users of natural gas. These are the other sectors in manufacturing not already covered like the manufacturing of food products, beverages and tobacco, but also the construction sector and mining and quarrying (except oil and gas exploitation).
16
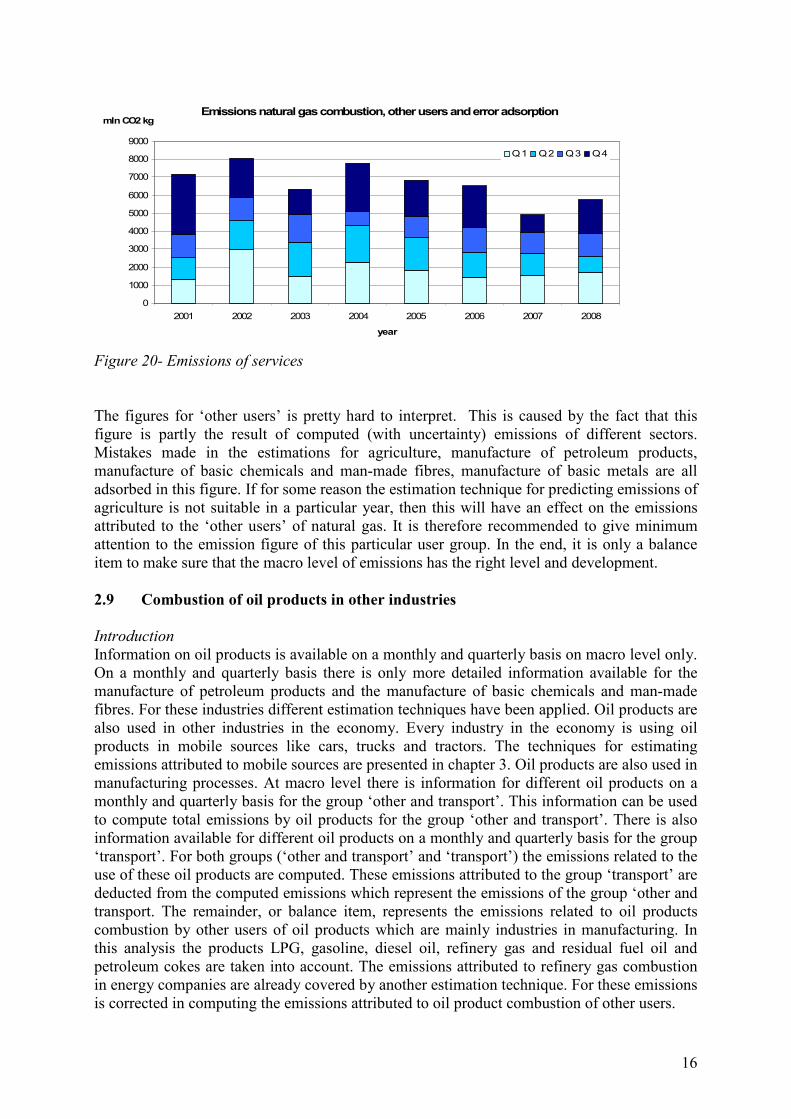
Emissions natural gas combustion, other users and error adsorption
0
1000
2000
3000
4000
5000
6000
7000
8000
9000
2001 2002 2003 2004 2005 2006 2007 2008
year
mln CO2 kg
Q1 Q2 Q3 Q4
Figure 20- Emissions of services
The figures for ‘other users’ is pretty hard to interpret. This is caused by the fact that this figure is partly the result of computed (with uncertainty) emissions of different sectors. Mistakes made in the estimations for agriculture, manufacture of petroleum products, manufacture of basic chemicals and man-made fibres, manufacture of basic metals are all adsorbed in this figure. If for some reason the estimation technique for predicting emissions of agriculture is not suitable in a particular year, then this will have an effect on the emissions attributed to the ‘other users’ of natural gas. It is therefore recommended to give minimum attention to the emission figure of this particular user group. In the end, it is only a balance item to make sure that the macro level of emissions has the right level and development. 2.9 Combustion of oil products in other industries Introduction Information on oil products is available on a monthly and quarterly basis on macro level only. On a monthly and quarterly basis there is only more detailed information available for the manufacture of petroleum products and the manufacture of basic chemicals and man-made fibres. For these industries different estimation techniques have been applied. Oil products are also used in other industries in the economy. Every industry in the economy is using oil products in mobile sources like cars, trucks and tractors. The techniques for estimating emissions attributed to mobile sources are presented in chapter 3. Oil products are also used in manufacturing processes. At macro level there is information for different oil products on a monthly and quarterly basis for the group ‘other and transport’. This information can be used to compute total emissions by oil products for the group ‘other and transport’. There is also information available for different oil products on a monthly and quarterly basis for the group ‘transport’. For both groups (‘other and transport’ and ‘transport’) the emissions related to the use of these oil products are computed. These emissions attributed to the group ‘transport’ are deducted from the computed emissions which represent the emissions of the group ‘other and transport. The remainder, or balance item, represents the emissions related to oil products combustion by other users of oil products which are mainly industries in manufacturing. In this analysis the products LPG, gasoline, diesel oil, refinery gas and residual fuel oil and petroleum cokes are taken into account. The emissions attributed to refinery gas combustion in energy companies are already covered by another estimation technique. For these emissions is corrected in computing the emissions attributed to oil product combustion of other users.

17
2001 2002 2003 2004 2005 2006 2007 2008Q1 191 344 443 544 259 253 534 538Q2 132 193 464 377 223 279 450 461Q3 194 315 460 325 220 162 518 390Q4 385 372 422 293 218 168 473 476
year 902 1223.618 1789.133 1538.536 920.445 862.321 1974.441 1864.049 Table 21-Emissions of other users, oil products combustion
2.10 Emissions due to combustion: an overview
Average absolute error in developmentElectricity and gas supply (NACE 40) 0.6%Manufacture of petroleum products (NACE 23) 1.4%Manufacture of chemical and man-made fibres NACE 24 (no chemical products) 4.4%Manufacture of basic metals (NACE 27) 4.4%Sewage and refuse disposal services (NACE 90) 3.2%Agriculture (NACE 1 and 2) 4.8%Mining (NACE 11) 8.8%Natural gas combustion by households 1.7%Natural gas combustion by services 9.6% Table 22-An overview of the absolute error in development The average error for quarterly CO2 emissions for stationary sources is very different for the different NACE classes under consideration. The average error is small for the energy companies, which is good news because this industry is responsible for nearly 25 percent of total emissions. The average error for the industries manufacture of petroleum products, chemical and man-made fibres and basic metals is quite substantial. The same story holds for the industries mining and agriculture. This is mainly induced by the fact that information on natural gas use for these sectors is absent on quarterly basis. This absence leads to large discrepancies between annual figures and quarterly figures. The problem is big at meso-level but is quite small at macro level. This is because at macro level there is indeed information available on total natural gas use on quarterly basis. The item ‘balance item’ (see paragraph 1.8) partly solves the individual problems at meso level. In chapter 5, discussing the dissemination strategy, a solution for these problems at meso level is proposed. The average error for household’s combustion of natural gas is quite small. Apparently the indicator ‘supply by regional energy networks’ is a good estimator for household’s emissions. To the contrary, the average error for services’s emissions due to combustion of natural gas is quite big. This is mainly induced by the fact that energy use of services is a balance item in the energy statistics. All statistical discrepancies in the energy statistics show up in the item ‘energy use of services’. The comparison between annual figures and quarterly figures are thus not so meaningful. It is proposed here that the indicator ‘supply by regional energy networks’ is a meaningful indicator for emissions of services. The problems related to services are also solved by introducing the macro totals on natural gas use combustion.

18
2.11 Emissions by stationary sources: process emissions Introduction Besides the direct combustion of fuels, CO2 emissions can also be produced during certain industrial processes. Examples include the production of cokes, the refining of crude oil or the production of iron and steel. These so-called process emissions account for nearly 5 percent of total Dutch emissions. Process emissions can be divided into fossil process emissions and non-fossil process emissions. Fossil process emissions Three industries are responsible for the majority of the fossil process emissions in the Dutch economy. These are manufacture of petroleum products, manufacture of basic chemicals and man-made fibres and manufacture of basic metals. The changes in fossil process emissions of these industries have been estimated using information on quarterly production growth of the National accounts. The base line level of emissions is based upon annual figures of the Dutch Emission Inventory. The annual figure of the Emission Registration is proportionally divided over the four quarters. Making use of production growth per industry, emissions for the next quarter are estimated for these three industries. The fossil process emissions of other industries are not estimated using complicated estimating techniques. For these other process emissions, which are very small, it seems not feasible to choose a good estimator. Therefore is chosen to keep the fossil process emissions of these industries on the level as the same quarter in the previous year. Non-fossil process emissions A few industries emit also non-fossil process emissions. These are agriculture, manufacture of basic chemicals and man-made fibres, manufacture of construction materials, manufacture of basic metals, energy companies and construction. The annual figures of the Dutch Emission Inventory have been used to determine base line levels at year level. Information on quarterly production has been used to set emission levels at quarterly level per industry. Production growth is the indicator for estimating emissions for the same quarter the next year.
Q1 2668 2633 2458 2409 2452 2433 2443 2372Q2 2815 2667 2435 2451 2506 2498 2423 2398Q3 2630 2622 2448 2273 2534 2377 2427 2331Q4 2604 2641 2493 2327 2652 2408 2442 2118
sum of four quarters 10716 10563 9834 9460 10144 9716 9735 9219year statistic 10999 9644 9669 9626 9551 9541 9763 8929
difference with year statistic -282 919 165 -166 593 175 -28 290 Table 23-Emissions of fossil and non-fossil process emissions Results and discussion Process emissions are rather small with respect to total CO2 emissions. The absolute deviation can be rather substantial although the relative impact of such a mistake is really negligible. In the end, one could state that the methodology for estimating quarterly process emissions is reliable enough to integrate the computed figures in the total emissions of the Dutch economy aggregate. It is not advocated to publish the computed process emissions. The average absolute error in development for process emissions is equal to 3.2 percent.
19
3. Emissions from mobile sources
3.1 Introduction Mobile sources include various means of transport such as passenger cars, trucks, inland waterway vessels and aircraft, as well as mobile machinery with combustion engines, such as farm tractors and forklifts. In the Netherlands, mobile sources provide a significant contribution to air pollution. To calculate the quarterly CO2 emissions, the following three categories have been analysed:
1. Road and rail traffic (including mobile machinery) 2. Water transport (inland navigation, seagoing shipping and fisheries) 3. Air transport
Emissions from mobile sources can be calculated according to three different definitions:
1. IPCC emissions: The IPCC emissions are the Dutch emissions of greenhouse gases as reported to the United Nations and the European Union. Various aspects of this process take place due to the reporting obligations of the UN Framework Convention on Climate Change (UNFCCC) and the EU Greenhouse Gas Monitoring Mechanism. The emissions are calculated according to the IPCC regulations.
2. Actual emissions: Emissions calculated for the national territory. Accordingly all emission from traffic from activities within the borders of the Netherlands are included, including the national portion of the continental shelf.
3. Environmental accounts emissions: These include emissions caused by residents abroad and exclude emissions by non residents. These emissions are calculated by correcting the actual emissions for these two items. The EA emissions are therefore directly comparable with data from the National accounts.
The essential difference between the IPCC method and the territory method (based on energy consumption) is that the IPCC method is primarily based on fuel sales in a single country and the territory method (actual emissions) is based on fuel consumption on national territory. There are other methodological differences as well which primarily concern the method of attributing emissions to a specific country. Crucially important to this process is an IPCC recommendation: international bunker fuels are combusted in vessels at sea and by airplanes (both undertaking international movements) and therefore should be included in global greenhouse gas estimations. However, they are reported separately and, as far as possible, excluded from national totals. The main difference between actual emissions and EA emissions is the resident principle. Accordingly, the actual emissions have to be corrected for the emissions caused by non-residents (-) and the emissions caused by residents abroad (+). In this chapter estimation methods are presented to calculate quarterly CO2 emissions for mobile sources according to the resident principle (environmental accounting definitions). Whereas for stationary sources it can be assumed that all fuels sold within a country will be consumed by resident units on the national territory, this is not the case for mobile sources. This is why, next to energy statistics, also other data sources, including output data from the quarterly national accounts, have to be used to find the best way to predict quarterly CO2emissions.

20
3.2 General methodology Although the data sources used to calculate quarterly emissions for different mobile sources may be different, a general methodology can be applied. A certain data source (D) which is available on a monthly or quarterly basis, is used as an estimator for the quarterly changes in CO2 emissions. These estimated changes are used to calculate quarterly emissions by multiplying quarterly changes with the quarterly emissions from the previous year. The quarterly emissions of the previous year are rebased using the annual CO2-emissions obtained from the annual air emission accounts. The process for calculating quarterly CO2 emissions is described below step by step:
1. Aggregating monthly data to a quarter: Monthly data of the source data (Dm) is aggregated to a quarter (Dq).
Dm1 + Dm2 + Dm3 = Dt1
2. Calculating the mutations: The quarterly data of the source data (Dq) is used to calculate the quarterly changes relative to previous year (Cq):
Cq = Dq/Dq-4
3. Calculating the share: The quarterly data of the indicator data is also used to calculate the share (%) of each quarter within a year (Sq):
Sq = Dq/(Dq1 + Dq2 + Dq3 + Dq4)
4. Rebasing: the rebased quarterly CO2 emissions in quarter q (RQEq) are calculated using the formula:
RQEq = annual CO2 emission * Sq
Where the annual CO2 emissions is the EA emission.
5. Calculating the quarterly emissions: The emission of a ‘new’ quarter (QEq) is estimated by multiplying the rebased quarter emission of the previous year (RQEq-
4) with the quarterly change relative to previous year (Cq):
QEq = RQEq-4 * Cq
3.3 Road transport Introduction Road traffic consists of all motorized vehicles driving on public roads, including foreign vehicles. Road transport is responsible for 38,5 Mton CO2 emissions, or 18,9 percent of the total of the Dutch economy (Environmental accounts 2008). This refers to emissions from road vehicles, such as cars, delivery vans, lorries, cabins (for articulated lorries), buses, special vehicles, motorbikes and mopeds. Less important categories include land vehicles used in agriculture, building, or national defence. The road traffic CO2-emissions depend on the vehicle’s specific fuel consumption and fuel type (carbon content of the fuel) (Klein et al.
21
2009). They can also be related to the emissions of components containing carbon such as CO, VOC and particulates (PM10). In the CO2 emission calculations however it has been assumed that the carbon is completely released as CO2.
Here, the domestic delivery of fuel (diesel, petrol, LPG) for road transport will be investigated as an estimator for calculating the changes in quarterly CO2 emissions. Data sources On a monthly basis, Statistics Netherlands reports total delivery of petrol, diesel and LPG for road traffic (see Statistics Netherlands, StatLine). These statistics provide an overview of the total deliveries of motor fuels for road transport for final use purposes, both in kg, litre and PJ. Diesel used for mobile machinery and rail transport is excluded in the data on the total deliveries of motor fuels for traffic. Delivery data for this category can be derived from the data in the statistics on supply, use and stock for oil products (see Statistics Netherlands, StatLine), which also is compiled on a monthly basis. Methodology In addition to the general methodology the following remarks can made:
• The source data for emission related to diesel combustion by mobile sources is obtained by adding diesel used for mobile machinery to diesel delivered for road transport.
• Calculating quarterly emissions for different sectors and households: emissions due to
petrol, diesel and LPG combustion have to be assigned to economic sectors and households that are undertaking the transport activities in the course of their production or consumption. This assignation is done by using a distribution key obtained from the annual emissions accounts of the previous year.
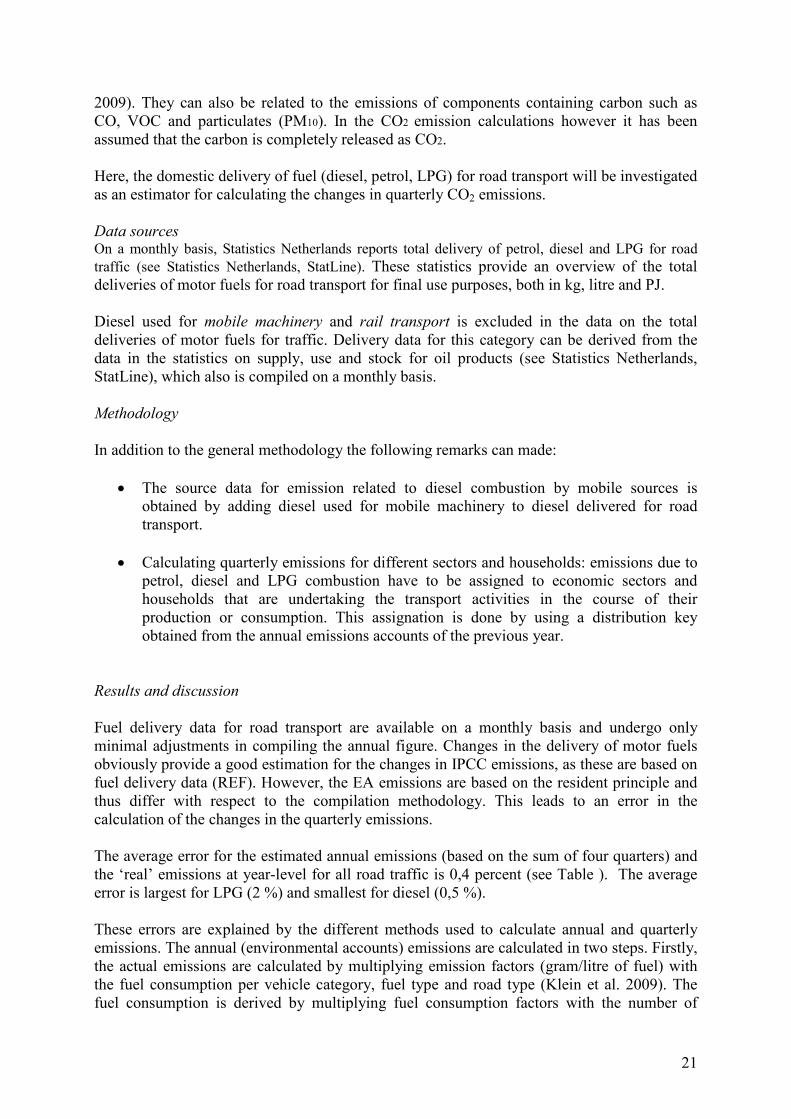
Results and discussion Fuel delivery data for road transport are available on a monthly basis and undergo only minimal adjustments in compiling the annual figure. Changes in the delivery of motor fuels obviously provide a good estimation for the changes in IPCC emissions, as these are based on fuel delivery data (REF). However, the EA emissions are based on the resident principle and thus differ with respect to the compilation methodology. This leads to an error in the calculation of the changes in the quarterly emissions. The average error for the estimated annual emissions (based on the sum of four quarters) and the ‘real’ emissions at year-level for all road traffic is 0,4 percent (see Table ). The average error is largest for LPG (2 %) and smallest for diesel (0,5 %). These errors are explained by the different methods used to calculate annual and quarterly emissions. The annual (environmental accounts) emissions are calculated in two steps. Firstly, the actual emissions are calculated by multiplying emission factors (gram/litre of fuel) with the fuel consumption per vehicle category, fuel type and road type (Klein et al. 2009). The fuel consumption is derived by multiplying fuel consumption factors with the number of
22
kilometres travelled by vehicles in the Netherlands. Total CO2 emission from road traffic in the Netherlands is thus calculated using a "bottom-up" approach: the emissions of individual vehicle categories are summed to arrive at total emissions. In a second step, the environmental accounts emissions are calculated from the actual emissions. This is done by adding the emissions caused by residents abroad (lorries, tourists, etc.) and subtracting the emissions caused by non residents.
0,0
0,5
1,0
1,5
2,0
2,5
3,0
3,5
4,0
4,5
5,0
2001 2002 2003 2004 2005 2006 2007 2008
%
Fuel delivery Actual emissions Env acc. Emissions
Figure 24-annual changes for fuel delivery, actual emissions and environmental accounts emissions for diesel.
-2,0
-1,5
-1,0
-0,5
0,0
0,5
1,0
1,5
2,0
2,5
2001 2002 2003 2004 2005 2006 2007 2008
%
Fuel delivery Actual emissions Env acc. Emissions
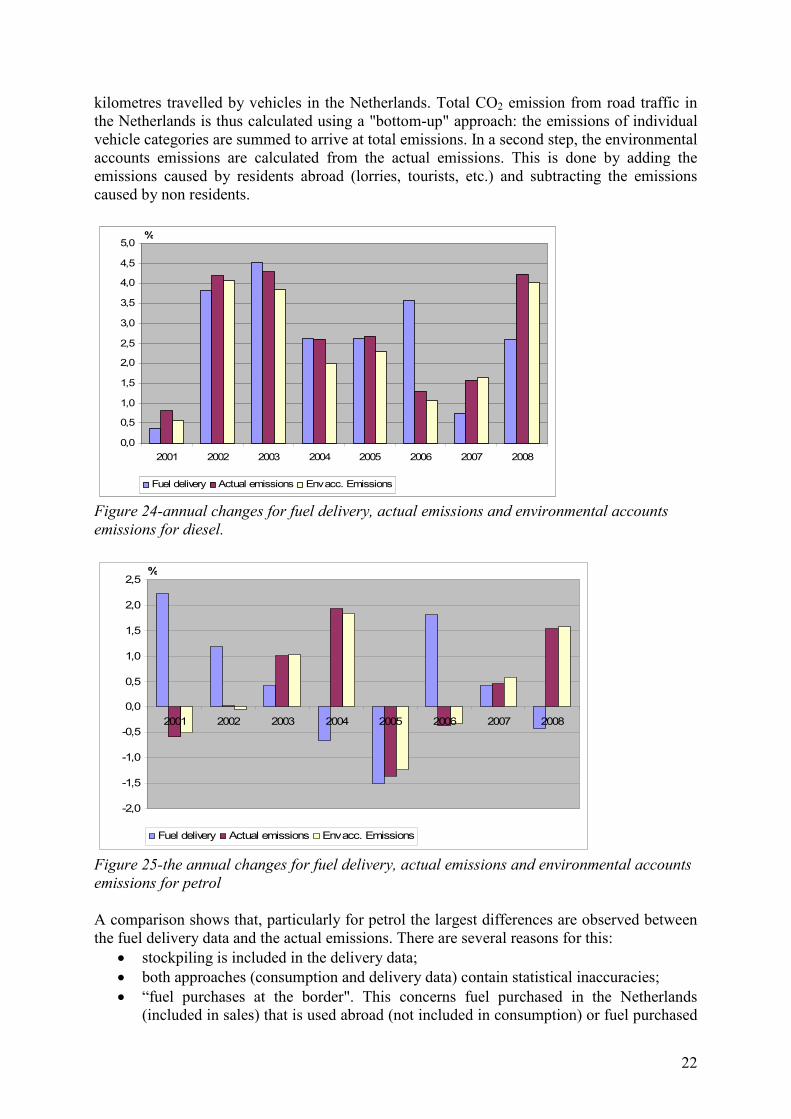
Figure 25-the annual changes for fuel delivery, actual emissions and environmental accounts emissions for petrol A comparison shows that, particularly for petrol the largest differences are observed between the fuel delivery data and the actual emissions. There are several reasons for this:
• stockpiling is included in the delivery data; • both approaches (consumption and delivery data) contain statistical inaccuracies; • “fuel purchases at the border". This concerns fuel purchased in the Netherlands
(included in sales) that is used abroad (not included in consumption) or fuel purchased

23
abroad (not included in sales) that is used in the Netherlands (included in consumption).
The comparison also shows that there is less difference between the changes calculated for the actual and EA emissions. This shows that for road transport the changes in actual emissions are more or less equal to changes in the EA emissions. For example the change in emissions from diesel occurring within the Dutch territory is very similar to the change in emissions for all Dutch residents. Conclusion Quarterly changes in CO2 emissions for road traffic can be estimated based on monthly data on the delivery on motor fuels. An error is introduced because annual EA emissions are based on the calculation of the actual emissions. The error in applying the resident principle is negligible. 3.4 Water transport and fisheries Introduction In the Netherlands, water transport is responsible for 7,9 Mton CO2 emissions, or 3,9 percent of the total of the economy (2008). Three categories of water transport are distinguished:
• Inland navigation • Seagoing shipping • Fisheries
For inland shipping and seagoing vessels two data sources have been investigated to estimate the quarterly CO2 emissions, namely bunkering data of the energy statistics and quarterly output data of the National accounts. Both data sources will be compared in order to find the best method to estimate the quarterly CO2 emissions. For fisheries and defence activities only one data source is available to estimate the emissions, namely the quarterly output data from the National accounts. Data sources On a monthly basis two data sources are available to estimate fuel use and CO2 emissions for inland shipping and seagoing vessels:
1) Bunkering data from the energy statistics. On a monthly basis, Statistics Netherlands reports total bunkering of diesel and fuel oil for inland shipping and seagoing vessels (see Statistics Netherlands, StatLine). These statistics are reported both in kg, liter and PJ.
2) Output data from the quarterly economic accounts. On monthly basis output data in constant prices is available for both inland shipping and seagoing vessels.
Results and discussion The first option for estimating quarterly CO2 emissions is using the quarterly changes from bunkering data. Bunkering refers to the intake of fuel by ships and airplanes to be used for their own propulsion in border crossing traffic. The fuel is thus supplied to both resident and non- resident units. In the Netherlands, respectively 60 and 10 percent of the fuel bunkered is supplied to domestic vessels (residents) for inland shipping and seagoing shipping.
24
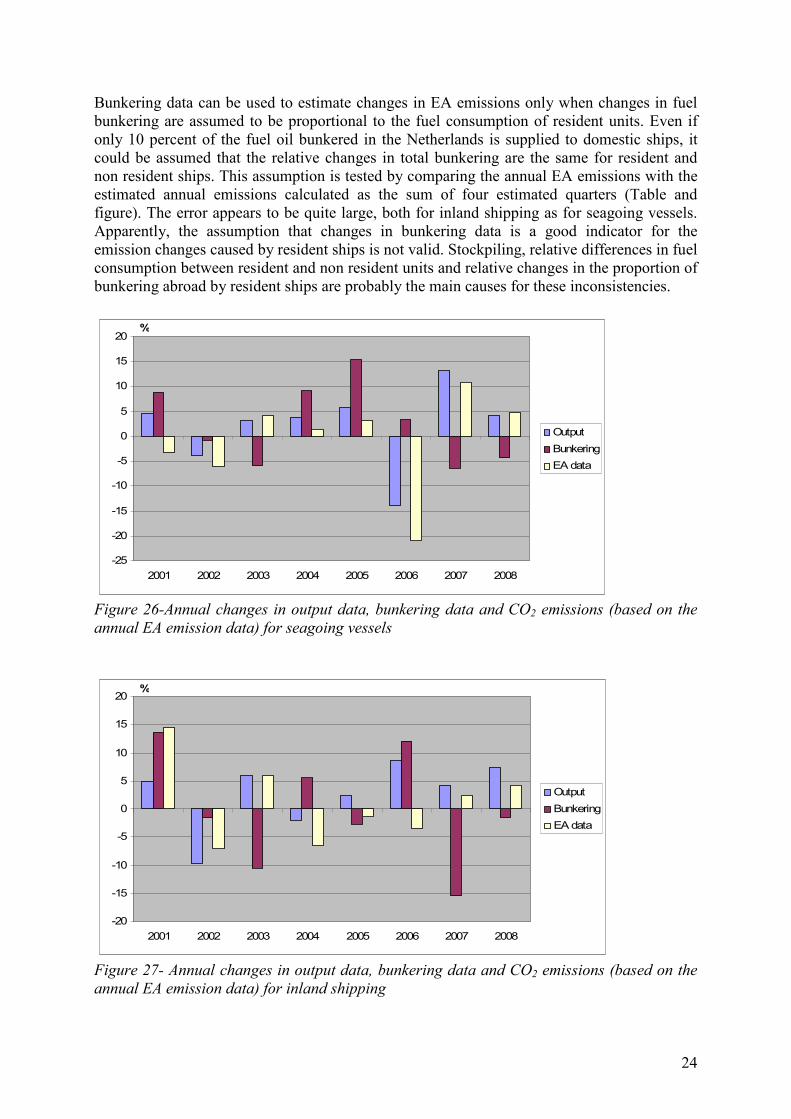
Bunkering data can be used to estimate changes in EA emissions only when changes in fuel bunkering are assumed to be proportional to the fuel consumption of resident units. Even if only 10 percent of the fuel oil bunkered in the Netherlands is supplied to domestic ships, it could be assumed that the relative changes in total bunkering are the same for resident and non resident ships. This assumption is tested by comparing the annual EA emissions with the estimated annual emissions calculated as the sum of four estimated quarters (Table and figure). The error appears to be quite large, both for inland shipping as for seagoing vessels. Apparently, the assumption that changes in bunkering data is a good indicator for the emission changes caused by resident ships is not valid. Stockpiling, relative differences in fuel consumption between resident and non resident units and relative changes in the proportion of bunkering abroad by resident ships are probably the main causes for these inconsistencies.
-25
-20
-15
-10
-5
0
5
10
15
20
2001 2002 2003 2004 2005 2006 2007 2008
%
OutputBunkeringEA data
Figure 26-Annual changes in output data, bunkering data and CO2 emissions (based on the annual EA emission data) for seagoing vessels
-20
-15
-10
-5
0
5
10
15
20
2001 2002 2003 2004 2005 2006 2007 2008
%
OutputBunkeringEA data
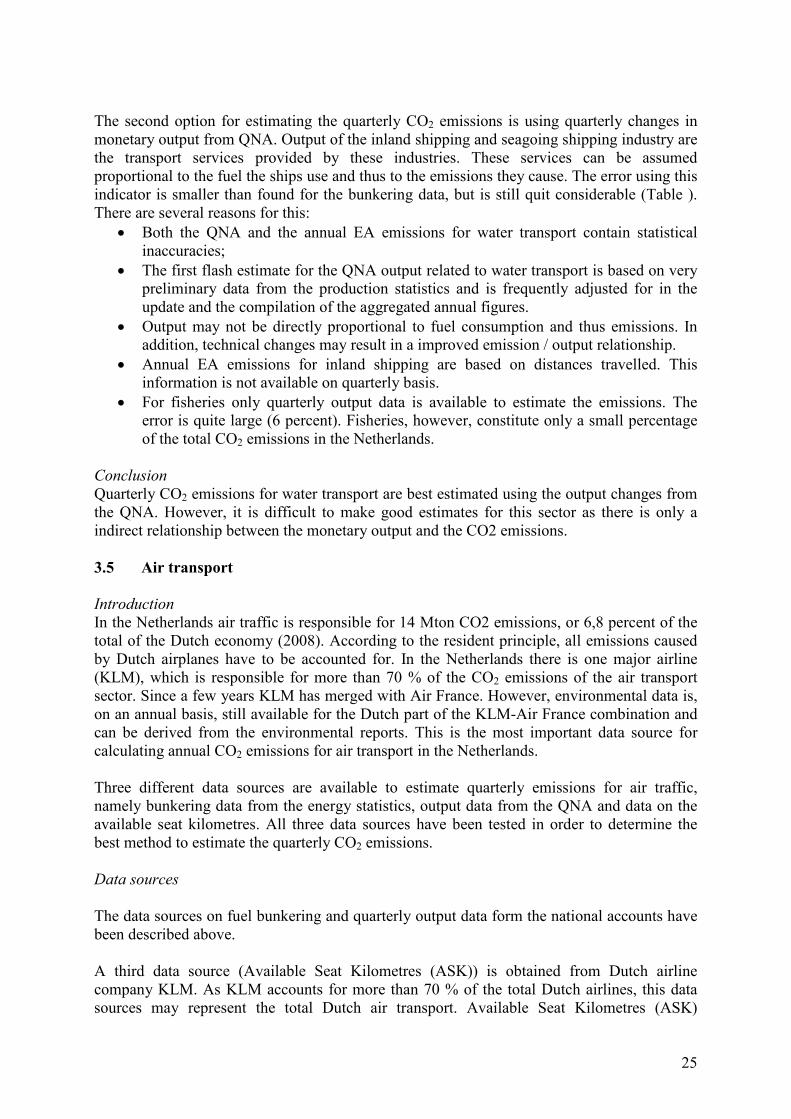
Figure 27- Annual changes in output data, bunkering data and CO2 emissions (based on the annual EA emission data) for inland shipping
25
The second option for estimating the quarterly CO2 emissions is using quarterly changes in monetary output from QNA. Output of the inland shipping and seagoing shipping industry are the transport services provided by these industries. These services can be assumed proportional to the fuel the ships use and thus to the emissions they cause. The error using this indicator is smaller than found for the bunkering data, but is still quit considerable (Table ). There are several reasons for this:
• Both the QNA and the annual EA emissions for water transport contain statistical inaccuracies;
• The first flash estimate for the QNA output related to water transport is based on very preliminary data from the production statistics and is frequently adjusted for in the update and the compilation of the aggregated annual figures.
• Output may not be directly proportional to fuel consumption and thus emissions. In addition, technical changes may result in a improved emission / output relationship.
• Annual EA emissions for inland shipping are based on distances travelled. This information is not available on quarterly basis.
• For fisheries only quarterly output data is available to estimate the emissions. The error is quite large (6 percent). Fisheries, however, constitute only a small percentage of the total CO2 emissions in the Netherlands.
Conclusion Quarterly CO2 emissions for water transport are best estimated using the output changes from the QNA. However, it is difficult to make good estimates for this sector as there is only a indirect relationship between the monetary output and the CO2 emissions. 3.5 Air transport Introduction In the Netherlands air traffic is responsible for 14 Mton CO2 emissions, or 6,8 percent of the total of the Dutch economy (2008). According to the resident principle, all emissions caused by Dutch airplanes have to be accounted for. In the Netherlands there is one major airline (KLM), which is responsible for more than 70 % of the CO2 emissions of the air transport sector. Since a few years KLM has merged with Air France. However, environmental data is, on an annual basis, still available for the Dutch part of the KLM-Air France combination and can be derived from the environmental reports. This is the most important data source for calculating annual CO2 emissions for air transport in the Netherlands. Three different data sources are available to estimate quarterly emissions for air traffic, namely bunkering data from the energy statistics, output data from the QNA and data on the available seat kilometres. All three data sources have been tested in order to determine the best method to estimate the quarterly CO2 emissions. Data sources The data sources on fuel bunkering and quarterly output data form the national accounts have been described above. A third data source (Available Seat Kilometres (ASK)) is obtained from Dutch airline company KLM. As KLM accounts for more than 70 % of the total Dutch airlines, this data sources may represent the total Dutch air transport. Available Seat Kilometres (ASK)
26
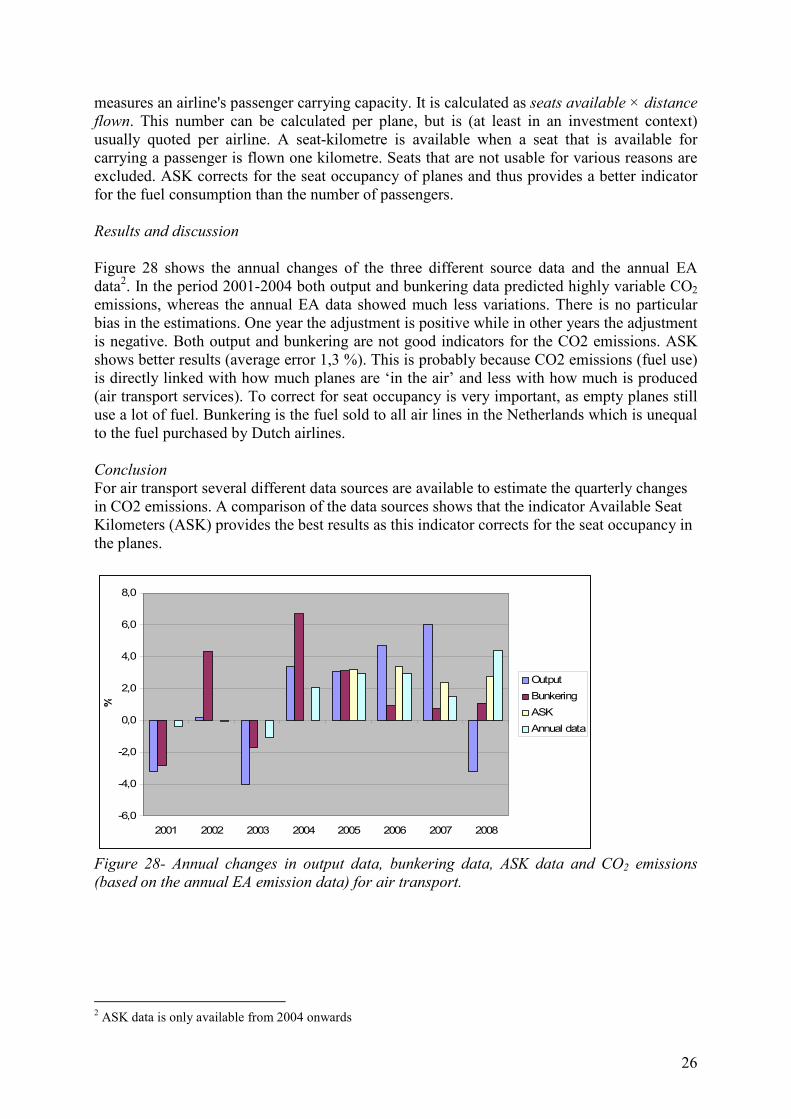
measures an airline's passenger carrying capacity. It is calculated as seats available × distance flown. This number can be calculated per plane, but is (at least in an investment context) usually quoted per airline. A seat-kilometre is available when a seat that is available for carrying a passenger is flown one kilometre. Seats that are not usable for various reasons are excluded. ASK corrects for the seat occupancy of planes and thus provides a better indicator for the fuel consumption than the number of passengers. Results and discussion Figure 28 shows the annual changes of the three different source data and the annual EA data2. In the period 2001-2004 both output and bunkering data predicted highly variable CO2emissions, whereas the annual EA data showed much less variations. There is no particular bias in the estimations. One year the adjustment is positive while in other years the adjustment is negative. Both output and bunkering are not good indicators for the CO2 emissions. ASK shows better results (average error 1,3 %). This is probably because CO2 emissions (fuel use) is directly linked with how much planes are ‘in the air’ and less with how much is produced (air transport services). To correct for seat occupancy is very important, as empty planes still use a lot of fuel. Bunkering is the fuel sold to all air lines in the Netherlands which is unequal to the fuel purchased by Dutch airlines. Conclusion For air transport several different data sources are available to estimate the quarterly changes in CO2 emissions. A comparison of the data sources shows that the indicator Available Seat Kilometers (ASK) provides the best results as this indicator corrects for the seat occupancy in the planes.
-6,0
-4,0
-2,0
0,0
2,0
4,0
6,0
8,0
2001 2002 2003 2004 2005 2006 2007 2008
%
OutputBunkeringASKAnnual data
Figure 28- Annual changes in output data, bunkering data, ASK data and CO2 emissions (based on the annual EA emission data) for air transport.
2 ASK data is only available from 2004 onwards
27
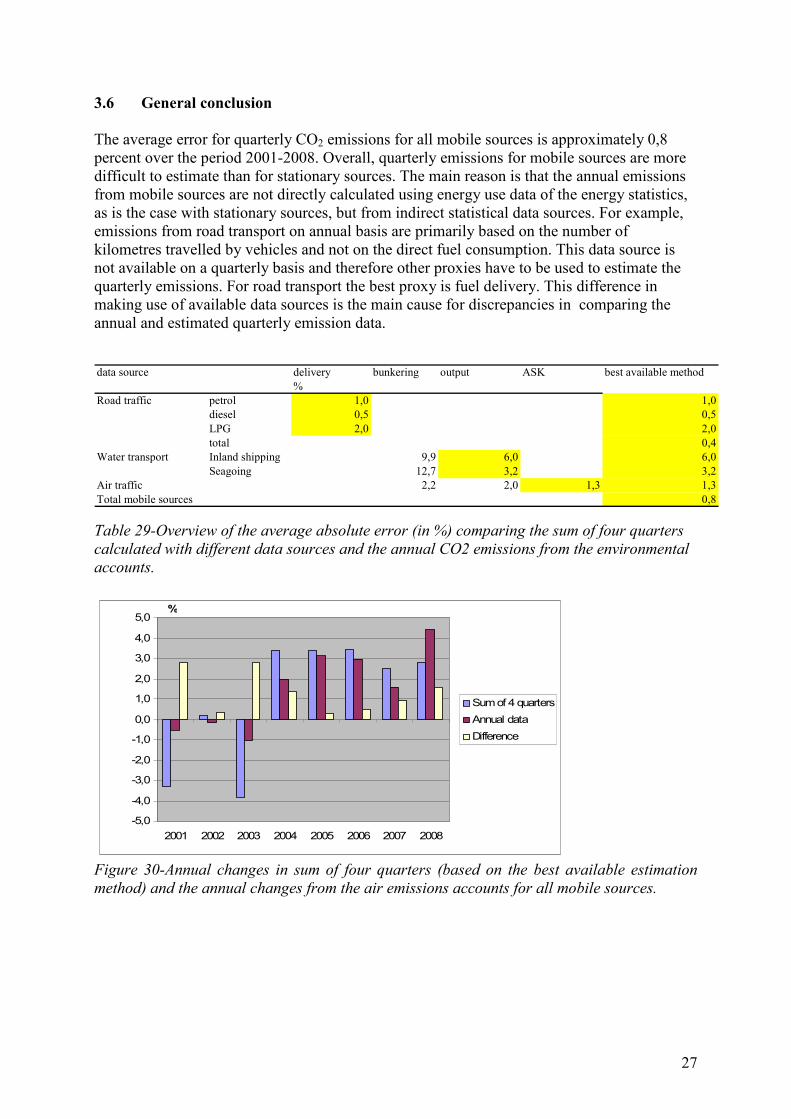
3.6 General conclusion The average error for quarterly CO2 emissions for all mobile sources is approximately 0,8 percent over the period 2001-2008. Overall, quarterly emissions for mobile sources are more difficult to estimate than for stationary sources. The main reason is that the annual emissions from mobile sources are not directly calculated using energy use data of the energy statistics, as is the case with stationary sources, but from indirect statistical data sources. For example, emissions from road transport on annual basis are primarily based on the number of kilometres travelled by vehicles and not on the direct fuel consumption. This data source is not available on a quarterly basis and therefore other proxies have to be used to estimate the quarterly emissions. For road transport the best proxy is fuel delivery. This difference in making use of available data sources is the main cause for discrepancies in comparing the annual and estimated quarterly emission data.
data source delivery bunkering output ASK best available method%
Road traffic petrol 1,0 1,0diesel 0,5 0,5LPG 2,0 2,0total 0,4
Water transport Inland shipping 9,9 6,0 6,0Seagoing 12,7 3,2 3,2
Air traffic 2,2 2,0 1,3 1,3Total mobile sources 0,8
Table 29-Overview of the average absolute error (in %) comparing the sum of four quarters calculated with different data sources and the annual CO2 emissions from the environmental accounts.
-5,0
-4,0
-3,0
-2,0
-1,0
0,0
1,0
2,0
3,0
4,0
5,0
2001 2002 2003 2004 2005 2006 2007 2008
%
Sum of 4 quartersAnnual dataDifference
Figure 30-Annual changes in sum of four quarters (based on the best available estimation method) and the annual changes from the air emissions accounts for all mobile sources.
28
4. Quality assessment and results
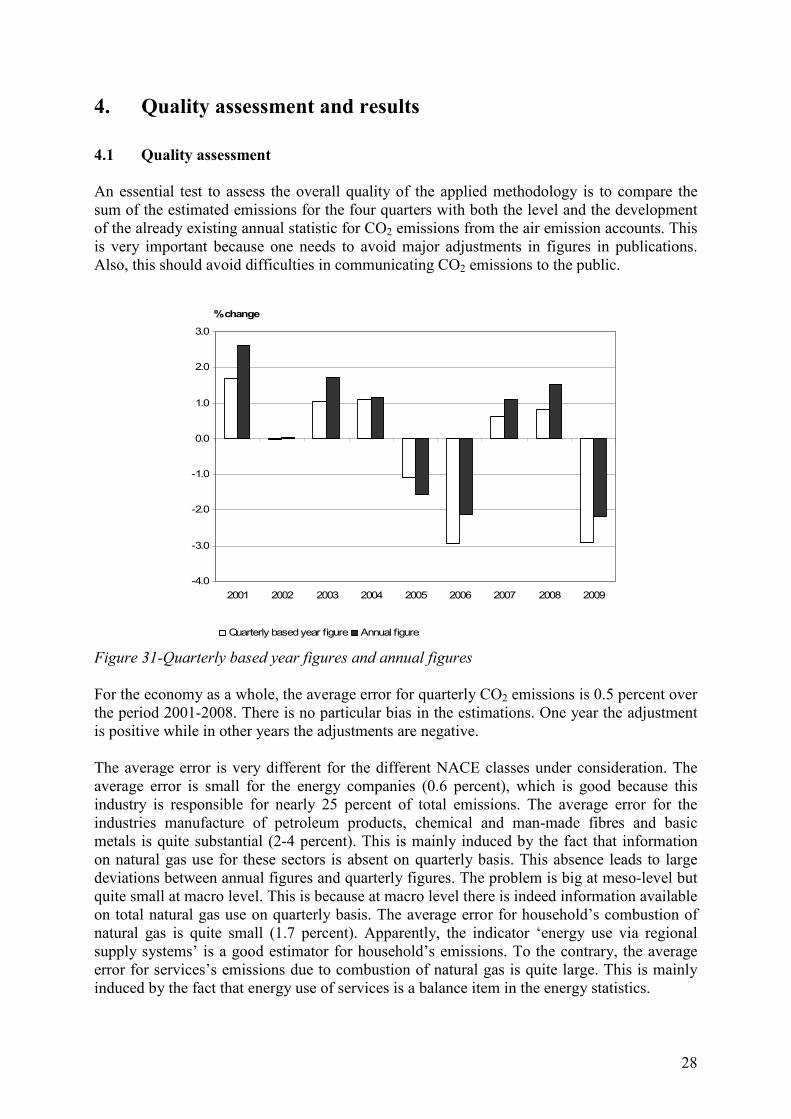
4.1 Quality assessment An essential test to assess the overall quality of the applied methodology is to compare the sum of the estimated emissions for the four quarters with both the level and the development of the already existing annual statistic for CO2 emissions from the air emission accounts. This is very important because one needs to avoid major adjustments in figures in publications. Also, this should avoid difficulties in communicating CO2 emissions to the public.
-4.0
-3.0
-2.0
-1.0
0.0
1.0
2.0
3.0
2001 2002 2003 2004 2005 2006 2007 2008 2009
%change
Quarterly based year figure Annual figure
Figure 31-Quarterly based year figures and annual figures For the economy as a whole, the average error for quarterly CO2 emissions is 0.5 percent over the period 2001-2008. There is no particular bias in the estimations. One year the adjustment is positive while in other years the adjustments are negative. The average error is very different for the different NACE classes under consideration. The average error is small for the energy companies (0.6 percent), which is good because this industry is responsible for nearly 25 percent of total emissions. The average error for the industries manufacture of petroleum products, chemical and man-made fibres and basic metals is quite substantial (2-4 percent). This is mainly induced by the fact that information on natural gas use for these sectors is absent on quarterly basis. This absence leads to large deviations between annual figures and quarterly figures. The problem is big at meso-level but quite small at macro level. This is because at macro level there is indeed information available on total natural gas use on quarterly basis. The average error for household’s combustion of natural gas is quite small (1.7 percent). Apparently, the indicator ‘energy use via regional supply systems’ is a good estimator for household’s emissions. To the contrary, the average error for services’s emissions due to combustion of natural gas is quite large. This is mainly induced by the fact that energy use of services is a balance item in the energy statistics.

29
The average error for quarterly CO2 emissions for all mobile sources is approximately 0.8 percent over the period 2001-2008. Overall, quarterly emissions for mobile sources are more difficult to estimate than for stationary sources. Particularly quarterly emissions for water transport are very hard to estimate. The main reason is that the annual emissions from mobile sources are not directly calculated using energy use data of the energy statistics, as is the case with stationary sources, but from indirect statistical data sources. For example, emissions from road transport on annual basis are primarily based on the number of kilometres travelled by vehicles and not on the direct fuel consumption. This data source is not available on a quarterly basis and therefore other proxies have to be used to estimate the quarterly emissions. As described above, the best proxy for road transport is domestic fuel delivery. Using different data sources is thus the main cause for discrepancies in comparing the annual and estimated quarterly emission data for mobile sources. 4.2 Results and discussion The seasonality of CO2 emissions Emissions per quarter show a clear seasonal pattern (Figure 2). Emissions in the first and fourth quarter (Q1 and Q4) are significantly higher than in the second and third quarters (Q2 and Q3). On average, emissions vary between 42 and 60 Mton in the period 2001-2009. Emissions in Q1 and Q4 are higher for two reasons. Firstly, average temperatures are lower in quarter 1 (winter) and quarter 4 (fall) than in quarter 2 (spring) and quarter 3 (summer). As a result of lower average temperatures houses and offices need more heating. This heating goes along with increased natural gas combustion, which induces more CO2 emissions.
40000
45000
50000
55000
60000
65000
Q1
Q2
Q3
Q4
Q1
Q2
Q3
Q4
Q1
Q2
Q3
Q4
Q1
Q2
Q3
Q4
Q1
Q2
Q3
Q4
Q1
Q2
Q3
Q4
Q1
Q2
Q3
Q4
Q1
Q2
Q3
Q4
Q1
Q2
Q3
Q4
2001 2002 2003 2004 2005 2006 2007 2008 2009
CO2 emissions, mln kg
CO2 emissions by Dutch economy
CO2 emissions by Dutch economy corrected for weather
Figure 32- CO2 emissions of the Dutch economy (including households)
30
0
2000
4000
6000
8000
10000
12000
14000
16000
Q1
Q2
Q3
Q4
Q1
Q2
Q3
Q4
Q1
Q2
Q3
Q4
Q1
Q2
Q3
Q4
Q1
Q2
Q3
Q4
Q1
Q2
Q3
Q4
Q1
Q2
Q3
Q4
Q1
Q2
Q3
Q4
Q1
Q2
Q3
Q4
2001 2002 2003 2004 2005 2006 2007 2008 2009
CO2 emissions, mln kg
Households, not corrected for the weather
Services, not corrected for the weather
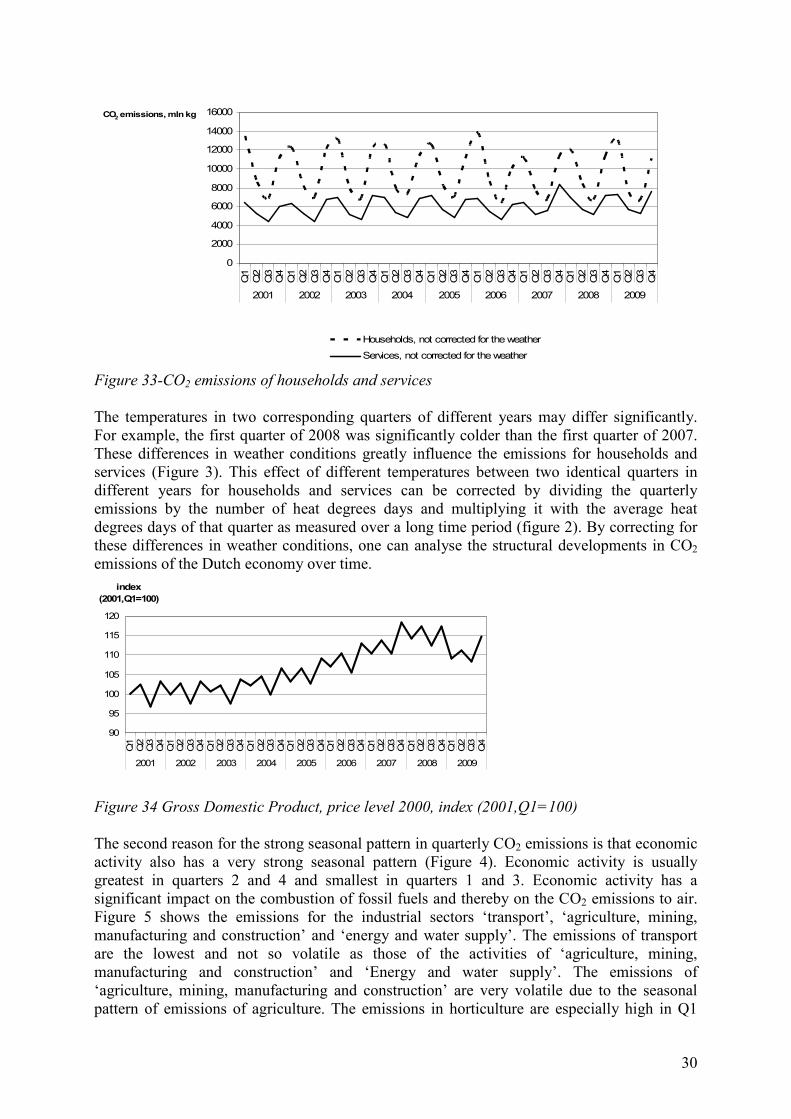
Figure 33-CO2 emissions of households and services The temperatures in two corresponding quarters of different years may differ significantly. For example, the first quarter of 2008 was significantly colder than the first quarter of 2007. These differences in weather conditions greatly influence the emissions for households and services (Figure 3). This effect of different temperatures between two identical quarters in different years for households and services can be corrected by dividing the quarterly emissions by the number of heat degrees days and multiplying it with the average heat degrees days of that quarter as measured over a long time period (figure 2). By correcting for these differences in weather conditions, one can analyse the structural developments in CO2emissions of the Dutch economy over time.
90
95
100
105
110
115
120
Q1
Q2
Q3
Q4
Q1
Q2
Q3
Q4
Q1
Q2
Q3
Q4
Q1
Q2
Q3
Q4
Q1
Q2
Q3
Q4
Q1
Q2
Q3
Q4
Q1
Q2
Q3
Q4
Q1
Q2
Q3
Q4
Q1
Q2
Q3
Q4
2001 2002 2003 2004 2005 2006 2007 2008 2009
index (2001,Q1=100)
Figure 34 Gross Domestic Product, price level 2000, index (2001,Q1=100) The second reason for the strong seasonal pattern in quarterly CO2 emissions is that economic activity also has a very strong seasonal pattern (Figure 4). Economic activity is usually greatest in quarters 2 and 4 and smallest in quarters 1 and 3. Economic activity has a significant impact on the combustion of fossil fuels and thereby on the CO2 emissions to air. Figure 5 shows the emissions for the industrial sectors ‘transport’, ‘agriculture, mining, manufacturing and construction’ and ‘energy and water supply’. The emissions of transport are the lowest and not so volatile as those of the activities of ‘agriculture, mining, manufacturing and construction’ and ‘Energy and water supply’. The emissions of ‘agriculture, mining, manufacturing and construction’ are very volatile due to the seasonal pattern of emissions of agriculture. The emissions in horticulture are especially high in Q1

31
and Q4 and relatively low in Q2 and Q3. Horticulture, which is quite large in the Netherlands, combusts more natural gas in wintertime to heat its greenhouses. Also, animal farmers use more gas in winter to warm the stables. A relatively large part of total activity in air transport takes place in quarters 2 and 3 when tourists take their summer holidays. In these quarters the emissions are also relatively large. Energy companies only show a weak seasonal effect, with slightly higher emissions during winter due to the higher electricity production for lighting houses and offices.
0
2000
4000
6000
8000
10000
12000
14000
16000
18000
20000
Q1
Q2
Q3
Q4
Q1
Q2
Q3
Q4
Q1
Q2
Q3
Q4
Q1
Q2
Q3
Q4
Q1
Q2
Q3
Q4
Q1
Q2
Q3
Q4
Q1
Q2
Q3
Q4
Q1
Q2
Q3
Q4
Q1
Q2
Q3
Q4
2001 2002 2003 2004 2005 2006 2007 2008 2009
CO2 emissions, mln kg
Transport activities
Agriculture, mining, manufacturing and construction
Energy and water supply
Figure 35- CO2 emissions by transport activities, 'agriculture, mining, manufacturing and construction' and energy and water supply Large differences in emission intensity per sector. Emission intensity, defined as the number of emissions per unit value added, differs greatly from one economic sector to another. The emission intensity for energy and water supply is approximately 20 times higher than the emission intensity of the Dutch economy as a whole. The sector ‘services’ has the lowest emission intensity over time, whereas the emission intensity of the ‘transport’ sector is approximately 3.5 times higher than that of the Dutch economy as a whole. It holds that the emission intensities of all sectors have decreased over time. CO2 emissions have a stronger seasonally pattern than GDP. Apparently, the effect of differences in the weather (heating) is quite large for CO2 emissions.

32
0
0.2
0.4
0.6
0.8
1
1.2
1.4
1.6
1.8
Q1
Q2
Q3
Q4
Q1
Q2
Q3
Q4
Q1
Q2
Q3
Q4
Q1
Q2
Q3
Q4
Q1
Q2
Q3
Q4
Q1
Q2
Q3
Q4
Q1
Q2
Q3
Q4
Q1
Q2
Q3
Q4
Q1
Q2
Q3
Q4
2001 2002 2003 2004 2005 2006 2007 2008 2009
emission-intensity (mln kg/mln euro)
0
2
4
6
8
10
12
emission-intensity (mln kg/mln euro)
Transport activitiesAgriculture, mining, manufacturing and constructionServices, corrected for the weatherDutch economy (excluding households), corrected for the weatherEnergy and water supply (right axis)
Figure 36-CO2 emission intensity for different sectors in the economy Quarterly emissions also allow studying decoupling of CO2 emissions with economic growth in more detail. In the period 2001-2009 GDP has grown faster than CO2 emissions, leading to a decrease in emission intensity. As a result, the long term emission intensity has decreased over time.
0
20
40
60
80
100
120
140
Q1 Q2 Q3 Q4 Q1 Q2 Q3 Q4 Q1 Q2 Q3 Q4 Q1 Q2 Q3 Q4 Q1 Q2 Q3 Q4 Q1 Q2 Q3 Q4 Q1 Q2 Q3 Q4 Q1 Q2 Q3 Q4 Q1 Q2 Q3 Q4
2001 2002 2003 2004 2005 2006 2007 2008 2009
period
index (2001/Qaverage=100)
Emission-intensity Economy, GDP CO2 emissions to air
Figure 37- Development of emission intensity, excluding households, corrected for the weather, index (2001/Q average=100)

33
The effects of the financial crisis on CO2 emissions Many economists considered the financial crisis that started in 2008 to be the worst since the Great Depression of the 1930s. It contributed to the failure of key businesses, an estimated loss of trillions of U.S. dollars in consumer wealth, substantial financial commitments incurred by governments, and a significant decline in economic activity. The Dutch economy was hit hard. In 2009 economic growth was nearly -4 percent. Quarterly CO2 emission accounts make an in-depth analysis possible of the development of CO2 emissions in this period and the economic activities causing the observed changes. For the first 3 quarters of 2008, the quarterly national accounts still showed positive economic growth for the Netherlands. In the last quarter of 2008, the economy shrank by 0.8 percent, while it declined by 3.9 percent in 2009. The quarterly decline was -4.5, -5.3, -3.7 and -2.2 percent respectively. Table 8 shows economic growth for different sectors in the economy during 2008 and 2009. Comparing the economic growth data with the changes in CO2emissions reveals that the decrease in emissions started earlier (third quarter of 2008) than economic growth (Q4 of 2009). In addition, emissions of the total economy started to increase already in the second half of 2009, where economic growth was still negative. This result may suggest that quarterly CO2 emissions could serve as some kind of early warning. Below, we present a more in depth analysis of quarterly emissions by sector (table 8 and figure 9) that will help to support or dismiss this observation.
Agriculture, mining, manufacturing and construction Energy and water supply Services Transport Dutch economy
%2008 Q1 3.8 8.4 3.1 3.7 3.42008 Q2 2.4 10.3 3.1 3.3 3.12008 Q3 1.0 1.1 2.5 0.8 1.92008 Q4 -5.0 2.4 0.9 -2.9 -0.82009 Q1 -9.1 2.4 -2.7 -8.5 -4.52009 Q2 -9.8 -2.6 -2.8 -7.2 -5.32009 Q3 -5.1 1.1 -2.4 -7.8 -3.72009 Q4 -2.1 -0.1 -1.4 -4.1 -2.2
---------------------------------------------------------------------------------------------------------------------------------------------------------------------------------------------------
---------------------------------------------------------------------------------------------------------------------------------------------------------------------------------------------------
---------------------------------------------------------------------------------------------------------------------------------------------------------------------------------------------------
Table 38 Macro economic growth and per sector
-15.0
-10.0
-5.0
0.0
5.0
10.0
15.0
20.0
Households (corrected forthe weather)
Agriculture, mining,manufacturing and
construction
Energy and water supply Services Transport Dutch economy
percentage change in emissions Q-4
2008 Q1 2008 Q2 2008 Q3 2008 Q4 2009 Q1 2009 Q2 2009 Q3 2009 Q4 Figure 39- Change in CO2 emissions per sector

34
The emissions of households (adjusted for weather conditions) are not very much influenced by the financial crisis. Both the emissions for heating and transport remained fairly constant in this period. This is in line with household consumption which decreased only slightly in 2009. The production sectors in the Dutch economy show a very different picture, however. In the first quarter of 2008 emissions of ‘agriculture, mining, manufacturing and construction’ increased substantially. This was mainly caused by more emissions from agriculture (more natural gas combustion for cogeneration in horticulture) and oil refineries (more refinery gas combustion). Since the fourth quarter of 2008 the emissions of ‘Agriculture, mining, manufacturing and construction’ have declined every quarter (compared to the same quarter of the previous year). This corresponds with the extreme negative economic growth in this sector. Manufacturing (oil refineries, chemical industry, and basic metal industry) is most responsible for this decline in emissions. The economic shrinkage of this sector levels off in the course of 2009. In the last quarter of 2009, it shows a slight recovery. The reduction in emissions levels off as well. The CO2 emissions of the energy companies already started to decrease in the third quarter of 2008. There were several causes for this decline. The main reason was a lower input of coal for the production of electricity. As the input of natural gas and biomass increased, the decline in CO2 emissions is due to a change in the energy input mix. Also total electricity production by energy companies decreased while the electricity produced by other sectors (e.g. manufacturing, agriculture) increased. Finally, relatively more electricity from nuclear power was produced in the third quarter of 2008, lowering the CO2 emissions from the energy companies. In the second half of 2009, energy companies showed a remarkable increase in emissions. In the third quarter these emissions increased with 15 percent. Growing exports were the main reason for the increase in emissions in this quarter, as the domestic demand for electricity did not change that much during 2009. The Netherlands imports less electricity than before and has become a net-exporter of electricity. The reason behind this change is probably the dip in natural gas prices. This improved the competitive position of Dutch energy companies, that greatly rely on the input of natural gas for their production process, resulting in an increase of the export of electricity. This change has induced a higher emission level for energy supply companies. Emissions of services already declined in the third quarter of 2008. This was partly due to fewer emissions by waste incinerators. The increase in emissions in quarters 3 and 4 for services in 2009 is quite remarkable. This increase is mainly the result of more emissions of environmental services, more specifically waste incineration. Waste incinerators have incinerated more waste in these periods than in the previous periods. Maybe increased capacity has led to increased incineration activity. Transport activities still grew in the first 3 quarters of 2008, but showed negative economic growth in the last quarter of 2008 and in all four quarters of 2009. This decline in activity resulted in lower CO2 emissions by transport in these five quarters. Emissions by water transport were significantly lower, whereas emissions from air transport only dropped a few percent. Economic decline in the transport sector was sharper than the decrease in emissions. This can be explained by the fact that the transport of passengers and cargo by ships and planes was probably less energy efficient (lower load factor).
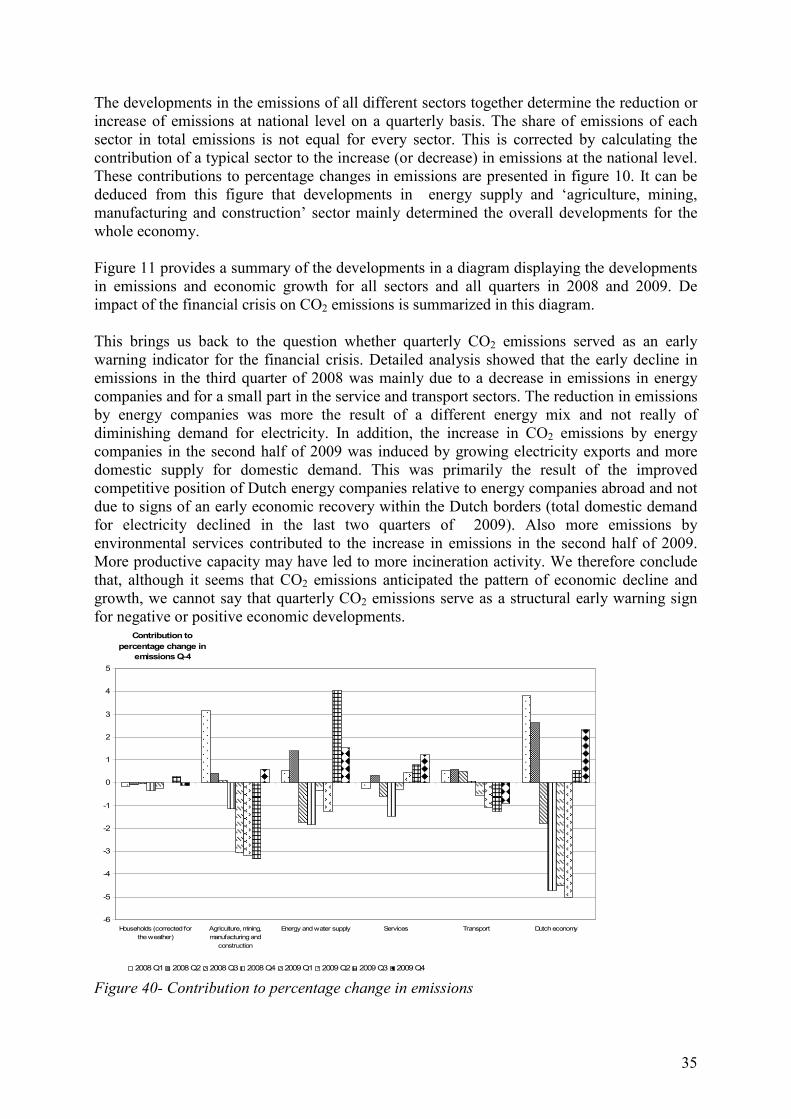
35
The developments in the emissions of all different sectors together determine the reduction or increase of emissions at national level on a quarterly basis. The share of emissions of each sector in total emissions is not equal for every sector. This is corrected by calculating the contribution of a typical sector to the increase (or decrease) in emissions at the national level. These contributions to percentage changes in emissions are presented in figure 10. It can be deduced from this figure that developments in energy supply and ‘agriculture, mining, manufacturing and construction’ sector mainly determined the overall developments for the whole economy. Figure 11 provides a summary of the developments in a diagram displaying the developments in emissions and economic growth for all sectors and all quarters in 2008 and 2009. De impact of the financial crisis on CO2 emissions is summarized in this diagram. This brings us back to the question whether quarterly CO2 emissions served as an early warning indicator for the financial crisis. Detailed analysis showed that the early decline in emissions in the third quarter of 2008 was mainly due to a decrease in emissions in energy companies and for a small part in the service and transport sectors. The reduction in emissions by energy companies was more the result of a different energy mix and not really of diminishing demand for electricity. In addition, the increase in CO2 emissions by energy companies in the second half of 2009 was induced by growing electricity exports and more domestic supply for domestic demand. This was primarily the result of the improved competitive position of Dutch energy companies relative to energy companies abroad and not due to signs of an early economic recovery within the Dutch borders (total domestic demand for electricity declined in the last two quarters of 2009). Also more emissions by environmental services contributed to the increase in emissions in the second half of 2009. More productive capacity may have led to more incineration activity. We therefore conclude that, although it seems that CO2 emissions anticipated the pattern of economic decline and growth, we cannot say that quarterly CO2 emissions serve as a structural early warning sign for negative or positive economic developments.
-6
-5
-4
-3
-2
-1
0
1
2
3
4
5
Households (corrected forthe weather)
Agriculture, mining,manufacturing and
construction
Energy and water supply Services Transport Dutch economy
Contribution to percentage change in
emissions Q-4
2008 Q1 2008 Q2 2008 Q3 2008 Q4 2009 Q1 2009 Q2 2009 Q3 2009 Q4 Figure 40- Contribution to percentage change in emissions
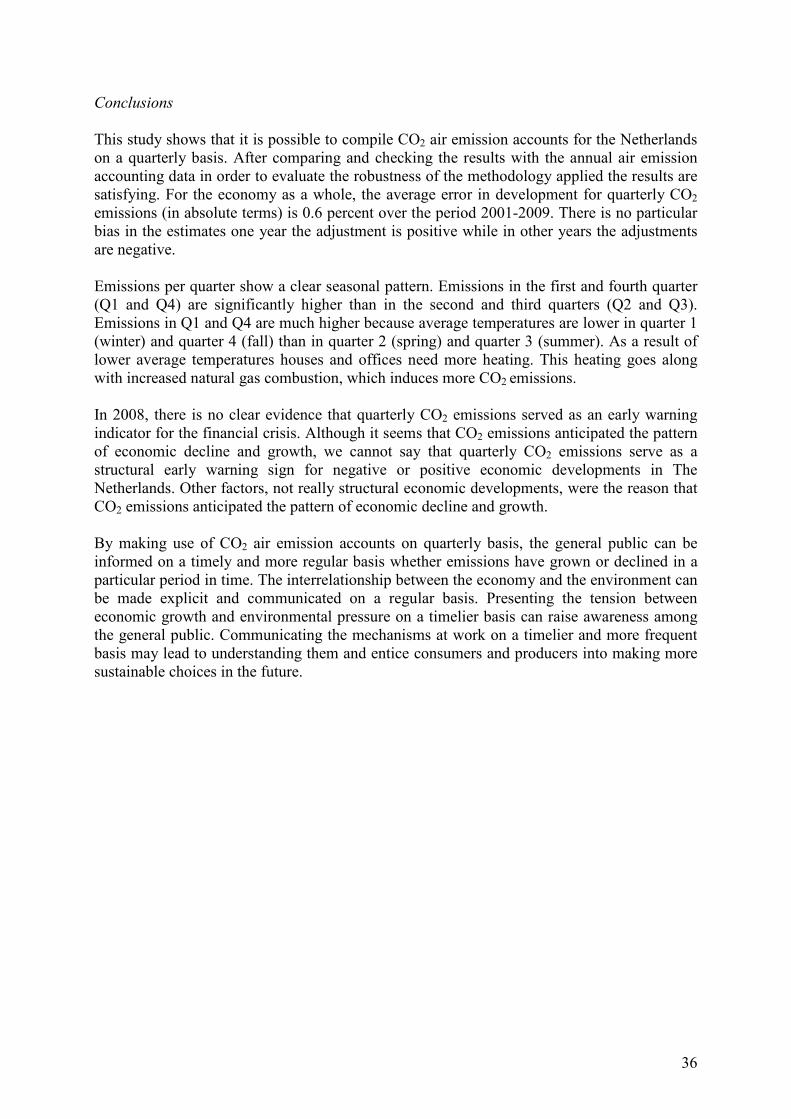
36
Conclusions This study shows that it is possible to compile CO2 air emission accounts for the Netherlands on a quarterly basis. After comparing and checking the results with the annual air emission accounting data in order to evaluate the robustness of the methodology applied the results are satisfying. For the economy as a whole, the average error in development for quarterly CO2emissions (in absolute terms) is 0.6 percent over the period 2001-2009. There is no particular bias in the estimates one year the adjustment is positive while in other years the adjustments are negative. Emissions per quarter show a clear seasonal pattern. Emissions in the first and fourth quarter (Q1 and Q4) are significantly higher than in the second and third quarters (Q2 and Q3). Emissions in Q1 and Q4 are much higher because average temperatures are lower in quarter 1 (winter) and quarter 4 (fall) than in quarter 2 (spring) and quarter 3 (summer). As a result of lower average temperatures houses and offices need more heating. This heating goes along with increased natural gas combustion, which induces more CO2 emissions. In 2008, there is no clear evidence that quarterly CO2 emissions served as an early warning indicator for the financial crisis. Although it seems that CO2 emissions anticipated the pattern of economic decline and growth, we cannot say that quarterly CO2 emissions serve as a structural early warning sign for negative or positive economic developments in The Netherlands. Other factors, not really structural economic developments, were the reason that CO2 emissions anticipated the pattern of economic decline and growth. By making use of CO2 air emission accounts on quarterly basis, the general public can be informed on a timely and more regular basis whether emissions have grown or declined in a particular period in time. The interrelationship between the economy and the environment can be made explicit and communicated on a regular basis. Presenting the tension between economic growth and environmental pressure on a timelier basis can raise awareness among the general public. Communicating the mechanisms at work on a timelier and more frequent basis may lead to understanding them and entice consumers and producers into making more sustainable choices in the future.

37
Figure 41-overview of the system
Tran
spor
t
-10.
0
-8.0
-6.0
-4.0
-2.00.0
2.0
4.0
6.0
Q1
Q2
Q3
Q4
Q1
Q2
Q3
Q4
2008
2008
2008
2008
2009
2009
2009
2009
%
Econ
omic
grow
th
Chan
geem
issi
ons
toai
r
Ener
gyan
dw
ater
supp
ly
-10.
0
-5.00.0
5.0
10.0
15.0
20.0
Q1
Q2
Q3
Q4
Q1
Q2
Q3
Q4
2008
2008
2008
2008
2009
2009
2009
2009
%
Econ
omic
grow
th
Chan
geem
issi
ons
toai
r
Agr
icul
ture
,min
ing,
man
ufac
turi
ngan
dco
nstr
uctio
n
-15.
0
-10.
0
-5.00.0
5.0
10.0
15.0
Q1
Q2
Q3
Q4
Q1
Q2
Q3
Q4
2008
2008
2008
2008
2009
2009
2009
2009
%
Econ
omic
grow
th
Chan
geem
issi
ons
toai
r
Serv
ices
-15.
0
-10.
0
-5.00.0
5.0
10.0
15.0
Q1
Q2
Q3
Q4
Q1
Q2
Q3
Q4
2008
2008
2008
2008
2009
2009
2009
2009
%
Econ
omic
grow
th
Chan
geem
issi
ons
toai
r
MA
CR
Ofig
ures
fort
heD
utch
Econ
omy(
hous
ehol
dsin
cl.)
-6.0
-4.0
-2.00.0
2.0
4.0
6.0
Q1
Q2
Q3
Q4
Q1
Q2
Q3
Q4
2008
2008
2008
2008
2009
2009
2009
2009
%
Econ
omic
grow
th
Cha
nge
emis
sion
sto
air

38
5. Dissemination strategy
As described above, the quarterly CO2 emission accounts are capable of providing useful information on a relatively short time notice. The next question is how and when this information can be made available to the general public. This section discusses at what moment in time the first results of a quarter can best be published, the level of detail that can be published, and how to deal with updates of the data. 5.1 Moment of publication The aim is to publish the first results as soon as possible to provide the most actual data to the public. On the other hand, constraints with regard to the availability of data sources, the quality of the data sources, the time needed to process the data and do some quality checks determine what is feasible in this regard. The table below summarizes the moments when the principal data sources become available.
Data sources Data available internally First moment of publication Updates
Monthly energy statistics t+40 t+60 NoQuarterly National accounts t+40 t+45 t+90Quarterly renewable energy t+60Heating degrees days t+30 NoAvailable seat kilometres (monthly) t+15 No
Table 42- Data availability of sources There are three reasons why it is advisable to publish quarterly CO2 emissions at the same moment in time as the results of the quarterly National accounts. First, the value added of data from the quarterly CO2 emission accounts is the direct comparability with National account data. Secondly, publishing together with the national accounts makes clear to the public that these are data associated with the National accounts are thus not equal to, for example, Kyoto based data. This is important to avoid confusion for the users of the data. Finally, the first data (flash) from the quarterly National accounts always get a lot of public attention. A joint publication will also put the first CO2 emission data based upon the concepts of the environment accounts in the spotlights. When this line of reasoning is followed, there are two options for publication: either at the flash estimate (after one and a half month; t+45) or at the regular estimate (after three months; t+90). The data source availability indicates that in principle it is possible to publish a first estimate for the quarterly CO2 emissions together with the flash estimate. However there are a few problems. First of all, only preliminary data from the energy statistics is available at t+40 for the last month of a quarter. This means that some assumptions have to be made for the data of this month. Estimations for biomass combustion and waste incineration needs to be done using alternative estimating techniques if one decides to publish at t+45. These alternative estimating techniques are less reliable. Estimations for emissions due to biomass combustion in energy companies can be done using electricity supply as an indicator while emissions due to waste incineration can be estimated making use of the indicator ‘production growth’.
39
Using the four quarters a first figure for the total annual CO2 emission by the economy can be calculated and published by the mid of February. 5.2 Level of publishing The focus of the methodology of the compilation of the quarterly emission accounts is to correctly estimate the relative changes in emission level with respect to the previous year. We therefore advocate not publishing the absolute emissions levels, but only the actual changes with regard to the previous year. This is more or less analogues to the publication of the quarterly national accounts which also focuses on the economic growth (change in volume terms) and not on the absolute level of GDP. For analytical purposes, however, is may also be useful to use (and present) the absolute emission levels, as was done in the chapter on results. This can be done in special publications, such as the annual publications of the environmental national accounts. Besides quarterly emission data for the whole economy, also more detailed data on industry level can be published. As discussed, the data quality requires that data can only be published on a very aggregated level. Based on the results of this study it is advised only to publish data for the following sectors:
• Agriculture, mining, manufacturing and construction (NACE 1-37 and NACE 45) • Energy and water companies (NACE 40-41) • Transport sector (NACE 60-62) • Other services (NACE 50-55; NACE 63-95) • Waste disposal sites • Households
However, the underlying data may be used to interpret some of the observed changes in the macro data. For example, a change in the emissions from the transport sector may be explained by pointing at one of the underlying sectors, for example the observed changes in the air transport sector. 5.3 Dealing with updates As new data sources become available, the quarterly emission data can improved and updated. Monthly and quarterly energy statistics are not revised at Statistcis Netherlands (CHECK). Only when the annual energy balances are compiled the energy data is adjusted and no longer fully consistent with the monthly and quarterly data. This only happens half a year after the end of the year under review. The Quarterly National accounts are updated 90 days (t+90) after the quarter under review. This means that also the quarterly emission data could be revised based on this new information. The consequences with regard to the actual changes are limited. As discussed in the methodology chapter of this study, energy statistics provide the main data source for the compilation of the quarterly emission accounts and is the input form the QNA limited to a few sectors and emission sources (water transport, process emissions),. Therefore it is probably not advisable to compile and publish new data at t+90.
40
The first major data adjustment is required when the first annual emission account data becomes available (usually 8 months after the end of the year under review). With this new data the quarters of the previous year can be rebased, which has consequences for the quarters of this year, but also on the already published first two quarters of the new year. This is due to the fact that the data from the Dutch emission inventory (the primary source of data for the annual emission accounts) is constantly revised based upon improvements in the methodology to determine the air emissions. This means that the entire time series has to be rebased. Not only the air emission data but also the National accounts are revised, i.e. the last three years. In this process also the quarterly national accounts are rebased and updated. This new data provides a new input to improve the quarterly emission accounts. All this new information can first be used and published in august with the publication of the data for the second quarter. With regard to an updating strategy for the quarterly emission data, there are two options:
1. One can choose only to publish quarterly CO2 emissions once (at t+45) and not to provide updates. The reasoning behind this strategy is that the new CO2 data are mostly interesting when it first becomes available. The advantage of this strategy is that less time has to be spent on calculating the updates. Also, the adjustments that occur between the quarterly data and the updates are less conspicuous, only the difference between the annual figure and the ‘sum of four quarters’ has to be explained in detail. This means that it has to be clearly stated to the public that the calculated quarterly air emissions can no longer be used in the future. As a consequence, the quarterly data can not be published in a statistical database, for example statline.
2. The other option is to provide and publish updates of the rebased data as was described above. The advantage of this option is to have the availability to the public to analyse an up to date time series for quarterly emissions. Disadvantages are the extra time and capacity it takes to rebase, update, check and publish these results. Also the readjustments in the updates have to be explained in the form of quality reports.

41
6. Conclusions This study shows that it is possible to compile CO2 air emission accounts for the Netherlands on a quarterly basis. After comparing and checking the results with the annual air emission accounting data in order to evaluate the robustness of the methodology applied the results are satisfying. For the economy as a whole, the average error in development for quarterly CO2emissions (in absolute terms) is 0.6 percent over the period 2001-2009. There is no particular bias in the estimates one year the adjustment is positive while in other years the adjustments are negative. Emissions per quarter show a clear seasonal pattern. Emissions in the first and fourth quarter (Q1 and Q4) are significantly higher than in the second and third quarters (Q2 and Q3). Emissions in Q1 and Q4 are much higher because average temperatures are lower in quarter 1 (winter) and quarter 4 (fall) than in quarter 2 (spring) and quarter 3 (summer). As a result of lower average temperatures houses and offices need more heating. This heating goes along with increased natural gas combustion, which induces more CO2 emissions. In 2008, there is no clear evidence that quarterly CO2 emissions served as an early warning indicator for the financial crisis. Although it seems that CO2 emissions anticipated the pattern of economic decline and growth, we cannot say that quarterly CO2 emissions serve as a structural early warning sign for negative or positive economic developments in The Netherlands. Other factors, not really structural economic developments, were the reason that CO2 emissions anticipated the pattern of economic decline and growth. By making use of CO2 air emission accounts on quarterly basis, the general public can be informed on a timely and more regular basis whether emissions have grown or declined in a particular period in time. The interrelationship between the economy and the environment can be made explicit and communicated on a regular basis. Presenting the tension between economic growth and environmental pressure on a timelier basis can raise awareness among the general public. Communicating the mechanisms at work on a timelier and more frequent basis may lead to understanding them and entice consumers and producers into making more sustainable choices in the future.

42
Literature IPCC (2007). Fourth Assessment Report, Climate Change 2007. Cambridge, Cambridge University
Press.
United Nations, European Commission, International Monetary Fund, Organisation for Economic Co operation and Development, World Bank (2003). Handbook of National Accounting: Integrated Environmental and Economic Accounting 2003, Final draft circulated for information prior to official editing, http://unstats.un.org/unsd/envaccounting/seea.asp