Embed Size (px)
Citation preview
CO2 ABATEMENT IN AN INTEGRATED METHANOL AND POWER SYSTEM
Report Number PH3/13 December 1999
This document has been prepared for the Executive Committee of the Programme. It is not a publication of the Operating Agent, International Energy Agency or its Secretariat.
Title: CO2 Abatement in an Integrated Methanol and Power System Reference number: PH3/13 Date issued: December 1999 Other remarks:
Background to the study Members of the IEA Greenhouse Gas R&D (IEAGHG) Programme are interested in the potential of integrated energy supply systems for CO2 abatement. This is a very broad subject, covering many different technical options including the production and use of alternative energy carriers, especially ‘carbon-free’ or ‘decarbonised’ energy carriers. IEA GHG is particularly interested to understand the extent to which capture of CO2 could contribute to such energy systems, not only in centralised power generation, but also in reducing greenhouse gas emissions from dispersed sources such as transport.1 One way of making deep reductions in greenhouse gas emissions from transport would be to supply vehicles with non-carbon fuels, such as hydrogen. In previous studies, IEA GHG has examined production of hydrogen from fossil fuels with sequestration of CO2. Another means of obtaining hydrogen would be through use of renewable energy (e.g. solar power). For large-scale production, this would be likely to be done in remote places (because of the large areas of land required). So various schemes have been proposed for shipping hydrogen to market from remote renewable sources. The shipping, distribution and storage of hydrogen is perceived as being expensive; as an alternative, it has been suggested that hydrogen could be converted to a more convenient energy carrier such as ammonia, cyclohexane, or methanol. In particular, to produce methanol requires carbon. Many have suggested that this carbon could be provided by recycling CO2 captured from power plants. The work reported here considers a ‘future energy system’ based on use of methanol as an energy carrier. It assesses a particular methanol-based energy system, one that has been widely canvassed, in which the demand for transportation2 (of goods and people) can be met by (partial) decarbonisation of fossil fuels. The relative merits of the various options for long-distance shipment of decarbonised energy have not previously been assessed by IEA GHG. Future work by IEAGHG will examine other ‘energy systems’ that could also reduce emissions of greenhouse gases to atmosphere.
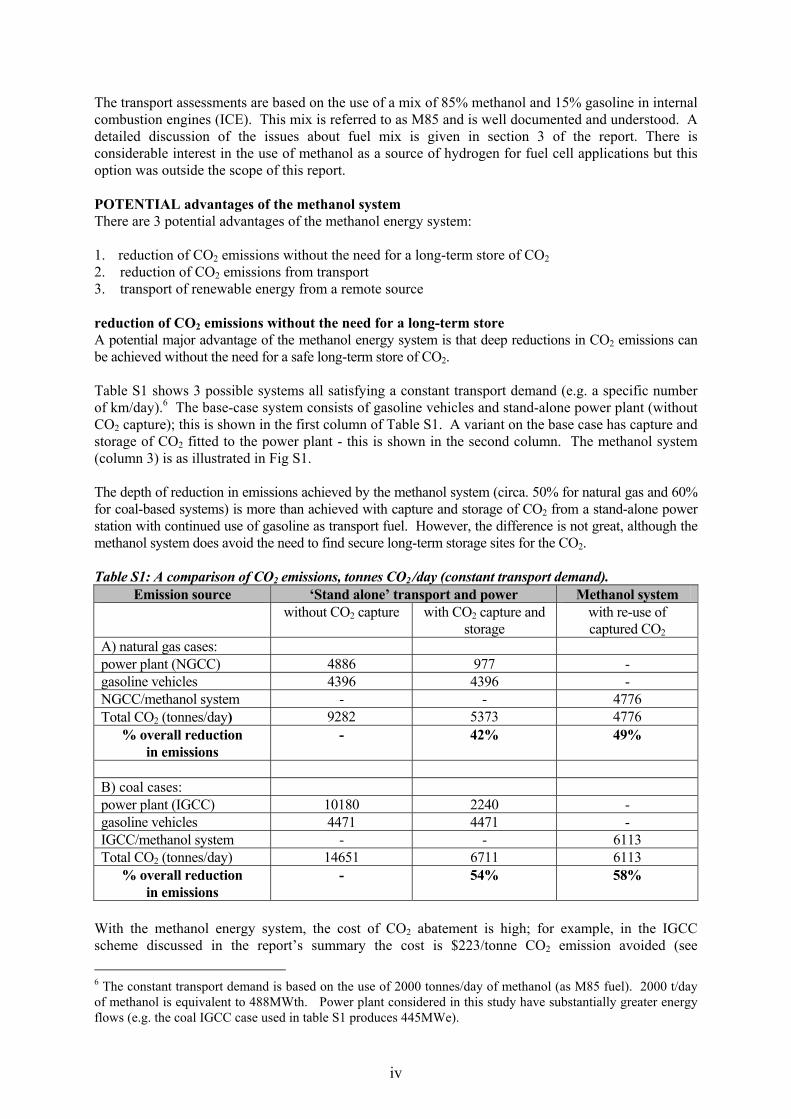
Approach adopted The energy system studied is based on the co-production of electricity and methanol, with use of a remote large-scale source of renewable energy to produce hydrogen.3 Methanol is produced by reacting the hydrogen with CO2 captured at a fossil fuel fired power station. The net effect is that CO2 released in electricity production is re-used to transport ‘hydrogen-based’ energy, in order to supply vehicles with a liquid fuel. Figure S1 illustrates the concept.
1 The potential application of such schemes has previously been seen to be restricted to electricity generation on a large scale. 2 Transport is the largest dispersed user of energy, one for which the demand is projected to rise rapidly. 3 Co-production processes for methanol and electricity based solely on use of fossil fuels are not dealt with in this report; they are a potential area for future studies by IEA GHG.
i
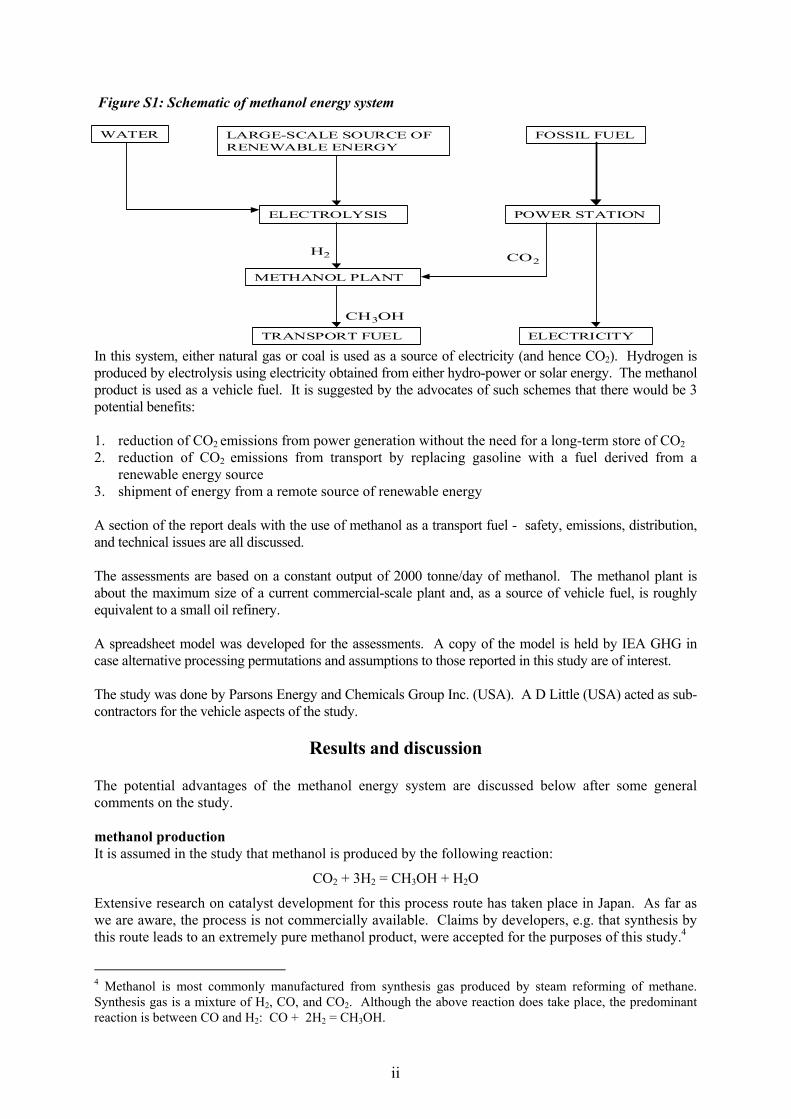
Figure S1: Schematic of methanol energy system
LARGE-SCALE SOURCE OFRENEWABLE ENERGY
FOSSIL FUEL
ELECTROLYSIS
WATER
POWER STATION
METHANOL PLANT
TRANSPORT FUEL ELECTRICITY
H2 CO2
CH3OH
In this system, either natural gas or coal is used as a source of electricity (and hence CO2). Hydrogen is produced by electrolysis using electricity obtained from either hydro-power or solar energy. The methanol product is used as a vehicle fuel. It is suggested by the advocates of such schemes that there would be 3 potential benefits: 1. reduction of CO2 emissions from power generation without the need for a long-term store of CO2 2. reduction of CO2 emissions from transport by replacing gasoline with a fuel derived from a
renewable energy source 3. shipment of energy from a remote source of renewable energy A section of the report deals with the use of methanol as a transport fuel - safety, emissions, distribution, and technical issues are all discussed. The assessments are based on a constant output of 2000 tonne/day of methanol. The methanol plant is about the maximum size of a current commercial-scale plant and, as a source of vehicle fuel, is roughly equivalent to a small oil refinery. A spreadsheet model was developed for the assessments. A copy of the model is held by IEA GHG in case alternative processing permutations and assumptions to those reported in this study are of interest. The study was done by Parsons Energy and Chemicals Group Inc. (USA). A D Little (USA) acted as sub-contractors for the vehicle aspects of the study.
Results and discussion The potential advantages of the methanol energy system are discussed below after some general comments on the study. methanol production It is assumed in the study that methanol is produced by the following reaction:
CO2 + 3H2 = CH3OH + H2O
Extensive research on catalyst development for this process route has taken place in Japan. As far as we are aware, the process is not commercially available. Claims by developers, e.g. that synthesis by this route leads to an extremely pure methanol product, were accepted for the purposes of this study.4
4 Methanol is most commonly manufactured from synthesis gas produced by steam reforming of methane. Synthesis gas is a mixture of H2, CO, and CO2. Although the above reaction does take place, the predominant reaction is between CO and H2: CO + 2H2 = CH3OH.
ii
remote sources of renewable energy The source of hydrogen is a water electrolysis plant powered by electricity from a remote source of renewable energy. Solar thermal, solar photovoltaic, and hydro-electric sources are considered possibilities. It is assumed that saline water would be used for schemes involving solar thermal or solar photovoltaic sources. Fresh (non-saline) water is assumed to be available for electrolysis using hydro-electric power. An evaluation of large-scale renewable energy options was outside the scope of work for this study. Instead in-house information from the contractor is used together with information from the report: “Renewable Energy, Status and Prospects” which was published in 1998 by ABB Environmental Affairs. location In practice the methanol energy system would involve a remote source of renewable energy being used to supply transport fuel to an area of high demand. Three potential geographic locations are considered:
(a) Asia: one example of this scenario would be transport of Australian coal to Japan to produce electricity and CO2, coupled with Chinese hydroelectric power being used to produce hydrogen. Methanol would be made at the site of hydrogen production and used in Japan. Both CO2 and methanol would be transported by ship.5
(b) Europe and North Africa: an example of this scenario would be the use of solar power in North Africa to make H2; natural gas would be used to produce electricity and CO2. The methanol would be used in Europe. Various combinations of moving fluids by pipe and transmission of electricity are possible. Transport by ship is not likely to be required.
(c) North America: this scenario might involve solar energy being produced in the south-west USA and coal being used to generate electricity in the north-east USA. All the processes are assumed to take place in the same country, so avoiding a need for shipping.
Each process and each stage of transporting feedstock or products is described by an algorithm (i.e. a ‘building-block’ of the model). These algorithms are stored in the spreadsheet model, which can be used to assess the effect of changing the location of the processing plant, the distance of transportation, and the storage of products. The spreadsheet model is described on page 12 of the main report; table 1.1 illustrates the transport options used and their financial and energy costs. For simplicity this overview only presents results for cases in which all of the processing units are located in the same place. If the plants were located in different places (as in the scenarios above), additional costs would be incurred and the net reduction in CO2 emissions would be less than shown here. Examples of the effect of assuming finite distances between plant locations are given in table 2.2 of the main report. reference basis The methanol energy system is compared to a reference case of discrete i.e. ‘stand alone’ processes in which: (i) transport demand is met by gasoline and (ii) electricity is obtained from a fossil fuel power plant. The results presented here are for systems all of which produce 2000 t/day of methanol (or gasoline equivalent). The other major product is electricity. The stand-alone processes for electricity production combined with CO2 capture and storage are based on previous work for IEA GHG by Parsons and others. transport
5 A similar scheme is discussed by H Sano in Energy Conversion and Management, vol 36. No 6-9, pp895-899, 1995, published by Elsevier Science.
iii
The transport assessments are based on the use of a mix of 85% methanol and 15% gasoline in internal combustion engines (ICE). This mix is referred to as M85 and is well documented and understood. A detailed discussion of the issues about fuel mix is given in section 3 of the report. There is considerable interest in the use of methanol as a source of hydrogen for fuel cell applications but this option was outside the scope of this report. POTENTIAL advantages of the methanol system There are 3 potential advantages of the methanol energy system: 1. reduction of CO2 emissions without the need for a long-term store of CO2 2. reduction of CO2 emissions from transport 3. transport of renewable energy from a remote source reduction of CO2 emissions without the need for a long-term store A potential major advantage of the methanol energy system is that deep reductions in CO2 emissions can be achieved without the need for a safe long-term store of CO2. Table S1 shows 3 possible systems all satisfying a constant transport demand (e.g. a specific number of km/day).6 The base-case system consists of gasoline vehicles and stand-alone power plant (without CO2 capture); this is shown in the first column of Table S1. A variant on the base case has capture and storage of CO2 fitted to the power plant - this is shown in the second column. The methanol system (column 3) is as illustrated in Fig S1. The depth of reduction in emissions achieved by the methanol system (circa. 50% for natural gas and 60% for coal-based systems) is more than achieved with capture and storage of CO2 from a stand-alone power station with continued use of gasoline as transport fuel. However, the difference is not great, although the methanol system does avoid the need to find secure long-term storage sites for the CO2. Table S1: A comparison of CO2 emissions, tonnes CO2 /day (constant transport demand).
Emission source ‘Stand alone’ transport and power Methanol system without CO2 capture with CO2 capture and
storage with re-use of captured CO2
A) natural gas cases: power plant (NGCC) 4886 977 - gasoline vehicles 4396 4396 - NGCC/methanol system - - 4776 Total CO2 (tonnes/day) 9282 5373 4776
% overall reduction in emissions
- 42% 49%
B) coal cases: power plant (IGCC) 10180 2240 - gasoline vehicles 4471 4471 - IGCC/methanol system - - 6113 Total CO2 (tonnes/day) 14651 6711 6113
% overall reduction in emissions
- 54% 58%
With the methanol energy system, the cost of CO2 abatement is high; for example, in the IGCC scheme discussed in the report’s summary the cost is $223/tonne CO2 emission avoided (see 6 The constant transport demand is based on the use of 2000 tonnes/day of methanol (as M85 fuel). 2000 t/day of methanol is equivalent to 488MWth. Power plant considered in this study have substantially greater energy flows (e.g. the coal IGCC case used in table S1 produces 445MWe).
iv
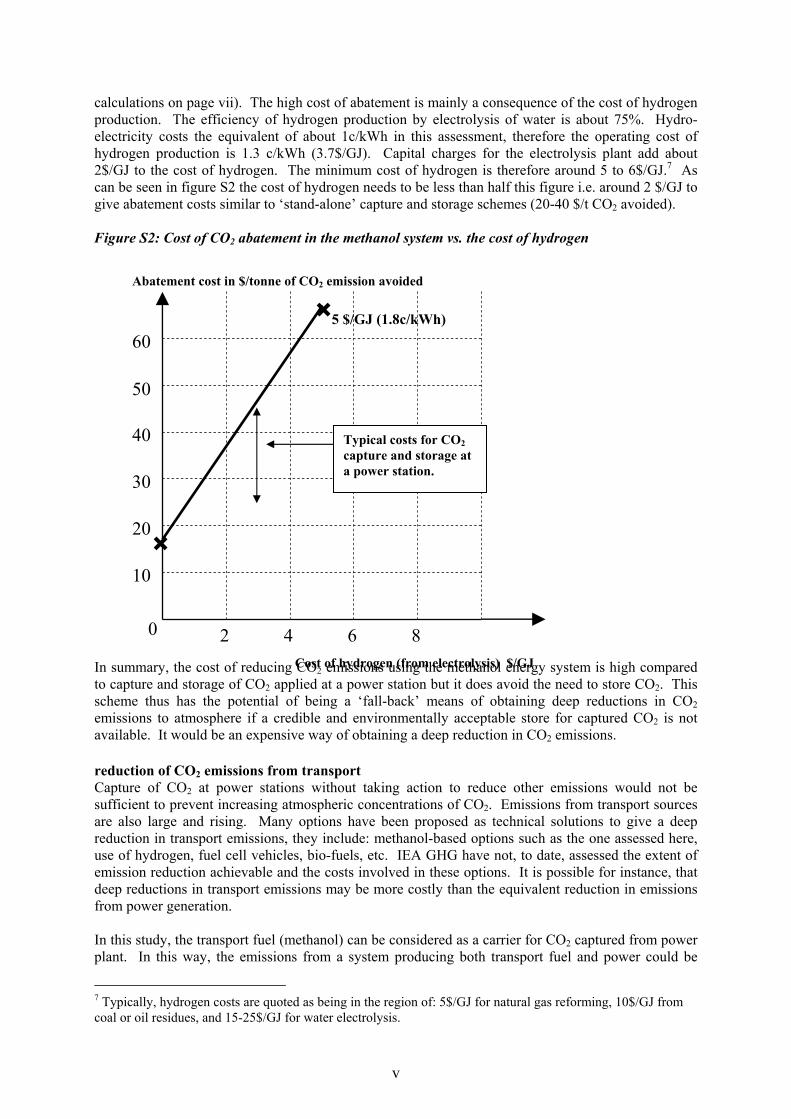
calculations on page vii). The high cost of abatement is mainly a consequence of the cost of hydrogen production. The efficiency of hydrogen production by electrolysis of water is about 75%. Hydro-electricity costs the equivalent of about 1c/kWh in this assessment, therefore the operating cost of hydrogen production is 1.3 c/kWh (3.7$/GJ). Capital charges for the electrolysis plant add about 2$/GJ to the cost of hydrogen. The minimum cost of hydrogen is therefore around 5 to 6$/GJ.7 As can be seen in figure S2 the cost of hydrogen needs to be less than half this figure i.e. around 2 $/GJ to give abatement costs similar to ‘stand-alone’ capture and storage schemes (20-40 $/t CO2 avoided). Figure S2: Cost of CO2 abatement in the methanol system vs. the cost of hydrogen
Typical costs for CO2 capture and storage at a power station.
Abatement cost in $/tonne of CO2 emission avoided
✖ 5 $/GJ (1.8c/kWh)
8 2 4 6
60
50
40
30
20 ✖
10
0
In summary, the cost of reducing CO2 emissions using the methanol energy system is high compared to capture and storage of CO2 applied at a power station but it does avoid the need to store CO2. This scheme thus has the potential of being a ‘fall-back’ means of obtaining deep reductions in CO2 emissions to atmosphere if a credible and environmentally acceptable store for captured CO2 is not available. It would be an expensive way of obtaining a deep reduction in CO2 emissions.
Cost of hydrogen (from electrolysis) $/GJ
reduction of CO2 emissions from transport Capture of CO2 at power stations without taking action to reduce other emissions would not be sufficient to prevent increasing atmospheric concentrations of CO2. Emissions from transport sources are also large and rising. Many options have been proposed as technical solutions to give a deep reduction in transport emissions, they include: methanol-based options such as the one assessed here, use of hydrogen, fuel cell vehicles, bio-fuels, etc. IEA GHG have not, to date, assessed the extent of emission reduction achievable and the costs involved in these options. It is possible for instance, that deep reductions in transport emissions may be more costly than the equivalent reduction in emissions from power generation. In this study, the transport fuel (methanol) can be considered as a carrier for CO2 captured from power plant. In this way, the emissions from a system producing both transport fuel and power could be
7 Typically, hydrogen costs are quoted as being in the region of: 5$/GJ for natural gas reforming, 10$/GJ from coal or oil residues, and 15-25$/GJ for water electrolysis.
v
reduced. This might be advantageous as a means of achieving reduction in emissions from transport although (as can be seen in Table S1), the system emission reduction is no more than 16% greater than in the stand-alone case, where only emissions from power plant are tackled. IEA GHG has not previously studied options for reducing emissions from transport, so we do not have benchmarks for comparing the results of this study with other transport abatement options. An overview of the prospects for use of methanol as a clean transport fuel has been included in the report (see section 3) to help put these options in context. Methanol is compared with alternative fuels that are commonly discussed including ethanol, compressed natural gas, reformulated gasoline, synthetic diesel, and electricity. A detailed assessment of these options is outside the scope of this study. The cost effectiveness of the methanol energy system as a way of reducing emissions of CO2 is illustrated in Table S2. An income from the sale of electricity is assumed; the income needed from sale of transport fuel is then calculated so as to cover the overall costs. However, the cost of emission abatement might be treated in one of a number of ways: 1. all of the abatement costs might be attributed to the user of transport fuel 2. the costs might be shared between electricity and transport users. 3. all of the costs might be attributed to electricity users. As the electricity system could achieve substantial emissions reduction through use of capture and storage of CO2 in stand alone plant, the third option would seem inequitable. So only the first 2 options are compared in Table S2 with a base case system without emission abatement Table S2: Costs for supplying methanol to serve a demand for transport fuel. System Attribution of
abatement costs Levelised
cost8 (millions US$/yr)
Income from sale of power
(millions US$/yr)
Income needed from transport
fuel (millions US$/yr)
Base case: gasoline vehicles and IGCC power plant without CO2 capture
Not applicable 200 176 (≡5c/kWh)
24 (≡36$/tMeOH) 9
Methanol vehicles & IGCC power plant with CO2 capture
All abatement cost assigned to methanol production
841 184 (≡5c/kWh)
657 (≡995$/tMeOH)
Methanol vehicles & IGCC power plant with CO2 capture.
Cost shared between electricity and transport fuel (i.e. abatement cost of 2c/kWh assigned to electricity).
841 256 (≡7c/kWh)
585 (≡886$/tMeOH)
From the information in tables S1 and S2 it can be calculated10 that if all the cost of CO2 abatement is assigned to the transport fuel the cost is $223/t CO2 avoided11; figures given in the main body of the report are on this basis.
8 Including all capital charges, operating and maintenance costs, fuel, etc. 9 For 2000 tpd methanol production; in this case the gasoline equivalent. The Rotterdam ‘spot-market’ cost of methanol is typically in the region of 150$/tonne. 10 (657 – 24) x106 $/yr / [333 days/yr x (14651- 6113) tCO2/hr] = $223/tCO2
vi
It can be argued that allocating all the cost of CO2 abatement to the transport fuel is unfair in that the ‘carbon-free’ electricity produced does not share any of the cost of abatement. However, even if the electricity is assumed to carry an abatement penalty equivalent to 2c/kWh and then the residual cost of abatement assigned to the transport fuel (as in the last row of table S2) the abatement cost is only reduced to $197/tCO2 avoided.12 In summary, much of the reduction in emissions from using the integrated methanol and power scheme arises from capture of CO2 at the power plant; the extra reduction from supplying transport fuel is not large. At about 200$/tCO2 emission avoided it is probable that there are cheaper options for making deep reductions in transport emissions. transport of renewable energy from a remote source Information is given in the report (see table 1.1) from which the cost and emission penalties associated with transporting the renewable energy in the form of methanol can be derived. This information was used in the case-evaluations presented in table 2.2 of the report. (A detailed evaluation of the merits of various options for transport of remote energy sources is outside the scope of this study.) Table S3 illustrates some of the relative capital costs of different energy transport systems; it should be noted that operating costs are not included in this comparison. Table S3: Cost implications of energy transport by pipeline
energy transported as:
Capital cost ($/km.tpd.)
Calorific value (GJ/t , LHV)
Specific cost ($/kW/1000km.)
hydrogen 14 700 120 10 600 natural gas 1 830 45 3 500 methanol 19 21 78 gasoline 17 49 30
electricity - - 550 As can be seen in Table S3 the capital cost of hydrogen transportation is very high; a 100km pipeline facility has a specific cost similar to that required for a coal-fired power plant (c. $1100/kW). There is generally a large difference in costs between transporting energy in liquid form and in gaseous form, which becomes even more pronounced if the energy requirements to compress the gas are included. From these limited figures it does seem that methanol could be used as a relatively cheap way of transporting energy from remote sources to market. This could be an alternative to converting remote gas supplies to Fischer-Tropsch (F-T) liquids. Future work could usefully examine and compare the options for transport of remote energy sources to market.
Expert Group and other comments The main comment was a concern that the advantages of methanol as a clean fuel at point of use are not shown by this study. For example, methanol is seen by many as offering advantages over LNG13 as a means of transporting energy. Methanol is also seen as a fuel for distributed, relatively small-scale uses and for transport, either in internal combustion engines or in fuel cells.
11 Other work on this concept appears to arrive at similar cost implications, e.g. Yagita et.al. ‘Scenario simulation of global CO2 recycling system by dynamic New Earth 21 model’, Proceedings of GHGT-4 pp873 - 878. 12 (585 – 24) x106 $/yr / [333 days/yr x (14651 – 6113) tCO2/hr = $197/tCO2 13 Liquefied Natural Gas
vii
viii
Major conclusions
The study was based on the supposition that the energy system would result in a deep reduction in the emissions of CO2 from transport. Much of the reduction in emissions arises from capture of CO2 at the power plant. Compared to a stand-alone power plant with CO2 capture, the extra reduction from integrating it into a system to supply methanol transport fuel is not large. As far as we are aware the synthesis of methanol from hydrogen and CO2 is not a commercially proven process. Considerable development would be required to establish a novel methanol process at the large-scale envisioned. A potential major advantage of the methanol system is that deep reductions in CO2 emissions from power generation can be achieved without the need for a safe long-term store of CO2. The cost of reducing CO2 emissions is high at about 200 $/tCO2 (730 $/tC) compared to capture and storage applied at a power station at about 30$/tCO2 (110 $/tC). The methanol energy scheme could be a ‘fall-back’ means to obtain deep reductions in CO2 emissions to atmosphere if a credible and environmentally acceptable store for captured CO2 is not available. Other ‘systems-based’ CO2 mitigation options that avoid CO2 storage may be more attractive but have not been investigated by IEA GHG. The overall extent of emission reduction obtained with the methanol system is only slightly greater than is achieved just by capturing CO2 at the power station and subsequently storing it (with continued use of gasoline in vehicles). IEAGHG have not evaluated other technical options for CO2 emission abatement in vehicles so have no basis with which to compare the cost of the methanol system as a means of reducing emissions from transport. It is clear that this option is expensive compared to emission reduction from large stationary plant, and is an expensive way of producing modest reductions in emissions from transport. A comparison of the investment requirements for energy transport shows that methanol could be a relatively cheap way of transporting energy from remote sources to market.
Recommendations The methanol energy system can be regarded as a ‘fall-back’ option if a store of CO2 is not available. No further work on this aspect is required at the moment as underground storage of CO2, in particular, is gaining increasing acceptance as a credible store. If difficulties are encountered with the acceptability and credibility of CO2 storage options the methanol system could be reassessed. Little work has been done by IEAGHG on technical options for the reduction of CO2 emissions from transport. The methanol system examined in this report is not a particularly effective, nor a cheap, way of reducing emissions. IEAGHG should use this data as an initial calibration for studies of other, hopefully more effective, transport options. Further work to assess energy transport options could be done by IEAGHG. This area should be revisited after the work in progress on Fischer-Tropsch fuels from remote sources of natural gas has been completed.
REDUCED-CARBON ENERGY STUDY (Reducing Carbon Dioxide Emission by Coupling Electric Power with Vehicle Fueling)
Final Report
Prepared for the IEA Greenhouse Gas R&D Programme
June 1999
Table of Contents Table of Contents ........................................................................................................................................................i Summary ....................................................................................................................................................................1 1.0 Introduction ...................................................................................................................................................3 1.1 Objectives ............................................................................................................................................3 1.2 Study Approach ...................................................................................................................................4 1.2.1 Schemes/Components ................................................................................................................4
1.2.2 Scenarios....................................................................................................................................6 1.2.3 Cases ........................................................................................................................................10 1.2.4 Options.....................................................................................................................................11 1.2.5 Analysis Model ........................................................................................................................12
1.3 IEA Standard Study Criteria..............................................................................................................19 2.0 Analysis .......................................................................................................................................................20
2.1 Results ...............................................................................................................................................27 2.2 Issues .................................................................................................................................................30
3.0 Independent Assessment of M85 Fuel for Transportation ..........................................................................31 3.1 Legislation and Demonstration Programs..........................................................................................31 3.2 Advantages of Methanol Fueled Vehicles .........................................................................................32 3.3 Technical Challenges of Methanol Fueled Vehicles .........................................................................34 3.4 Methanol Fueled Vehicles: Short and Long Term Outlook ..............................................................36
Appendix ..................................................................................................................................................................40
List of Tables and Figures Tables
1.1 Analysis Model Penalties, Cost, and Emissions Information .......................................................................14 1.2 Chemicals and Fuels Information .................................................................................................................18 2.1 Scenarios/Distances Analyzed ......................................................................................................................20 2.2 Scenario/Case Results ...................................................................................................................................29 3.1 Well-to-Wheel Energy Efficiency for Several Fuels ....................................................................................32 Figures
S.1 Summary Results ............................................................................................................................................2 1.1 Scenarios #1 All Components on Same Landmass ........................................................................................6 1.2 Scenario #2 Electric Power and Transportation Fuel Usage on Same Landmass with
Solar Renewable on Separate Landmass and Fuel Supply on Another Landmass .........................................8 1.3 Scenario #3 Electric Power and Transportation Fuel Usage on Same Landmass with
Hydro Renewable on Separate Landmass and Coal on Another Landmass ...................................................9 1.4 Scenario #0 Zero Distances Between All Components ...............................................................................10 1.5 Scenario #2 with Natural Gas - Electric Power and Transportation Fuel Usage on
Same Landmass with Solar Renewable and Natural Gas on Separate Landmass.........................................11 2.1 Distances Assumptions for Early Analysis ...................................................................................................20 3.1 1996 Ethanol and Methanol FFV Taurus......................................................................................................36
- i -
Summary
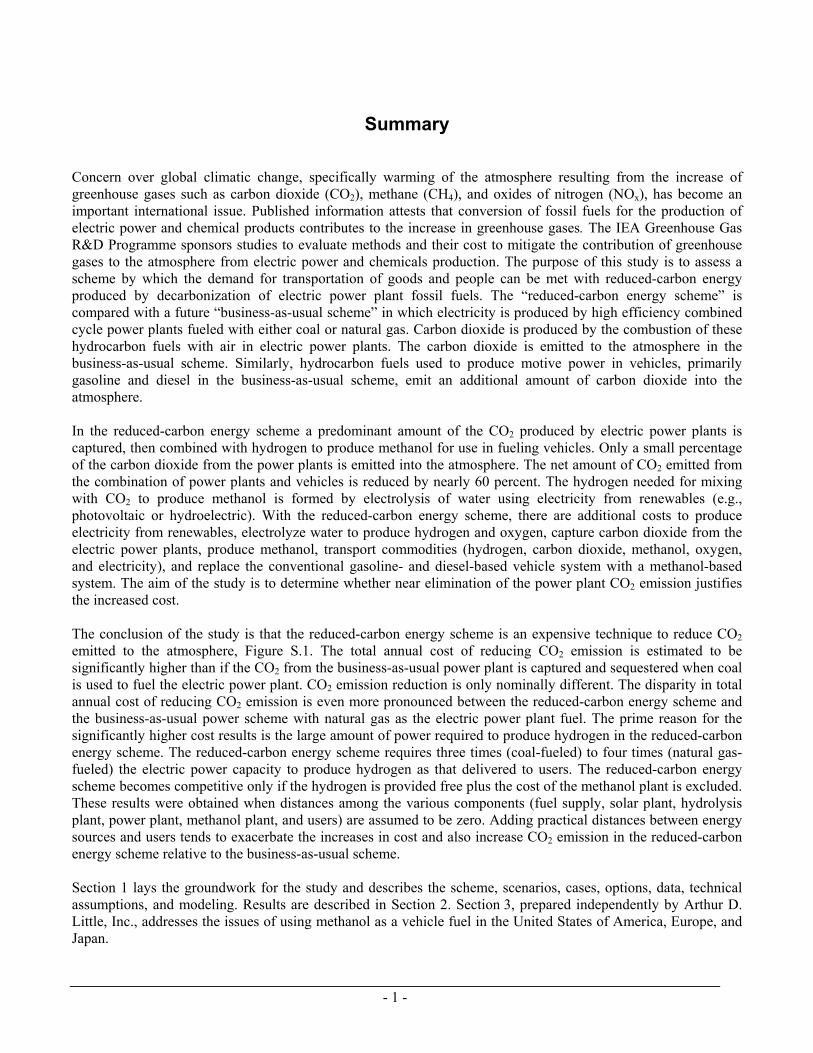
Concern over global climatic change, specifically warming of the atmosphere resulting from the increase of greenhouse gases such as carbon dioxide (CO2), methane (CH4), and oxides of nitrogen (NOx), has become an important international issue. Published information attests that conversion of fossil fuels for the production of electric power and chemical products contributes to the increase in greenhouse gases. The IEA Greenhouse Gas R&D Programme sponsors studies to evaluate methods and their cost to mitigate the contribution of greenhouse gases to the atmosphere from electric power and chemicals production. The purpose of this study is to assess a scheme by which the demand for transportation of goods and people can be met with reduced-carbon energy produced by decarbonization of electric power plant fossil fuels. The “reduced-carbon energy scheme” is compared with a future “business-as-usual scheme” in which electricity is produced by high efficiency combined cycle power plants fueled with either coal or natural gas. Carbon dioxide is produced by the combustion of these hydrocarbon fuels with air in electric power plants. The carbon dioxide is emitted to the atmosphere in the business-as-usual scheme. Similarly, hydrocarbon fuels used to produce motive power in vehicles, primarily gasoline and diesel in the business-as-usual scheme, emit an additional amount of carbon dioxide into the atmosphere. In the reduced-carbon energy scheme a predominant amount of the CO2 produced by electric power plants is captured, then combined with hydrogen to produce methanol for use in fueling vehicles. Only a small percentage of the carbon dioxide from the power plants is emitted into the atmosphere. The net amount of CO2 emitted from the combination of power plants and vehicles is reduced by nearly 60 percent. The hydrogen needed for mixing with CO2 to produce methanol is formed by electrolysis of water using electricity from renewables (e.g., photovoltaic or hydroelectric). With the reduced-carbon energy scheme, there are additional costs to produce electricity from renewables, electrolyze water to produce hydrogen and oxygen, capture carbon dioxide from the electric power plants, produce methanol, transport commodities (hydrogen, carbon dioxide, methanol, oxygen, and electricity), and replace the conventional gasoline- and diesel-based vehicle system with a methanol-based system. The aim of the study is to determine whether near elimination of the power plant CO2 emission justifies the increased cost. The conclusion of the study is that the reduced-carbon energy scheme is an expensive technique to reduce CO2 emitted to the atmosphere, Figure S.1. The total annual cost of reducing CO2 emission is estimated to be significantly higher than if the CO2 from the business-as-usual power plant is captured and sequestered when coal is used to fuel the electric power plant. CO2 emission reduction is only nominally different. The disparity in total annual cost of reducing CO2 emission is even more pronounced between the reduced-carbon energy scheme and the business-as-usual power scheme with natural gas as the electric power plant fuel. The prime reason for the significantly higher cost results is the large amount of power required to produce hydrogen in the reduced-carbon energy scheme. The reduced-carbon energy scheme requires three times (coal-fueled) to four times (natural gas-fueled) the electric power capacity to produce hydrogen as that delivered to users. The reduced-carbon energy scheme becomes competitive only if the hydrogen is provided free plus the cost of the methanol plant is excluded. These results were obtained when distances among the various components (fuel supply, solar plant, hydrolysis plant, power plant, methanol plant, and users) are assumed to be zero. Adding practical distances between energy sources and users tends to exacerbate the increases in cost and also increase CO2 emission in the reduced-carbon energy scheme relative to the business-as-usual scheme. Section 1 lays the groundwork for the study and describes the scheme, scenarios, cases, options, data, technical assumptions, and modeling. Results are described in Section 2. Section 3, prepared independently by Arthur D. Little, Inc., addresses the issues of using methanol as a vehicle fuel in the United States of America, Europe, and Japan.
- 1 -
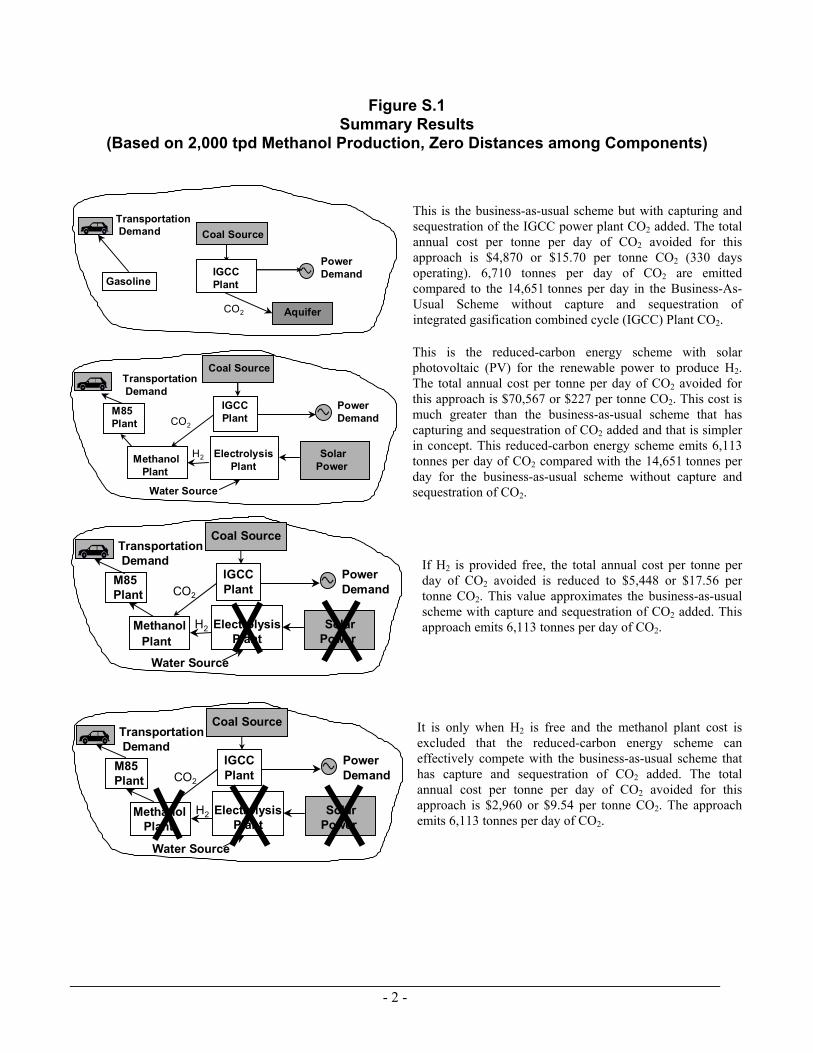
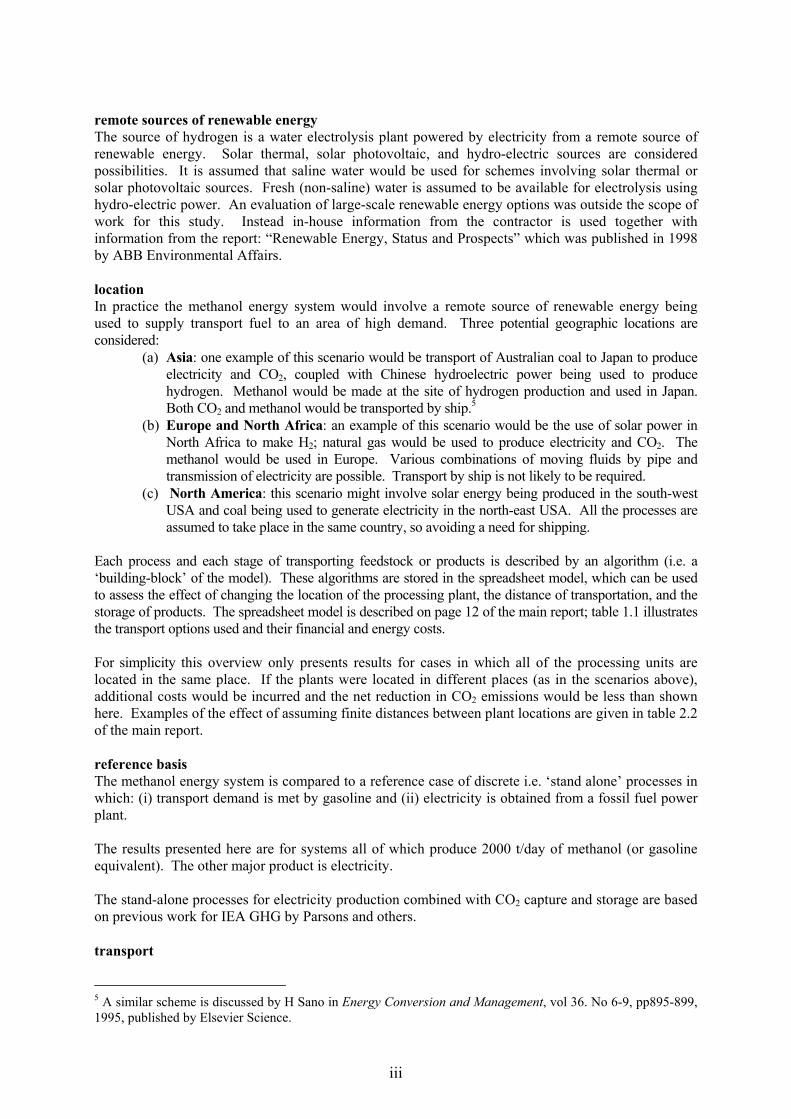
Figure S.1 Summary Results
(Based on 2,000 tpd Methanol Production, Zero Distances among Components)
PowerDemand
Transportation Demand
IGCCPlantGasoline
Coal Source
CO2 Aquifer
This is the business-as-usual scheme but with capturing and sequestration of the IGCC power plant CO2 added. The total annual cost per tonne per day of CO2 avoided for this approach is $4,870 or $15.70 per tonne CO2 (330 days operating). 6,710 tonnes per day of CO2 are emitted compared to the 14,651 tonnes per day in the Business-As-Usual Scheme without capture and sequestration of integrated gasification combined cycle (IGCC) Plant CO2. This is the reduced-carbon energy scheme with solar photovoltaic (PV) for the renewable power to produce H2. The total annual cost per tonne per day of CO2 avoided for this approach is $70,567 or $227 per tonne CO2. This cost is much greater than the business-as-usual scheme that has capturing and sequestration of CO2 added and that is simpler in concept. This reduced-carbon energy scheme emits 6,113 tonnes per day of CO2 compared with the 14,651 tonnes per day for the business-as-usual scheme without capture and sequestration of CO2.
SolarPower
Water Source
PowerDemand
Transportation Demand
IGCCPlantM85
Plant
MethanolPlant
ElectrolysisPlant
Coal Source
H2
CO2
SolarPower
Water Source
PowerDemand
Transportation Demand
IGCCPlant
M85Plant
MethanolPlant
ElectrolysisPlant
Coal Source
H2
CO2
If H2 is provided free, the total annual cost per tonne per day of CO2 avoided is reduced to $5,448 or $17.56 per tonne CO2. This value approximates the business-as-usual scheme with capture and sequestration of CO2 added. This approach emits 6,113 tonnes per day of CO2.
SolarPower
Water Source
PowerDemand
Transportation Demand
IGCCPlant
M85Plant
MethanolPlant
ElectrolysisPlant
Coal Source
H2
CO2
It is only when H2 is free and the methanol plant cost is excluded that the reduced-carbon energy scheme can effectively compete with the business-as-usual scheme that has capture and sequestration of CO2 added. The total annual cost per tonne per day of CO2 avoided for this approach is $2,960 or $9.54 per tonne CO2. The approach emits 6,113 tonnes per day of CO2.
- 2 -
1. Introduction On November the 20th, 1991, several countries signed an agreement to take part in a Greenhouse Gas R&D Programme aimed at potential mitigation as a response to the issue of global warming. Formed under the aegis of the International Energy Agency (IEA), the programme brings together those countries interested in establishing the techniques, costs, and environmental consequences of capturing and disposing part of the CO2 produced by electric power stations. Members of the IEA Greenhouse Gas R&D Programme agreed to a range of technical study activities using a consistent set of criteria, Section 1.3, to compare alternative fossil fuel based power generation technologies in terms of cost, efficiency, and their potential for reducing the emissions of greenhouse gases. 1.1 Objectives The purpose of this study is to assess a processing scheme by which the demand for transportation of goods and people can be met with reduced-carbon energy produced by decarbonization of electric power plant fossil fuels. The “Reduced-Carbon Energy Scheme” is compared with a future “Business-as-Usual Scheme” where electricity is produced by high efficiency combined cycle power plants fueled with either coal or natural gas, the predominant fossil fuels used in present electric power plants. A significant amount of carbon dioxide is produced by the combustion of these hydrocarbon fuels and air by electric power plants. The carbon dioxide is emitted to the atmosphere in the business-as-usual scheme. Similarly, hydrocarbon fuels used to produce motive power in vehicles, primarily gasoline and diesel in the business-as-usual scheme, emit an additional significant amount of carbon dioxide into the atmosphere. In the reduced-carbon energy scheme a predominant amount of the carbon dioxide produced by the electric power plant is captured, then combined with hydrogen to produce methanol for use in fueling vehicles. Only a small percentage of the carbon dioxide from the power plant is emitted into the atmosphere. The net amount of CO2 emitted from the combination of power plant and vehicles is significantly reduced. The hydrogen needed to produce methanol is formed by electrolysis of water using electricity from renewables (such as photovoltaic or hydroelectric). With the reduced-carbon energy scheme there are additional costs to produce electricity from renewables, electrolyze water to produce hydrogen and oxygen, capture carbon dioxide from the electric power plants, produce methanol, transport the chemicals (hydrogen, carbon dioxide, methanol and oxygen), and replace the conventional gasoline- and diesel-based vehicle system with a methanol-based system. The aim of the study is to determine whether near elimination of the power plant CO2 emission justifies the increased cost. The study was conducted to determine the minimum cost of achieving CO2 emission reduction. The term used to measure this is the “Cost of Mitigation.” This term has the dimensions of U.S. dollars required annually divided by the tonnes per plant day of CO2 reduction to the atmosphere. Cost of Mitigation in $/tonne CO2 avoided can be determined by dividing the annual cost per tonne CO2 per day by 330 days. The cost of mitigation is the total annual cost of the reduced-carbon energy scheme (capital and operation) minus the total annual cost of the business-as-usual scheme. The CO2 reduction is the amount of CO2 emission from the business-as-usual scheme minus the CO2 emission from the reduced-carbon energy scheme. The mitigation term is expressed in annual cost to include the cost components of capital and operation. The analysis was repeated to distinguish between the two types of electric power plant fuels, coal and natural gas. The reduced-carbon energy scheme fueled with coal was compared with the business-as-usual scheme fueled with coal. The reduced-carbon energy scheme fueled with natural gas was compared with the business-as-usual scheme fueled with natural gas.
- 3 -
1.2 Study Approach These definitions are provided to facilitate the understanding of important terms used in this study:
• Component – A distinct process or commodity transportation means such as fuel supply, chemical process, energy conversion process, transportation means such as a pipeline or electric transmission line, and energy user sector (electricity and vehicle). Some component locations were “fixed” such as the energy resource locations, and some component locations were “non-fixed” (or could vary) such as placement of the processing plants.
• Scheme – An integrated series of components necessary to convert energy resources to electricity and vehicle fuel for users.
• Scenario – A geographical situation that defines land or water separation among the components of a scheme. During early analyses, the scenarios were subdivided alphabetically. Table 2.1 denotes different distances among non-fixed components. Locations of fixed components did not vary.
• Case – Defines variations of a scheme, such as whether natural gas or coal fuels the electric power plant and whether there is CO2 capture and sequestering. Different cases are assigned a number; see Section 1.2.3.
It was intended at the beginning of the study to perform these major activities to evaluate the cost effectiveness of the reduced-carbon energy scheme:
• Document the business-as-usual scheme and establish the reduced-carbon energy scheme. Define and organize the necessary components to enable each scheme to function.
• Establish the general scenarios and cases. • Prepare an analysis model that would quantify the minimum cost of achieving CO2 reductions. The model
would incorporate an “auto-solver technique” available with commercial spreadsheets that would allow the varying of distances among non-fixed components while maintaining the distance among fuel supply, renewables location, water source, and electric/vehicle users to reduce the cost of each scenario/case match.
• Develop data and technical assumptions needed for input in the spreadsheet analysis. • Analyze each general scenario/case match to determine placement of non-fixed components for set
locations of resources and users (fuel supply, water source, renewables resource location, electric and vehicle fuel users) that yield the minimum cost of achieving CO2 reductions.
• Identify actual geographic situations on earth that closely match the lowest emission, lowest cost cases of the general scenarios.
• Analyze the actual geographic situations using the model to refine the study results. Executed activities paralleled the intended activities of the study to the step where each general scenario/case match was analyzed. At this point in the study it was found that the reduced-carbon energy scheme with zero distances has a much higher cost than the business-as-usual scheme, even with sequestering and storing CO2 added. The amounts of CO2 emitted to the atmosphere were within 10 percent in the two schemes. Increasing distances among components exacerbated the disproportionate cost to reduce CO2 emission. 1.2.1 Schemes/Components The reduced-carbon energy scheme and the business-as-usual scheme were established to define the components necessary to convert coal or natural gas to electricity and vehicle fuel. The two schemes and their component functions are briefly described in Section 1.1. The integrated gasification combined cycle (IGCC) plant applied to the business-as-usual scheme was taken from Greenhouse Gas Program (GHG) Report PH2/4. The plant incorporates an oxygen-blown gasifier and a high
- 4 -
efficiency gas turbine to produce power at 41.9 percent LHV efficiency. This result forms the basis to determine differences between the business-as-usual plant and its efficiency and cost when it was modified to capture CO2. The modified plant is needed as the core IGCC plant for the reduced-carbon energy scheme. The modified IGCC plant with CO2 capture was determined to have an efficiency of 35.5 percent LHV while capturing 81 percent of the CO2 from the process. The reduced-carbon energy scheme assumes a 2,000 tonne per day methanol plant. The methanol plant to convert hydrogen and CO2 to methanol utilizes a newly developed catalyst that creates a product gas from the gas feedstocks in a separate adiabatic reactor before feeding the product gas to the recycle loop. In this manner, the feed gases initially react according to two equations, with the resultant heat of reaction being slightly exothermic. CO2 + 3H2 = CH3OH + H2O - 48.43 kJ/gmol CO2 + H2 = CO + H2O + 41.12 kJ/gmol Maximum methanol yield is reached at 80 bar and 260°C. The product gas is then routed to the methanol synthesis loop consisting of a second isothermal reactor to control CO. The tubular reactor requires only about 80 percent of the volume if the makeup gas were fed directly to the loop. Similarly, the recycle compressor and product separators are proportionately smaller. Product gas from the methanol synthesis reactors is cooled and flashed to release liquid crude methanol. The synthesis of CO2 and hydrogen leads to a crude methanol that contains hardly any byproducts other than water. This makes it easy to distill the crude methanol into an extremely pure finished product. Overheads from the flash drums are recycled to the methanol synthesis reactors. A buildup of inerts (N2, Ar, CH4) results from the recycle of unreacted gases in the synthesis loop. Therefore, a purge stream of gas is taken from the high pressure separator. Prior to exiting the methanol production facility, this stream is routed through a PSA to recover valuable hydrogen that is compressed and routed back to the synthesis loop. Off-gas from the PSA has considerable fuel value and is used in an auxiliary boiler for on-site steam and power generation. Crude methanol from the synthesis unit is refined to fuel grade methanol product in the methanol refining unit. All other components in the scheme were sized to be compatible with that capacity methanol plant. The methanol produced from the reaction of CO2 with hydrogen is transported to an end-use site where it is blended with gasoline to produce M85 for use as transportation fuel. M85 is a mixture of 85 percent methanol and 15 percent gasoline. The source of CO2 for the methanol plant is the PH2/4 IGCC plant with CO2 capture. That plant captures more CO2 than is needed for methanol production, 7,940 tonnes per day with coal as the power plant fuel. The methanol plant uses 2,750 tonnes per day of CO2. The balance of captured CO2 is sequestered. Sequestration was acceptable rather than scaling the IGCC plant to produce only enough CO2 to produce 2,000 tonnes per day of methanol. Plant cost was accepted as is and size integrity of the gasifiers and the gas turbines, based on manufacturer specified equipment, was retained. To produce methanol from a reaction with CO2, 375 tonnes per day of hydrogen are required from a source that does not contribute to the overall CO2 emissions. The hydrogen source is a water electrolysis plant powered with electricity from a renewable energy source. Solar thermal, photovoltaic, or hydroelectric sources can supply the renewable energy. In addition to hydrogen, the electrolysis plant produces 3,000 tonnes of oxygen per day, that can be sent to the IGCC plant as an oxidant for the gasification process, provided that the hydrolysis plant is on the same landmass as the IGCC. If the electrolysis plant and the IGCC are separated by water, the oxygen was considered to be marketable. The reduced-carbon energy scheme suitable for the natural gas case is similar to the coal-based scheme. Sizing for components with natural gas is also based on a 2,000 tonne per day methanol plant. The baseline natural gas combined cycle (NGCC) plant for the business-as-usual scheme is taken from GHG Report IEA/91/OE9, which
- 5 -
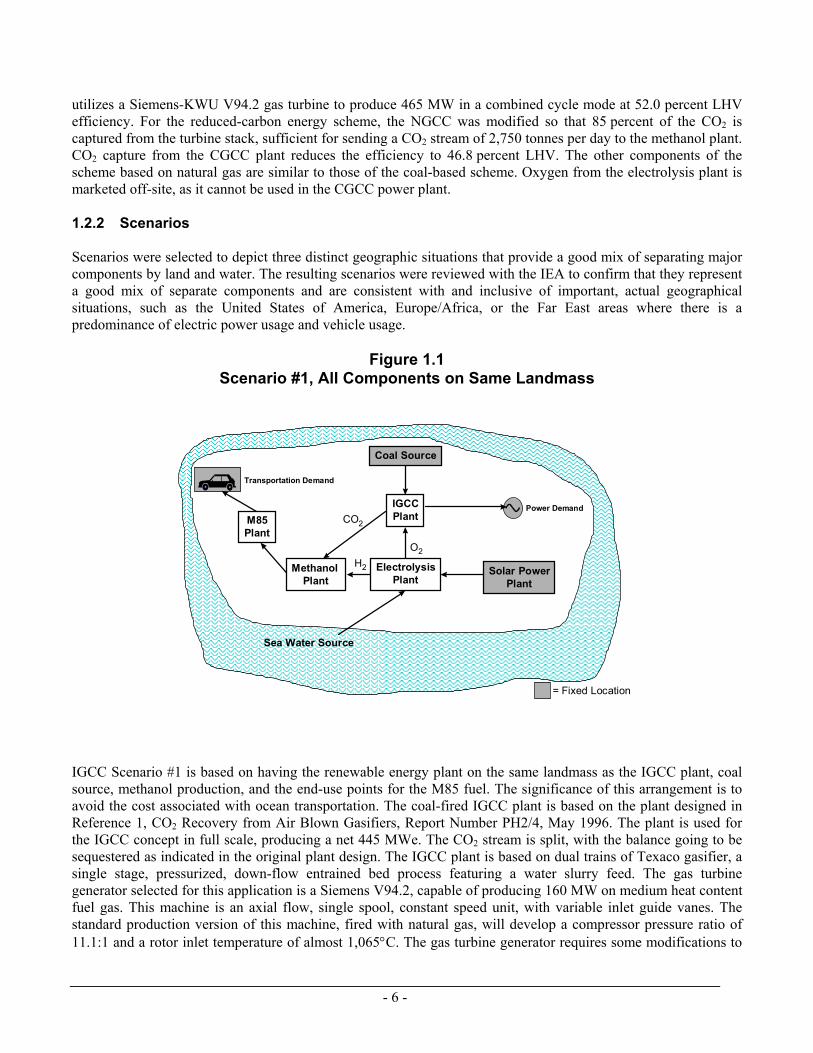
utilizes a Siemens-KWU V94.2 gas turbine to produce 465 MW in a combined cycle mode at 52.0 percent LHV efficiency. For the reduced-carbon energy scheme, the NGCC was modified so that 85 percent of the CO2 is captured from the turbine stack, sufficient for sending a CO2 stream of 2,750 tonnes per day to the methanol plant. CO2 capture from the CGCC plant reduces the efficiency to 46.8 percent LHV. The other components of the scheme based on natural gas are similar to those of the coal-based scheme. Oxygen from the electrolysis plant is marketed off-site, as it cannot be used in the CGCC power plant. 1.2.2 Scenarios Scenarios were selected to depict three distinct geographic situations that provide a good mix of separating major components by land and water. The resulting scenarios were reviewed with the IEA to confirm that they represent a good mix of separate components and are consistent with and inclusive of important, actual geographical situations, such as the United States of America, Europe/Africa, or the Far East areas where there is a predominance of electric power usage and vehicle usage.
Figure 1.1 Scenario #1, All Components on Same Landmass
Solar PowerPlant
Sea Water Source
= Fixed Location
Power Demand
Transportation Demand
IGCCPlantM85
Plant
MethanolPlant
ElectrolysisPlant
Coal Source
O2H2
CO2
IGCC Scenario #1 is based on having the renewable energy plant on the same landmass as the IGCC plant, coal source, methanol production, and the end-use points for the M85 fuel. The significance of this arrangement is to avoid the cost associated with ocean transportation. The coal-fired IGCC plant is based on the plant designed in Reference 1, CO2 Recovery from Air Blown Gasifiers, Report Number PH2/4, May 1996. The plant is used for the IGCC concept in full scale, producing a net 445 MWe. The CO2 stream is split, with the balance going to be sequestered as indicated in the original plant design. The IGCC plant is based on dual trains of Texaco gasifier, a single stage, pressurized, down-flow entrained bed process featuring a water slurry feed. The gas turbine generator selected for this application is a Siemens V94.2, capable of producing 160 MW on medium heat content fuel gas. This machine is an axial flow, single spool, constant speed unit, with variable inlet guide vanes. The standard production version of this machine, fired with natural gas, will develop a compressor pressure ratio of 11.1:1 and a rotor inlet temperature of almost 1,065°C. The gas turbine generator requires some modifications to
- 6 -
the burner and turbine nozzles to properly combust the medium heat content gas in this service. Waste heat from the gas path is recovered and used to generate steam for use in a steam turbine expander, producing an additional 264 MWe. Oxygen for the gasifiers is supplied by pipeline from the electrolysis. The process requires 3,900 metric tonnes per day (MTPD) oxygen, and only 3,000 MTPD is available from the pipeline. A small 900 MTPD oxygen plant is required with the IGCC plant. Selexol was selected because of its high selectivity toward both H2S and CO2 when operated in a two-stage mode, which is needed for the desulfurization of fuel gases with relative high CO2 concentrations as being produced by a Texaco gasifier. The fuel gas is cleaned in a dual column Selexol unit consisting of two packed bed absorbers. The first column removes 99.4 percent of the H2S and a small fraction of the CO2. The second column removes the greater portion of the CO2. Because of the two column arrangement, H2S and CO2 leave the Selexol unit in separate streams. From the separated H2S, elemental sulfur is produced in the sulfur recovery unit (Claus unit). The tail gas from the sulfur recovery unit, which contains 3 to 5 percent of the original sulfur removed in the acid gas removal unit, is treated in a Lo-Cat tail gas treating unit. The only contaminants in the cleaned fuel gas leaving the acid gas removal unit are residual H2S and HCN, both in very low concentrations. The CO2 stream from the Selexol unit regeneration is dried and compressed to 110 bar. Coal is received from the mine by rail transportation, and oxygen is received by pipeline from the electrolysis plant. CO2 captured from the IGCC plant and required for the methanol plant is transported by pipeline. The solar power plant provides renewable power for generating hydrogen and oxygen form water taken from a nearby seawater source. The scenario is representative of actual geographic situations such as the southwest United States of America, North Africa, or Australia.
- 7 -
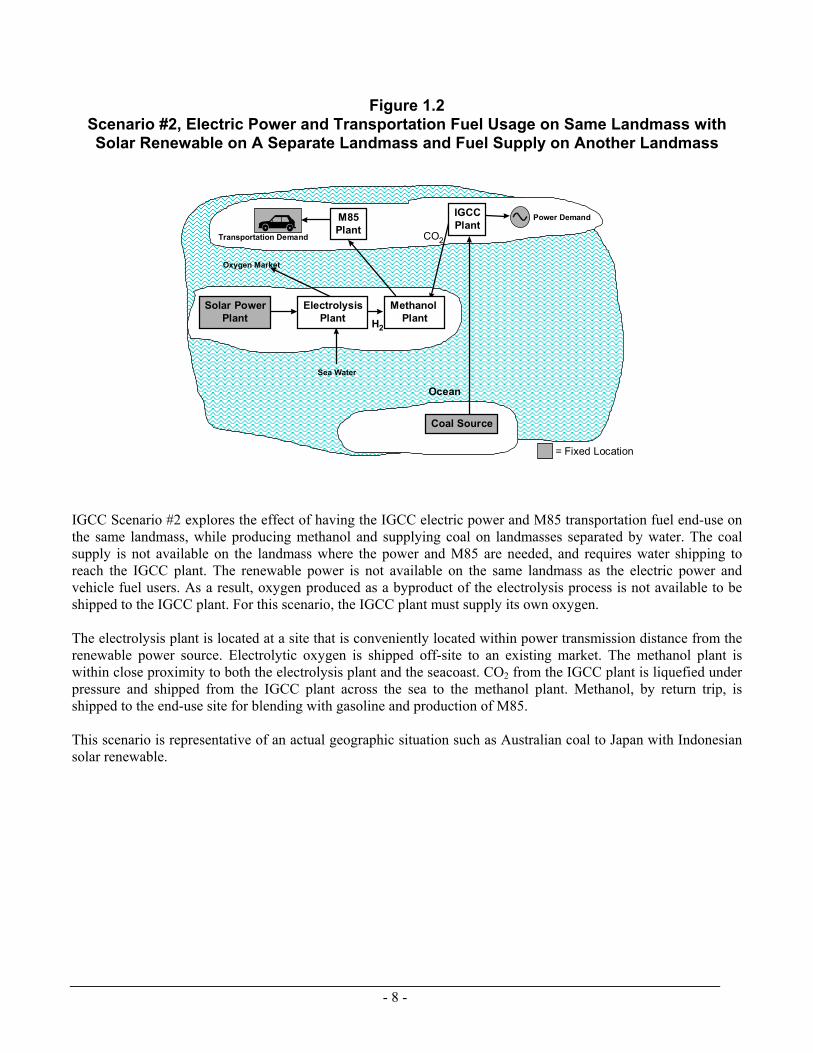
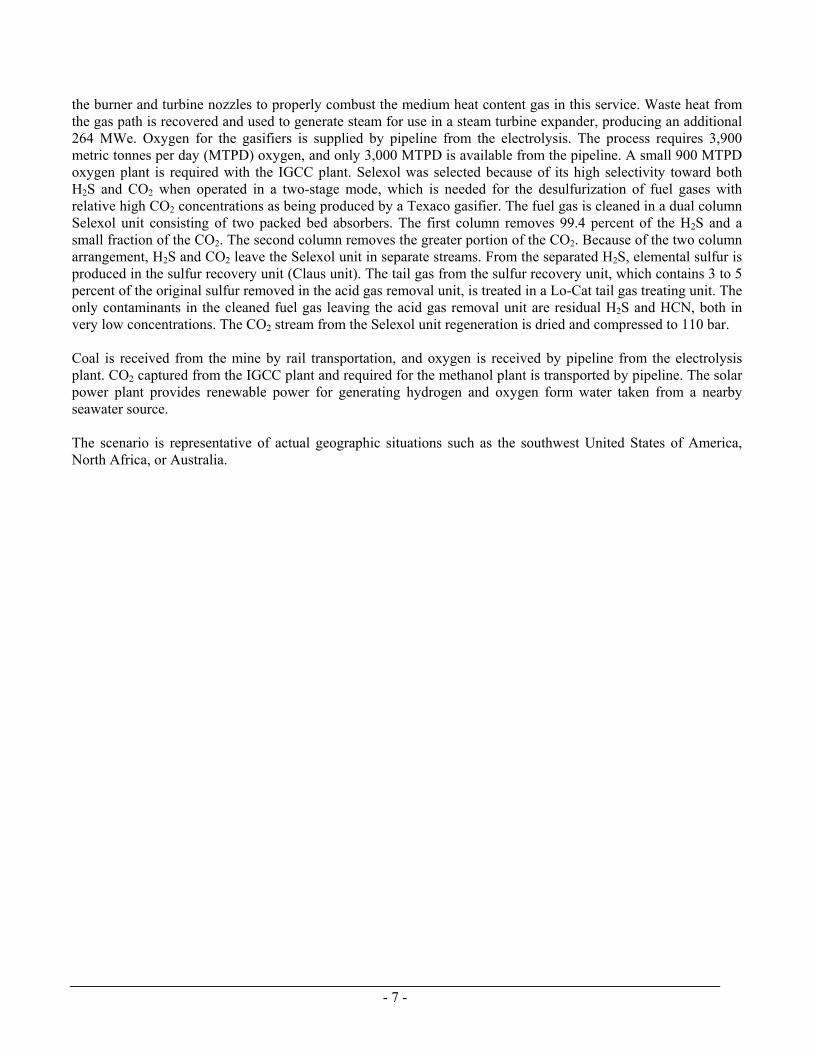
Figure 1.2 Scenario #2, Electric Power and Transportation Fuel Usage on Same Landmass with Solar Renewable on A Separate Landmass and Fuel Supply on Another Landmass
Sea Water
= Fixed Location
Power Demand
Transportation Demand
Ocean
Oxygen Market
Coal Source
IGCCPlant
M85Plant
MethanolPlant
ElectrolysisPlant
Solar PowerPlant
CO2
H2
IGCC Scenario #2 explores the effect of having the IGCC electric power and M85 transportation fuel end-use on the same landmass, while producing methanol and supplying coal on landmasses separated by water. The coal supply is not available on the landmass where the power and M85 are needed, and requires water shipping to reach the IGCC plant. The renewable power is not available on the same landmass as the electric power and vehicle fuel users. As a result, oxygen produced as a byproduct of the electrolysis process is not available to be shipped to the IGCC plant. For this scenario, the IGCC plant must supply its own oxygen. The electrolysis plant is located at a site that is conveniently located within power transmission distance from the renewable power source. Electrolytic oxygen is shipped off-site to an existing market. The methanol plant is within close proximity to both the electrolysis plant and the seacoast. CO2 from the IGCC plant is liquefied under pressure and shipped from the IGCC plant across the sea to the methanol plant. Methanol, by return trip, is shipped to the end-use site for blending with gasoline and production of M85. This scenario is representative of an actual geographic situation such as Australian coal to Japan with Indonesian solar renewable.
- 8 -
Figure 1.3 Scenario #3, Electric Power and Transportation Fuel Usage on Same Landmass with
Hydro Renewable on Separate Landmass and Coal on Another Landmass
River Water
= Fixed Location
Power DemandTransportation Demand
Ocean
Oxygen Market
Coal Source
IGCCPlant
M85Plant
MethanolPlant
ElectrolysisPlant
Hydro PowerPlant
CO2
H2
IGCC Scenario #3 bears a strong resemblance to Scenario #2. The difference is that the renewable power supply is changed from solar-PV to hydro, requiring a change in location. As in Scenario #2, the renewable power and methanol plants are located on the same landmass, apart from the IGCC electric power and M85 transportation fuel use points. The CO2 from the IGCC is liquefied under pressure and transported across the ocean to the methanol plant. The renewable power is used to produce electrolytic hydrogen and oxygen. The oxygen is sent off-site to a convenient market. The hydrogen is combined with the CO2 to make methanol. The methanol is shipped across the water to the end-use point where it is blended with gasoline to produce M85. The scenario is representative of an actual geographic situation such as Australian coal to Japan with Chinese hydroelectric renewable.
- 9 -
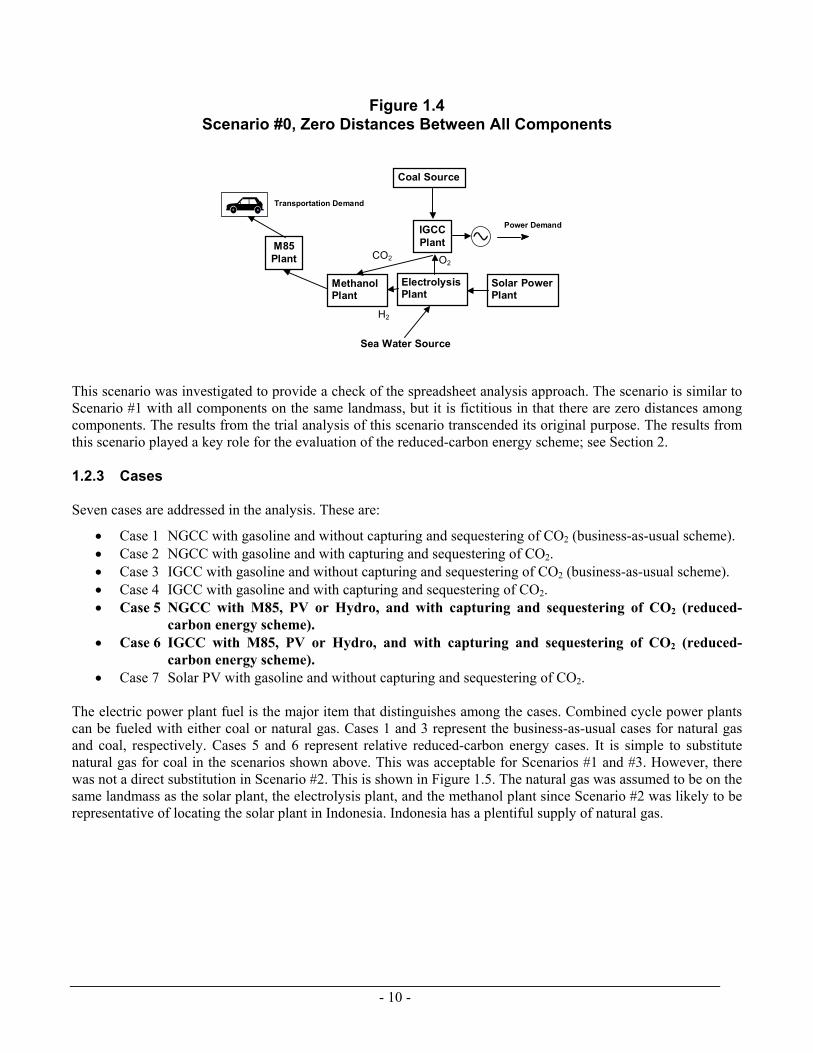
Figure 1.4 Scenario #0, Zero Distances Between All Components
Solar PowerPlant
Sea Water Source
Power Demand
Transportation Demand
IGCCPlantM85
Plant
MethanolPlant
ElectrolysisPlant
Coal Source
O2
H2
CO2
This scenario was investigated to provide a check of the spreadsheet analysis approach. The scenario is similar to Scenario #1 with all components on the same landmass, but it is fictitious in that there are zero distances among components. The results from the trial analysis of this scenario transcended its original purpose. The results from this scenario played a key role for the evaluation of the reduced-carbon energy scheme; see Section 2. 1.2.3 Cases Seven cases are addressed in the analysis. These are:
• Case 1 NGCC with gasoline and without capturing and sequestering of CO2 (business-as-usual scheme). • Case 2 NGCC with gasoline and with capturing and sequestering of CO2. • Case 3 IGCC with gasoline and without capturing and sequestering of CO2 (business-as-usual scheme). • Case 4 IGCC with gasoline and with capturing and sequestering of CO2. • Case 5 NGCC with M85, PV or Hydro, and with capturing and sequestering of CO2 (reduced-
carbon energy scheme). • Case 6 IGCC with M85, PV or Hydro, and with capturing and sequestering of CO2 (reduced-
carbon energy scheme). • Case 7 Solar PV with gasoline and without capturing and sequestering of CO2.
The electric power plant fuel is the major item that distinguishes among the cases. Combined cycle power plants can be fueled with either coal or natural gas. Cases 1 and 3 represent the business-as-usual cases for natural gas and coal, respectively. Cases 5 and 6 represent relative reduced-carbon energy cases. It is simple to substitute natural gas for coal in the scenarios shown above. This was acceptable for Scenarios #1 and #3. However, there was not a direct substitution in Scenario #2. This is shown in Figure 1.5. The natural gas was assumed to be on the same landmass as the solar plant, the electrolysis plant, and the methanol plant since Scenario #2 was likely to be representative of locating the solar plant in Indonesia. Indonesia has a plentiful supply of natural gas.
- 10 -
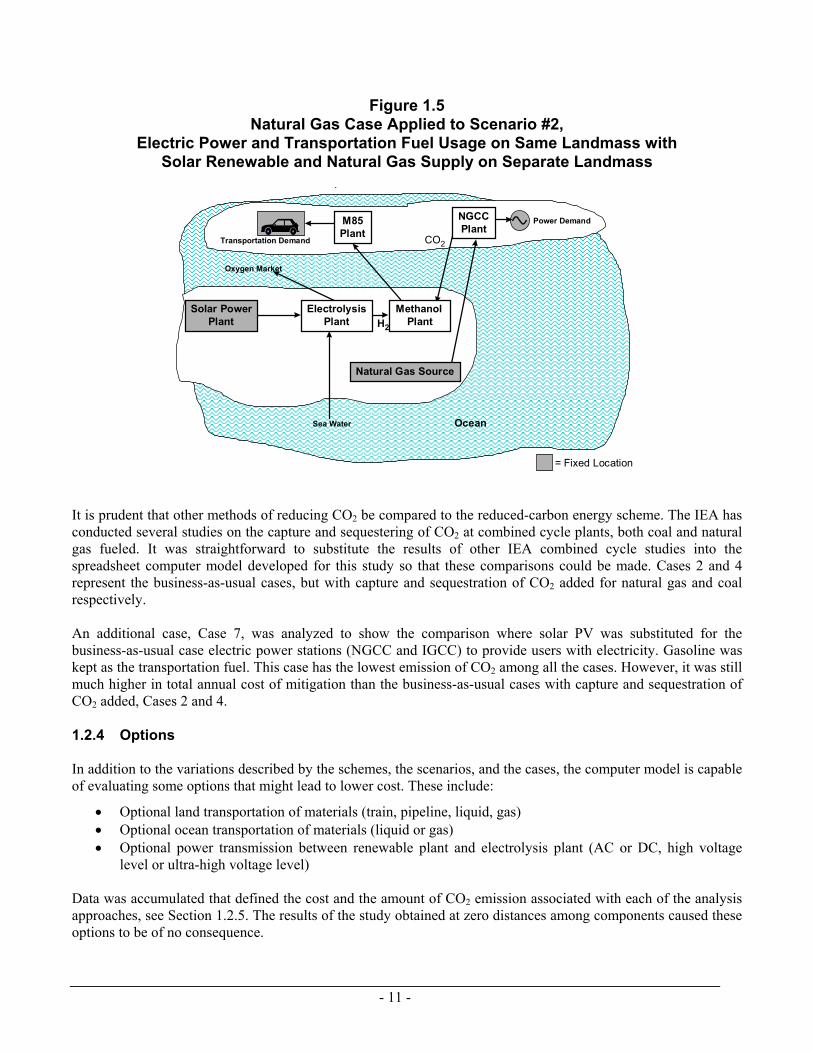
Figure 1.5 Natural Gas Case Applied to Scenario #2,
Electric Power and Transportation Fuel Usage on Same Landmass with Solar Renewable and Natural Gas Supply on Separate Landmass
p
= Fixed Location
Power Demand
Transportation Demand
Ocean
Oxygen Market
Natural Gas Source
NGCCPlant
M85Plant
MethanolPlant
ElectrolysisPlant
Solar PowerPlant
CO2
H2
Sea Water
It is prudent that other methods of reducing CO2 be compared to the reduced-carbon energy scheme. The IEA has conducted several studies on the capture and sequestering of CO2 at combined cycle plants, both coal and natural gas fueled. It was straightforward to substitute the results of other IEA combined cycle studies into the spreadsheet computer model developed for this study so that these comparisons could be made. Cases 2 and 4 represent the business-as-usual cases, but with capture and sequestration of CO2 added for natural gas and coal respectively. An additional case, Case 7, was analyzed to show the comparison where solar PV was substituted for the business-as-usual case electric power stations (NGCC and IGCC) to provide users with electricity. Gasoline was kept as the transportation fuel. This case has the lowest emission of CO2 among all the cases. However, it was still much higher in total annual cost of mitigation than the business-as-usual cases with capture and sequestration of CO2 added, Cases 2 and 4. 1.2.4 Options In addition to the variations described by the schemes, the scenarios, and the cases, the computer model is capable of evaluating some options that might lead to lower cost. These include:
• Optional land transportation of materials (train, pipeline, liquid, gas) • Optional ocean transportation of materials (liquid or gas) • Optional power transmission between renewable plant and electrolysis plant (AC or DC, high voltage
level or ultra-high voltage level) Data was accumulated that defined the cost and the amount of CO2 emission associated with each of the analysis approaches, see Section 1.2.5. The results of the study obtained at zero distances among components caused these options to be of no consequence.
- 11 -
1.2.5 Analysis Model A model was developed, using a commercially available spreadsheet, that estimates the total annual cost (capital and operating) and CO2 emission of the various scenario/case matches. The total annual cost and the CO2 emission of the investigated case are compared with the same factors for the business-as-usual case (same fuel, no CO2 capture and sequestration) to determine the cost of mitigation. There are two categories of information needed to compile the total annual cost and total emission. These are penalties, cost, and emissions information relating to the energy and chemical process components (fuel and renewables supplies, renewables plant, electrolysis plant, power plant, and methanol plant) and penalties, cost, and emissions information that result from moving commodities (fuels, chemicals, and electricity) from one component to another. Due to the large number of feasible technology/component combinations that must be considered, it was necessary to develop a group of simple algorithms that depict the change in cost of the transport components and the resulting emissions. From a cost viewpoint, the algorithms consider that there is a power penalty with distance that will impact the product economics of chemical transport. For example, additional pumping stations are required. These stations will reduce the amount of fuel to be delivered. These pumping stations need power that, in turn, produces emissions. In transmission, the capacity of electricity that will be delivered is reduced with distance due to line losses. Also, the transport algorithms were built to consider chemicals leakage and capital cost of the transportation means as distance changes. The algorithms were integrated into a single spreadsheet calculation so that all emissions, capital costs, and operating costs could be accumulated and a total life cycle cost, expressed on an annual basis, could be determined. The integration was based on the overall path of energy and material transfer across the conversion of raw materials to methanol for each scheme. The model was intended to employ an “auto-solver” technique that would seek the minimum cost of CO2 avoidance for specific cases by varying the placement of the various non-fixed components in relation to other non-fixed components of the case (the distances between the fixed components, e.g., fuel supply and the end users, are kept constant according to the scenario’s geographic situation). For example, where is the lowest cost placement of the hydrolysis plant in relation to the methanol plant, the electric power plant, and the renewables plant based on costs to transmit electricity, chemicals, and water as the relative distances vary? The analysis would be rerun to determine the placement of components that would result in the lowest CO2 emission. The final placement of components would be determined by choosing the best combination of low cost and low CO2 emission for a particular reduced-carbon energy case. The “auto-solver” technique was not used because of the results of the case that had zero distances; see Section 2. The spreadsheet model is divided into worksheets that:
• Provide quantities of parasitic power, energy penalties and efficiencies, emissions, and capital and operating costs for components of the schemes. This information was collected for fuel sources, chemicals transport (liquids, solids, and gases), electricity transport, product processing, and power processing.
• Quantify constants and conversion factors used in calculations, for example the number of tonnes of CO2 produced by burning one tonne of the various fuels used.
• Allow for the input of distances among the components of a particular scenario/case match considering that locations for some components, like fuel supply, renewables, and users are fixed.
• Define inputs for a particular scenario/case match. Control boxes allow the user to define the particular case to be examined and what reference case is used to determine total annual cost increases and emission decreases.
• Illustrate the calculations for a particular scenario/case match. • Produce a summary flow diagram that lists the quantities of major chemicals, emissions, capital and
operating costs, and electric power and energy between adjacent components in the case. • Summarize the results in numerical and graphical form.
- 12 -
The model is exercised by setting distances among the non-fixed components on the “distanceinput” worksheet, then noting which CO2 reduction case will be investigated and which business-as-usual case will be used for the reference on the “inputs” worksheet. The results that are produced by the model on the “summary” worksheet are:
• Total CO2 released to the atmosphere • Total power available from system (vehicle fuel is constant based on 2,000 tpd methanol production) • Total capital cost • Total annual O&M cost • Total annual cost • Cost of mitigation ($/tonne CO2 per day reduced when compared to the business-as-usual scheme)
Data are needed in the model to evaluate the cases. Once the data are identified, there was a need to normalize the data so that comparisons could be made accurately. Tables 1.1 and 1.2 illustrate the normalized data that resulted. Data requirements included costs for each of the power processes, product processes, commodities, and transportation methods. Data were obtained from a variety of sources including applicable project specific information internal to Parsons and published external information. All data was normalized to a common cost date of January 1998. Total annual cost includes both the levelized annual capital charge and the annual operating cost. In cases where specific annual operating cost data was not available, such as for the pipelines and product processes, annual operating cost was calculated as an experience based percentage of the annual capital cost. This is defined in the Supplemental Information for the Performance Factors included as notes with Table 1.1.
- 13 -
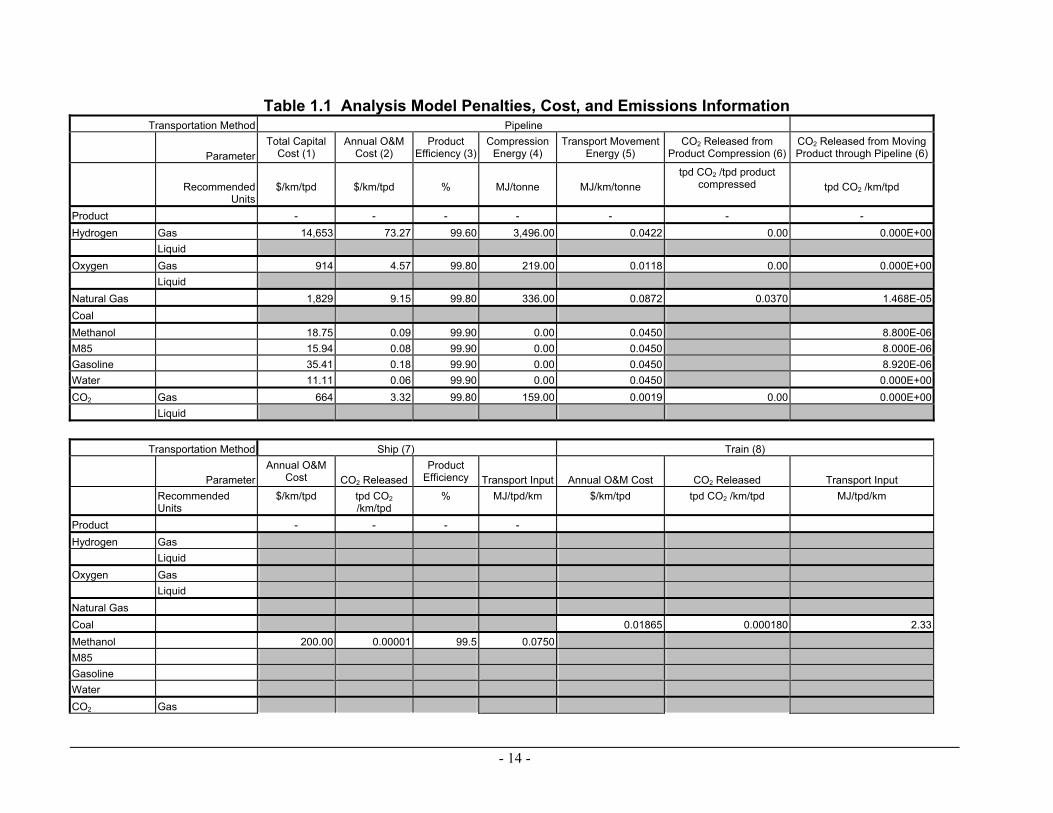
Table 1.1 Analysis Model Penalties, Cost, and Emissions Information Transportation Method Pipeline Total Capital
Cost (1) Parameter Annual O&M
Cost (2) Product
Efficiency (3)Compression
Energy (4) Transport Movement
Energy (5) CO2 Released from
Product Compression (6)CO2 Released from Moving Product through Pipeline (6)
Recommended Units
$/km/tpd
$/km/tpd
%
MJ/tonne
MJ/km/tonne
tpd CO2 /tpd product compressed
tpd CO2 /km/tpd
Product - - - - - - -Hydrogen Gas 14,653 73.27 99.60 3,496.00 0.0422 0.00 0.000E+00
Liquid Oxygen Gas 914 4.57 99.80 219.00 0.0118 0.00 0.000E+00
Liquid Natural Gas 1,829 9.15 99.80 336.00 0.0872 0.0370 1.468E-05Coal Methanol 18.75 0.09 99.90 0.00 0.0450 8.800E-06M85 15.94 0.08 99.90 0.00 0.0450 8.000E-06Gasoline 35.41 0.18 99.90 0.00 0.0450 8.920E-06Water 11.11 0.06 99.90 0.00 0.0450 0.000E+00CO2 Gas 664 3.32 99.80 159.00 0.0019 0.00 0.000E+00
Liquid
Transportation Method Ship (7) Train (8) Annual O&M
Cost Parameter
CO2 ReleasedProduct
Efficiency
Transport Input
Annual O&M Cost
CO2 Released
Transport Input Recommended Units
$/km/tpd tpd CO2 /km/tpd
% MJ/tpd/km $/km/tpd tpd CO2 /km/tpd MJ/tpd/km
Product - - - -Hydrogen Gas
Liquid Oxygen Gas
Liquid Natural Gas Coal 0.01865 0.000180 2.33Methanol 200.00 0.00001 99.5 0.0750M85 Gasoline Water CO2 Gas
- 14 -
Liquid 200.00 0.00001 100 0.0750
- 15 -
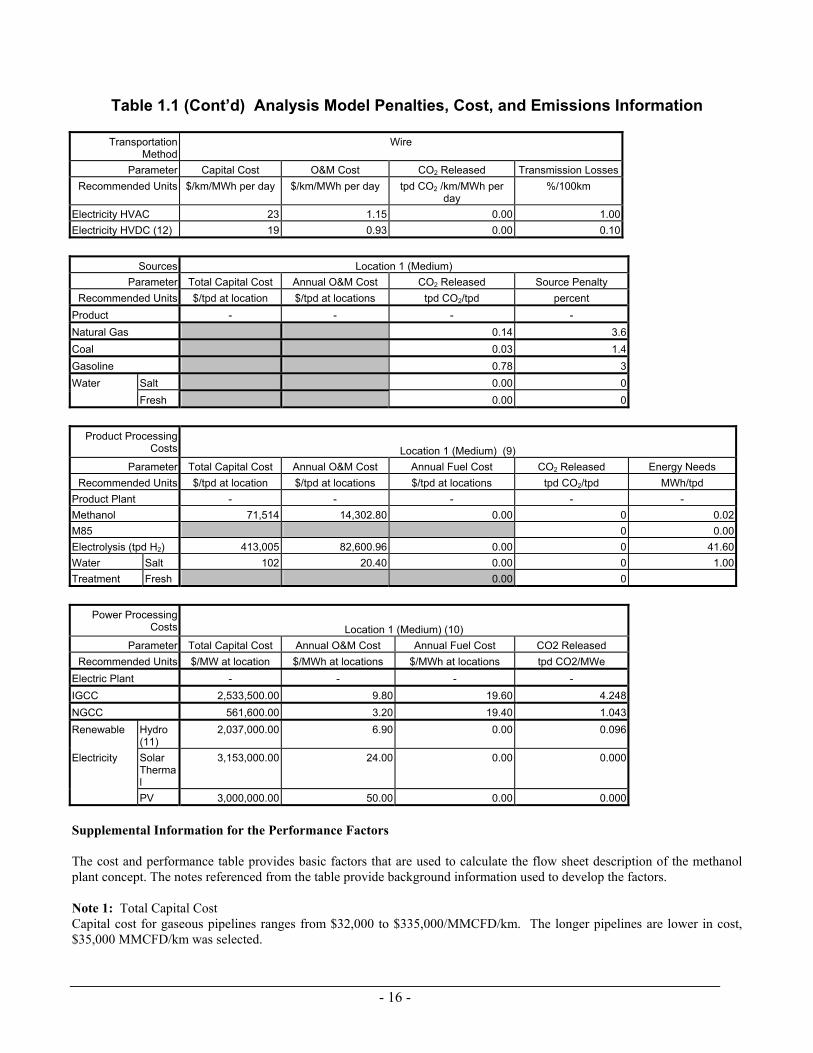
Table 1.1 (Cont’d) Analysis Model Penalties, Cost, and Emissions Information
Transportation Method
Wire
Parameter Capital Cost O&M Cost CO2 Released Transmission Losses Recommended Units $/km/MWh per day $/km/MWh per day tpd CO2 /km/MWh per
day %/100km
Electricity HVAC 23 1.15 0.00 1.00 Electricity HVDC (12) 19 0.93 0.00 0.10
Sources Location 1 (Medium)
Parameter Total Capital Cost Annual O&M Cost CO2 Released Source Penalty Recommended Units $/tpd at location $/tpd at locations tpd CO2/tpd percent
Product - - - - Natural Gas 0.14 3.6 Coal 0.03 1.4 Gasoline 0.78 3 Water Salt 0.00 0
Fresh 0.00 0
Product Processing
Costs
Location 1 (Medium) (9) Parameter Total Capital Cost Annual O&M Cost Annual Fuel Cost CO2 Released Energy Needs
Recommended Units $/tpd at location $/tpd at locations $/tpd at locations tpd CO2/tpd MWh/tpd Product Plant - - - - - Methanol 71,514 14,302.80 0.00 0 0.02M85 0 0.00Electrolysis (tpd H2) 413,005 82,600.96 0.00 0 41.60Water Salt 102 20.40 0.00 0 1.00Treatment Fresh 0.00 0
Power Processing
Costs
Location 1 (Medium) (10) Parameter Total Capital Cost Annual O&M Cost Annual Fuel Cost CO2 Released
Recommended Units $/MW at location $/MWh at locations $/MWh at locations tpd CO2/MWe Electric Plant - - - - IGCC 2,533,500.00 9.80 19.60 4.248 NGCC 561,600.00 3.20 19.40 1.043 Renewable Hydro
(11) 2,037,000.00 6.90 0.00 0.096
Electricity Solar Thermal
3,153,000.00 24.00 0.00 0.000
PV 3,000,000.00 50.00 0.00 0.000 Supplemental Information for the Performance Factors The cost and performance table provides basic factors that are used to calculate the flow sheet description of the methanol plant concept. The notes referenced from the table provide background information used to develop the factors. Note 1: Total Capital Cost Capital cost for gaseous pipelines ranges from $32,000 to $335,000/MMCFD/km. The longer pipelines are lower in cost, $35,000 MMCFD/km was selected.
- 16 -
Hydrogen: 375 MTPD 157 MMCFD $14,653/km/tpd Oxygen 3000 MTPD 78.38 MMCFD $914/km/tpd Natural Gas 1705 MTPD 89.09 MMCFD $1,829/km/tpd CO2 2,750 MTPD 52.2 MMCFD $664/km/tpd Liquid pipelines have a wide cost range, assume $9,000 to $45,000/mile/inch diameter. Selected $10,000/mile/inch. Liquid pipeline diameters varied, based on equal pressure losses per km, and a velocity of approximately 3 meters per second. Methanol: 2,000 tpd 6 inch pipe $18.75/km/tpd Water: 3,375 tpd 6 inch pipe $11.11/km/tpd Gasoline: 353 tpd 2 inch pipe $35.41/km/tpd M85 2,353 tpd 6 inch pipe $15.94km/tpd Note 2: Annual O&M Cost is based on 0.5 percent of capital Note 3: Product Efficiency Product efficiency is based on the gas remaining after pipeline losses according to a recent IEA survey. Assume 0.4% system losses for hydrogen and 0.2% system losses for natural gas, etc. Natural gas: System loss .2%, efficiency = 99.8% Hydrogen: More losses than natural gas, Efficiency = 99.6% Oxygen: Assume 99.8% efficiency CO2: Assume 99.8% efficiency Liquid Losses: Assume 0.1% system losses, 99.9% efficiency Note 4: Compression Energy This is the energy required to compress gases from source pressure to pipeline pressure. Hydrogen: 1 bar to 100 bar = 15,174 kW/375 tpd 15,174 kW/375 tpd x 24 hr x 3.60 MJ/kW-hr = 3,469 MJ/tonne CO2: 1 bar to 100 bar = 5,062 kW/2,750 tpd = 159 MJ/tonne (Note that CO2 compression penalty is assigned to the
IGCC and NGCC plant performance and cost estimates) Oxygen: 1 bar to 86 bar = 7,579 kW/3,000 tpd = 218 MJ/tonne Natural gas: 1 bar to 100 bar = 6,629 kW/1,705 tpd = 336 MJ/tonne Liquids are non-compressible Note 5: Transport Movement Energy Energy required to overcome friction losses of gas or liquids passing through pipelines Hydrogen: 0.183 kW/km/375 tpd = 0.042 MJ/km/tonne Oxygen: 0.409 kW/km/3,000tpd = 0.0118 MJ/km/tonne CO2: 0.061 kW/km/2,750 tpd = 0.0019 MJ/km/tonne Natural gas 1.72 kW/km/1,705 tpd = 0.0872 MJ/km/tonne Friction losses for all liquids are equal due to varying diameter pipelines to accommodate different mass flows through the pipelines. Friction loss = 0.002 psi/foot = 0.000521 kW/km/tonne = 0.0450 MJ/km/tonne Note 6: CO2 Released from Product Compression or Product Movement CO2 released from pipeline compression or movement is the result of using pipeline contents (if combustible) to produce energy. CO2 resulting from electric power to compress or move non-combustibles is accounted for at the power plant. CO2 Released from Compression: Hydrogen: Zero Oxygen: Zero CO2: Zero Natural Gas: 2.67 t/t @ 35% efficient = 7.63 tonne CO2/tonne natural gas combusted 7.63/1705 = 0.0370 tonne CO2/tpd natural gas transported CO2 released from Movement: Natural Gas: 0.0872 MJ/km/tonne produces 5.137 tonne CO2/106 km/tonne @ 35% efficient = 0.00001468 tonnes CO2/kM/tonne
- 17 -
All liquids require 0.045 MJ/km/tonne @ 35% efficiency Methanol: 8.80 x 10⁻⁶ tonne CO2/tonne M85: 8.080 x 10⁻⁶ tonne CO2/tonne Gasoline: 8.92 x 10⁻⁶ tonne CO2/tonne Note 7: Costs and Energy for Ocean Shipping Ocean freight varies depending on destination and distance. Average costs for this application are $200/km/tonne. Energy for ship transport is based an IEA Orimulsion study that used 0.0750 MJ/tonne/km for a 100,000 dwt ship. Burning diesel amounts to a CO2 release of 0.00601 tonnes CO2/km/tonne. Assumed no product losses and 100% transportation efficiency. Note 8: Costs and Energy for Rail Freight Shipping costs for freight average $30/1000 tonne - miles, which equals $0.01865/km/tonne. The energy required to move a train is reported in Mark’s Mechanical Engineering Handbook to be 25 kWh/tonne/mile, which is equal to 2.33 MJ/km/tonne. CO2 released from diesel fuel producing that amount of energy would equal 0.000180 tonnes/tonne of freight. Note 9: Product Processing Factors Capital costs are based on plant capital divided by the production in tonnes per day. The annual operating costs are 20 percent of capital. Energy needs are auxiliary electric power divided by tpd, with the electrolysis plant based on hydrogen tonnage production. Since everything is electric powered, there is no CO2 release allocated. Note 10: Power Processing Factors Plant capital costs are based on published power plant costs in $/kW, multiplied by 1,000 to get the usable $/MW factors. The IGCC plant is based on IEA PH2/4 for an IGCC plant with CO2 capture. The total capital requirement is $2,533.5/kW. Annual O&M costs were based on published literature for each type of plant. CO2 released is also published. Note 11: CO2 Released from Hydroelectric Power The CO2 released from the hydroelectric dam is based on an ABB report cited by IEA. 0.004 kg CO2/kWh x 24 x 1000/1000 = 0.096 tpd CO2/MW Note 12: HVDC Power Transmission The transmission of high voltage DC becomes more economical than HVAC at distances greater than 1,000 km in the 750 MW range. Costs are reduced by about 20 percent.
- 18 -
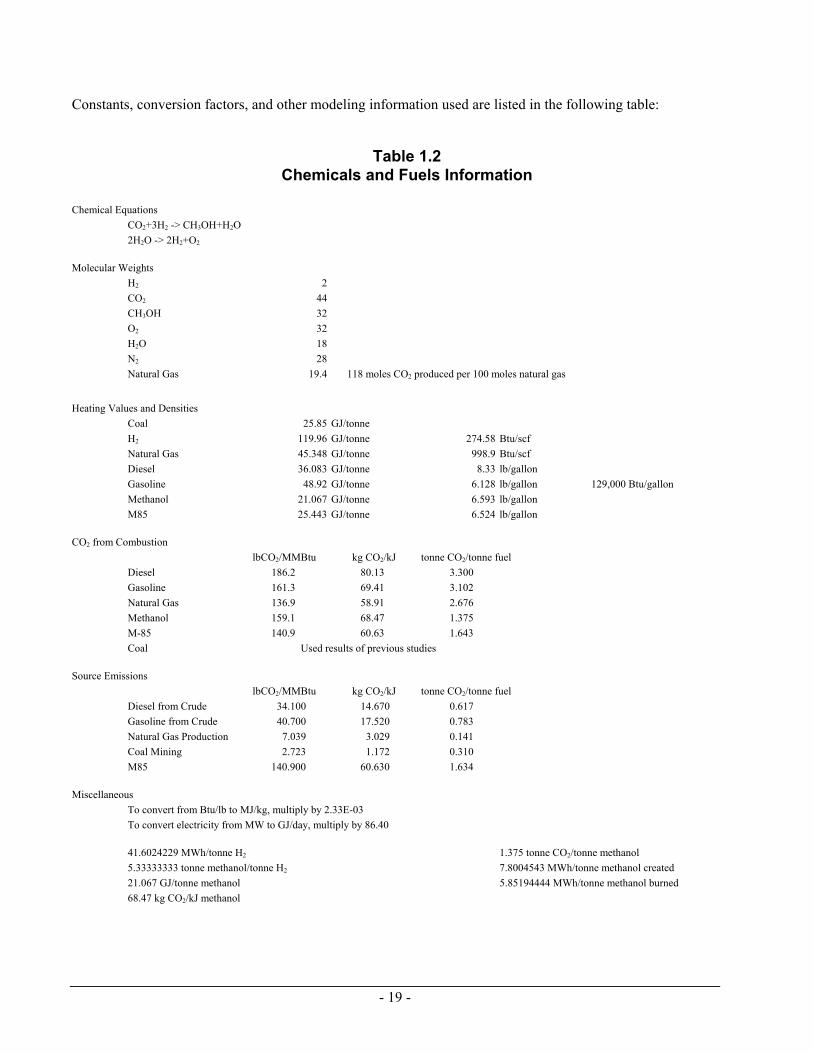
Constants, conversion factors, and other modeling information used are listed in the following table:
Table 1.2 Chemicals and Fuels Information
Chemical Equations
CO2+3H2 -> CH3OH+H2O 2H2O -> 2H2+O2
Molecular Weights H2 2 CO2 44 CH3OH 32 O2 32 H2O 18 N2 28 Natural Gas 19.4 118 moles CO2 produced per 100 moles natural gas
Heating Values and Densities Coal 25.85 GJ/tonne H2 119.96 GJ/tonne 274.58 Btu/scf Natural Gas 45.348 GJ/tonne 998.9 Btu/scf Diesel 36.083 GJ/tonne 8.33 lb/gallon Gasoline 48.92 GJ/tonne 6.128 lb/gallon 129,000 Btu/gallon Methanol 21.067 GJ/tonne 6.593 lb/gallon M85 25.443 GJ/tonne 6.524 lb/gallon
CO2 from Combustion lbCO2/MMBtu kg CO2/kJ tonne CO2/tonne fuel Diesel 186.2 80.13 3.300 Gasoline 161.3 69.41 3.102 Natural Gas 136.9 58.91 2.676 Methanol 159.1 68.47 1.375 M-85 140.9 60.63 1.643 Coal Used results of previous studies
Source Emissions lbCO2/MMBtu kg CO2/kJ tonne CO2/tonne fuel
Diesel from Crude 34.100 14.670 0.617 Gasoline from Crude 40.700 17.520 0.783 Natural Gas Production 7.039 3.029 0.141 Coal Mining 2.723 1.172 0.310 M85 140.900 60.630 1.634
Miscellaneous
To convert from Btu/lb to MJ/kg, multiply by 2.33E-03 To convert electricity from MW to GJ/day, multiply by 86.40 41.6024229 MWh/tonne H2 1.375 tonne CO2/tonne methanol 5.33333333 tonne methanol/tonne H2 7.8004543 MWh/tonne methanol created 21.067 GJ/tonne methanol 5.85194444 MWh/tonne methanol burned 68.47 kg CO2/kJ methanol
- 19 -
Although not intended for general use, the model has been submitted to the IEA for its use with a set of instructions. The model was not developed to a finished state. For example, the varying distance routine was not added because of the results obtained; see Section 2. 1.3 IEA Standard Study Criteria It is necessary to ensure that IEA studies are conducted using a common set of technical and financial conventions so as to ensure comparability and facilitate the selection of appropriate technologies for detailed assessment as integrated systems. Criteria have been established by the IEA that contain technical and financial factors likely to be required for appraisal studies. The Appendix contains the IEA Standard Technical and Financial Study Criteria used in this and previous studies for the Greenhouse Gas R&D Programme. Primarily, the IEA Study Criteria were used for the conceptual design of electric power plants that were used in this study.
- 20 -
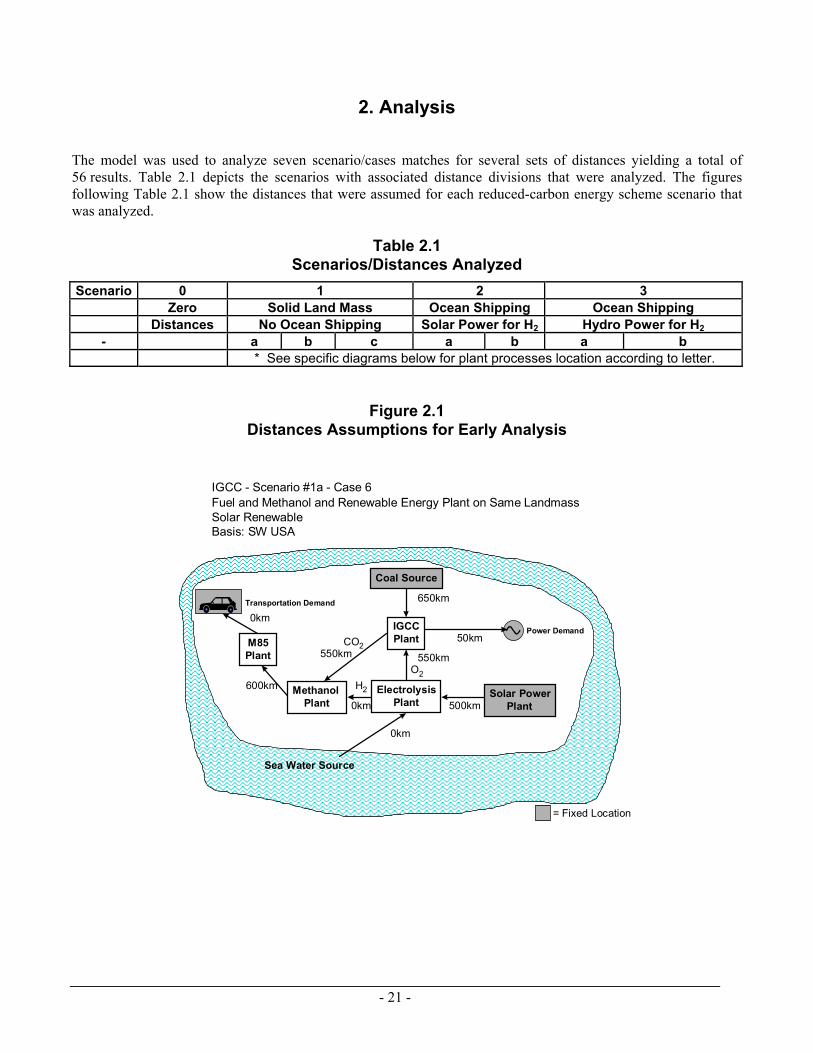
2. Analysis The model was used to analyze seven scenario/cases matches for several sets of distances yielding a total of 56 results. Table 2.1 depicts the scenarios with associated distance divisions that were analyzed. The figures following Table 2.1 show the distances that were assumed for each reduced-carbon energy scheme scenario that was analyzed.
Table 2.1 Scenarios/Distances Analyzed
Scenario 0 1 2 3 Zero Solid Land Mass Ocean Shipping Ocean Shipping Distances No Ocean Shipping Solar Power for H2 Hydro Power for H2
- a b c a b a b * See specific diagrams below for plant processes location according to letter.
Figure 2.1 Distances Assumptions for Early Analysis
IGCC - Scenario #1a - Case 6Fuel and Methanol and Renewable Energy Plant on Same LandmassSolar RenewableBasis: SW USA
Solar PowerPlant
Sea Water Source
= Fixed Location
Power Demand
Transportation Demand
IGCCPlantM85
Plant
MethanolPlant
ElectrolysisPlant
Coal Source
O2H2
CO2
650km
50km
550km
500km
0km
0km
600km
0km
550km
- 21 -
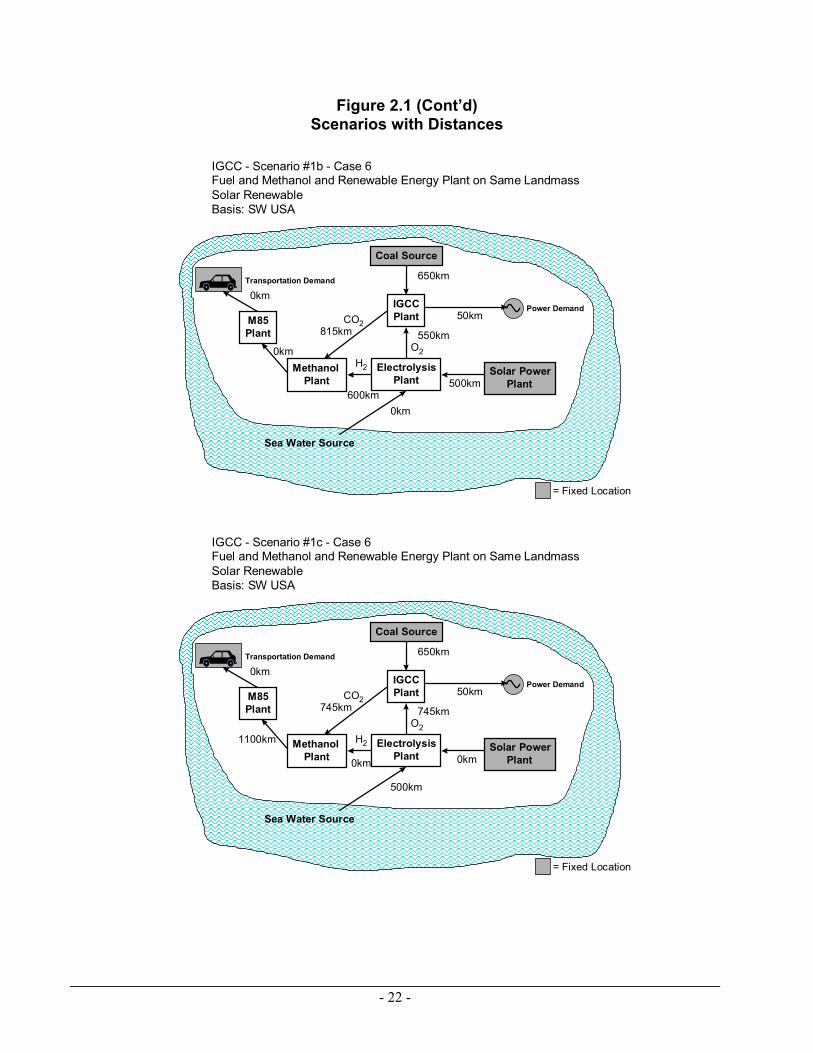
Figure 2.1 (Cont’d) Scenarios with Distances
IGCC - Scenario #1b - Case 6Fuel and Methanol and Renewable Energy Plant on Same LandmassSolar RenewableBasis: SW USA
Solar PowerPlant
Sea Water Source
= Fixed Location
Power Demand
Transportation Demand
IGCCPlantM85
Plant
MethanolPlant
ElectrolysisPlant
Coal Source
O2H2
CO2
650km
50km
550km
500km
0km
0km
600km
0km
815km
IGCC - Scenario #1c - Case 6Fuel and Methanol and Renewable Energy Plant on Same LandmassSolar RenewableBasis: SW USA
Solar PowerPlant
Sea Water Source
= Fixed Location
Power Demand
Transportation Demand
IGCCPlantM85
Plant
MethanolPlant
ElectrolysisPlant
Coal Source
O2H2
CO2
650km
50km
745km
0km
500km
1100km
0km
745km
0km
- 22 -
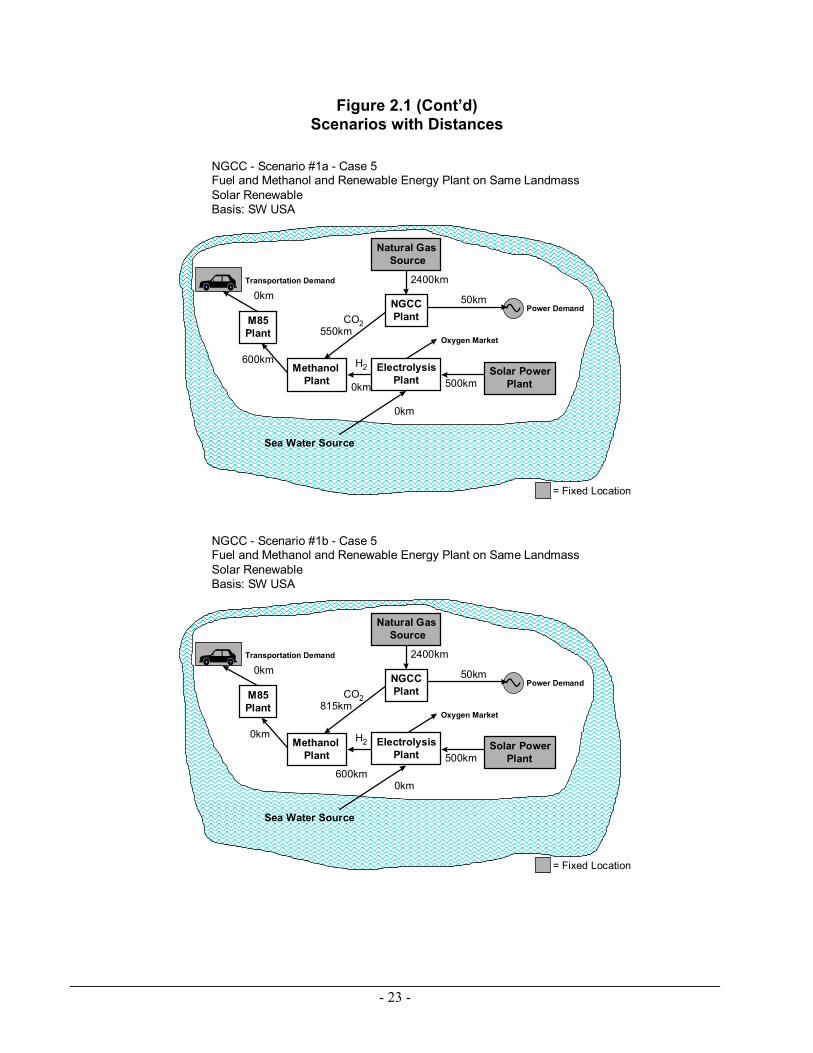
Figure 2.1 (Cont’d) Scenarios with Distances
NGCC - Scenario #1a - Case 5Fuel and Methanol and Renewable Energy Plant on Same LandmassSolar RenewableBasis: SW USA
Solar PowerPlant
Sea Water Source
= Fixed Location
Power Demand
Transportation Demand
Oxygen Market
NGCCPlantM85
Plant
MethanolPlant
ElectrolysisPlant
Natural Gas Source
CO2
H2
2400km
50km
500km
0km
0km
600km
0km
550km
NGCC - Scenario #1b - Case 5Fuel and Methanol and Renewable Energy Plant on Same LandmassSolar RenewableBasis: SW USA
Solar PowerPlant
Sea Water Source
= Fixed Location
Power Demand
Transportation Demand
Oxygen Market
NGCCPlantM85
Plant
MethanolPlant
ElectrolysisPlant
Natural Gas Source
CO2
H2
2400km
50km
500km
0km
0km
600km
0km
815km
- 23 -

Figure 2.1 (Cont’d) Scenarios with Distances
NGCC - Scenario #1c - Case 5Fuel and Methanol and Renewable Energy Plant on Same LandmassSolar RenewableBasis: SW USA
Solar PowerPlant
Sea Water Source
= Fixed Location
Power Demand
Transportation Demand
Oxygen Market
NGCCPlantM85
Plant
MethanolPlant
ElectrolysisPlant
Natural Gas Source
CO2
H2
2400km
50km
0km
500km
0km
1100km
0km
745km
IGCC - Scenario #2a - Case 6Power and M85 Usage on Same Landmass with Solar Renewableon Separate Land MassBasis: Australia Coal to Japan with Indonesia Solar
Sea Water
= Fixed Location
Power Demand
Transportation Demand
Ocean
Oxygen Market
Coal Source
IGCCPlant
M85Plant
MethanolPlant
ElectrolysisPlant
Solar PowerPlant
CO2
H2
4800km
100km 0km0km 7200km
50km0km
- 24 -
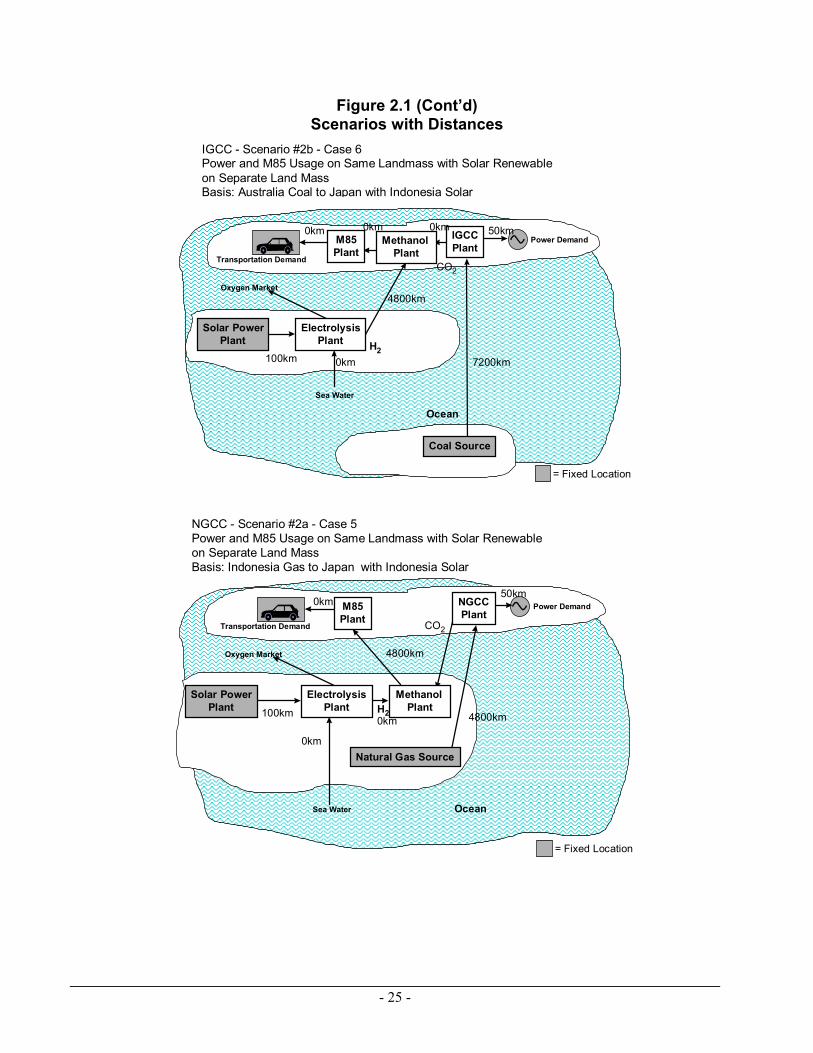
Figure 2.1 (Cont’d) Scenarios with Distances
IGCC - Scenario #2b - Case 6Power and M85 Usage on Same Landmass with Solar Renewableon Separate Land MassBasis: Australia Coal to Japan with Indonesia Solar
Sea Water
= Fixed Location
Power Demand
Transportation Demand
Ocean
Oxygen Market
Coal Source
IGCCPlant
M85Plant
MethanolPlant
ElectrolysisPlant
Solar PowerPlant
CO2
H2
4800km
100km
0km
0km 7200km
50km0km 0km
NGCC - Scenario #2a - Case 5Power and M85 Usage on Same Landmass with Solar Renewableon Separate Land MassBasis: Indonesia Gas to Japan with Indonesia Solar
= Fixed Location
Power Demand
Transportation Demand
Ocean
Oxygen Market
Natural Gas Source
NGCCPlant
M85Plant
MethanolPlant
ElectrolysisPlant
Solar PowerPlant
CO2
H2
4800km
50km0km
100km
Sea Water
0km
0km 4800km
- 25 -
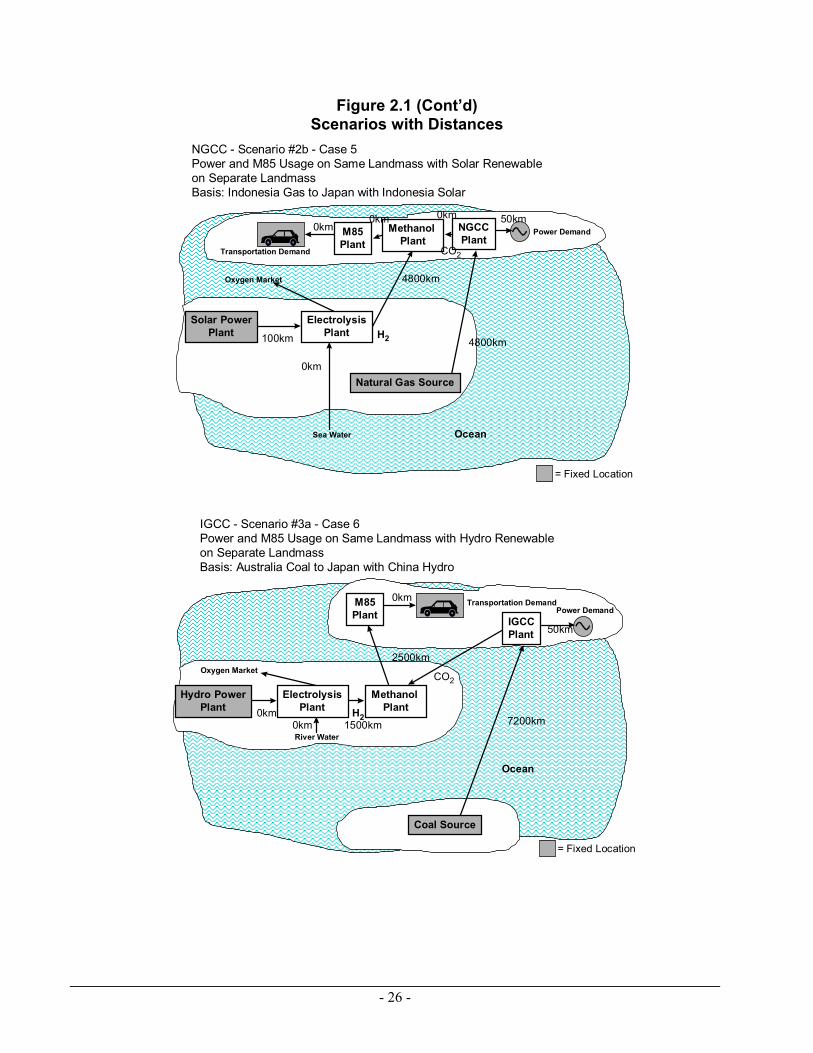
Figure 2.1 (Cont’d) Scenarios with Distances
NGCC - Scenario #2b - Case 5Power and M85 Usage on Same Landmass with Solar Renewableon Separate LandmassBasis: Indonesia Gas to Japan with Indonesia Solar
= Fixed Location
Power Demand
Transportation Demand
Ocean
Oxygen Market
Natural Gas Source
NGCCPlant
M85Plant
MethanolPlant
ElectrolysisPlant
Solar PowerPlant
CO2
H2
4800km
50km0km
100km
Sea Water
0km
0km
4800km
0km
IGCC - Scenario #3a - Case 6Power and M85 Usage on Same Landmass with Hydro Renewableon Separate LandmassBasis: Australia Coal to Japan with China Hydro
River Water
= Fixed Location
Power DemandTransportation Demand
Ocean
Oxygen Market
Coal Source
IGCCPlant
M85Plant
MethanolPlant
ElectrolysisPlant
Hydro PowerPlant
CO2
H21500km
0km0km
2500km
50km
0km
7200km
- 26 -
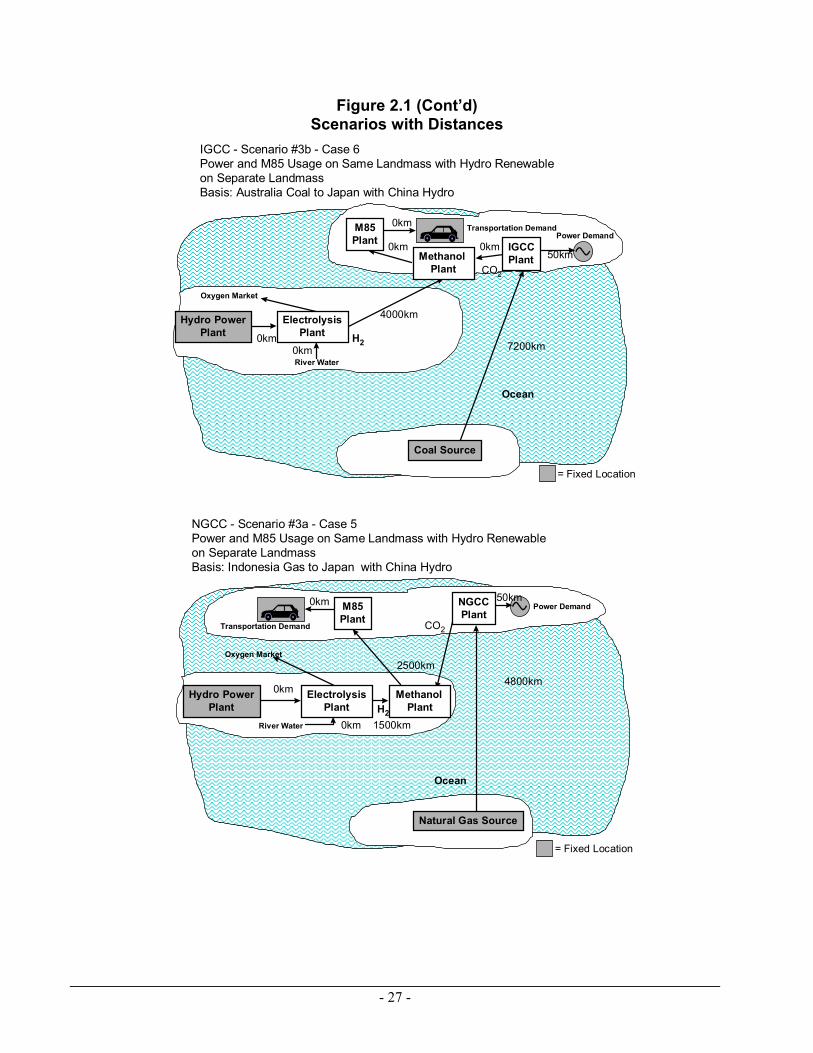
Figure 2.1 (Cont’d) Scenarios with Distances
IGCC - Scenario #3b - Case 6Power and M85 Usage on Same Landmass with Hydro Renewableon Separate LandmassBasis: Australia Coal to Japan with China Hydro
River Water
= Fixed Location
Power DemandTransportation Demand
Ocean
Oxygen Market
Coal Source
IGCCPlant
M85Plant
MethanolPlant
ElectrolysisPlant
Hydro PowerPlant
CO2
H20km0km
4000km
50km
0km
7200km
0km0km
NGCC - Scenario #3a - Case 5Power and M85 Usage on Same Landmass with Hydro Renewableon Separate LandmassBasis: Indonesia Gas to Japan with China Hydro
River Water
= Fixed Location
Power Demand
Transportation Demand
Ocean
Oxygen Market
Natural Gas Source
NGCCPlant
M85Plant
MethanolPlant
ElectrolysisPlant
Hydro PowerPlant
CO2
H2
4800km2500km
0km 50km
0km
0km 1500km
- 27 -
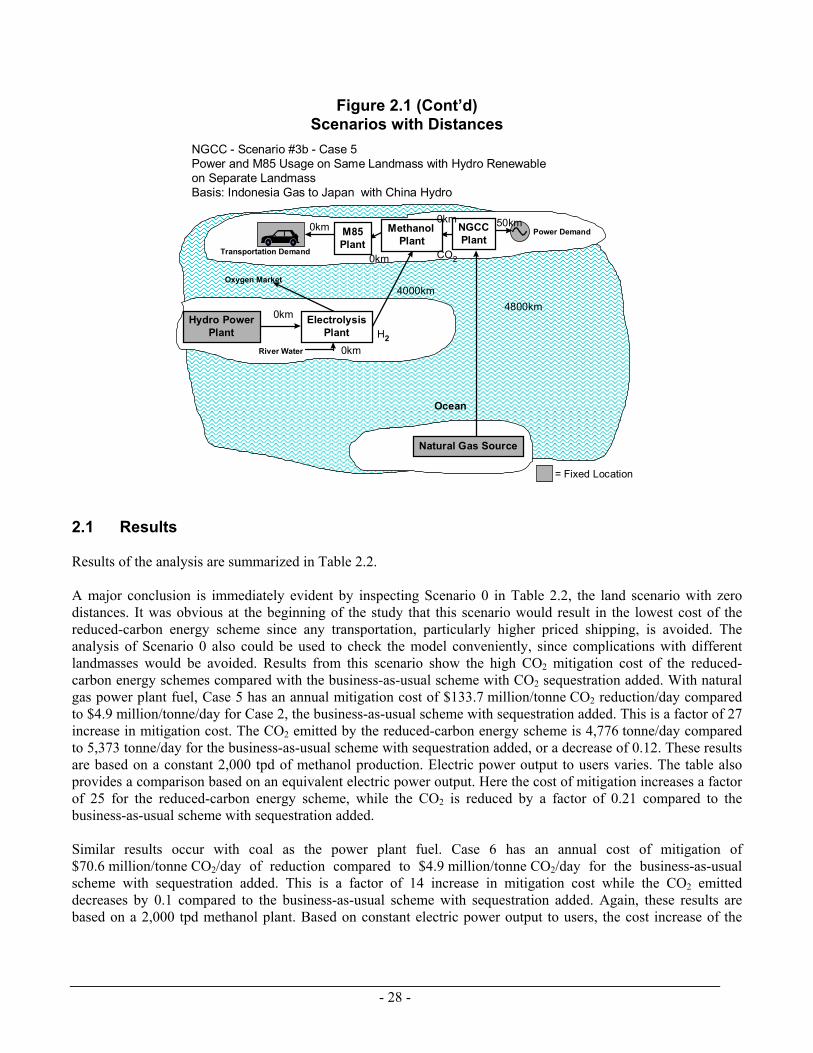
Figure 2.1 (Cont’d) Scenarios with Distances
NGCC - Scenario #3b - Case 5Power and M85 Usage on Same Landmass with Hydro Renewableon Separate LandmassBasis: Indonesia Gas to Japan with China Hydro
River Water
= Fixed Location
Power Demand
Transportation Demand
Ocean
Oxygen Market
Natural Gas Source
NGCCPlant
M85Plant
MethanolPlant
ElectrolysisPlant
Hydro PowerPlant
CO2
H2
4800km4000km
0km 50km
0km
0km
0km
0km
2.1 Results Results of the analysis are summarized in Table 2.2. A major conclusion is immediately evident by inspecting Scenario 0 in Table 2.2, the land scenario with zero distances. It was obvious at the beginning of the study that this scenario would result in the lowest cost of the reduced-carbon energy scheme since any transportation, particularly higher priced shipping, is avoided. The analysis of Scenario 0 also could be used to check the model conveniently, since complications with different landmasses would be avoided. Results from this scenario show the high CO2 mitigation cost of the reduced-carbon energy schemes compared with the business-as-usual scheme with CO2 sequestration added. With natural gas power plant fuel, Case 5 has an annual mitigation cost of $133.7 million/tonne CO2 reduction/day compared to $4.9 million/tonne/day for Case 2, the business-as-usual scheme with sequestration added. This is a factor of 27 increase in mitigation cost. The CO2 emitted by the reduced-carbon energy scheme is 4,776 tonne/day compared to 5,373 tonne/day for the business-as-usual scheme with sequestration added, or a decrease of 0.12. These results are based on a constant 2,000 tpd of methanol production. Electric power output to users varies. The table also provides a comparison based on an equivalent electric power output. Here the cost of mitigation increases a factor of 25 for the reduced-carbon energy scheme, while the CO2 is reduced by a factor of 0.21 compared to the business-as-usual scheme with sequestration added. Similar results occur with coal as the power plant fuel. Case 6 has an annual cost of mitigation of $70.6 million/tonne CO2/day of reduction compared to $4.9 million/tonne CO2/day for the business-as-usual scheme with sequestration added. This is a factor of 14 increase in mitigation cost while the CO2 emitted decreases by 0.1 compared to the business-as-usual scheme with sequestration added. Again, these results are based on a 2,000 tpd methanol plant. Based on constant electric power output to users, the cost increase of the
- 28 -
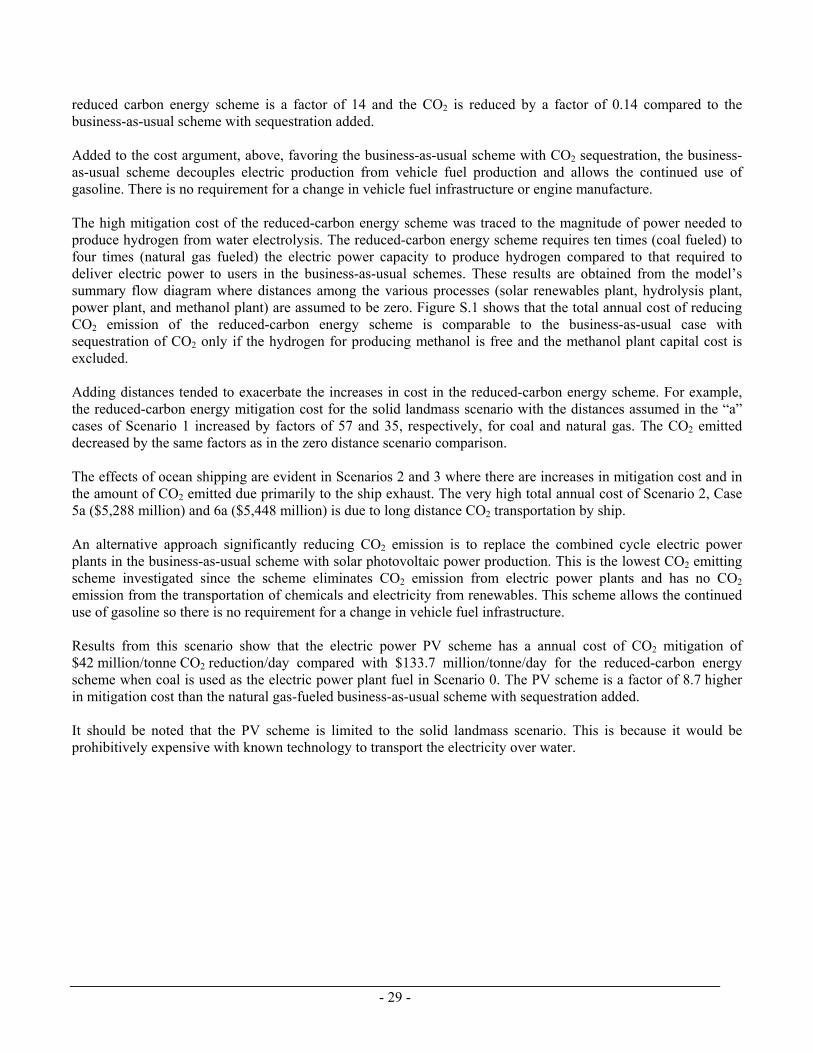
reduced carbon energy scheme is a factor of 14 and the CO2 is reduced by a factor of 0.14 compared to the business-as-usual scheme with sequestration added. Added to the cost argument, above, favoring the business-as-usual scheme with CO2 sequestration, the business-as-usual scheme decouples electric production from vehicle fuel production and allows the continued use of gasoline. There is no requirement for a change in vehicle fuel infrastructure or engine manufacture. The high mitigation cost of the reduced-carbon energy scheme was traced to the magnitude of power needed to produce hydrogen from water electrolysis. The reduced-carbon energy scheme requires ten times (coal fueled) to four times (natural gas fueled) the electric power capacity to produce hydrogen compared to that required to deliver electric power to users in the business-as-usual schemes. These results are obtained from the model’s summary flow diagram where distances among the various processes (solar renewables plant, hydrolysis plant, power plant, and methanol plant) are assumed to be zero. Figure S.1 shows that the total annual cost of reducing CO2 emission of the reduced-carbon energy scheme is comparable to the business-as-usual case with sequestration of CO2 only if the hydrogen for producing methanol is free and the methanol plant capital cost is excluded. Adding distances tended to exacerbate the increases in cost in the reduced-carbon energy scheme. For example, the reduced-carbon energy mitigation cost for the solid landmass scenario with the distances assumed in the “a” cases of Scenario 1 increased by factors of 57 and 35, respectively, for coal and natural gas. The CO2 emitted decreased by the same factors as in the zero distance scenario comparison. The effects of ocean shipping are evident in Scenarios 2 and 3 where there are increases in mitigation cost and in the amount of CO2 emitted due primarily to the ship exhaust. The very high total annual cost of Scenario 2, Case 5a ($5,288 million) and 6a ($5,448 million) is due to long distance CO2 transportation by ship. An alternative approach significantly reducing CO2 emission is to replace the combined cycle electric power plants in the business-as-usual scheme with solar photovoltaic power production. This is the lowest CO2 emitting scheme investigated since the scheme eliminates CO2 emission from electric power plants and has no CO2 emission from the transportation of chemicals and electricity from renewables. This scheme allows the continued use of gasoline so there is no requirement for a change in vehicle fuel infrastructure. Results from this scenario show that the electric power PV scheme has a annual cost of CO2 mitigation of $42 million/tonne CO2 reduction/day compared with $133.7 million/tonne/day for the reduced-carbon energy scheme when coal is used as the electric power plant fuel in Scenario 0. The PV scheme is a factor of 8.7 higher in mitigation cost than the natural gas-fueled business-as-usual scheme with sequestration added. It should be noted that the PV scheme is limited to the solid landmass scenario. This is because it would be prohibitively expensive with known technology to transport the electricity over water.
- 29 -
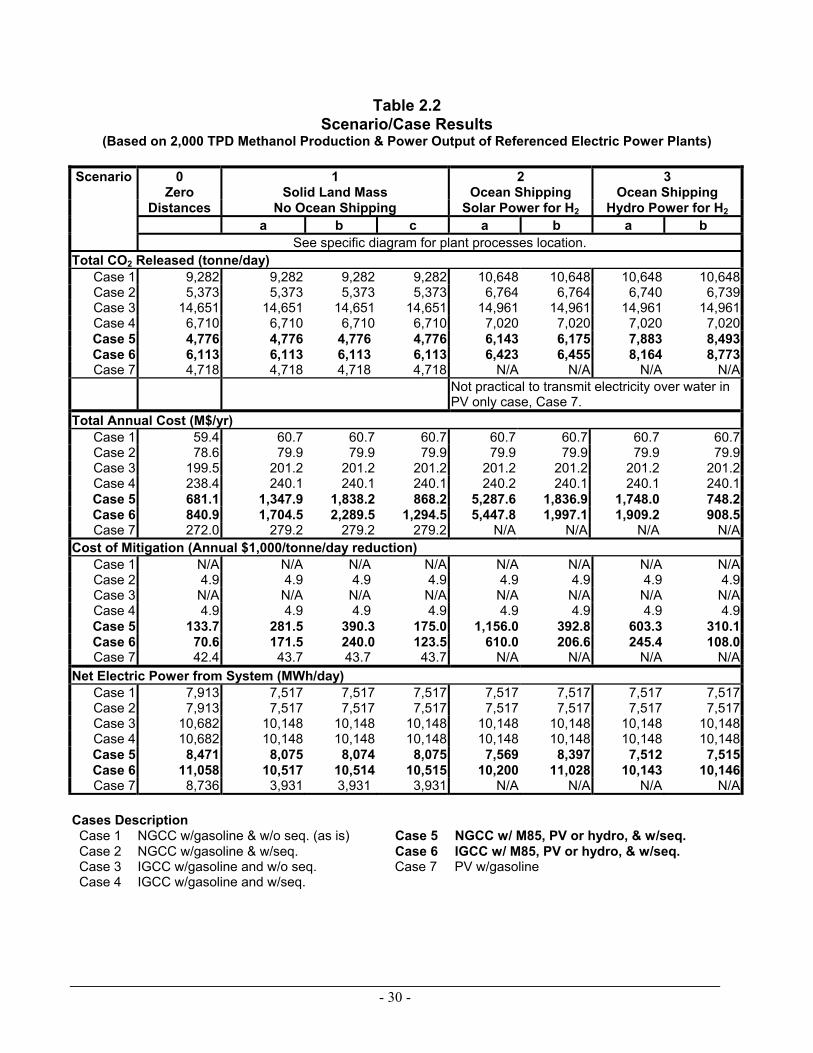
Table 2.2 Scenario/Case Results
(Based on 2,000 TPD Methanol Production & Power Output of Referenced Electric Power Plants) Scenario 0 1 2 3
Zero Solid Land Mass Ocean Shipping Ocean Shipping Distances No Ocean Shipping Solar Power for H2 Hydro Power for H2
a b c a b a b See specific diagram for plant processes location.
Total CO2 Released (tonne/day) Case 1 9,282 9,282 9,282 9,282 10,648 10,648 10,648 10,648Case 2 5,373 5,373 5,373 5,373 6,764 6,764 6,740 6,739Case 3 14,651 14,651 14,651 14,651 14,961 14,961 14,961 14,961Case 4 6,710 6,710 6,710 6,710 7,020 7,020 7,020 7,020Case 5 4,776 4,776 4,776 4,776 6,143 6,175 7,883 8,493Case 6 6,113 6,113 6,113 6,113 6,423 6,455 8,164 8,773Case 7 4,718 4,718 4,718 4,718 N/A N/A N/A N/A
Not practical to transmit electricity over water in PV only case, Case 7.
Total Annual Cost (M$/yr) Case 1 59.4 60.7 60.7 60.7 60.7 60.7 60.7 60.7Case 2 78.6 79.9 79.9 79.9 79.9 79.9 79.9 79.9Case 3 199.5 201.2 201.2 201.2 201.2 201.2 201.2 201.2Case 4 238.4 240.1 240.1 240.1 240.2 240.1 240.1 240.1Case 5 681.1 1,347.9 1,838.2 868.2 5,287.6 1,836.9 1,748.0 748.2Case 6 840.9 1,704.5 2,289.5 1,294.5 5,447.8 1,997.1 1,909.2 908.5Case 7 272.0 279.2 279.2 279.2 N/A N/A N/A N/A
Cost of Mitigation (Annual $1,000/tonne/day reduction) Case 1 N/A N/A N/A N/A N/A N/A N/A N/ACase 2 4.9 4.9 4.9 4.9 4.9 4.9 4.9 4.9Case 3 N/A N/A N/A N/A N/A N/A N/A N/ACase 4 4.9 4.9 4.9 4.9 4.9 4.9 4.9 4.9Case 5 133.7 281.5 390.3 175.0 1,156.0 392.8 603.3 310.1Case 6 70.6 171.5 240.0 123.5 610.0 206.6 245.4 108.0Case 7 42.4 43.7 43.7 43.7 N/A N/A N/A N/A
Net Electric Power from System (MWh/day) Case 1 7,913 7,517 7,517 7,517 7,517 7,517 7,517 7,517Case 2 7,913 7,517 7,517 7,517 7,517 7,517 7,517 7,517Case 3 10,682 10,148 10,148 10,148 10,148 10,148 10,148 10,148Case 4 10,682 10,148 10,148 10,148 10,148 10,148 10,148 10,148Case 5 8,471 8,075 8,074 8,075 7,569 8,397 7,512 7,515Case 6 11,058 10,517 10,514 10,515 10,200 11,028 10,143 10,146Case 7 8,736 3,931 3,931 3,931 N/A N/A N/A N/A
Cases Description Case 1 NGCC w/gasoline & w/o seq. (as is) Case 5 NGCC w/ M85, PV or hydro, & w/seq. Case 2 NGCC w/gasoline & w/seq. Case 6 IGCC w/ M85, PV or hydro, & w/seq. Case 3 IGCC w/gasoline and w/o seq. Case 7 PV w/gasoline Case 4 IGCC w/gasoline and w/seq.
- 30 -
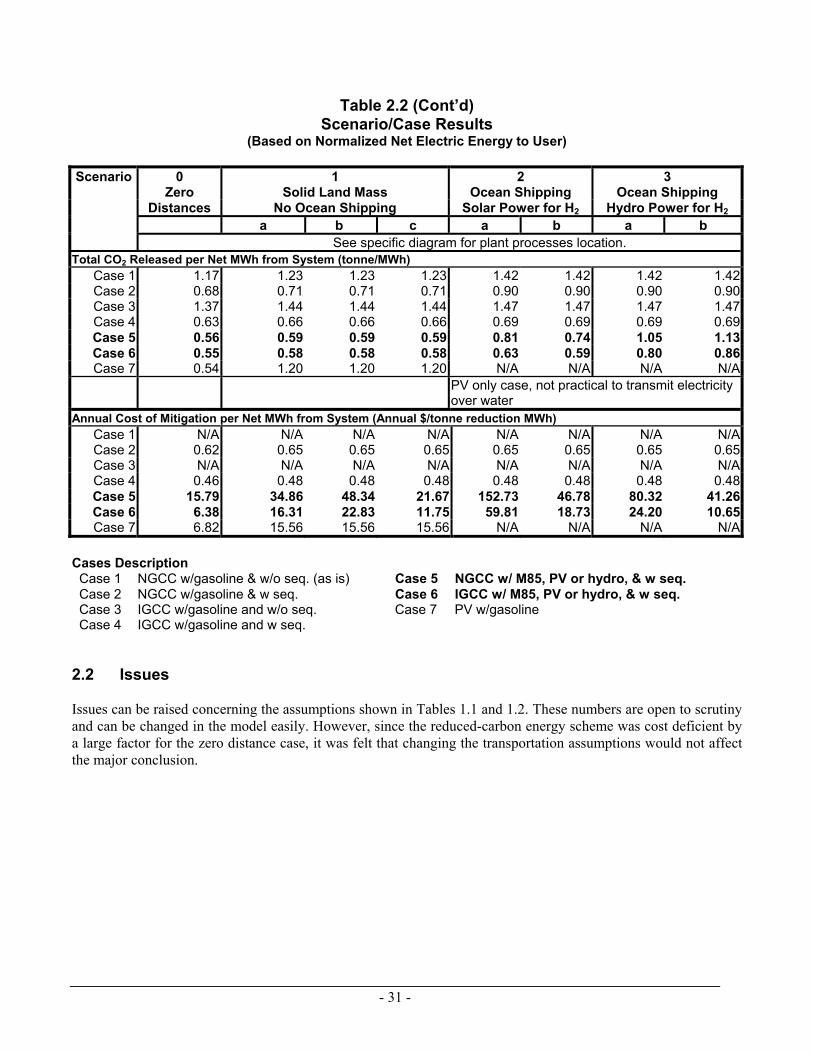
Table 2.2 (Cont’d) Scenario/Case Results
(Based on Normalized Net Electric Energy to User) Scenario 0 1 2 3
Zero Solid Land Mass Ocean Shipping Ocean Shipping Distances No Ocean Shipping Solar Power for H2 Hydro Power for H2
a b c a b a b See specific diagram for plant processes location.
Total CO2 Released per Net MWh from System (tonne/MWh) Case 1 1.17 1.23 1.23 1.23 1.42 1.42 1.42 1.42Case 2 0.68 0.71 0.71 0.71 0.90 0.90 0.90 0.90Case 3 1.37 1.44 1.44 1.44 1.47 1.47 1.47 1.47Case 4 0.63 0.66 0.66 0.66 0.69 0.69 0.69 0.69Case 5 0.56 0.59 0.59 0.59 0.81 0.74 1.05 1.13Case 6 0.55 0.58 0.58 0.58 0.63 0.59 0.80 0.86Case 7 0.54 1.20 1.20 1.20 N/A N/A N/A N/A
PV only case, not practical to transmit electricity over water
Annual Cost of Mitigation per Net MWh from System (Annual $/tonne reduction MWh) Case 1 N/A N/A N/A N/A N/A N/A N/A N/ACase 2 0.62 0.65 0.65 0.65 0.65 0.65 0.65 0.65Case 3 N/A N/A N/A N/A N/A N/A N/A N/ACase 4 0.46 0.48 0.48 0.48 0.48 0.48 0.48 0.48Case 5 15.79 34.86 48.34 21.67 152.73 46.78 80.32 41.26Case 6 6.38 16.31 22.83 11.75 59.81 18.73 24.20 10.65Case 7 6.82 15.56 15.56 15.56 N/A N/A N/A N/A
Cases Description Case 1 NGCC w/gasoline & w/o seq. (as is) Case 5 NGCC w/ M85, PV or hydro, & w seq. Case 2 NGCC w/gasoline & w seq. Case 6 IGCC w/ M85, PV or hydro, & w seq. Case 3 IGCC w/gasoline and w/o seq. Case 7 PV w/gasoline Case 4 IGCC w/gasoline and w seq. 2.2 Issues Issues can be raised concerning the assumptions shown in Tables 1.1 and 1.2. These numbers are open to scrutiny and can be changed in the model easily. However, since the reduced-carbon energy scheme was cost deficient by a large factor for the zero distance case, it was felt that changing the transportation assumptions would not affect the major conclusion.
- 31 -
3. Independent Assessment of M85 Fuel for Transportation In most industrialized countries around the world, the demand for petroleum significantly exceeds its daily production. In general, countries experiencing such a dependence on foreign oil have both significant energy security and economic concerns. The U.S., for example, has experienced three major energy security crises (1973, 1979, and 1990) within the past twenty-five years, and current estimates indicate that the domestic oil supply-and-demand gap contributes between 40 to 50 billion dollars annually to the national deficit.1 Furthermore, the global community is unilaterally faced with the task of abating the deleterious health and environmental effects associated with emissions from internal combustion engine vehicles (ICEV) operating on gasoline. As these drawbacks become increasingly relevant alternative fuels, which are potentially renewable, cost-effective, and cleaner sources of energy, are receiving more attention as viable options to replace conventional gasoline. The alternative fuels that are commonly being studied today are methanol, ethanol, compressed natural gas (CNG), liquified propane gas (LPG), reformulated gasoline (RFG), and electricity. This section focuses on the use of methanol as an alternative fuel; however, where appropriate other alternative fuels are mentioned as a source of comparison. 3.1 Legislation and Demonstration Programs In an attempt to lessen dependence on foreign oil and to stimulate the development of cleaner vehicle technologies, numerous governments around the world have enacted legislation and demonstration programs to encourage the use of alternative fuels in transportation applications. In Japan, for instance, the Petroleum Energy Center (PEC) and the Ministry of International Trade and Industry’s (MITI) Natural Resources and Energy Agency are driving the development of alternative fuel vehicles (AFVs), particularly methanol fueled diesel engines. China has a similar program for the development of methanol fueled engines for buses. Brazil has an extensive alternative fuel program dating back to the early 1970’s. This program is designed to promote the use of ethanol, which can be readily produced from the country’s abundant agricultural resources. The U.S. has also enacted legislation, through the National Energy Policy Act (EPAct, 1992), in which the U.S. Department of Energy (DOE) is required to establish a program that promotes the replacement of petroleum-based motor fuels. The current goal is to replace at least 10 percent # of motor fuels with alternative fuels by the year 2000 and 30 percent by the year 2010. Through these programs several demonstration projects have been spawned to identify the benefits and constraints of current AFV technologies. In China, methanol fueled passenger buses are running on the Taiyuan-Yuci Highway in Shanxi. These buses have been developed in a joint collaboration among Datong Automobile Factory, the Institute of Engineering Thermophysics of the Chinese Academy of Sciences, and Ford Motor Company. In the U.S., an extensive study of alternative fuel buses has also taken place.2 The results of this study have shown that, once problems associated with fuel quality, supply, and storage (see below) are resolved, methanol fueled engines could be amenable to city bus operation. Similar studies have compared the current state-of-the-art AFV passenger cars with analogous gasoline models.3,4 With respect to methanol AFVs, these studies have shown the emissions benefits of methanol combustion (see below); however, they have also identified vehicle hesitation and stalling at idle as performance issues to be improved upon in the next generation of methanol AFVs.
# Percentages based on an energy equivalent basis.
- 32 -
3.2 Advantages of Methanol Fueled Vehicles Interest in methanol as an ICEV fuel dates back to the invention of the automobile, when methanol was used as a fuel because of its superior anti-knock characteristics. Eventually, methanol was displaced by gasoline, which was abundantly available. In recent years, methanol has been used extensively in the automotive industry as a component necessary for methyl tertiary butyl ether (MTBE), a component used in reformulated gasoline (RFG). Aside from this demand for methanol, there is also significant interest in methanol as an alternative to gasoline and Diesel fuel in both personal and larger vehicles (e.g., construction equipment, buses, and trucks). This interest is primarily a result of the following:
• Methanol can be made from both non-renewable and renewable sources. • The combined chemical composition (CH3OH) and physical properties of methanol results in reduced
emissions relative to dedicated gasoline engines. • Methanol can be mixed with gasoline in specially equipped flexible fuel vehicles (FFVs) to ensure a readily
available fuel supply. • The properties of methanol fuel offer safety advantages over conventional gasoline blends. Each of these aspects of methanol as a transportation fuel is discussed in detail below. Sources of Methanol Fuel: Methanol is an attractive alternative to gasoline in many parts of the world because it can be made from a variety of readily available sources. Specifically, most of the methanol produced in the world today is derived from natural gas; however, it is possible to produce methanol from coal, wood, and biomass as well. Thus, although the cost-effective production of methanol may not be possible in localities scarce in natural gas as a resource, it could likely emerge as a viable energy source as these countries turn to methanol production from coal, wood, and/or biomass. Currently, the production of methanol AFVs from natural gas is expected to be most cost effective overseas, where unutilized natural gas is abundant.5 The fuel chain leading to the production of methanol has a distinct impact on both the energy efficiency and economy of methanol as an alternative fuel. Methanol derived from natural gas has a fuel chain efficiency of 61.5 percent, where this efficiency is based on a domestic gas source and is calculated as the percentage of the total fuel energy less the energy required to extract, process, refine, transport, and distribute the fuel. Methanol derived from coal has a fuel chain efficiency of 59.7 percent. As a source of comparison, the fuel chain efficiencies of other alternative fuels are listed in Table 3.1. As indicated in Table 3.1, the energy efficiency of the methanol fuel chain is substantially less than the efficiencies of the natural gas, diesel, and gasoline chains; however, it is also substantially greater than the efficiency of the ethanol fuel chain. In the near term, the majority of methanol used in vehicles would be produced from natural gas in world-scale plants, with a methanol production capacity of 2,500 metric tonnes per day (mtpd). If methanol use increases significantly in automotive applications, much larger plants, capable of 10,000 mtpd would be built.5
Table 3.1 Fuel Chain Energy Efficiency for Several Fuels (Ref ADL Report from Feb 1996)
Fuel Type Fuel Chain Energy Efficiency (%)
Natural Gas LPG 93.4 Petroleum Diesel 91.4 Petroleum LPG 89.2
Natural Gas CNG 86.6
- 33 -
Table 3.1 (Cont’d)
Fuel Chain Energy Efficiency for Several Fuels (Ref ADL Report from Feb 1996)
Petroleum Gasoline 84.1 Petroleum RFG 81.2
Natural Gas Hydrogen 71.1 Natural Gas Methanol 61.5
Coal Methanol 59.7 Coal Hydrogen 53.8
Biomass Ethanol 46.4 Coal Ethanol 38.6
Emissions from Methanol Vehicles: In recent years, one of the most important factors behind the interest in methanol as an alternative fuel is the reduction of emissions compared to a comparable gasoline or diesel fueled vehicle. In spark ignition engines, the combustion of M85 (85 percent methanol, 15 percent gasoline, see below) results in lower ozone forming potential (OFP), a small decrease in CO emissions, and minimal benzene and polycyclic aromatic hydrocarbons, and significantly increased formaldehyde emissions.7,8 In comparison to emissions from an engine fueled with RFG, blended with MTBE, significant reductions in OFP (40 percent to 50 percent), benzene and 1,3-butadiene along with increases in NOx and formaldehyde were observed.4 Specifically, high emissions of formaldehyde, a known carcinogen, have been observed during cold start of methanol fuelled vehicles. Since formaldehyde is effectively controlled by the catalysts when it is fully warmed-up, preheating of the catalyst with battery electricity is being explored as a means of reducing emissions of aldehydes.9 Used in diesel configurations, M85 fueled engines have been found to reduce NOx, CO, and particulate emissions relative to typical diesel engines, again with a slight increase in formaldehyde emissions.10 Automakers pursuing spark ignition M85 engines have successfully certified these types of engines according to the California Air Resources Board (CARB) standard for transitional low emissions vehicles (i.e., these vehicles produce 50 percent less smog-forming hydrocarbon emissions than those certified to the basic standard). Diesel engines burning M85 have also been certified to meet the stringent California urban bus emission standards (see e.g., Reference 11). Flexible Fuel Methanol Vehicles: Widespread acceptance of any alternative fuel for both passenger vehicle and commercial trucking applications is limited by the ready availability of the fuel (see below). Since methanol (and ethanol) can be mixed with gasoline to make combustible mixtures ranging from 100 percent alcohol (0 percent gasoline) to 0 percent alcohol (100 percent gasoline), many original equipment manufacturers (OEMs) are pursuing the development of vehicles capable of accepting such a range of fuel mixtures without degrading engine performance. Thus, these non-dedicated vehicles, commonly referred to as flexible fuel vehicles (FFVs), can be fueled with alcohol fuel in areas where these are available and with gasoline in other areas. In these vehicles, on-board sensors detect the fraction of alcohol in the tank. The engine calibration parameters are then adjusted accordingly, thus eliminating the need for manual monitoring of the fuel tank contents. Although FFVs of this type provide the operator with the necessary availability of fuel prior to the implementation of a well-established methanol distribution infrastructure, the advantages associated with alcohol fuel combustion diminish as these fuels are mixed with gasoline. Finally, it should be noted that FFVs currently being developed do not run on neat methanol but, instead, run on fuels with up to 85 percent methanol. This is done to ensure proper cold-start performance (see below). Methanol Safety: For years, methanol has been used as a racing fuel, in part because of its inherent safety characteristics. Under the same ambient conditions, methanol vapor is more difficult to ignite than gasoline
- 34 -
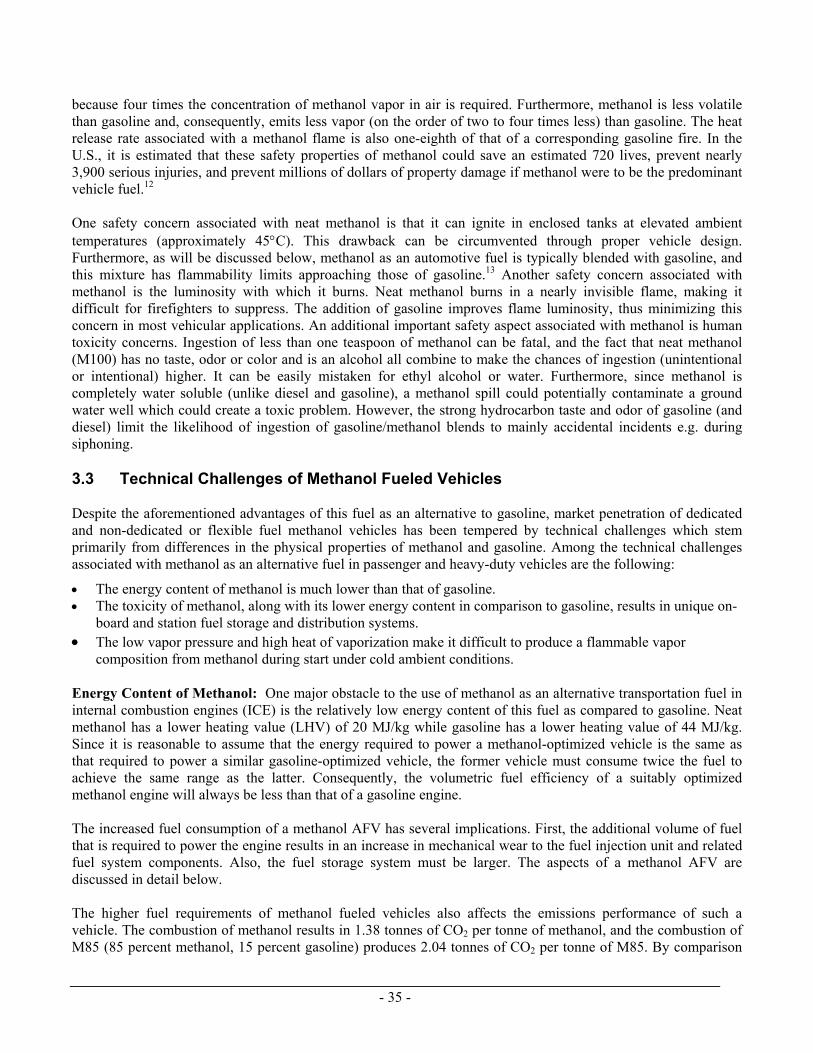
because four times the concentration of methanol vapor in air is required. Furthermore, methanol is less volatile than gasoline and, consequently, emits less vapor (on the order of two to four times less) than gasoline. The heat release rate associated with a methanol flame is also one-eighth of that of a corresponding gasoline fire. In the U.S., it is estimated that these safety properties of methanol could save an estimated 720 lives, prevent nearly 3,900 serious injuries, and prevent millions of dollars of property damage if methanol were to be the predominant vehicle fuel.12 One safety concern associated with neat methanol is that it can ignite in enclosed tanks at elevated ambient temperatures (approximately 45°C). This drawback can be circumvented through proper vehicle design. Furthermore, as will be discussed below, methanol as an automotive fuel is typically blended with gasoline, and this mixture has flammability limits approaching those of gasoline.13 Another safety concern associated with methanol is the luminosity with which it burns. Neat methanol burns in a nearly invisible flame, making it difficult for firefighters to suppress. The addition of gasoline improves flame luminosity, thus minimizing this concern in most vehicular applications. An additional important safety aspect associated with methanol is human toxicity concerns. Ingestion of less than one teaspoon of methanol can be fatal, and the fact that neat methanol (M100) has no taste, odor or color and is an alcohol all combine to make the chances of ingestion (unintentional or intentional) higher. It can be easily mistaken for ethyl alcohol or water. Furthermore, since methanol is completely water soluble (unlike diesel and gasoline), a methanol spill could potentially contaminate a ground water well which could create a toxic problem. However, the strong hydrocarbon taste and odor of gasoline (and diesel) limit the likelihood of ingestion of gasoline/methanol blends to mainly accidental incidents e.g. during siphoning. 3.3 Technical Challenges of Methanol Fueled Vehicles Despite the aforementioned advantages of this fuel as an alternative to gasoline, market penetration of dedicated and non-dedicated or flexible fuel methanol vehicles has been tempered by technical challenges which stem primarily from differences in the physical properties of methanol and gasoline. Among the technical challenges associated with methanol as an alternative fuel in passenger and heavy-duty vehicles are the following:
• The energy content of methanol is much lower than that of gasoline. • The toxicity of methanol, along with its lower energy content in comparison to gasoline, results in unique on-
board and station fuel storage and distribution systems. • The low vapor pressure and high heat of vaporization make it difficult to produce a flammable vapor
composition from methanol during start under cold ambient conditions. Energy Content of Methanol: One major obstacle to the use of methanol as an alternative transportation fuel in internal combustion engines (ICE) is the relatively low energy content of this fuel as compared to gasoline. Neat methanol has a lower heating value (LHV) of 20 MJ/kg while gasoline has a lower heating value of 44 MJ/kg. Since it is reasonable to assume that the energy required to power a methanol-optimized vehicle is the same as that required to power a similar gasoline-optimized vehicle, the former vehicle must consume twice the fuel to achieve the same range as the latter. Consequently, the volumetric fuel efficiency of a suitably optimized methanol engine will always be less than that of a gasoline engine. The increased fuel consumption of a methanol AFV has several implications. First, the additional volume of fuel that is required to power the engine results in an increase in mechanical wear to the fuel injection unit and related fuel system components. Also, the fuel storage system must be larger. The aspects of a methanol AFV are discussed in detail below. The higher fuel requirements of methanol fueled vehicles also affects the emissions performance of such a vehicle. The combustion of methanol results in 1.38 tonnes of CO2 per tonne of methanol, and the combustion of M85 (85 percent methanol, 15 percent gasoline) produces 2.04 tonnes of CO2 per tonne of M85. By comparison
- 35 -
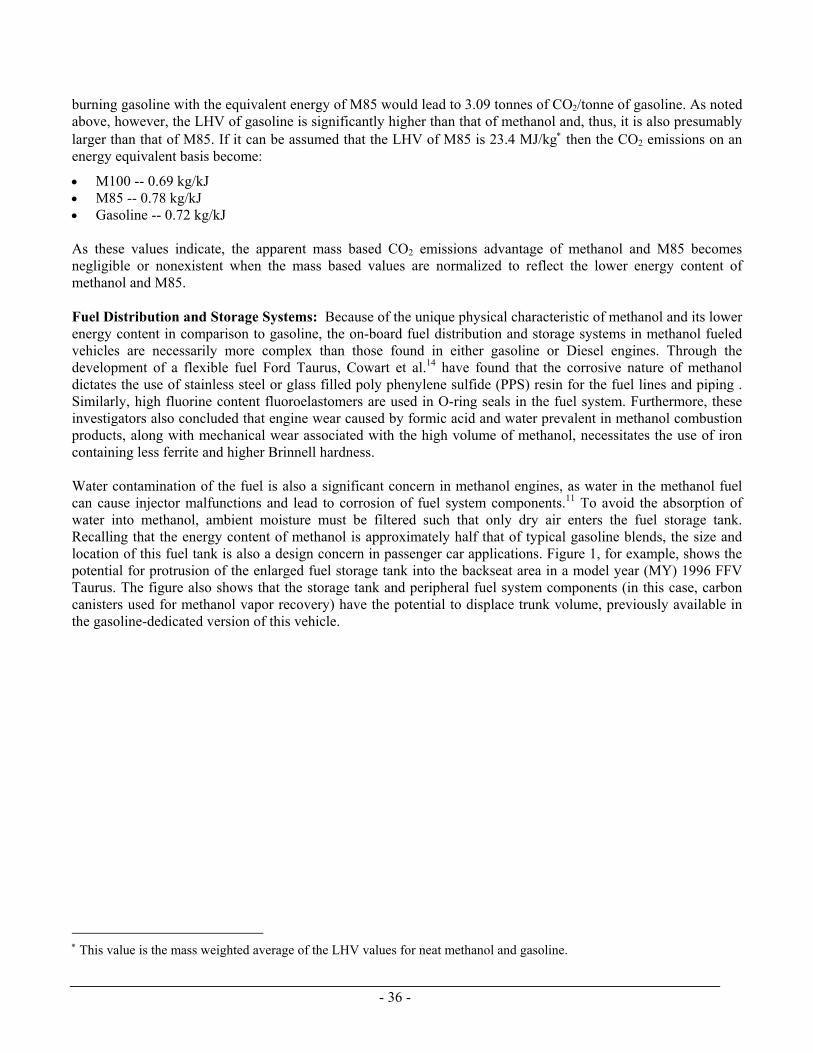
burning gasoline with the equivalent energy of M85 would lead to 3.09 tonnes of CO2/tonne of gasoline. As noted above, however, the LHV of gasoline is significantly higher than that of methanol and, thus, it is also presumably larger than that of M85. If it can be assumed that the LHV of M85 is 23.4 MJ/kg∗ then the CO2 emissions on an energy equivalent basis become:
• M100 -- 0.69 kg/kJ • M85 -- 0.78 kg/kJ • Gasoline -- 0.72 kg/kJ As these values indicate, the apparent mass based CO2 emissions advantage of methanol and M85 becomes negligible or nonexistent when the mass based values are normalized to reflect the lower energy content of methanol and M85. Fuel Distribution and Storage Systems: Because of the unique physical characteristic of methanol and its lower energy content in comparison to gasoline, the on-board fuel distribution and storage systems in methanol fueled vehicles are necessarily more complex than those found in either gasoline or Diesel engines. Through the development of a flexible fuel Ford Taurus, Cowart et al.14 have found that the corrosive nature of methanol dictates the use of stainless steel or glass filled poly phenylene sulfide (PPS) resin for the fuel lines and piping . Similarly, high fluorine content fluoroelastomers are used in O-ring seals in the fuel system. Furthermore, these investigators also concluded that engine wear caused by formic acid and water prevalent in methanol combustion products, along with mechanical wear associated with the high volume of methanol, necessitates the use of iron containing less ferrite and higher Brinnell hardness. Water contamination of the fuel is also a significant concern in methanol engines, as water in the methanol fuel can cause injector malfunctions and lead to corrosion of fuel system components.11 To avoid the absorption of water into methanol, ambient moisture must be filtered such that only dry air enters the fuel storage tank. Recalling that the energy content of methanol is approximately half that of typical gasoline blends, the size and location of this fuel tank is also a design concern in passenger car applications. Figure 1, for example, shows the potential for protrusion of the enlarged fuel storage tank into the backseat area in a model year (MY) 1996 FFV Taurus. The figure also shows that the storage tank and peripheral fuel system components (in this case, carbon canisters used for methanol vapor recovery) have the potential to displace trunk volume, previously available in the gasoline-dedicated version of this vehicle.
∗ This value is the mass weighted average of the LHV values for neat methanol and gasoline.
- 36 -
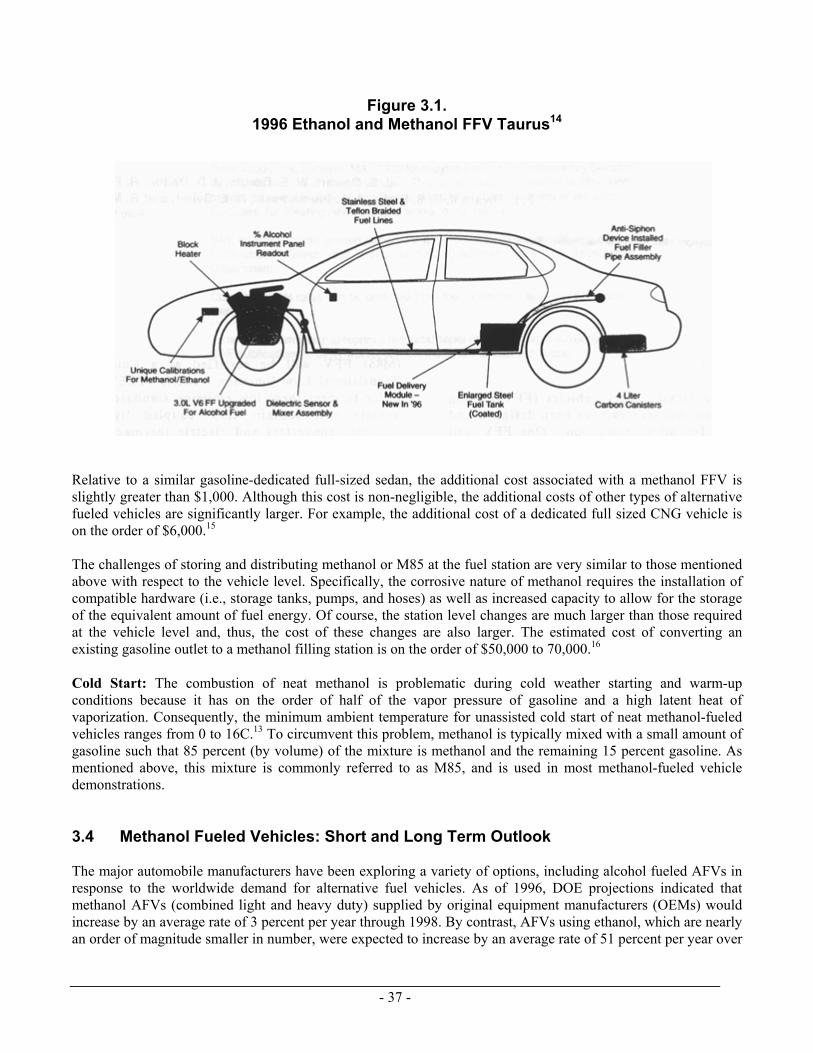
Figure 3.1. 1996 Ethanol and Methanol FFV Taurus14
Relative to a similar gasoline-dedicated full-sized sedan, the additional cost associated with a methanol FFV is slightly greater than $1,000. Although this cost is non-negligible, the additional costs of other types of alternative fueled vehicles are significantly larger. For example, the additional cost of a dedicated full sized CNG vehicle is on the order of $6,000.15 The challenges of storing and distributing methanol or M85 at the fuel station are very similar to those mentioned above with respect to the vehicle level. Specifically, the corrosive nature of methanol requires the installation of compatible hardware (i.e., storage tanks, pumps, and hoses) as well as increased capacity to allow for the storage of the equivalent amount of fuel energy. Of course, the station level changes are much larger than those required at the vehicle level and, thus, the cost of these changes are also larger. The estimated cost of converting an existing gasoline outlet to a methanol filling station is on the order of $50,000 to 70,000.16 Cold Start: The combustion of neat methanol is problematic during cold weather starting and warm-up conditions because it has on the order of half of the vapor pressure of gasoline and a high latent heat of vaporization. Consequently, the minimum ambient temperature for unassisted cold start of neat methanol-fueled vehicles ranges from 0 to 16C.13 To circumvent this problem, methanol is typically mixed with a small amount of gasoline such that 85 percent (by volume) of the mixture is methanol and the remaining 15 percent gasoline. As mentioned above, this mixture is commonly referred to as M85, and is used in most methanol-fueled vehicle demonstrations. 3.4 Methanol Fueled Vehicles: Short and Long Term Outlook The major automobile manufacturers have been exploring a variety of options, including alcohol fueled AFVs in response to the worldwide demand for alternative fuel vehicles. As of 1996, DOE projections indicated that methanol AFVs (combined light and heavy duty) supplied by original equipment manufacturers (OEMs) would increase by an average rate of 3 percent per year through 1998. By contrast, AFVs using ethanol, which are nearly an order of magnitude smaller in number, were expected to increase by an average rate of 51 percent per year over
- 37 -
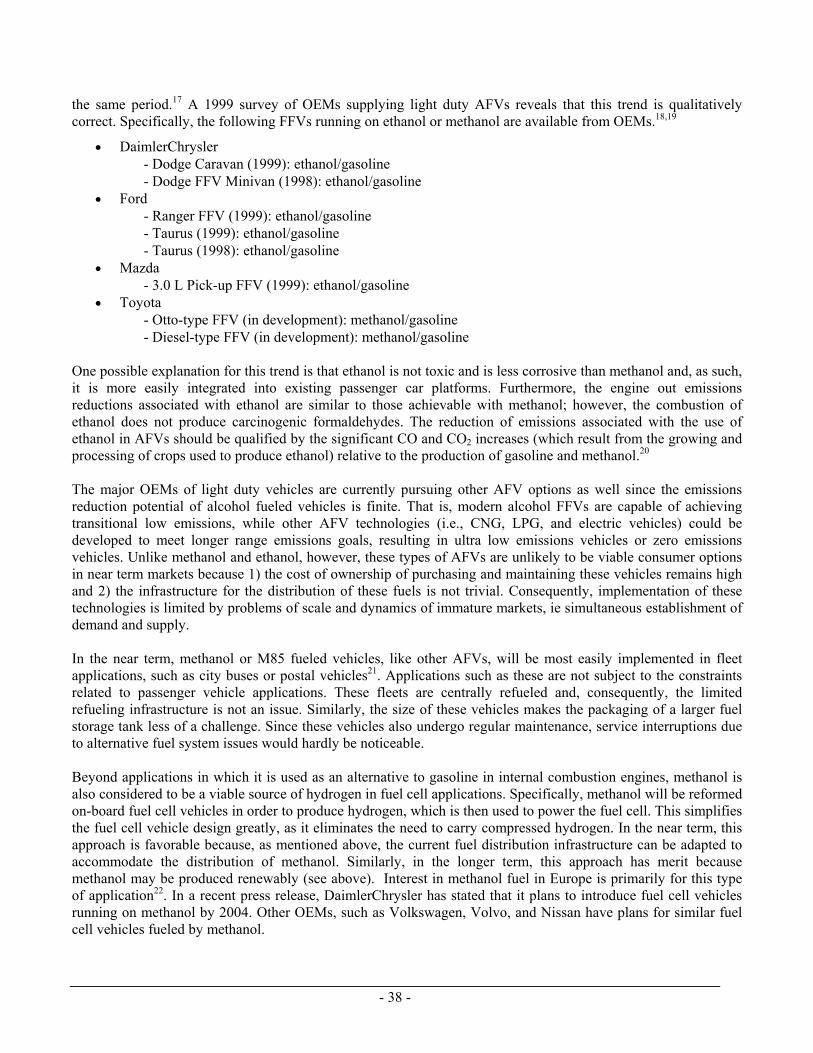
the same period.17 A 1999 survey of OEMs supplying light duty AFVs reveals that this trend is qualitatively correct. Specifically, the following FFVs running on ethanol or methanol are available from OEMs.18,19
• DaimlerChrysler - Dodge Caravan (1999): ethanol/gasoline - Dodge FFV Minivan (1998): ethanol/gasoline
• Ford - Ranger FFV (1999): ethanol/gasoline - Taurus (1999): ethanol/gasoline - Taurus (1998): ethanol/gasoline
• Mazda - 3.0 L Pick-up FFV (1999): ethanol/gasoline
• Toyota - Otto-type FFV (in development): methanol/gasoline - Diesel-type FFV (in development): methanol/gasoline
One possible explanation for this trend is that ethanol is not toxic and is less corrosive than methanol and, as such, it is more easily integrated into existing passenger car platforms. Furthermore, the engine out emissions reductions associated with ethanol are similar to those achievable with methanol; however, the combustion of ethanol does not produce carcinogenic formaldehydes. The reduction of emissions associated with the use of ethanol in AFVs should be qualified by the significant CO and CO2 increases (which result from the growing and processing of crops used to produce ethanol) relative to the production of gasoline and methanol.20 The major OEMs of light duty vehicles are currently pursuing other AFV options as well since the emissions reduction potential of alcohol fueled vehicles is finite. That is, modern alcohol FFVs are capable of achieving transitional low emissions, while other AFV technologies (i.e., CNG, LPG, and electric vehicles) could be developed to meet longer range emissions goals, resulting in ultra low emissions vehicles or zero emissions vehicles. Unlike methanol and ethanol, however, these types of AFVs are unlikely to be viable consumer options in near term markets because 1) the cost of ownership of purchasing and maintaining these vehicles remains high and 2) the infrastructure for the distribution of these fuels is not trivial. Consequently, implementation of these technologies is limited by problems of scale and dynamics of immature markets, ie simultaneous establishment of demand and supply. In the near term, methanol or M85 fueled vehicles, like other AFVs, will be most easily implemented in fleet applications, such as city buses or postal vehicles21. Applications such as these are not subject to the constraints related to passenger vehicle applications. These fleets are centrally refueled and, consequently, the limited refueling infrastructure is not an issue. Similarly, the size of these vehicles makes the packaging of a larger fuel storage tank less of a challenge. Since these vehicles also undergo regular maintenance, service interruptions due to alternative fuel system issues would hardly be noticeable. Beyond applications in which it is used as an alternative to gasoline in internal combustion engines, methanol is also considered to be a viable source of hydrogen in fuel cell applications. Specifically, methanol will be reformed on-board fuel cell vehicles in order to produce hydrogen, which is then used to power the fuel cell. This simplifies the fuel cell vehicle design greatly, as it eliminates the need to carry compressed hydrogen. In the near term, this approach is favorable because, as mentioned above, the current fuel distribution infrastructure can be adapted to accommodate the distribution of methanol. Similarly, in the longer term, this approach has merit because methanol may be produced renewably (see above). Interest in methanol fuel in Europe is primarily for this type of application22. In a recent press release, DaimlerChrysler has stated that it plans to introduce fuel cell vehicles running on methanol by 2004. Other OEMs, such as Volkswagen, Volvo, and Nissan have plans for similar fuel cell vehicles fueled by methanol.
- 38 -
REFERENCES
1. Department of Energy, “EPACT initiatives for alternative fuel vehicles,” March 1995. 2. Chandler, K., Malcosky, N., Motta, R., Norton, P., Kelly, K., Schumacher, L., Lyons, D., “Alternative fuel transit
bus evaluation program results,” SAE 961082. 3. Whalen, P., Kelly, K., Motta, R., Broderick, J., “Summary of results from the National Renewable Energy
Laboratory’s vehicle evaluation data collection efforts,” NREL/SP-425-20821, May 1996. 4. Kelly, K.J., Bailey, B.K., Coburn, T.C., Clark, W., Eudy, L., and Lissiuk, P., “FTP emissions test results from
flexible-fuel methanol Dodge Spirits and Ford Econoline vans,” SAE Paper No. 961090, 1996. 5. Arthur D. Little, Inc., “Alternative fuel infrastructure economics and issues,” Reference 45533, March 1997. 6. Arthur D. Little, Inc., “Energy efficiency and emissions of transportation fuel chains,” Reference 45533, February
1996. 7. Kirwan, J.E., “Effects of methanol and fuel sulfur concentration on tailpipe emissions in a production variable
fuel vehicle,” SAE Paper No. 932774, 1993. 8. Gorse, R.A., and Benson, J.D., “The effects of methanol/gasoline blends on automobile emissions,” SAE Paper
No. 920327, 1992. 9. CADDET Energy Efficiency, “Saving energy with alternative fuels for vehicles,” Maxi Brochure 10, 1998. 10. API publication 4261, 2nd Edition, July 1988 11. Detroit Diesel Corporation, Methanol-Fueled Series 92 Engine Operator’s Guide, 1991. 12. U.S. Environmental Protection Agency, “Methanol fuels and fire safety,” Factsheet OMS-8, August, 1994. 13. Owen, K. and Cowley, T., Automotive Fuels Reference Book, Second Edition, Society of Automotive Engineers,
Inc., 1995. 14. Cowart, J.S., Boruta, W.E., Dalton, J.D., Dona, R.F., Rivard II, F.L., Furby, R.S., Piontkowski, J.A., Seiter, R.E.,
and Takai, R.M., “Powertrain development of the 1996 Ford flexible fuel Taurus,” SAE Paper No. 952751. 15. Bluestein, L., and Hamilton, J., “AFV manufacturing review: what’s available?”
http://www.afdc.nrel.gov/vehicles/96OEMsum/ldv_96_oem.html. 16. EA Engineering, Science, and Technology, “Methanol refueling station costs,” Prepared for the American
Methanol Foundation, February 1, 1999. 17. Energy Information Administration, “Alternatives to traditional transportation fuels 1996,” DOE/EIA-0585(96),
December 1997. 18. Department of Energy, “Alternative fuel vehicle fleet buyer’s guide,” http://www.fleets.doe.gov. 19. California Air Resources Board, “1999 Light duty truck buyer’s guide,”
http://www.arb.ca.gov/msprog/ccbg/99ldt.htm 20. Frank, L., McCosh, D., Marini, R., Brown, S.F., “Power to the people,” Popular Science, v241, n2, p102, August
1992. 21. U.S. Department of Energy, “The niche market principle,” Alternative Fuel News, Vol. 2, No. 6. 22. Seisler, J., Personal communication, April 4, 1999.
- 39 -

Appendix This Appendix includes the IEA Greenhouse Gas R&D Program Standard Technical and Financial Study Criteria. The criteria were used in the referenced studies in the conceptual design of the business-as-usual combined cycle electric power plants with CO2 capture and sequestering.
- 40 -
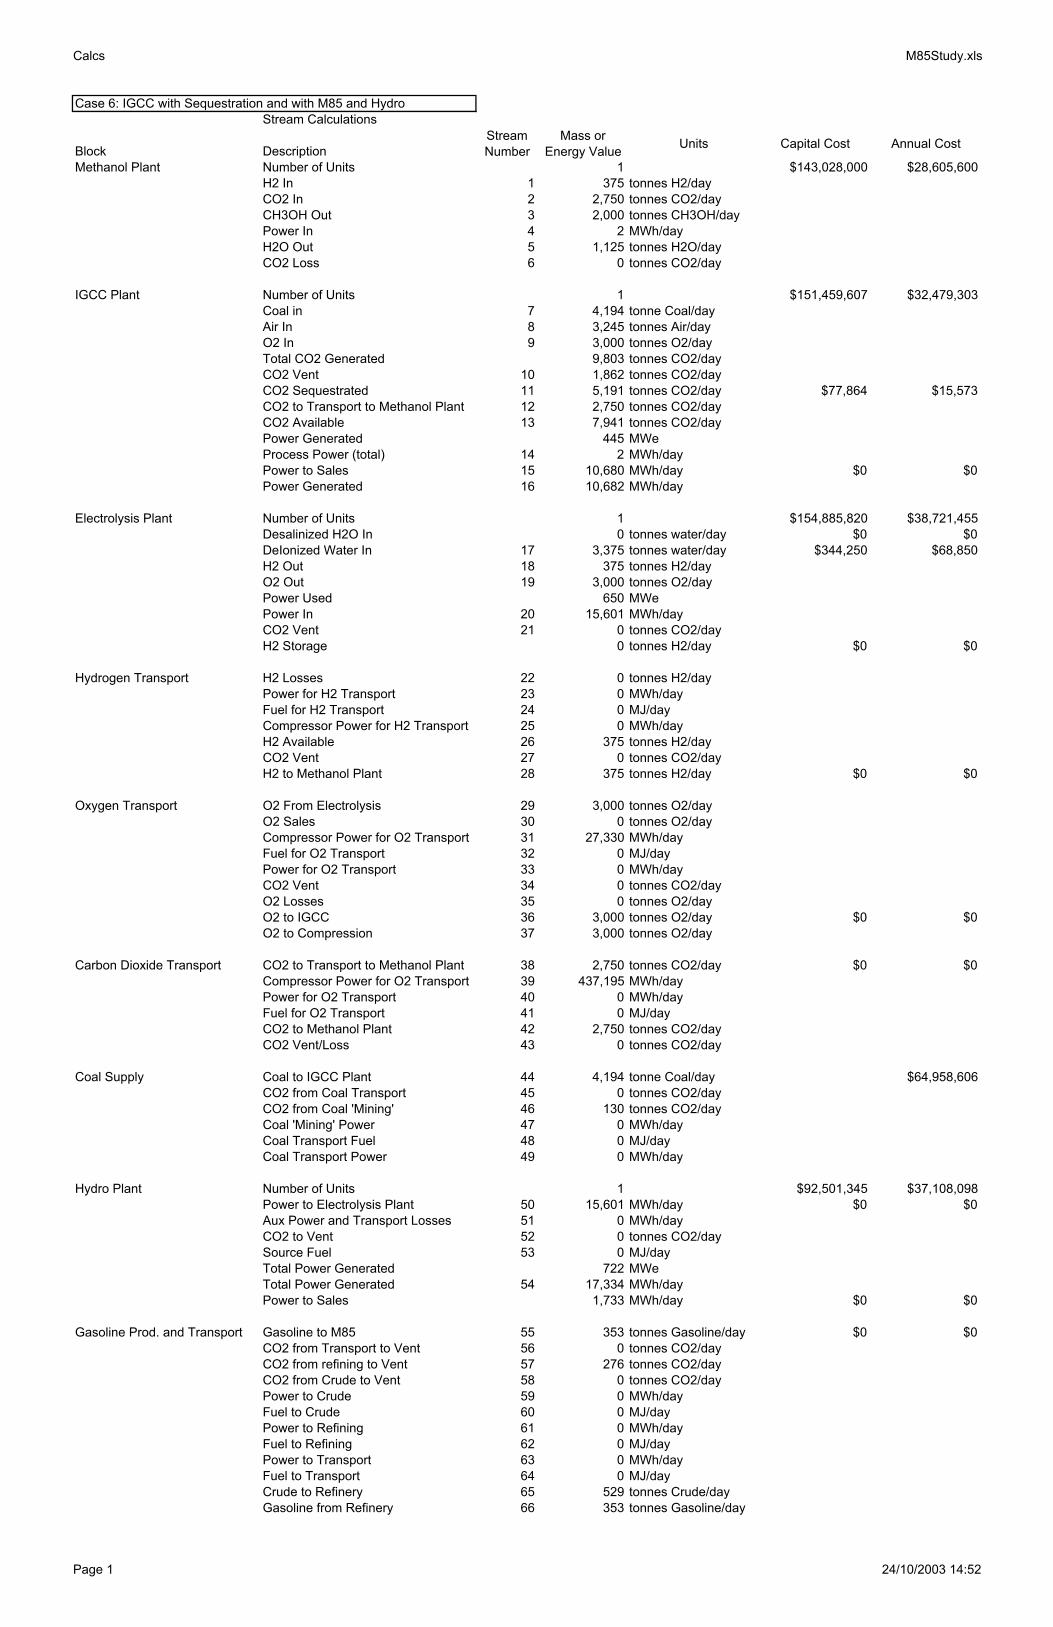
Calcs M85Study.xls
Case 6: IGCC with Sequestration and with M85 and HydroStream Calculations
Block DescriptionStream Number
Mass or Energy Value Units Capital Cost Annual Cost
Methanol Plant Number of Units 1 $143,028,000 $28,605,600H2 In 1 375 tonnes H2/dayCO2 In 2 2,750 tonnes CO2/dayCH3OH Out 3 2,000 tonnes CH3OH/dayPower In 4 2 MWh/dayH2O Out 5 1,125 tonnes H2O/dayCO2 Loss 6 0 tonnes CO2/day
IGCC Plant Number of Units 1 $151,459,607 $32,479,303Coal in 7 4,194 tonne Coal/dayAir In 8 3,245 tonnes Air/dayO2 In 9 3,000 tonnes O2/dayTotal CO2 Generated 9,803 tonnes CO2/dayCO2 Vent 10 1,862 tonnes CO2/dayCO2 Sequestrated 11 5,191 tonnes CO2/day $77,864 $15,573CO2 to Transport to Methanol Plant 12 2,750 tonnes CO2/dayCO2 Available 13 7,941 tonnes CO2/dayPower Generated 445 MWeProcess Power (total) 14 2 MWh/dayPower to Sales 15 10,680 MWh/day $0 $0Power Generated 16 10,682 MWh/day
Electrolysis Plant Number of Units 1 $154,885,820 $38,721,455Desalinized H2O In 0 tonnes water/day $0 $0DeIonized Water In 17 3,375 tonnes water/day $344,250 $68,850H2 Out 18 375 tonnes H2/dayO2 Out 19 3,000 tonnes O2/dayPower Used 650 MWePower In 20 15,601 MWh/dayCO2 Vent 21 0 tonnes CO2/dayH2 Storage 0 tonnes H2/day $0 $0
Hydrogen Transport H2 Losses 22 0 tonnes H2/dayPower for H2 Transport 23 0 MWh/dayFuel for H2 Transport 24 0 MJ/dayCompressor Power for H2 Transport 25 0 MWh/dayH2 Available 26 375 tonnes H2/dayCO2 Vent 27 0 tonnes CO2/dayH2 to Methanol Plant 28 375 tonnes H2/day $0 $0
Oxygen Transport O2 From Electrolysis 29 3,000 tonnes O2/dayO2 Sales 30 0 tonnes O2/dayCompressor Power for O2 Transport 31 27,330 MWh/dayFuel for O2 Transport 32 0 MJ/dayPower for O2 Transport 33 0 MWh/dayCO2 Vent 34 0 tonnes CO2/dayO2 Losses 35 0 tonnes O2/dayO2 to IGCC 36 3,000 tonnes O2/day $0 $0O2 to Compression 37 3,000 tonnes O2/day
Carbon Dioxide Transport CO2 to Transport to Methanol Plant 38 2,750 tonnes CO2/day $0 $0Compressor Power for O2 Transport 39 437,195 MWh/dayPower for O2 Transport 40 0 MWh/dayFuel for O2 Transport 41 0 MJ/dayCO2 to Methanol Plant 42 2,750 tonnes CO2/dayCO2 Vent/Loss 43 0 tonnes CO2/day
Coal Supply Coal to IGCC Plant 44 4,194 tonne Coal/day $64,958,606CO2 from Coal Transport 45 0 tonnes CO2/dayCO2 from Coal 'Mining' 46 130 tonnes CO2/dayCoal 'Mining' Power 47 0 MWh/dayCoal Transport Fuel 48 0 MJ/dayCoal Transport Power 49 0 MWh/day
Hydro Plant Number of Units 1 $92,501,345 $37,108,098Power to Electrolysis Plant 50 15,601 MWh/day $0 $0Aux Power and Transport Losses 51 0 MWh/dayCO2 to Vent 52 0 tonnes CO2/daySource Fuel 53 0 MJ/dayTotal Power Generated 722 MWeTotal Power Generated 54 17,334 MWh/dayPower to Sales 1,733 MWh/day $0 $0
Gasoline Prod. and Transport Gasoline to M85 55 353 tonnes Gasoline/day $0 $0CO2 from Transport to Vent 56 0 tonnes CO2/dayCO2 from refining to Vent 57 276 tonnes CO2/dayCO2 from Crude to Vent 58 0 tonnes CO2/dayPower to Crude 59 0 MWh/dayFuel to Crude 60 0 MJ/dayPower to Refining 61 0 MWh/dayFuel to Refining 62 0 MJ/dayPower to Transport 63 0 MWh/dayFuel to Transport 64 0 MJ/dayCrude to Refinery 65 529 tonnes Crude/dayGasoline from Refinery 66 353 tonnes Gasoline/day
Page 1 24/10/2003 14:52
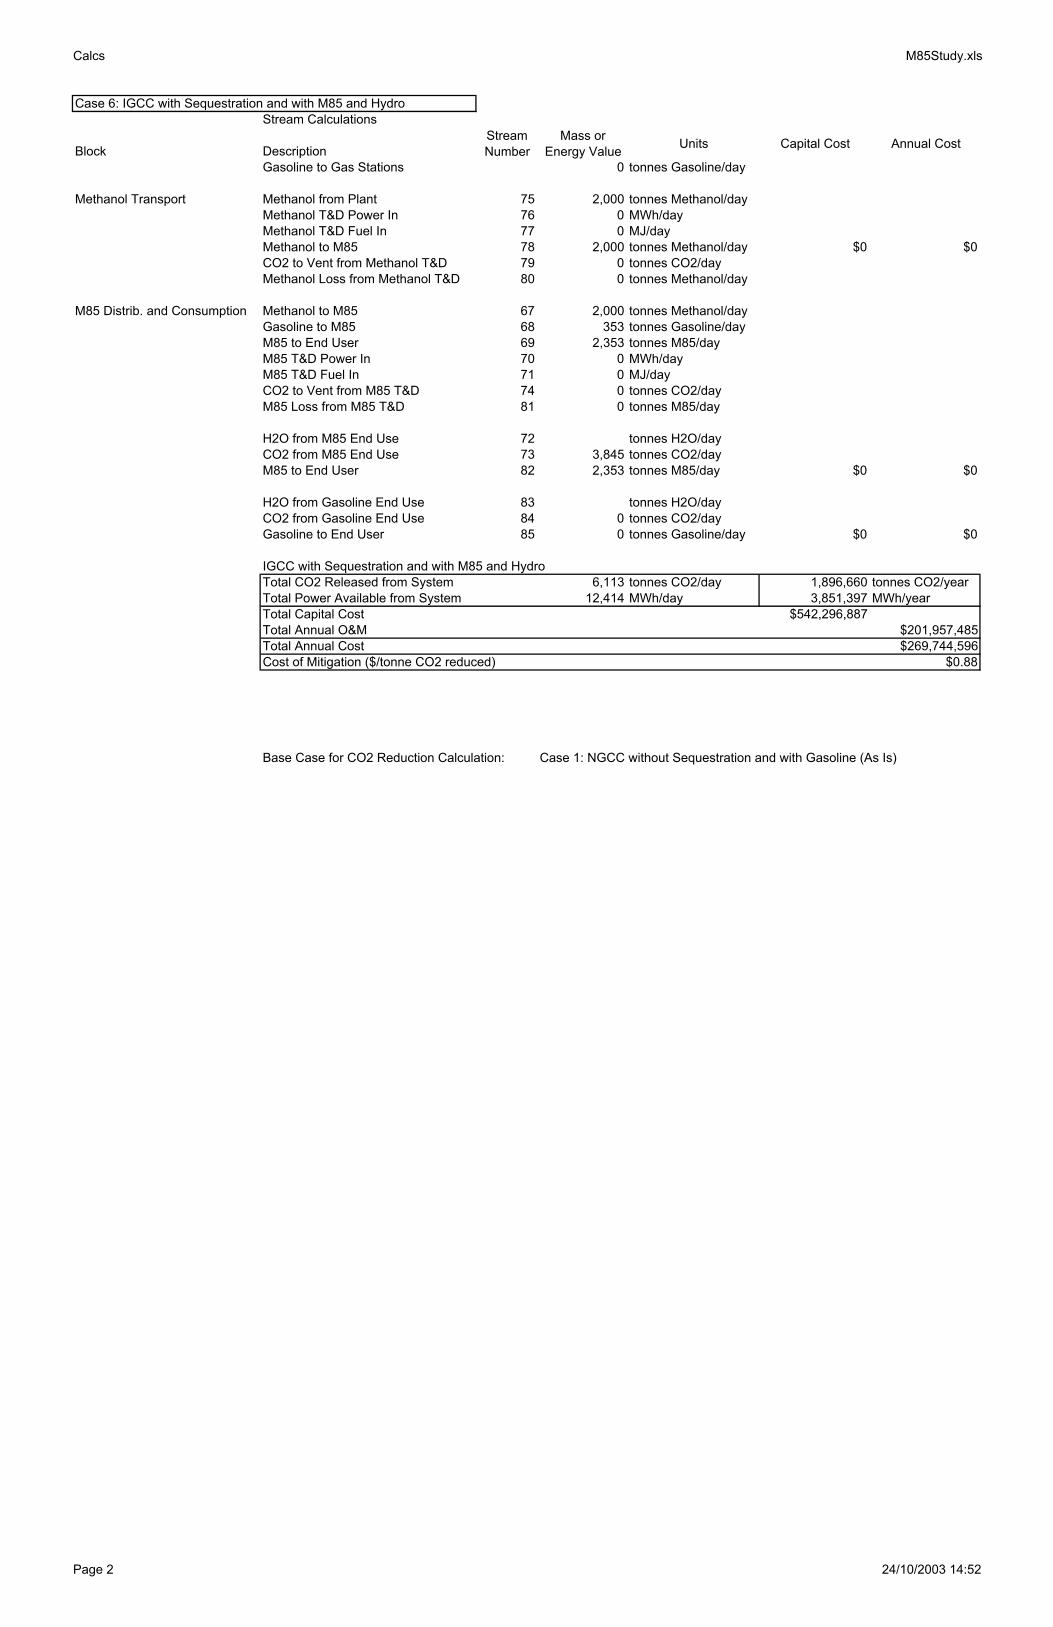
Calcs M85Study.xls
Case 6: IGCC with Sequestration and with M85 and HydroStream Calculations
Block DescriptionStream Number
Mass or Energy Value Units Capital Cost Annual Cost
Gasoline to Gas Stations 0 tonnes Gasoline/day
Methanol Transport Methanol from Plant 75 2,000 tonnes Methanol/dayMethanol T&D Power In 76 0 MWh/dayMethanol T&D Fuel In 77 0 MJ/dayMethanol to M85 78 2,000 tonnes Methanol/day $0 $0CO2 to Vent from Methanol T&D 79 0 tonnes CO2/dayMethanol Loss from Methanol T&D 80 0 tonnes Methanol/day
M85 Distrib. and Consumption Methanol to M85 67 2,000 tonnes Methanol/dayGasoline to M85 68 353 tonnes Gasoline/dayM85 to End User 69 2,353 tonnes M85/dayM85 T&D Power In 70 0 MWh/dayM85 T&D Fuel In 71 0 MJ/dayCO2 to Vent from M85 T&D 74 0 tonnes CO2/dayM85 Loss from M85 T&D 81 0 tonnes M85/day
H2O from M85 End Use 72 tonnes H2O/dayCO2 from M85 End Use 73 3,845 tonnes CO2/dayM85 to End User 82 2,353 tonnes M85/day $0 $0
H2O from Gasoline End Use 83 tonnes H2O/dayCO2 from Gasoline End Use 84 0 tonnes CO2/dayGasoline to End User 85 0 tonnes Gasoline/day $0 $0
IGCC with Sequestration and with M85 and HydroTotal CO2 Released from System 6,113 tonnes CO2/day 1,896,660 tonnes CO2/yearTotal Power Available from System 12,414 MWh/day 3,851,397 MWh/yearTotal Capital Cost $542,296,887Total Annual O&M $201,957,485Total Annual Cost $269,744,596Cost of Mitigation ($/tonne CO2 reduced) $0.88
Base Case for CO2 Reduction Calculation: Case 1: NGCC without Sequestration and with Gasoline (As Is)
Page 2 24/10/2003 14:52

Input for Various CasesNGCC without Sequestration and Gasoline (As Is) 1Number of Methanol Plants 0Sequestration Flag (1=Yes, 0=No) 0Fossil Power Plant Type Selection 1=IGCC 2=NGCC 3=None 2Renewable Power Plant Type Selection 1=Hydro 2=Wind 3=Photo 5
NGCC with Sequestration and Gasoline 2Number of Methanol Plants 0Sequestration Flag (1=Yes, 0=No) 1Fossil Power Plant Type Selection 1=IGCC 2=NGCC 3=None 2Renewable Power Plant Type Selection 1=Hydro 2=Wind 3=Photo 5
IGCC without Sequestration and Gasoline 3Number of Methanol Plants 0Sequestration Flag (1=Yes, 0=No) 0Fossil Power Plant Type Selection 1=IGCC 2=NGCC 3=None 1Renewable Power Plant Type Selection 1=Hydro 2=Wind 3=Photo 5
IGCC with Sequestration and Gasoline 4Number of Methanol Plants 0Sequestration Flag (1=Yes, 0=No) 1Fossil Power Plant Type Selection 1=IGCC 2=NGCC 3=None 1Renewable Power Plant Type Selection 1=Hydro 2=Wind 3=Photo 5
NGCC with Sequestration and with M85 and PhotoVoltaic 5Number of Methanol Plants 1Sequestration Flag (1=Yes, 0=No) 1Fossil Power Plant Type Selection 1=IGCC 2=NGCC 3=None 2Renewable Power Plant Type Selection 1=Hydro 2=Wind 3=Photo 3
IGCC with Sequestration and with M85 and PhotoVoltaic 6Number of Methanol Plants 1Sequestration Flag (1=Yes, 0=No) 1Fossil Power Plant Type Selection 1=IGCC 2=NGCC 3=None 1Renewable Power Plant Type Selection 1=Hydro 2=Wind 3=Photo 3
PhotoVoltaic with Gasoline 7Number of Methanol Plants 0Sequestration Flag (1=Yes, 0=No) 0Fossil Power Plant Type Selection 1=IGCC 2=NGCC 3=None 5Renewable Power Plant Type Selection 1=Hydro 2=Wind 3=Photo 3
NGCC with Sequestration and with M85 and Hydro 8Number of Methanol Plants 1Sequestration Flag (1=Yes, 0=No) 1Fossil Power Plant Type Selection 1=IGCC 2=NGCC 3=None 2Renewable Power Plant Type Selection 1=Hydro 2=Wind 3=Photo 1
IGCC with Sequestration and with M85 and Hydro 9Number of Methanol Plants 1Sequestration Flag (1=Yes, 0=No) 1Fossil Power Plant Type Selection 1=IGCC 2=NGCC 3=None 1Renewable Power Plant Type Selection 1=Hydro 2=Wind 3=Photo 1
Hydro with Gasoline 10Number of Methanol Plants 0Sequestration Flag (1=Yes, 0=No) 0Fossil Power Plant Type Selection 1=IGCC 2=NGCC 3=None 5Renewable Power Plant Type Selection 1=Hydro 2=Wind 3=Photo 1
Scenarios2results.xls Scenarios Page 1 24/10/2003 15:26
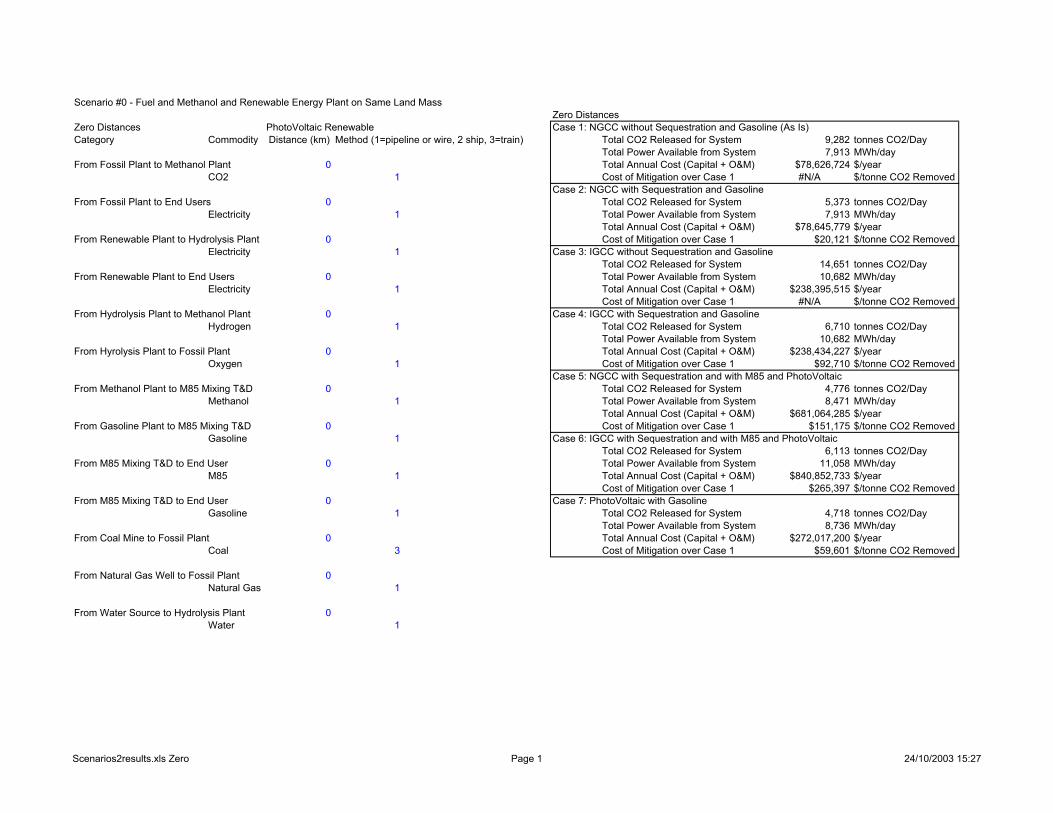
Scenario #0 - Fuel and Methanol and Renewable Energy Plant on Same Land MassZero Distances
Zero Distances PhotoVoltaic Renewable Case 1: NGCC without Sequestration and Gasoline (As Is)Category Commodity Distance (km) Method (1=pipeline or wire, 2 ship, 3=train) Total CO2 Released for System 9,282 tonnes CO2/Day
Total Power Available from System 7,913 MWh/dayFrom Fossil Plant to Methanol Plant 0 Total Annual Cost (Capital + O&M) $78,626,724 $/year
CO2 1 Cost of Mitigation over Case 1 #N/A $/tonne CO2 RemovedCase 2: NGCC with Sequestration and Gasoline
From Fossil Plant to End Users 0 Total CO2 Released for System 5,373 tonnes CO2/DayElectricity 1 Total Power Available from System 7,913 MWh/day
Total Annual Cost (Capital + O&M) $78,645,779 $/yearFrom Renewable Plant to Hydrolysis Plant 0 Cost of Mitigation over Case 1 $20,121 $/tonne CO2 Removed
Electricity 1 Case 3: IGCC without Sequestration and GasolineTotal CO2 Released for System 14,651 tonnes CO2/Day
From Renewable Plant to End Users 0 Total Power Available from System 10,682 MWh/dayElectricity 1 Total Annual Cost (Capital + O&M) $238,395,515 $/year
Cost of Mitigation over Case 1 #N/A $/tonne CO2 RemovedFrom Hydrolysis Plant to Methanol Plant 0 Case 4: IGCC with Sequestration and Gasoline
Hydrogen 1 Total CO2 Released for System 6,710 tonnes CO2/DayTotal Power Available from System 10,682 MWh/day
From Hyrolysis Plant to Fossil Plant 0 Total Annual Cost (Capital + O&M) $238,434,227 $/yearOxygen 1 Cost of Mitigation over Case 1 $92,710 $/tonne CO2 Removed
Case 5: NGCC with Sequestration and with M85 and PhotoVoltaicFrom Methanol Plant to M85 Mixing T&D 0 Total CO2 Released for System 4,776 tonnes CO2/Day
Methanol 1 Total Power Available from System 8,471 MWh/dayTotal Annual Cost (Capital + O&M) $681,064,285 $/year
From Gasoline Plant to M85 Mixing T&D 0 Cost of Mitigation over Case 1 $151,175 $/tonne CO2 RemovedGasoline 1 Case 6: IGCC with Sequestration and with M85 and PhotoVoltaic
Total CO2 Released for System 6,113 tonnes CO2/DayFrom M85 Mixing T&D to End User 0 Total Power Available from System 11,058 MWh/day
M85 1 Total Annual Cost (Capital + O&M) $840,852,733 $/yearCost of Mitigation over Case 1 $265,397 $/tonne CO2 Removed
From M85 Mixing T&D to End User 0 Case 7: PhotoVoltaic with GasolineGasoline 1 Total CO2 Released for System 4,718 tonnes CO2/Day
Total Power Available from System 8,736 MWh/dayFrom Coal Mine to Fossil Plant 0 Total Annual Cost (Capital + O&M) $272,017,200 $/year
Coal 3 Cost of Mitigation over Case 1 $59,601 $/tonne CO2 Removed
From Natural Gas Well to Fossil Plant 0Natural Gas 1
From Water Source to Hydrolysis Plant 0Water 1
Scenarios2results.xls Zero Page 1 24/10/2003 15:27
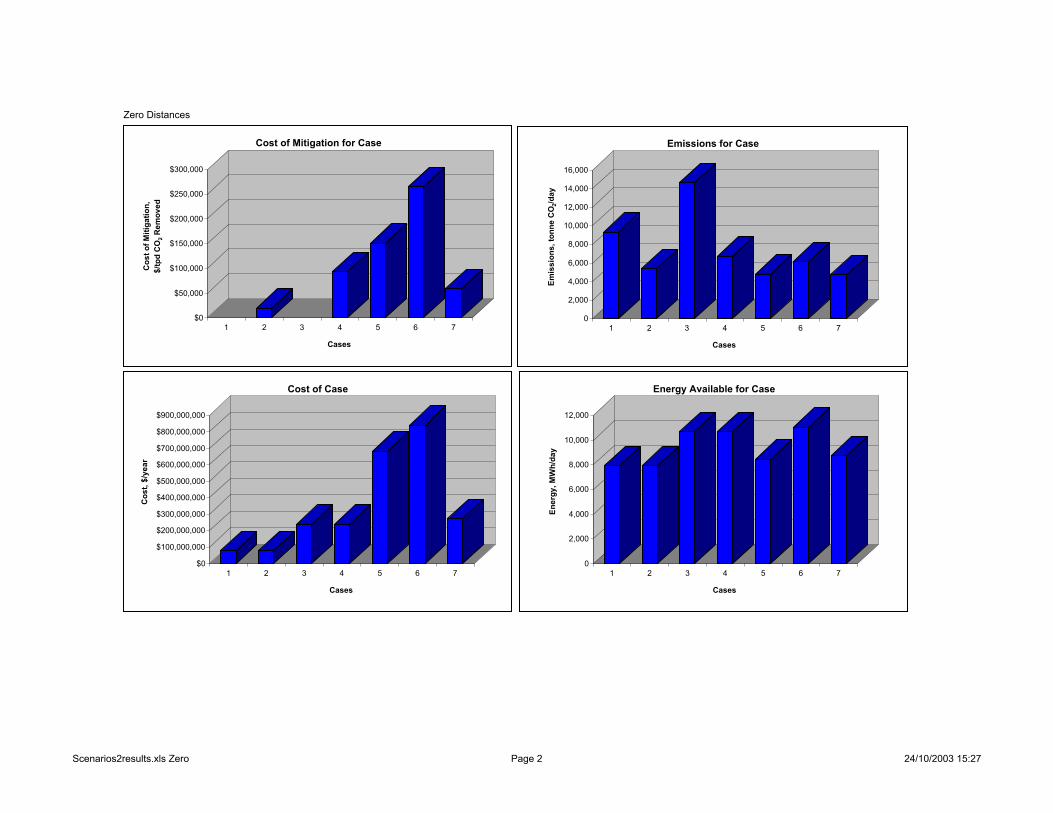
Zero Distances
$0
$100,000,000
$200,000,000
$300,000,000
$400,000,000
$500,000,000
$600,000,000
$700,000,000
$800,000,000
$900,000,000
Cos
t, $/
year
1 2 3 4 5 6 7
Cases
Cost of Case
0
2,000
4,000
6,000
8,000
10,000
12,000
14,000
16,000
Emis
sion
s, to
nne
CO
2/day
1 2 3 4 5 6 7
Cases
Emissions for Case
$0
$50,000
$100,000
$150,000
$200,000
$250,000
$300,000
Cos
t of M
itiga
tion,
$/
tpd
CO
2 Rem
oved
1 2 3 4 5 6 7
Cases
Cost of Mitigation for Case
0
2,000
4,000
6,000
8,000
10,000
12,000
Ener
gy, M
Wh/
day
1 2 3 4 5 6 7
Cases
Energy Available for Case
Scenarios2results.xls Zero Page 2 24/10/2003 15:27
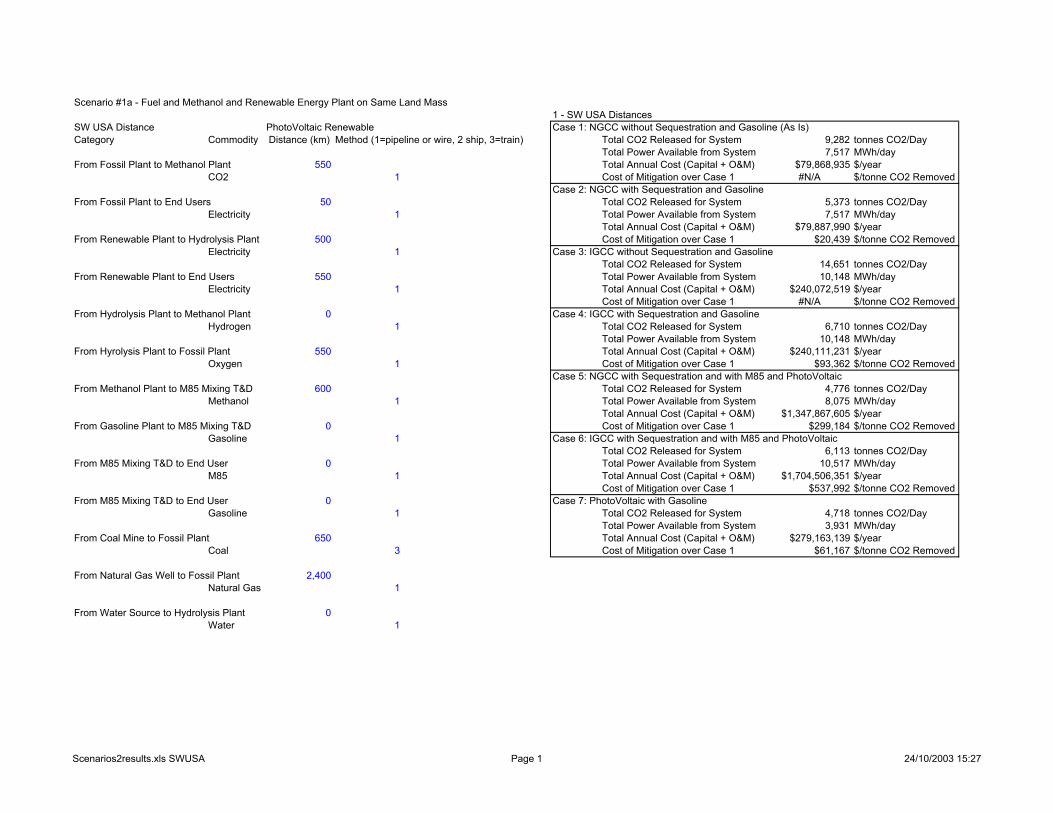
Scenario #1a - Fuel and Methanol and Renewable Energy Plant on Same Land Mass1 - SW USA Distances
SW USA Distance PhotoVoltaic Renewable Case 1: NGCC without Sequestration and Gasoline (As Is)Category Commodity Distance (km) Method (1=pipeline or wire, 2 ship, 3=train) Total CO2 Released for System 9,282 tonnes CO2/Day
Total Power Available from System 7,517 MWh/dayFrom Fossil Plant to Methanol Plant 550 Total Annual Cost (Capital + O&M) $79,868,935 $/year
CO2 1 Cost of Mitigation over Case 1 #N/A $/tonne CO2 RemovedCase 2: NGCC with Sequestration and Gasoline
From Fossil Plant to End Users 50 Total CO2 Released for System 5,373 tonnes CO2/DayElectricity 1 Total Power Available from System 7,517 MWh/day
Total Annual Cost (Capital + O&M) $79,887,990 $/yearFrom Renewable Plant to Hydrolysis Plant 500 Cost of Mitigation over Case 1 $20,439 $/tonne CO2 Removed
Electricity 1 Case 3: IGCC without Sequestration and GasolineTotal CO2 Released for System 14,651 tonnes CO2/Day
From Renewable Plant to End Users 550 Total Power Available from System 10,148 MWh/dayElectricity 1 Total Annual Cost (Capital + O&M) $240,072,519 $/year
Cost of Mitigation over Case 1 #N/A $/tonne CO2 RemovedFrom Hydrolysis Plant to Methanol Plant 0 Case 4: IGCC with Sequestration and Gasoline
Hydrogen 1 Total CO2 Released for System 6,710 tonnes CO2/DayTotal Power Available from System 10,148 MWh/day
From Hyrolysis Plant to Fossil Plant 550 Total Annual Cost (Capital + O&M) $240,111,231 $/yearOxygen 1 Cost of Mitigation over Case 1 $93,362 $/tonne CO2 Removed
Case 5: NGCC with Sequestration and with M85 and PhotoVoltaicFrom Methanol Plant to M85 Mixing T&D 600 Total CO2 Released for System 4,776 tonnes CO2/Day
Methanol 1 Total Power Available from System 8,075 MWh/dayTotal Annual Cost (Capital + O&M) $1,347,867,605 $/year
From Gasoline Plant to M85 Mixing T&D 0 Cost of Mitigation over Case 1 $299,184 $/tonne CO2 RemovedGasoline 1 Case 6: IGCC with Sequestration and with M85 and PhotoVoltaic
Total CO2 Released for System 6,113 tonnes CO2/DayFrom M85 Mixing T&D to End User 0 Total Power Available from System 10,517 MWh/day
M85 1 Total Annual Cost (Capital + O&M) $1,704,506,351 $/yearCost of Mitigation over Case 1 $537,992 $/tonne CO2 Removed
From M85 Mixing T&D to End User 0 Case 7: PhotoVoltaic with GasolineGasoline 1 Total CO2 Released for System 4,718 tonnes CO2/Day
Total Power Available from System 3,931 MWh/dayFrom Coal Mine to Fossil Plant 650 Total Annual Cost (Capital + O&M) $279,163,139 $/year
Coal 3 Cost of Mitigation over Case 1 $61,167 $/tonne CO2 Removed
From Natural Gas Well to Fossil Plant 2,400Natural Gas 1
From Water Source to Hydrolysis Plant 0Water 1
Scenarios2results.xls SWUSA Page 1 24/10/2003 15:27
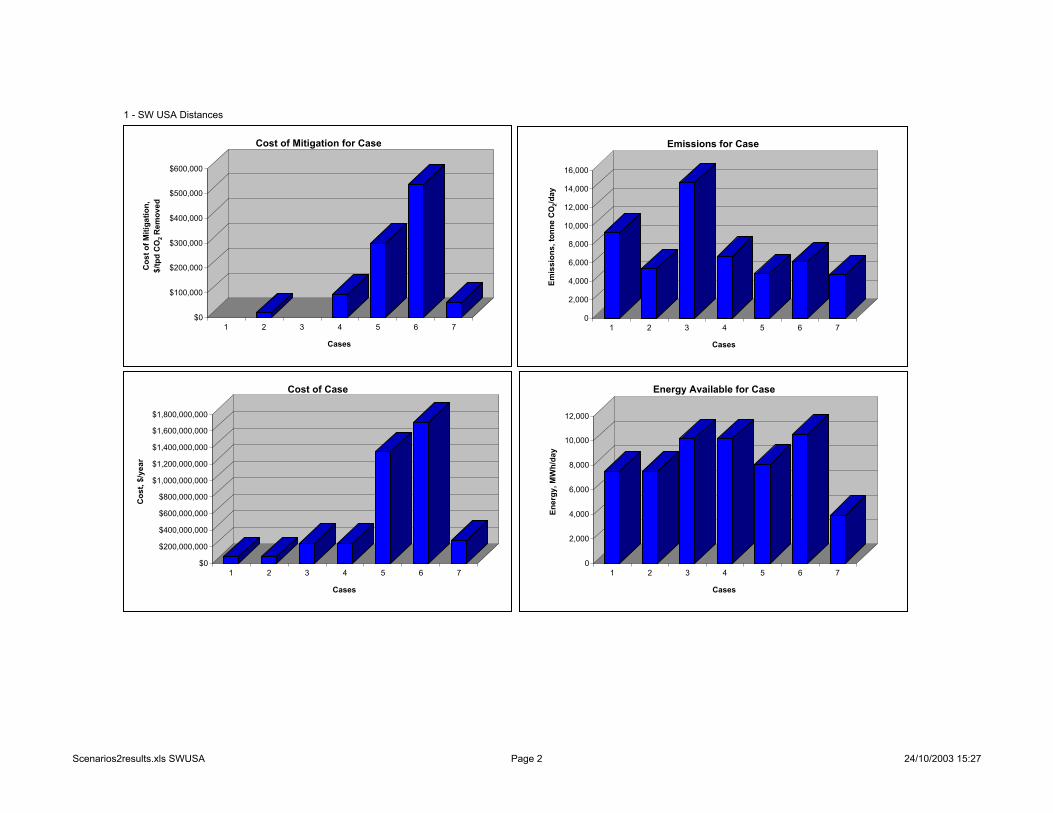
1 - SW USA Distances
$0
$200,000,000
$400,000,000
$600,000,000
$800,000,000
$1,000,000,000
$1,200,000,000
$1,400,000,000
$1,600,000,000
$1,800,000,000
Cos
t, $/
year
1 2 3 4 5 6 7
Cases
Cost of Case
0
2,000
4,000
6,000
8,000
10,000
12,000
14,000
16,000
Emis
sion
s, to
nne
CO
2/day
1 2 3 4 5 6 7
Cases
Emissions for Case
$0
$100,000
$200,000
$300,000
$400,000
$500,000
$600,000
Cos
t of M
itiga
tion,
$/
tpd
CO
2 Rem
oved
1 2 3 4 5 6 7
Cases
Cost of Mitigation for Case
0
2,000
4,000
6,000
8,000
10,000
12,000
Ener
gy, M
Wh/
day
1 2 3 4 5 6 7
Cases
Energy Available for Case
Scenarios2results.xls SWUSA Page 2 24/10/2003 15:27
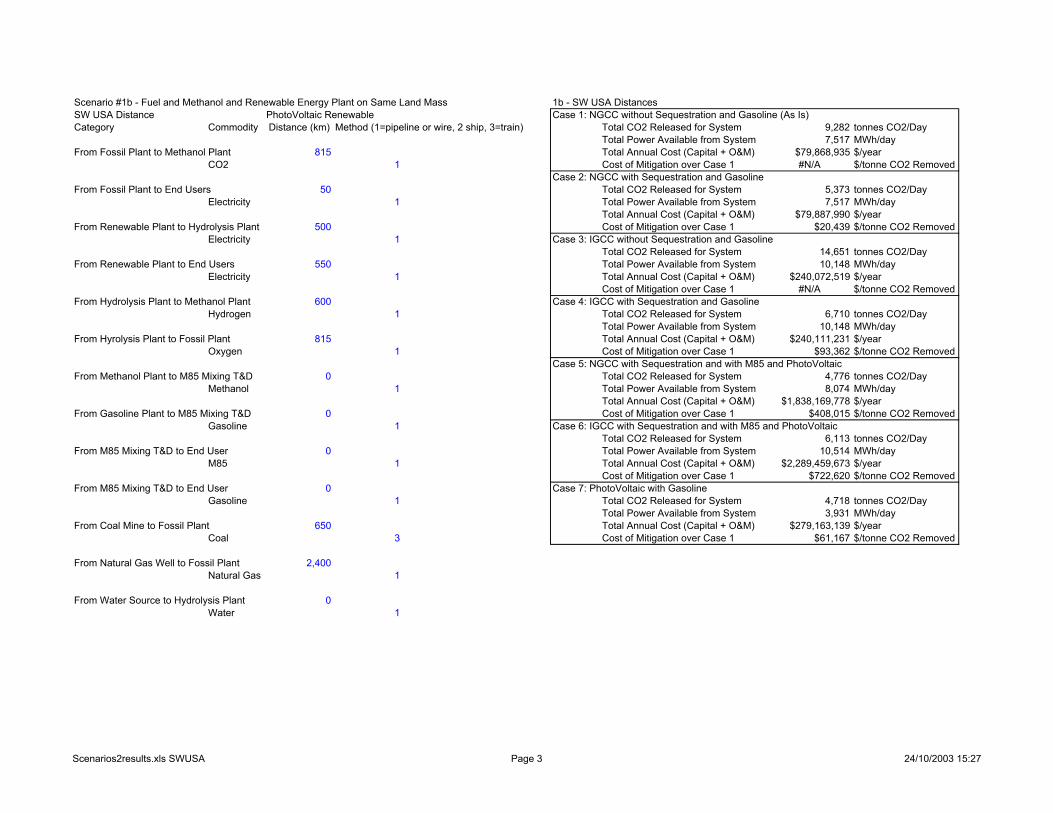
Scenario #1b - Fuel and Methanol and Renewable Energy Plant on Same Land Mass 1b - SW USA DistancesSW USA Distance PhotoVoltaic Renewable Case 1: NGCC without Sequestration and Gasoline (As Is)Category Commodity Distance (km) Method (1=pipeline or wire, 2 ship, 3=train) Total CO2 Released for System 9,282 tonnes CO2/Day
Total Power Available from System 7,517 MWh/dayFrom Fossil Plant to Methanol Plant 815 Total Annual Cost (Capital + O&M) $79,868,935 $/year
CO2 1 Cost of Mitigation over Case 1 #N/A $/tonne CO2 RemovedCase 2: NGCC with Sequestration and Gasoline
From Fossil Plant to End Users 50 Total CO2 Released for System 5,373 tonnes CO2/DayElectricity 1 Total Power Available from System 7,517 MWh/day
Total Annual Cost (Capital + O&M) $79,887,990 $/yearFrom Renewable Plant to Hydrolysis Plant 500 Cost of Mitigation over Case 1 $20,439 $/tonne CO2 Removed
Electricity 1 Case 3: IGCC without Sequestration and GasolineTotal CO2 Released for System 14,651 tonnes CO2/Day
From Renewable Plant to End Users 550 Total Power Available from System 10,148 MWh/dayElectricity 1 Total Annual Cost (Capital + O&M) $240,072,519 $/year
Cost of Mitigation over Case 1 #N/A $/tonne CO2 RemovedFrom Hydrolysis Plant to Methanol Plant 600 Case 4: IGCC with Sequestration and Gasoline
Hydrogen 1 Total CO2 Released for System 6,710 tonnes CO2/DayTotal Power Available from System 10,148 MWh/day
From Hyrolysis Plant to Fossil Plant 815 Total Annual Cost (Capital + O&M) $240,111,231 $/yearOxygen 1 Cost of Mitigation over Case 1 $93,362 $/tonne CO2 Removed
Case 5: NGCC with Sequestration and with M85 and PhotoVoltaicFrom Methanol Plant to M85 Mixing T&D 0 Total CO2 Released for System 4,776 tonnes CO2/Day
Methanol 1 Total Power Available from System 8,074 MWh/dayTotal Annual Cost (Capital + O&M) $1,838,169,778 $/year
From Gasoline Plant to M85 Mixing T&D 0 Cost of Mitigation over Case 1 $408,015 $/tonne CO2 RemovedGasoline 1 Case 6: IGCC with Sequestration and with M85 and PhotoVoltaic
Total CO2 Released for System 6,113 tonnes CO2/DayFrom M85 Mixing T&D to End User 0 Total Power Available from System 10,514 MWh/day
M85 1 Total Annual Cost (Capital + O&M) $2,289,459,673 $/yearCost of Mitigation over Case 1 $722,620 $/tonne CO2 Removed
From M85 Mixing T&D to End User 0 Case 7: PhotoVoltaic with GasolineGasoline 1 Total CO2 Released for System 4,718 tonnes CO2/Day
Total Power Available from System 3,931 MWh/dayFrom Coal Mine to Fossil Plant 650 Total Annual Cost (Capital + O&M) $279,163,139 $/year
Coal 3 Cost of Mitigation over Case 1 $61,167 $/tonne CO2 Removed
From Natural Gas Well to Fossil Plant 2,400Natural Gas 1
From Water Source to Hydrolysis Plant 0Water 1
Scenarios2results.xls SWUSA Page 3 24/10/2003 15:27
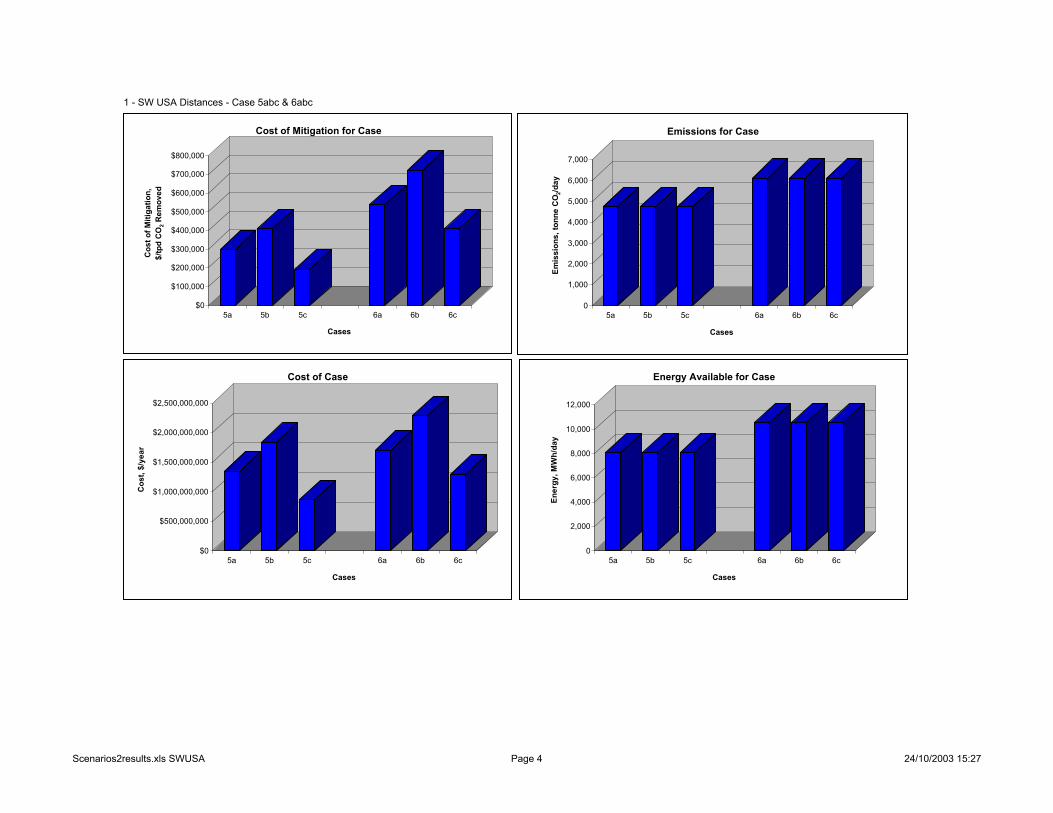
1 - SW USA Distances - Case 5abc & 6abc
$0
$500,000,000
$1,000,000,000
$1,500,000,000
$2,000,000,000
$2,500,000,000
Cos
t, $/
year
5a 5b 5c 6a 6b 6c
Cases
Cost of Case
0
1,000
2,000
3,000
4,000
5,000
6,000
7,000
Emis
sion
s, to
nne
CO
2/day
5a 5b 5c 6a 6b 6c
Cases
Emissions for Case
0
2,000
4,000
6,000
8,000
10,000
12,000
Ener
gy, M
Wh/
day
5a 5b 5c 6a 6b 6c
Cases
Energy Available for Case
$0
$100,000
$200,000
$300,000
$400,000
$500,000
$600,000
$700,000
$800,000C
ost o
f Miti
gatio
n,
$/tp
d C
O2 R
emov
ed
5a 5b 5c 6a 6b 6c
Cases
Cost of Mitigation for Case
Scenarios2results.xls SWUSA Page 4 24/10/2003 15:27
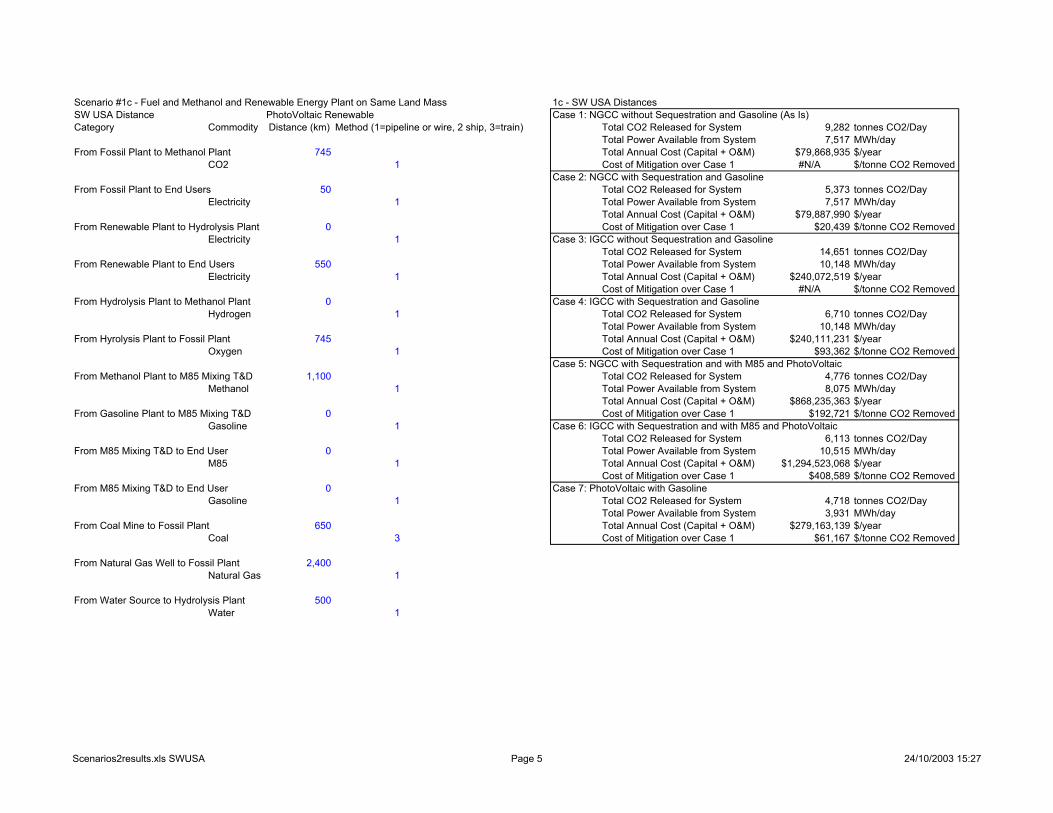
Scenario #1c - Fuel and Methanol and Renewable Energy Plant on Same Land Mass 1c - SW USA DistancesSW USA Distance PhotoVoltaic Renewable Case 1: NGCC without Sequestration and Gasoline (As Is)Category Commodity Distance (km) Method (1=pipeline or wire, 2 ship, 3=train) Total CO2 Released for System 9,282 tonnes CO2/Day
Total Power Available from System 7,517 MWh/dayFrom Fossil Plant to Methanol Plant 745 Total Annual Cost (Capital + O&M) $79,868,935 $/year
CO2 1 Cost of Mitigation over Case 1 #N/A $/tonne CO2 RemovedCase 2: NGCC with Sequestration and Gasoline
From Fossil Plant to End Users 50 Total CO2 Released for System 5,373 tonnes CO2/DayElectricity 1 Total Power Available from System 7,517 MWh/day
Total Annual Cost (Capital + O&M) $79,887,990 $/yearFrom Renewable Plant to Hydrolysis Plant 0 Cost of Mitigation over Case 1 $20,439 $/tonne CO2 Removed
Electricity 1 Case 3: IGCC without Sequestration and GasolineTotal CO2 Released for System 14,651 tonnes CO2/Day
From Renewable Plant to End Users 550 Total Power Available from System 10,148 MWh/dayElectricity 1 Total Annual Cost (Capital + O&M) $240,072,519 $/year
Cost of Mitigation over Case 1 #N/A $/tonne CO2 RemovedFrom Hydrolysis Plant to Methanol Plant 0 Case 4: IGCC with Sequestration and Gasoline
Hydrogen 1 Total CO2 Released for System 6,710 tonnes CO2/DayTotal Power Available from System 10,148 MWh/day
From Hyrolysis Plant to Fossil Plant 745 Total Annual Cost (Capital + O&M) $240,111,231 $/yearOxygen 1 Cost of Mitigation over Case 1 $93,362 $/tonne CO2 Removed
Case 5: NGCC with Sequestration and with M85 and PhotoVoltaicFrom Methanol Plant to M85 Mixing T&D 1,100 Total CO2 Released for System 4,776 tonnes CO2/Day
Methanol 1 Total Power Available from System 8,075 MWh/dayTotal Annual Cost (Capital + O&M) $868,235,363 $/year
From Gasoline Plant to M85 Mixing T&D 0 Cost of Mitigation over Case 1 $192,721 $/tonne CO2 RemovedGasoline 1 Case 6: IGCC with Sequestration and with M85 and PhotoVoltaic
Total CO2 Released for System 6,113 tonnes CO2/DayFrom M85 Mixing T&D to End User 0 Total Power Available from System 10,515 MWh/day
M85 1 Total Annual Cost (Capital + O&M) $1,294,523,068 $/yearCost of Mitigation over Case 1 $408,589 $/tonne CO2 Removed
From M85 Mixing T&D to End User 0 Case 7: PhotoVoltaic with GasolineGasoline 1 Total CO2 Released for System 4,718 tonnes CO2/Day
Total Power Available from System 3,931 MWh/dayFrom Coal Mine to Fossil Plant 650 Total Annual Cost (Capital + O&M) $279,163,139 $/year
Coal 3 Cost of Mitigation over Case 1 $61,167 $/tonne CO2 Removed
From Natural Gas Well to Fossil Plant 2,400Natural Gas 1
From Water Source to Hydrolysis Plant 500Water 1
Scenarios2results.xls SWUSA Page 5 24/10/2003 15:27
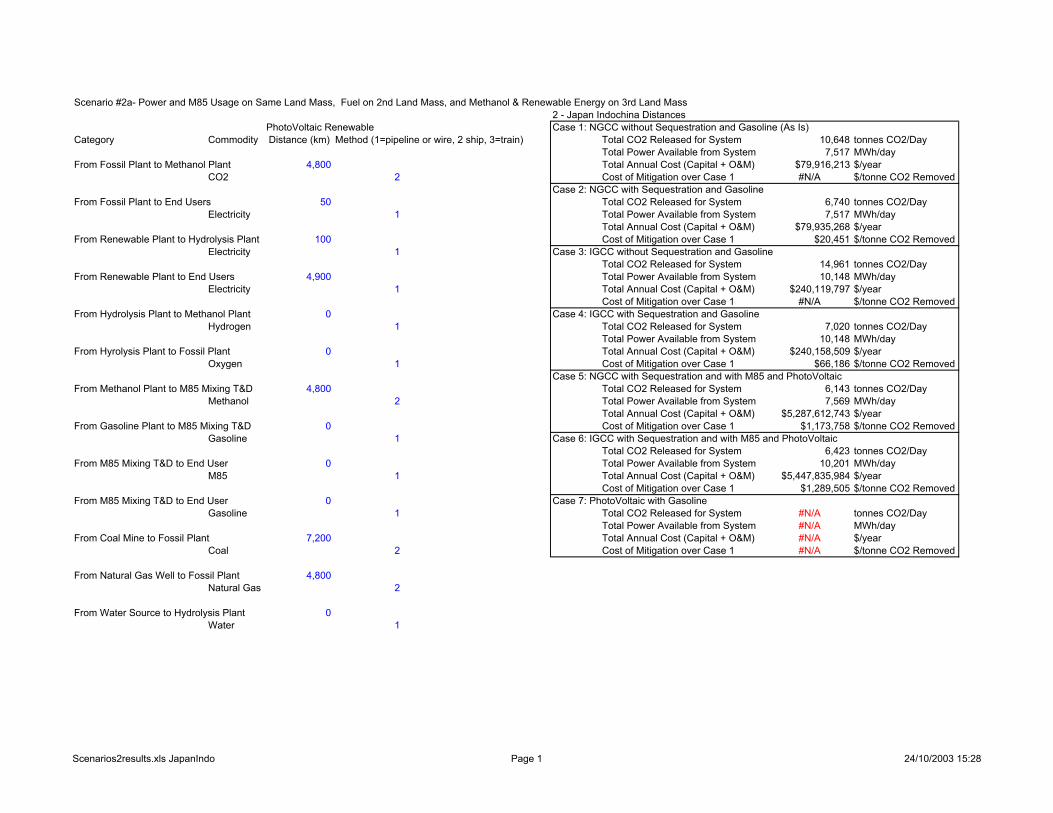
Scenario #2a- Power and M85 Usage on Same Land Mass, Fuel on 2nd Land Mass, and Methanol & Renewable Energy on 3rd Land Mass2 - Japan Indochina Distances
PhotoVoltaic Renewable Case 1: NGCC without Sequestration and Gasoline (As Is)Category Commodity Distance (km) Method (1=pipeline or wire, 2 ship, 3=train) Total CO2 Released for System 10,648 tonnes CO2/Day
Total Power Available from System 7,517 MWh/dayFrom Fossil Plant to Methanol Plant 4,800 Total Annual Cost (Capital + O&M) $79,916,213 $/year
CO2 2 Cost of Mitigation over Case 1 #N/A $/tonne CO2 RemovedCase 2: NGCC with Sequestration and Gasoline
From Fossil Plant to End Users 50 Total CO2 Released for System 6,740 tonnes CO2/DayElectricity 1 Total Power Available from System 7,517 MWh/day
Total Annual Cost (Capital + O&M) $79,935,268 $/yearFrom Renewable Plant to Hydrolysis Plant 100 Cost of Mitigation over Case 1 $20,451 $/tonne CO2 Removed
Electricity 1 Case 3: IGCC without Sequestration and GasolineTotal CO2 Released for System 14,961 tonnes CO2/Day
From Renewable Plant to End Users 4,900 Total Power Available from System 10,148 MWh/dayElectricity 1 Total Annual Cost (Capital + O&M) $240,119,797 $/year
Cost of Mitigation over Case 1 #N/A $/tonne CO2 RemovedFrom Hydrolysis Plant to Methanol Plant 0 Case 4: IGCC with Sequestration and Gasoline
Hydrogen 1 Total CO2 Released for System 7,020 tonnes CO2/DayTotal Power Available from System 10,148 MWh/day
From Hyrolysis Plant to Fossil Plant 0 Total Annual Cost (Capital + O&M) $240,158,509 $/yearOxygen 1 Cost of Mitigation over Case 1 $66,186 $/tonne CO2 Removed
Case 5: NGCC with Sequestration and with M85 and PhotoVoltaicFrom Methanol Plant to M85 Mixing T&D 4,800 Total CO2 Released for System 6,143 tonnes CO2/Day
Methanol 2 Total Power Available from System 7,569 MWh/dayTotal Annual Cost (Capital + O&M) $5,287,612,743 $/year
From Gasoline Plant to M85 Mixing T&D 0 Cost of Mitigation over Case 1 $1,173,758 $/tonne CO2 RemovedGasoline 1 Case 6: IGCC with Sequestration and with M85 and PhotoVoltaic
Total CO2 Released for System 6,423 tonnes CO2/DayFrom M85 Mixing T&D to End User 0 Total Power Available from System 10,201 MWh/day
M85 1 Total Annual Cost (Capital + O&M) $5,447,835,984 $/yearCost of Mitigation over Case 1 $1,289,505 $/tonne CO2 Removed
From M85 Mixing T&D to End User 0 Case 7: PhotoVoltaic with GasolineGasoline 1 Total CO2 Released for System #N/A tonnes CO2/Day
Total Power Available from System #N/A MWh/dayFrom Coal Mine to Fossil Plant 7,200 Total Annual Cost (Capital + O&M) #N/A $/year
Coal 2 Cost of Mitigation over Case 1 #N/A $/tonne CO2 Removed
From Natural Gas Well to Fossil Plant 4,800Natural Gas 2
From Water Source to Hydrolysis Plant 0Water 1
Scenarios2results.xls JapanIndo Page 1 24/10/2003 15:28
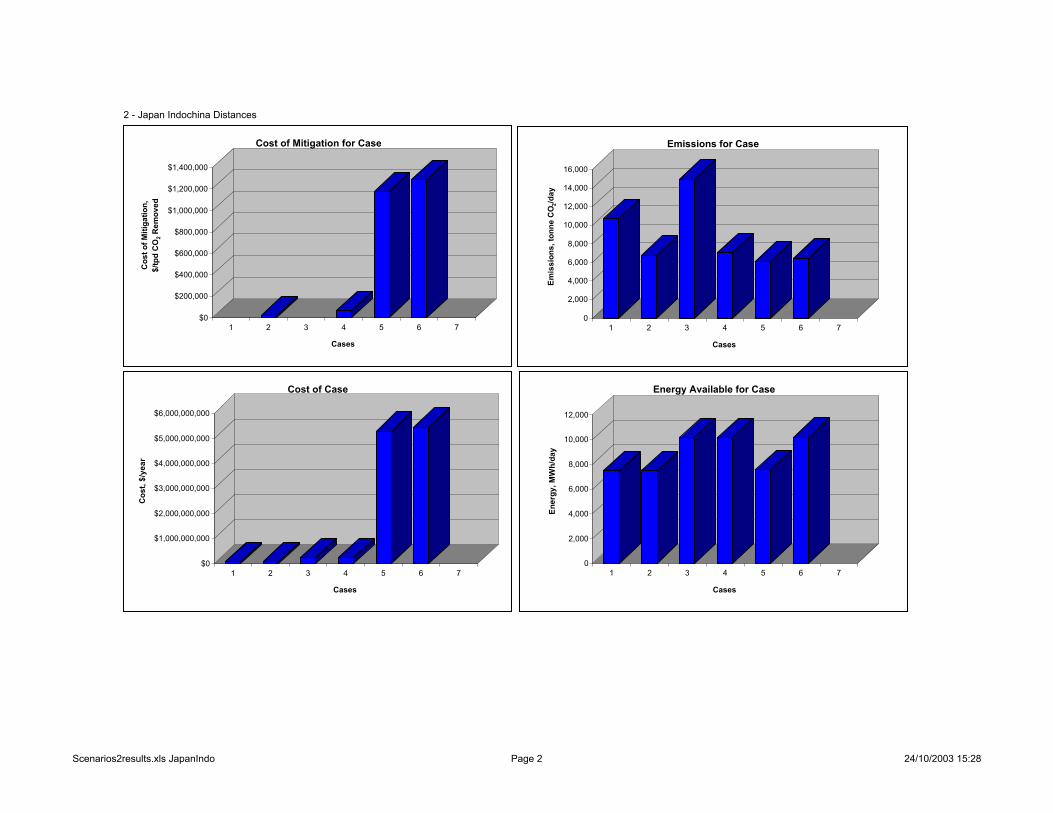
2 - Japan Indochina Distances
$0
$1,000,000,000
$2,000,000,000
$3,000,000,000
$4,000,000,000
$5,000,000,000
$6,000,000,000
Cos
t, $/
year
1 2 3 4 5 6 7
Cases
Cost of Case
0
2,000
4,000
6,000
8,000
10,000
12,000
14,000
16,000
Emis
sion
s, to
nne
CO
2/day
1 2 3 4 5 6 7
Cases
Emissions for Case
$0
$200,000
$400,000
$600,000
$800,000
$1,000,000
$1,200,000
$1,400,000
Cos
t of M
itiga
tion,
$/
tpd
CO
2 Rem
oved
1 2 3 4 5 6 7
Cases
Cost of Mitigation for Case
0
2,000
4,000
6,000
8,000
10,000
12,000
Ener
gy, M
Wh/
day
1 2 3 4 5 6 7
Cases
Energy Available for Case
Scenarios2results.xls JapanIndo Page 2 24/10/2003 15:28
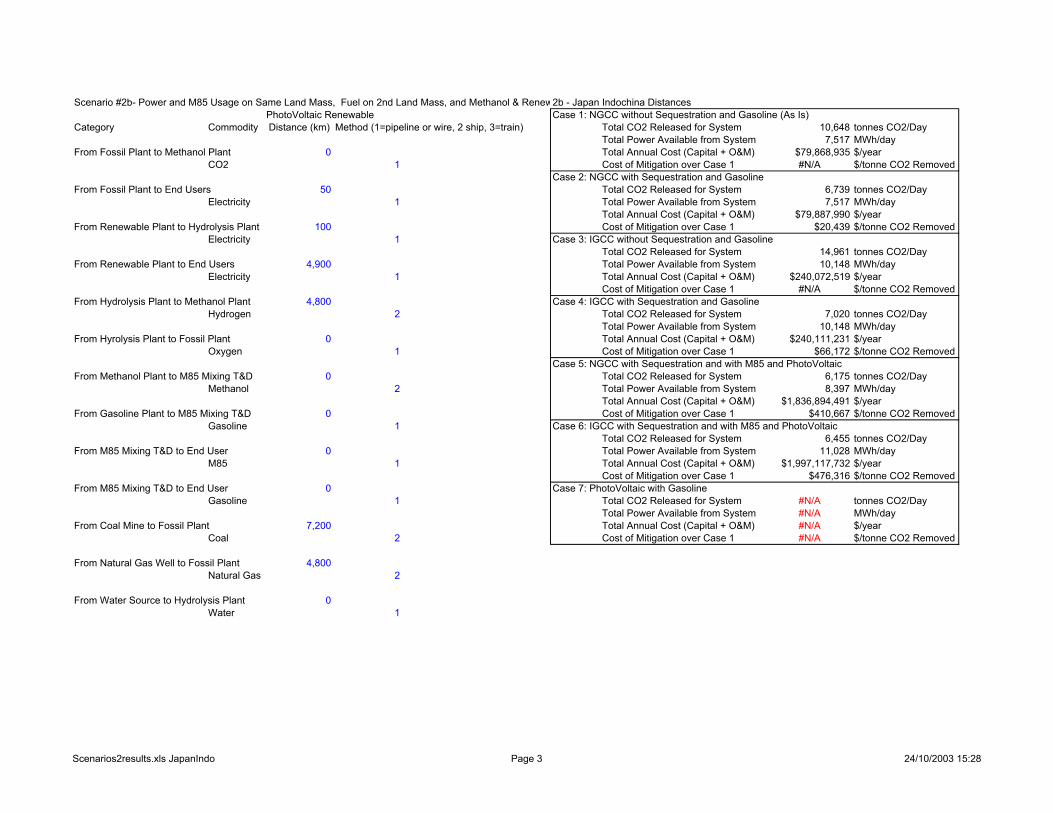
Scenario #2b- Power and M85 Usage on Same Land Mass, Fuel on 2nd Land Mass, and Methanol & Renew2b - Japan Indochina DistancesPhotoVoltaic Renewable Case 1: NGCC without Sequestration and Gasoline (As Is)
Category Commodity Distance (km) Method (1=pipeline or wire, 2 ship, 3=train) Total CO2 Released for System 10,648 tonnes CO2/DayTotal Power Available from System 7,517 MWh/day
From Fossil Plant to Methanol Plant 0 Total Annual Cost (Capital + O&M) $79,868,935 $/yearCO2 1 Cost of Mitigation over Case 1 #N/A $/tonne CO2 Removed
Case 2: NGCC with Sequestration and GasolineFrom Fossil Plant to End Users 50 Total CO2 Released for System 6,739 tonnes CO2/Day
Electricity 1 Total Power Available from System 7,517 MWh/dayTotal Annual Cost (Capital + O&M) $79,887,990 $/year
From Renewable Plant to Hydrolysis Plant 100 Cost of Mitigation over Case 1 $20,439 $/tonne CO2 RemovedElectricity 1 Case 3: IGCC without Sequestration and Gasoline
Total CO2 Released for System 14,961 tonnes CO2/DayFrom Renewable Plant to End Users 4,900 Total Power Available from System 10,148 MWh/day
Electricity 1 Total Annual Cost (Capital + O&M) $240,072,519 $/yearCost of Mitigation over Case 1 #N/A $/tonne CO2 Removed
From Hydrolysis Plant to Methanol Plant 4,800 Case 4: IGCC with Sequestration and GasolineHydrogen 2 Total CO2 Released for System 7,020 tonnes CO2/Day
Total Power Available from System 10,148 MWh/dayFrom Hyrolysis Plant to Fossil Plant 0 Total Annual Cost (Capital + O&M) $240,111,231 $/year
Oxygen 1 Cost of Mitigation over Case 1 $66,172 $/tonne CO2 RemovedCase 5: NGCC with Sequestration and with M85 and PhotoVoltaic
From Methanol Plant to M85 Mixing T&D 0 Total CO2 Released for System 6,175 tonnes CO2/DayMethanol 2 Total Power Available from System 8,397 MWh/day
Total Annual Cost (Capital + O&M) $1,836,894,491 $/yearFrom Gasoline Plant to M85 Mixing T&D 0 Cost of Mitigation over Case 1 $410,667 $/tonne CO2 Removed
Gasoline 1 Case 6: IGCC with Sequestration and with M85 and PhotoVoltaicTotal CO2 Released for System 6,455 tonnes CO2/Day
From M85 Mixing T&D to End User 0 Total Power Available from System 11,028 MWh/dayM85 1 Total Annual Cost (Capital + O&M) $1,997,117,732 $/year
Cost of Mitigation over Case 1 $476,316 $/tonne CO2 RemovedFrom M85 Mixing T&D to End User 0 Case 7: PhotoVoltaic with Gasoline
Gasoline 1 Total CO2 Released for System #N/A tonnes CO2/DayTotal Power Available from System #N/A MWh/day
From Coal Mine to Fossil Plant 7,200 Total Annual Cost (Capital + O&M) #N/A $/yearCoal 2 Cost of Mitigation over Case 1 #N/A $/tonne CO2 Removed
From Natural Gas Well to Fossil Plant 4,800Natural Gas 2
From Water Source to Hydrolysis Plant 0Water 1
Scenarios2results.xls JapanIndo Page 3 24/10/2003 15:28
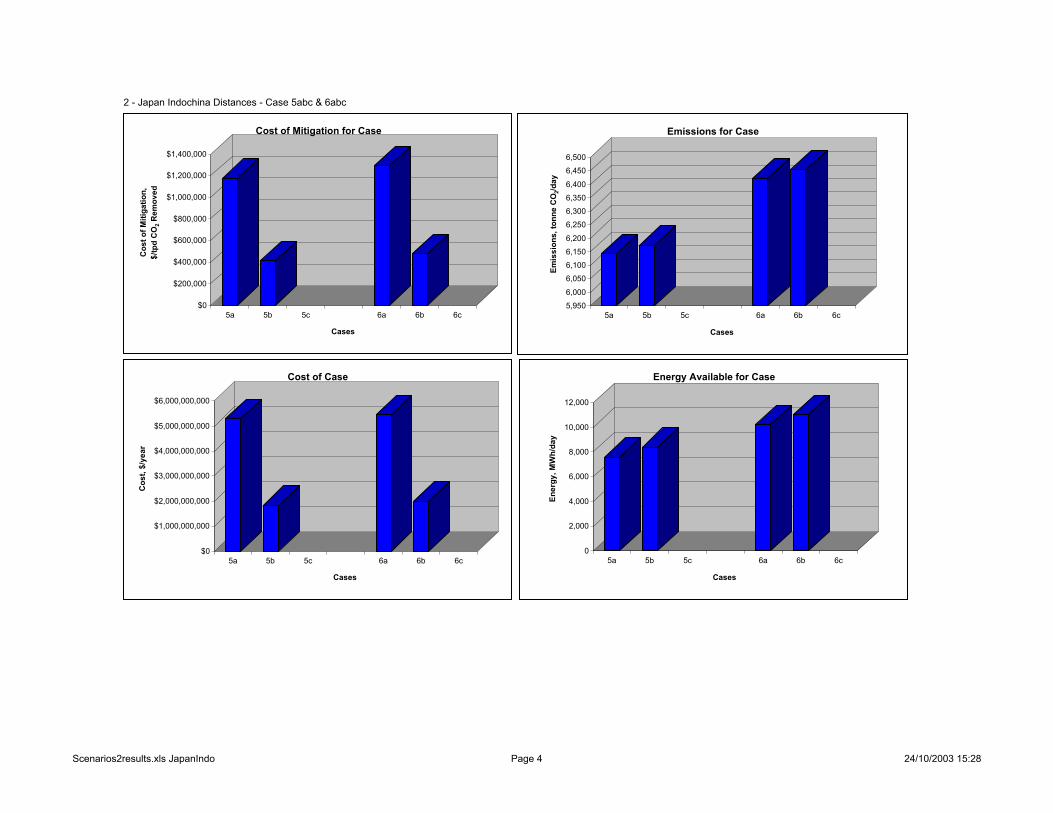
2 - Japan Indochina Distances - Case 5abc & 6abc
$0
$1,000,000,000
$2,000,000,000
$3,000,000,000
$4,000,000,000
$5,000,000,000
$6,000,000,000
Cos
t, $/
year
5a 5b 5c 6a 6b 6c
Cases
Cost of Case
5,9506,000
6,0506,1006,1506,200
6,2506,3006,3506,400
6,4506,500
Emis
sion
s, to
nne
CO
2/day
5a 5b 5c 6a 6b 6c
Cases
Emissions for Case
0
2,000
4,000
6,000
8,000
10,000
12,000
Ener
gy, M
Wh/
day
5a 5b 5c 6a 6b 6c
Cases
Energy Available for Case
$0
$200,000
$400,000
$600,000
$800,000
$1,000,000
$1,200,000
$1,400,000C
ost o
f Miti
gatio
n,
$/tp
d C
O2 R
emov
ed
5a 5b 5c 6a 6b 6c
Cases
Cost of Mitigation for Case
Scenarios2results.xls JapanIndo Page 4 24/10/2003 15:28
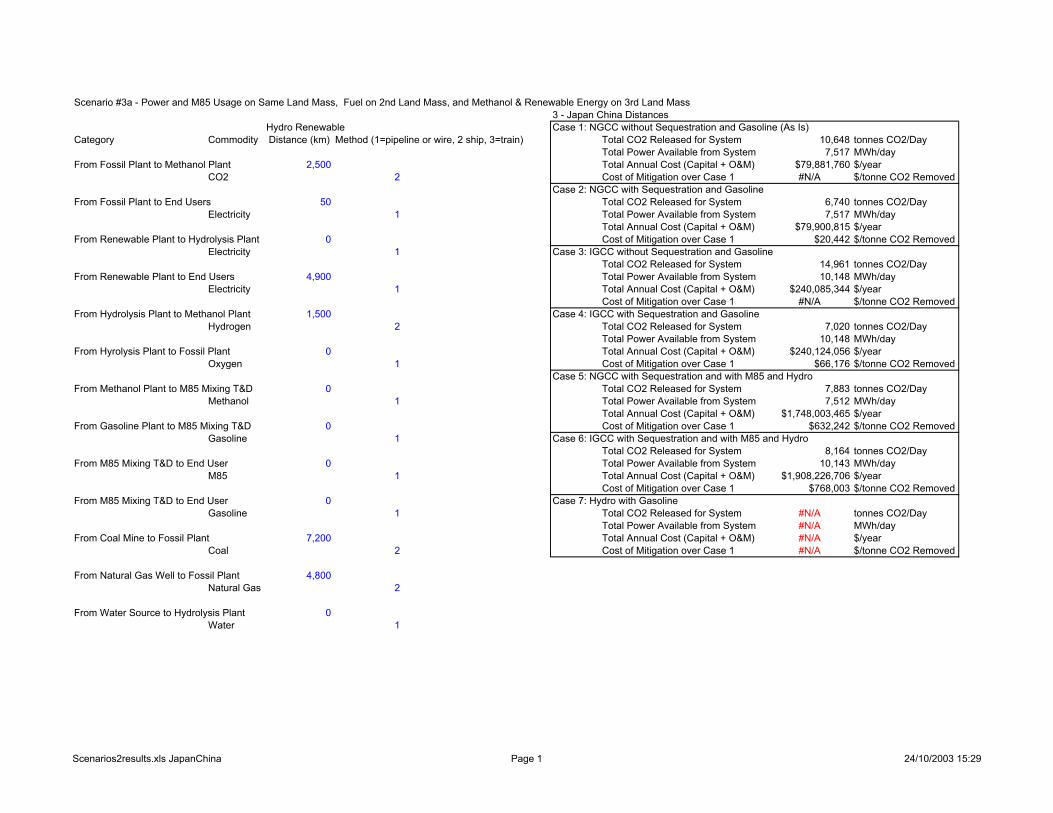
Scenario #3a - Power and M85 Usage on Same Land Mass, Fuel on 2nd Land Mass, and Methanol & Renewable Energy on 3rd Land Mass3 - Japan China Distances
Hydro Renewable Case 1: NGCC without Sequestration and Gasoline (As Is)Category Commodity Distance (km) Method (1=pipeline or wire, 2 ship, 3=train) Total CO2 Released for System 10,648 tonnes CO2/Day
Total Power Available from System 7,517 MWh/dayFrom Fossil Plant to Methanol Plant 2,500 Total Annual Cost (Capital + O&M) $79,881,760 $/year
CO2 2 Cost of Mitigation over Case 1 #N/A $/tonne CO2 RemovedCase 2: NGCC with Sequestration and Gasoline
From Fossil Plant to End Users 50 Total CO2 Released for System 6,740 tonnes CO2/DayElectricity 1 Total Power Available from System 7,517 MWh/day
Total Annual Cost (Capital + O&M) $79,900,815 $/yearFrom Renewable Plant to Hydrolysis Plant 0 Cost of Mitigation over Case 1 $20,442 $/tonne CO2 Removed
Electricity 1 Case 3: IGCC without Sequestration and GasolineTotal CO2 Released for System 14,961 tonnes CO2/Day
From Renewable Plant to End Users 4,900 Total Power Available from System 10,148 MWh/dayElectricity 1 Total Annual Cost (Capital + O&M) $240,085,344 $/year
Cost of Mitigation over Case 1 #N/A $/tonne CO2 RemovedFrom Hydrolysis Plant to Methanol Plant 1,500 Case 4: IGCC with Sequestration and Gasoline
Hydrogen 2 Total CO2 Released for System 7,020 tonnes CO2/DayTotal Power Available from System 10,148 MWh/day
From Hyrolysis Plant to Fossil Plant 0 Total Annual Cost (Capital + O&M) $240,124,056 $/yearOxygen 1 Cost of Mitigation over Case 1 $66,176 $/tonne CO2 Removed
Case 5: NGCC with Sequestration and with M85 and HydroFrom Methanol Plant to M85 Mixing T&D 0 Total CO2 Released for System 7,883 tonnes CO2/Day
Methanol 1 Total Power Available from System 7,512 MWh/dayTotal Annual Cost (Capital + O&M) $1,748,003,465 $/year
From Gasoline Plant to M85 Mixing T&D 0 Cost of Mitigation over Case 1 $632,242 $/tonne CO2 RemovedGasoline 1 Case 6: IGCC with Sequestration and with M85 and Hydro
Total CO2 Released for System 8,164 tonnes CO2/DayFrom M85 Mixing T&D to End User 0 Total Power Available from System 10,143 MWh/day
M85 1 Total Annual Cost (Capital + O&M) $1,908,226,706 $/yearCost of Mitigation over Case 1 $768,003 $/tonne CO2 Removed
From M85 Mixing T&D to End User 0 Case 7: Hydro with GasolineGasoline 1 Total CO2 Released for System #N/A tonnes CO2/Day
Total Power Available from System #N/A MWh/dayFrom Coal Mine to Fossil Plant 7,200 Total Annual Cost (Capital + O&M) #N/A $/year
Coal 2 Cost of Mitigation over Case 1 #N/A $/tonne CO2 Removed
From Natural Gas Well to Fossil Plant 4,800Natural Gas 2
From Water Source to Hydrolysis Plant 0Water 1
Scenarios2results.xls JapanChina Page 1 24/10/2003 15:29
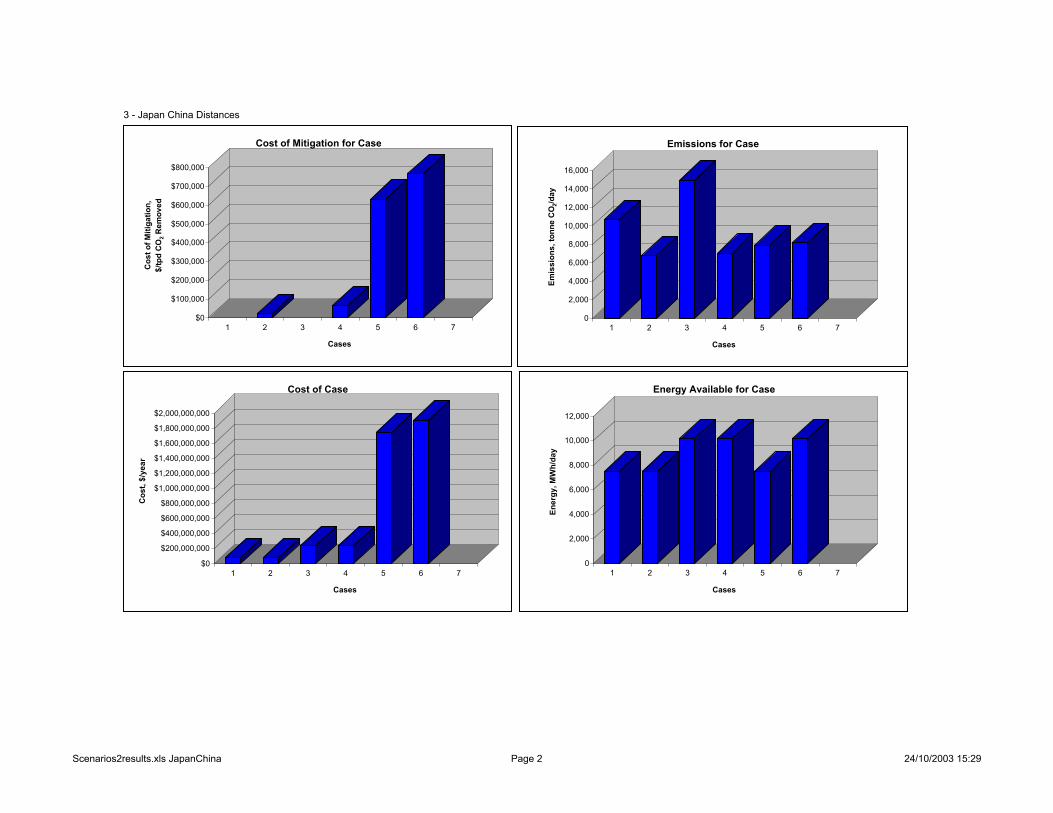
3 - Japan China Distances
$0
$200,000,000
$400,000,000
$600,000,000
$800,000,000
$1,000,000,000
$1,200,000,000
$1,400,000,000
$1,600,000,000
$1,800,000,000
$2,000,000,000
Cos
t, $/
year
1 2 3 4 5 6 7
Cases
Cost of Case
0
2,000
4,000
6,000
8,000
10,000
12,000
14,000
16,000
Emis
sion
s, to
nne
CO
2/day
1 2 3 4 5 6 7
Cases
Emissions for Case
$0
$100,000
$200,000
$300,000
$400,000
$500,000
$600,000
$700,000
$800,000
Cos
t of M
itiga
tion,
$/
tpd
CO
2 Rem
oved
1 2 3 4 5 6 7
Cases
Cost of Mitigation for Case
0
2,000
4,000
6,000
8,000
10,000
12,000
Ener
gy, M
Wh/
day
1 2 3 4 5 6 7
Cases
Energy Available for Case
Scenarios2results.xls JapanChina Page 2 24/10/2003 15:29
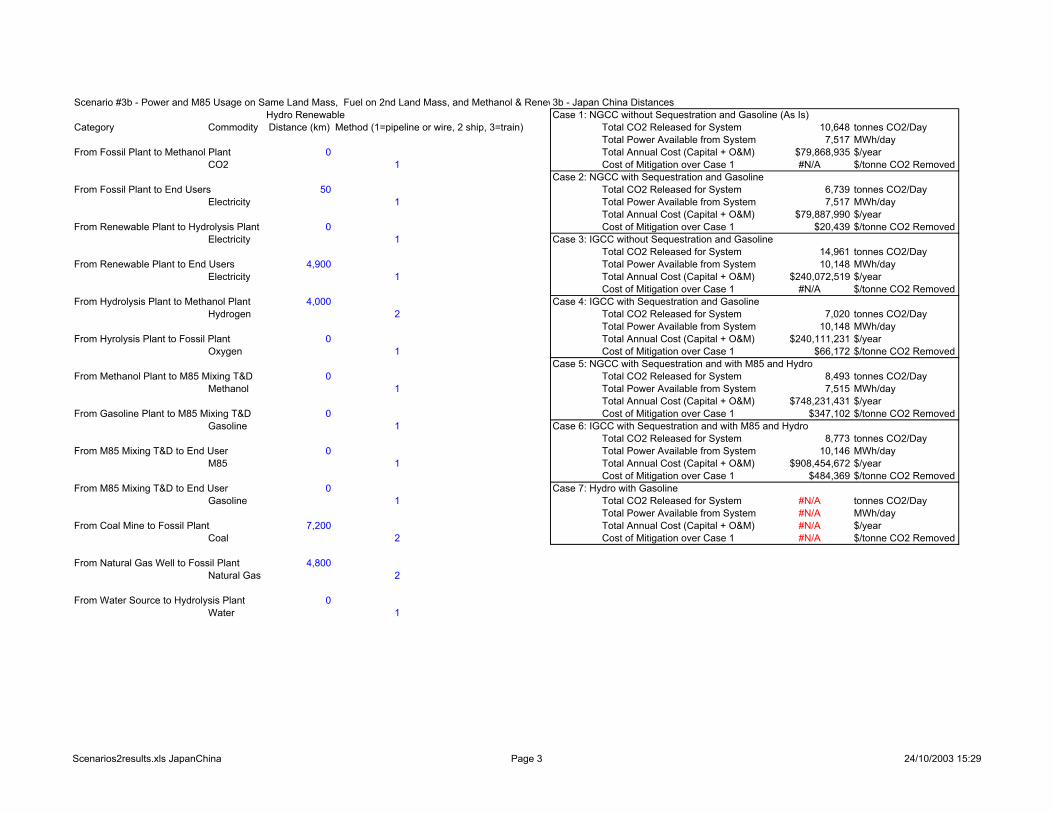
Scenario #3b - Power and M85 Usage on Same Land Mass, Fuel on 2nd Land Mass, and Methanol & Renew3b - Japan China DistancesHydro Renewable Case 1: NGCC without Sequestration and Gasoline (As Is)
Category Commodity Distance (km) Method (1=pipeline or wire, 2 ship, 3=train) Total CO2 Released for System 10,648 tonnes CO2/DayTotal Power Available from System 7,517 MWh/day
From Fossil Plant to Methanol Plant 0 Total Annual Cost (Capital + O&M) $79,868,935 $/yearCO2 1 Cost of Mitigation over Case 1 #N/A $/tonne CO2 Removed
Case 2: NGCC with Sequestration and GasolineFrom Fossil Plant to End Users 50 Total CO2 Released for System 6,739 tonnes CO2/Day
Electricity 1 Total Power Available from System 7,517 MWh/dayTotal Annual Cost (Capital + O&M) $79,887,990 $/year
From Renewable Plant to Hydrolysis Plant 0 Cost of Mitigation over Case 1 $20,439 $/tonne CO2 RemovedElectricity 1 Case 3: IGCC without Sequestration and Gasoline
Total CO2 Released for System 14,961 tonnes CO2/DayFrom Renewable Plant to End Users 4,900 Total Power Available from System 10,148 MWh/day
Electricity 1 Total Annual Cost (Capital + O&M) $240,072,519 $/yearCost of Mitigation over Case 1 #N/A $/tonne CO2 Removed
From Hydrolysis Plant to Methanol Plant 4,000 Case 4: IGCC with Sequestration and GasolineHydrogen 2 Total CO2 Released for System 7,020 tonnes CO2/Day
Total Power Available from System 10,148 MWh/dayFrom Hyrolysis Plant to Fossil Plant 0 Total Annual Cost (Capital + O&M) $240,111,231 $/year
Oxygen 1 Cost of Mitigation over Case 1 $66,172 $/tonne CO2 RemovedCase 5: NGCC with Sequestration and with M85 and Hydro
From Methanol Plant to M85 Mixing T&D 0 Total CO2 Released for System 8,493 tonnes CO2/DayMethanol 1 Total Power Available from System 7,515 MWh/day
Total Annual Cost (Capital + O&M) $748,231,431 $/yearFrom Gasoline Plant to M85 Mixing T&D 0 Cost of Mitigation over Case 1 $347,102 $/tonne CO2 Removed
Gasoline 1 Case 6: IGCC with Sequestration and with M85 and HydroTotal CO2 Released for System 8,773 tonnes CO2/Day
From M85 Mixing T&D to End User 0 Total Power Available from System 10,146 MWh/dayM85 1 Total Annual Cost (Capital + O&M) $908,454,672 $/year
Cost of Mitigation over Case 1 $484,369 $/tonne CO2 RemovedFrom M85 Mixing T&D to End User 0 Case 7: Hydro with Gasoline
Gasoline 1 Total CO2 Released for System #N/A tonnes CO2/DayTotal Power Available from System #N/A MWh/day
From Coal Mine to Fossil Plant 7,200 Total Annual Cost (Capital + O&M) #N/A $/yearCoal 2 Cost of Mitigation over Case 1 #N/A $/tonne CO2 Removed
From Natural Gas Well to Fossil Plant 4,800Natural Gas 2
From Water Source to Hydrolysis Plant 0Water 1
Scenarios2results.xls JapanChina Page 3 24/10/2003 15:29
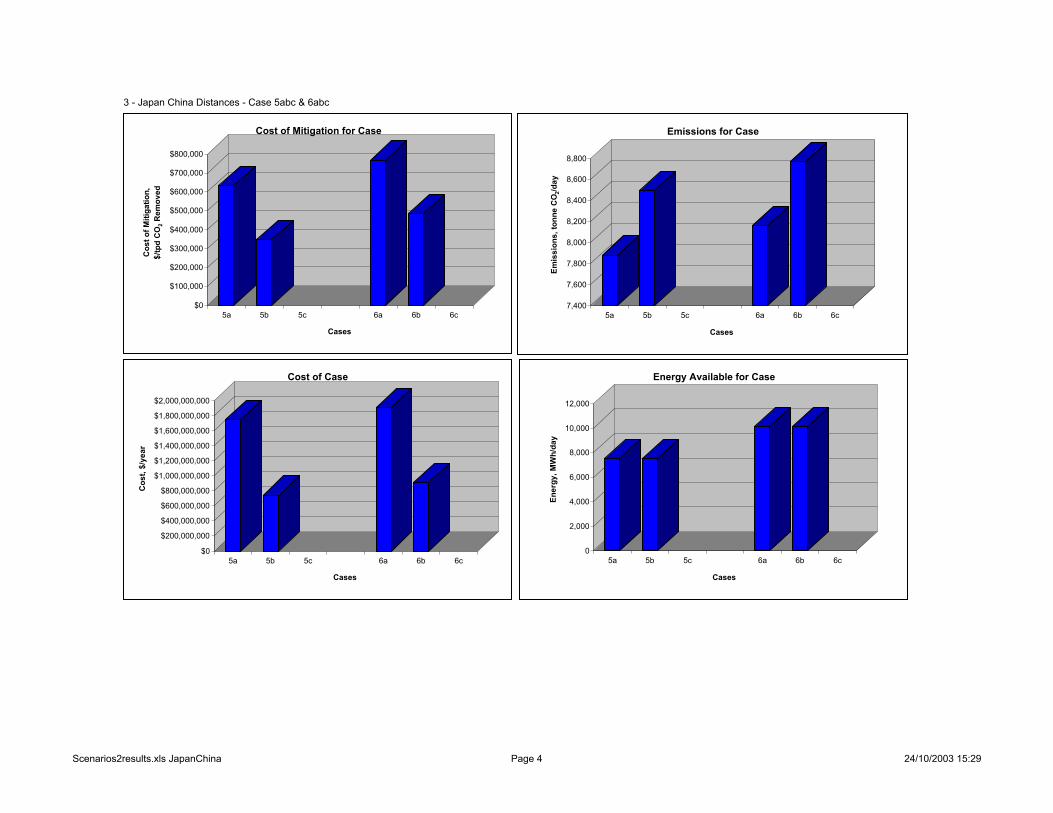
3 - Japan China Distances - Case 5abc & 6abc
$0
$200,000,000
$400,000,000
$600,000,000
$800,000,000
$1,000,000,000
$1,200,000,000
$1,400,000,000
$1,600,000,000
$1,800,000,000
$2,000,000,000
Cos
t, $/
year
5a 5b 5c 6a 6b 6c
Cases
Cost of Case
7,400
7,600
7,800
8,000
8,200
8,400
8,600
8,800
Emis
sion
s, to
nne
CO
2/day
5a 5b 5c 6a 6b 6c
Cases
Emissions for Case
0
2,000
4,000
6,000
8,000
10,000
12,000
Ener
gy, M
Wh/
day
5a 5b 5c 6a 6b 6c
Cases
Energy Available for Case
$0
$100,000
$200,000
$300,000
$400,000
$500,000
$600,000
$700,000
$800,000C
ost o
f Miti
gatio
n,
$/tp
d C
O2 R
emov
ed
5a 5b 5c 6a 6b 6c
Cases
Cost of Mitigation for Case
Scenarios2results.xls JapanChina Page 4 24/10/2003 15:29

Instruction M85Study.xls
This is a preliminary test version of the calculations. It does not contain the location / optimization portion.
Sheet1: Instructions is a brief discription of the structure of the model and how to use it.Sheet2: Matrix is a list of the data collected and used in this model. Although the numbers are repeated throughout the model they are not automatically tied to this sheetSheet3: Constants is a list of physical property data, conversion factrs, etc. used in the model. Although the numbers are repeated throughout the model they are not automatically tied to this sheetSheet4: DistanceInput is the distance dependent data used in the model. This will eventually be used in the location / optimization portion also. Ths information in blue can be changed by the users.Sheet5: Inputs is the main data entry and selection portion of the model. Ths information in blue can be changed by the users.Sheet6: Calcs is the Material balance and Cost calculation portion of the model. The calculation results appear at the bottom.Sheet7: Flowchart is a graphical representation of the values calculated and presented on the Calcs sheet.Sheet8: Summary is a summary of several cases run at Parsons by changing values on the Inputs sheet. These values and graphs were created manually by saving the results from each case to this sheet. It is not currently automatically updated when new calculations are made. The tonnes removed are calculated using emission values selected from this sheet.
Page 1 24/10/2003 14:54
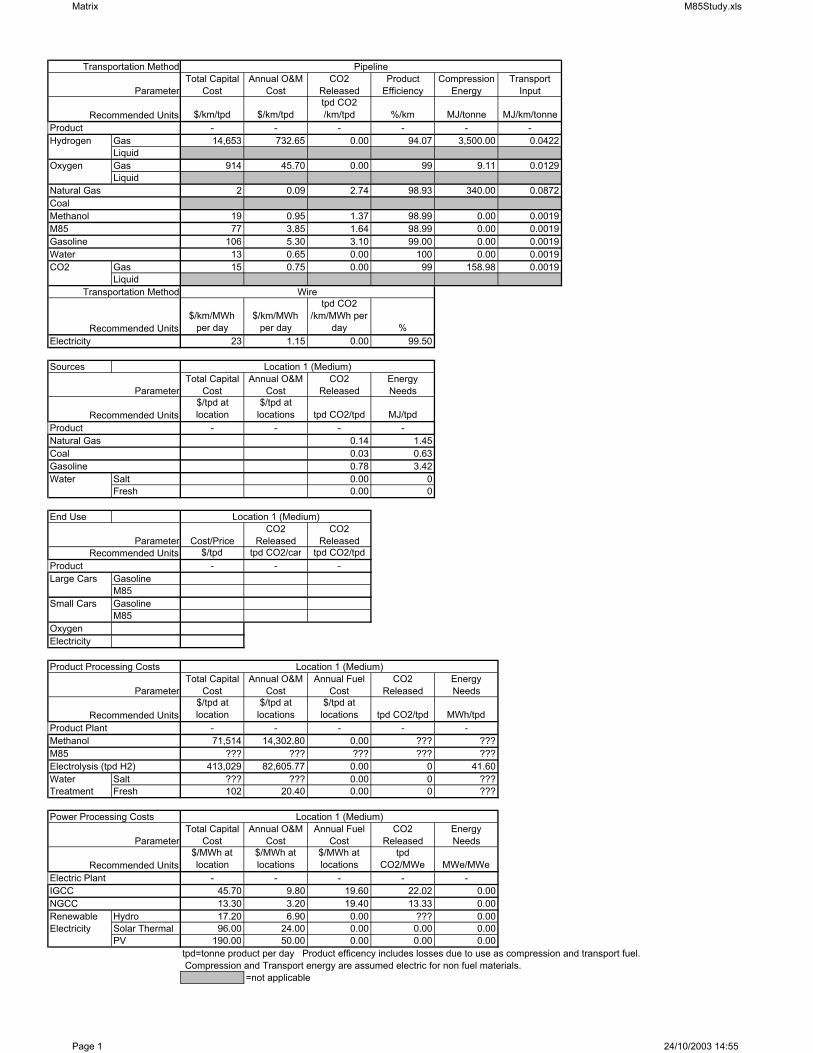
Matrix M85Study.xls
Transportation Method Pipeline
ParameterTotal Capital
CostAnnual O&M
CostCO2
ReleasedProduct
EfficiencyCompression
EnergyTransport
Input
Recommended Units $/km/tpd $/km/tpdtpd CO2 /km/tpd %/km MJ/tonne MJ/km/tonne
Product - - - - - -Hydrogen Gas 14,653 732.65 0.00 94.07 3,500.00 0.0422
LiquidOxygen Gas 914 45.70 0.00 99 9.11 0.0129
LiquidNatural Gas 2 0.09 2.74 98.93 340.00 0.0872CoalMethanol 19 0.95 1.37 98.99 0.00 0.0019M85 77 3.85 1.64 98.99 0.00 0.0019Gasoline 106 5.30 3.10 99.00 0.00 0.0019Water 13 0.65 0.00 100 0.00 0.0019CO2 Gas 15 0.75 0.00 99 158.98 0.0019
LiquidTransportation Method Wire
Recommended Units$/km/MWh
per day$/km/MWh
per day
tpd CO2 /km/MWh per
day %Electricity 23 1.15 0.00 99.50
Sources Location 1 (Medium)
ParameterTotal Capital
CostAnnual O&M
CostCO2
ReleasedEnergy Needs
Recommended Units$/tpd at location
$/tpd at locations tpd CO2/tpd MJ/tpd
Product - - - -Natural Gas 0.14 1.45Coal 0.03 0.63Gasoline 0.78 3.42Water Salt 0.00 0
Fresh 0.00 0
End Use Location 1 (Medium)
Parameter Cost/PriceCO2
ReleasedCO2
ReleasedRecommended Units $/tpd tpd CO2/car tpd CO2/tpd
Product - - -Large Cars Gasoline
M85Small Cars Gasoline
M85OxygenElectricity
Product Processing Costs Location 1 (Medium)
ParameterTotal Capital
CostAnnual O&M
CostAnnual Fuel
CostCO2
ReleasedEnergy Needs
Recommended Units$/tpd at location
$/tpd at locations
$/tpd at locations tpd CO2/tpd MWh/tpd
Product Plant - - - - -Methanol 71,514 14,302.80 0.00 ??? ???M85 ??? ??? ??? ??? ???Electrolysis (tpd H2) 413,029 82,605.77 0.00 0 41.60Water Salt ??? ??? 0.00 0 ???Treatment Fresh 102 20.40 0.00 0 ???
Power Processing Costs Location 1 (Medium)
ParameterTotal Capital
CostAnnual O&M
CostAnnual Fuel
CostCO2
ReleasedEnergy Needs
Recommended Units$/MWh at location
$/MWh at locations
$/MWh at locations
tpd CO2/MWe MWe/MWe
Electric Plant - - - - -IGCC 45.70 9.80 19.60 22.02 0.00NGCC 13.30 3.20 19.40 13.33 0.00Renewable Hydro 17.20 6.90 0.00 ??? 0.00Electricity Solar Thermal 96.00 24.00 0.00 0.00 0.00
PV 190.00 50.00 0.00 0.00 0.00tpd=tonne product per day Product efficency includes losses due to use as compression and transport fuel. Compression and Transport energy are assumed electric for non fuel materials.
=not applicable
Page 1 24/10/2003 14:55
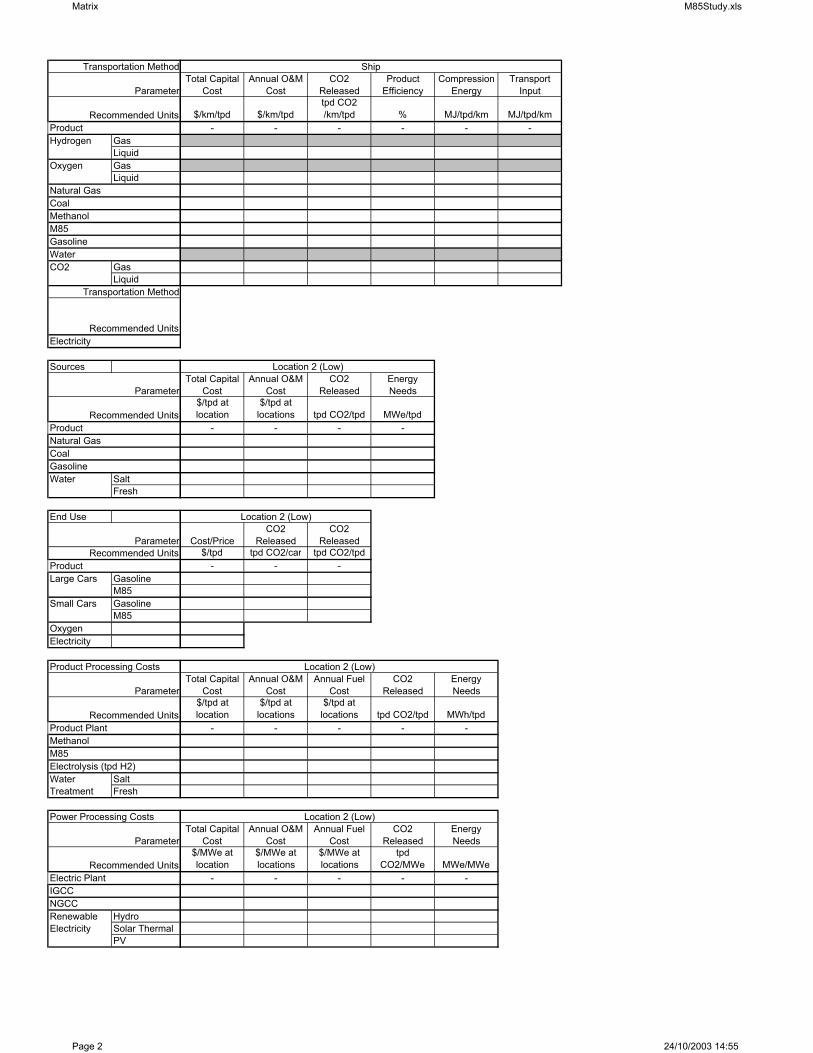
Matrix M85Study.xls
Transportation Method
Parameter
Recommended UnitsProductHydrogen Gas
LiquidOxygen Gas
LiquidNatural GasCoalMethanolM85GasolineWaterCO2 Gas
LiquidTransportation Method
Recommended UnitsElectricity
Sources
Parameter
Recommended UnitsProductNatural GasCoalGasolineWater Salt
Fresh
End Use
ParameterRecommended Units
ProductLarge Cars Gasoline
M85Small Cars Gasoline
M85OxygenElectricity
Product Processing Costs
Parameter
Recommended UnitsProduct PlantMethanolM85Electrolysis (tpd H2)Water SaltTreatment Fresh
Power Processing Costs
Parameter
Recommended UnitsElectric PlantIGCCNGCCRenewable HydroElectricity Solar Thermal
PV
ShipTotal Capital
CostAnnual O&M
CostCO2
ReleasedProduct
EfficiencyCompression
EnergyTransport
Input
$/km/tpd $/km/tpdtpd CO2 /km/tpd % MJ/tpd/km MJ/tpd/km
- - - - - -
Location 2 (Low)Total Capital
CostAnnual O&M
CostCO2
ReleasedEnergy Needs
$/tpd at location
$/tpd at locations tpd CO2/tpd MWe/tpd
- - - -
Location 2 (Low)
Cost/PriceCO2
ReleasedCO2
Released$/tpd tpd CO2/car tpd CO2/tpd
- - -
Location 2 (Low)Total Capital
CostAnnual O&M
CostAnnual Fuel
CostCO2
ReleasedEnergy Needs
$/tpd at location
$/tpd at locations
$/tpd at locations tpd CO2/tpd MWh/tpd
- - - - -
Location 2 (Low)Total Capital
CostAnnual O&M
CostAnnual Fuel
CostCO2
ReleasedEnergy Needs
$/MWe at location
$/MWe at locations
$/MWe at locations
tpd CO2/MWe MWe/MWe
- - - - -
Page 2 24/10/2003 14:55
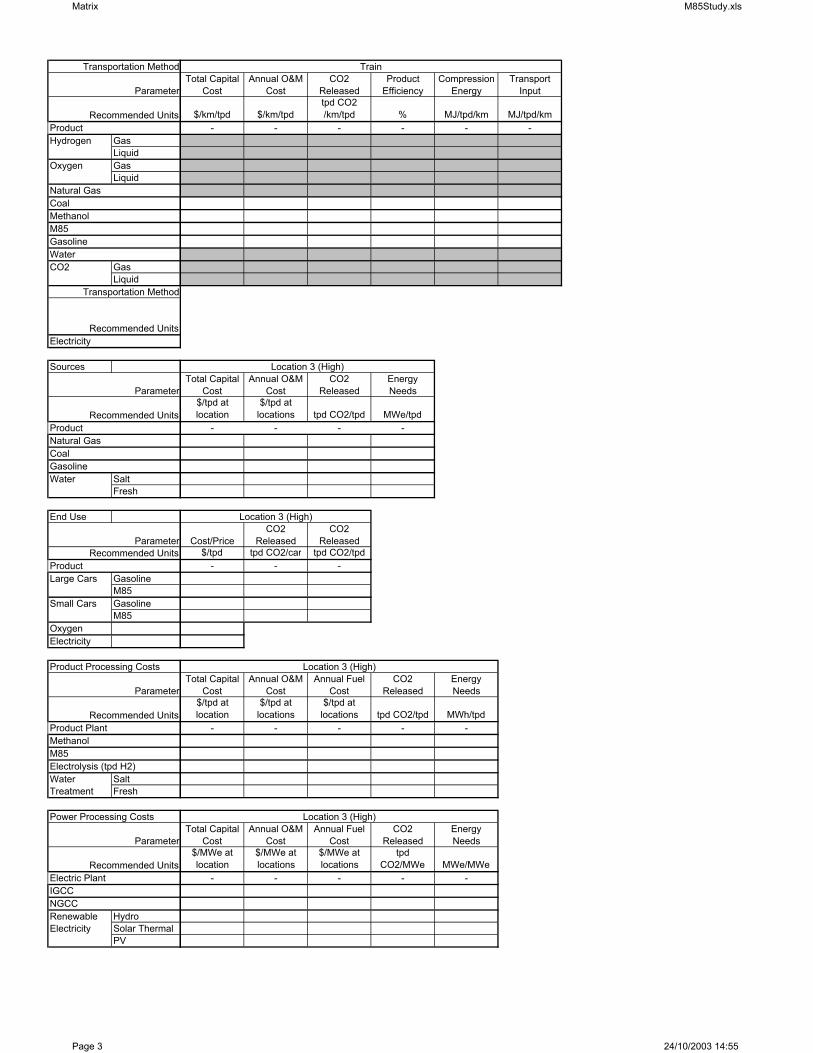
Matrix M85Study.xls
Transportation Method
Parameter
Recommended UnitsProductHydrogen Gas
LiquidOxygen Gas
LiquidNatural GasCoalMethanolM85GasolineWaterCO2 Gas
LiquidTransportation Method
Recommended UnitsElectricity
Sources
Parameter
Recommended UnitsProductNatural GasCoalGasolineWater Salt
Fresh
End Use
ParameterRecommended Units
ProductLarge Cars Gasoline
M85Small Cars Gasoline
M85OxygenElectricity
Product Processing Costs
Parameter
Recommended UnitsProduct PlantMethanolM85Electrolysis (tpd H2)Water SaltTreatment Fresh
Power Processing Costs
Parameter
Recommended UnitsElectric PlantIGCCNGCCRenewable HydroElectricity Solar Thermal
PV
TrainTotal Capital
CostAnnual O&M
CostCO2
ReleasedProduct
EfficiencyCompression
EnergyTransport
Input
$/km/tpd $/km/tpdtpd CO2 /km/tpd % MJ/tpd/km MJ/tpd/km
- - - - - -
Location 3 (High)Total Capital
CostAnnual O&M
CostCO2
ReleasedEnergy Needs
$/tpd at location
$/tpd at locations tpd CO2/tpd MWe/tpd
- - - -
Location 3 (High)
Cost/PriceCO2
ReleasedCO2
Released$/tpd tpd CO2/car tpd CO2/tpd
- - -
Location 3 (High)Total Capital
CostAnnual O&M
CostAnnual Fuel
CostCO2
ReleasedEnergy Needs
$/tpd at location
$/tpd at locations
$/tpd at locations tpd CO2/tpd MWh/tpd
- - - - -
Location 3 (High)Total Capital
CostAnnual O&M
CostAnnual Fuel
CostCO2
ReleasedEnergy Needs
$/MWe at location
$/MWe at locations
$/MWe at locations
tpd CO2/MWe MWe/MWe
- - - - -
Page 3 24/10/2003 14:55
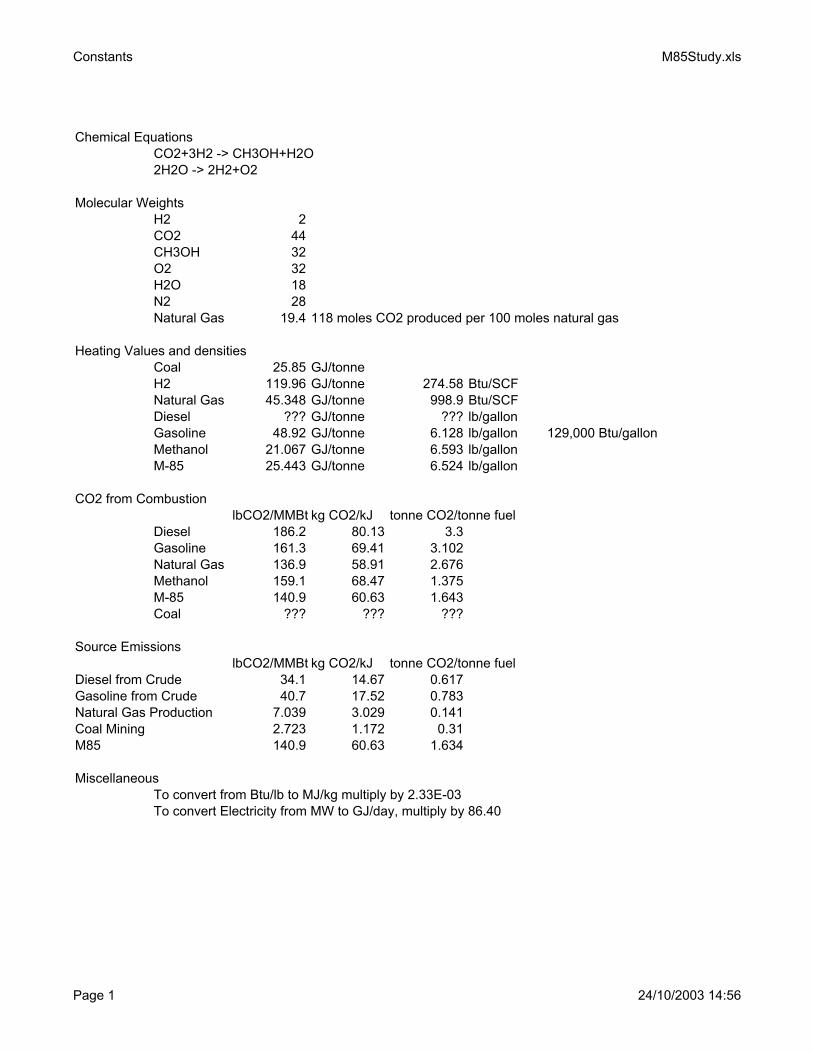
Constants M85Study.xls
Chemical EquationsCO2+3H2 -> CH3OH+H2O2H2O -> 2H2+O2
Molecular WeightsH2 2CO2 44CH3OH 32O2 32H2O 18N2 28Natural Gas 19.4 118 moles CO2 produced per 100 moles natural gas
Heating Values and densitiesCoal 25.85 GJ/tonneH2 119.96 GJ/tonne 274.58 Btu/SCFNatural Gas 45.348 GJ/tonne 998.9 Btu/SCFDiesel ??? GJ/tonne ??? lb/gallonGasoline 48.92 GJ/tonne 6.128 lb/gallon 129,000 Btu/gallonMethanol 21.067 GJ/tonne 6.593 lb/gallonM-85 25.443 GJ/tonne 6.524 lb/gallon
CO2 from CombustionlbCO2/MMBt kg CO2/kJ tonne CO2/tonne fuel
Diesel 186.2 80.13 3.3Gasoline 161.3 69.41 3.102Natural Gas 136.9 58.91 2.676Methanol 159.1 68.47 1.375M-85 140.9 60.63 1.643Coal ??? ??? ???
Source EmissionslbCO2/MMBt kg CO2/kJ tonne CO2/tonne fuel
Diesel from Crude 34.1 14.67 0.617Gasoline from Crude 40.7 17.52 0.783Natural Gas Production 7.039 3.029 0.141Coal Mining 2.723 1.172 0.31M85 140.9 60.63 1.634
MiscellaneousTo convert from Btu/lb to MJ/kg multiply by 2.33E-03To convert Electricity from MW to GJ/day, multiply by 86.40
Page 1 24/10/2003 14:56
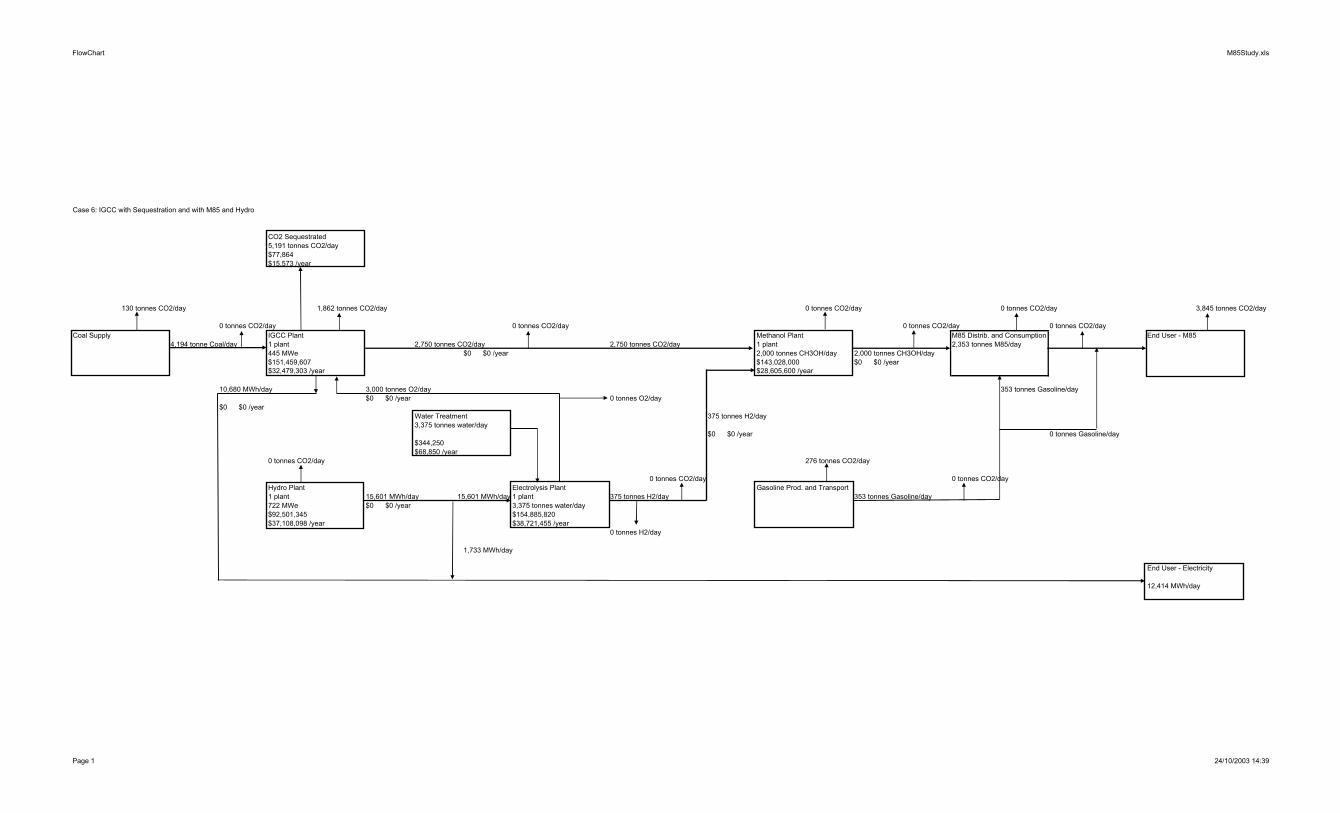
FlowChart M85Study.xls
Case 6: IGCC with Sequestration and with M85 and Hydro
CO2 Sequestrated5,191 tonnes CO2/day$77,864 $15,573 /year
130 tonnes CO2/day 1,862 tonnes CO2/day 0 tonnes CO2/day 0 tonnes CO2/day 3,845 tonnes CO2/day
0 tonnes CO2/day 0 tonnes CO2/day 0 tonnes CO2/day 0 tonnes CO2/dayCoal Supply IGCC Plant Methanol Plant M85 Distrib. and Consumption End User - M85
4,194 tonne Coal/day 1 plant 2,750 tonnes CO2/day 2,750 tonnes CO2/day 1 plant 2,353 tonnes M85/day445 MWe $0 $0 /year 2,000 tonnes CH3OH/day 2,000 tonnes CH3OH/day$151,459,607 $143,028,000 $0 $0 /year$32,479,303 /year $28,605,600 /year
10,680 MWh/day 3,000 tonnes O2/day 353 tonnes Gasoline/day$0 $0 /year 0 tonnes O2/day
$0 $0 /yearWater Treatment 375 tonnes H2/day3,375 tonnes water/day
$0 $0 /year 0 tonnes Gasoline/day$344,250 $68,850 /year
0 tonnes CO2/day 276 tonnes CO2/day
0 tonnes CO2/day 0 tonnes CO2/dayHydro Plant Electrolysis Plant Gasoline Prod. and Transport1 plant 15,601 MWh/day 15,601 MWh/day 1 plant 375 tonnes H2/day 353 tonnes Gasoline/day722 MWe $0 $0 /year 3,375 tonnes water/day$92,501,345 $154,885,820 $37,108,098 /year $38,721,455 /year
0 tonnes H2/day
1,733 MWh/day
End User - Electricity
12,414 MWh/day
Page 1 24/10/2003 14:39
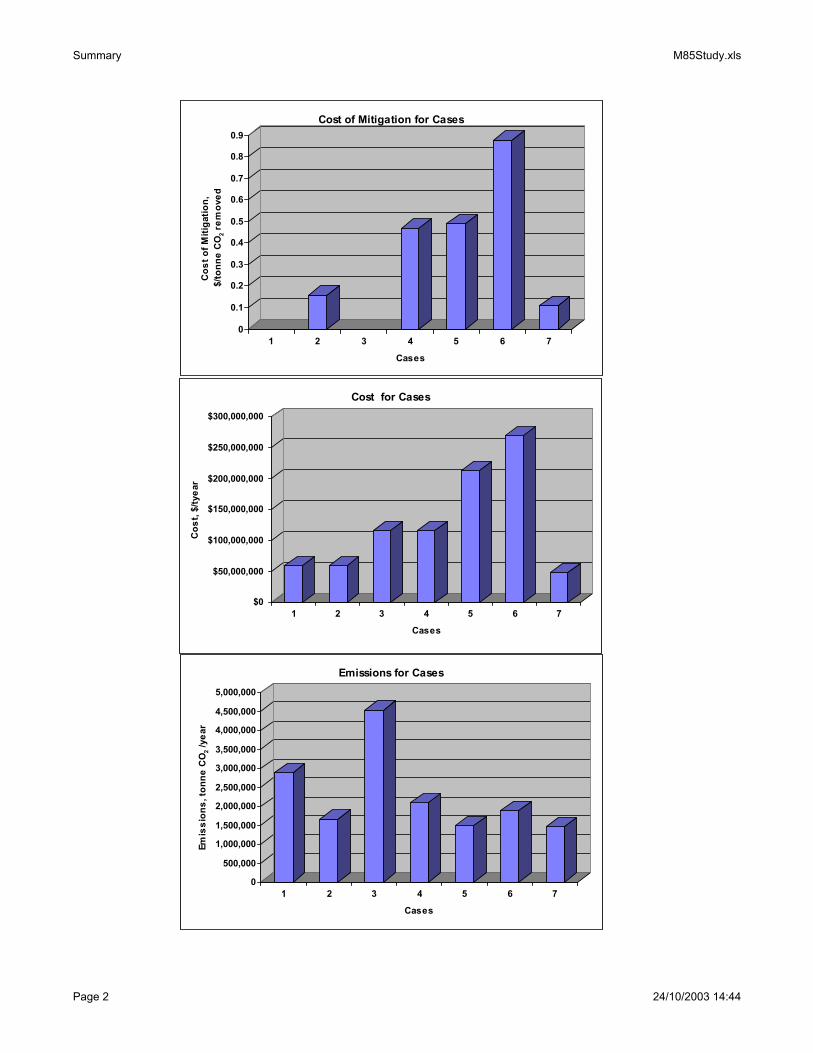
Summary M85Study.xls
0
0.1
0.2
0.3
0.4
0.5
0.6
0.7
0.8
0.9
Cos
t of M
itiga
tion,
$/to
nne
CO
2 rem
oved
1 2 3 4 5 6 7
Cases
Cost of Mitigation for Cases
$0
$50,000,000
$100,000,000
$150,000,000
$200,000,000
$250,000,000
$300,000,000
Cos
t, $/
tyea
r
1 2 3 4 5 6 7
Cases
Cost for Cases
0
500,000
1,000,000
1,500,000
2,000,000
2,500,000
3,000,000
3,500,000
4,000,000
4,500,000
5,000,000
Emis
sion
s, to
nne
CO
2 /ye
ar
1 2 3 4 5 6 7
Cases
Emissions for Cases
Page 2 24/10/2003 14:44
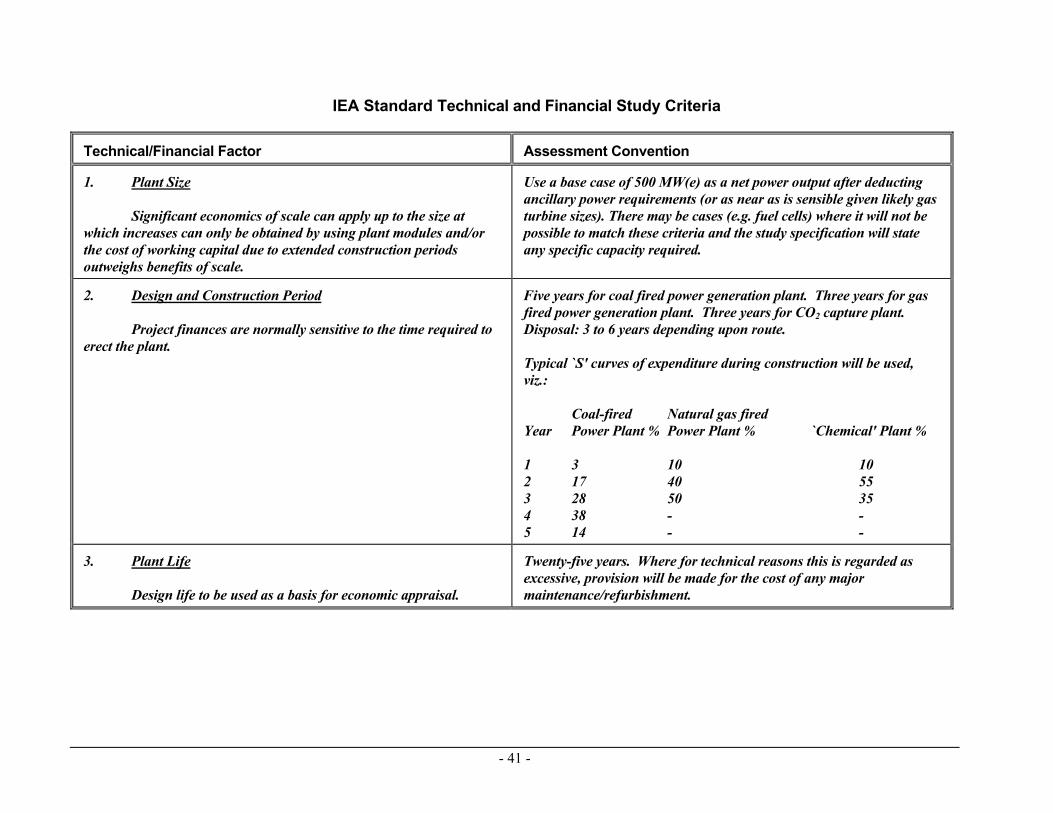
IEA Standard Technical and Financial Study Criteria
Technical/Financial Factor Assessment Convention
1. Plant Size Significant economics of scale can apply up to the size at which increases can only be obtained by using plant modules and/or the cost of working capital due to extended construction periods outweighs benefits of scale.
Use a base case of 500 MW(e) as a net power output after deducting ancillary power requirements (or as near as is sensible given likely gas turbine sizes). There may be cases (e.g. fuel cells) where it will not be possible to match these criteria and the study specification will state any specific capacity required.
2. Design and Construction Period Project finances are normally sensitive to the time required to erect the plant.
Five years for coal fired power generation plant. Three years for gas fired power generation plant. Three years for CO2 capture plant. Disposal: 3 to 6 years depending upon route. Typical `S' curves of expenditure during construction will be used, viz.: Coal-fired Natural gas fired Year Power Plant % Power Plant % `Chemical' Plant % 1 3 10 10 2 17 40 55 3 28 50 35 4 38 - - 5 14 - -
3. Plant Life Design life to be used as a basis for economic appraisal.
Twenty-five years. Where for technical reasons this is regarded as excessive, provision will be made for the cost of any major maintenance/refurbishment.
- 41 -
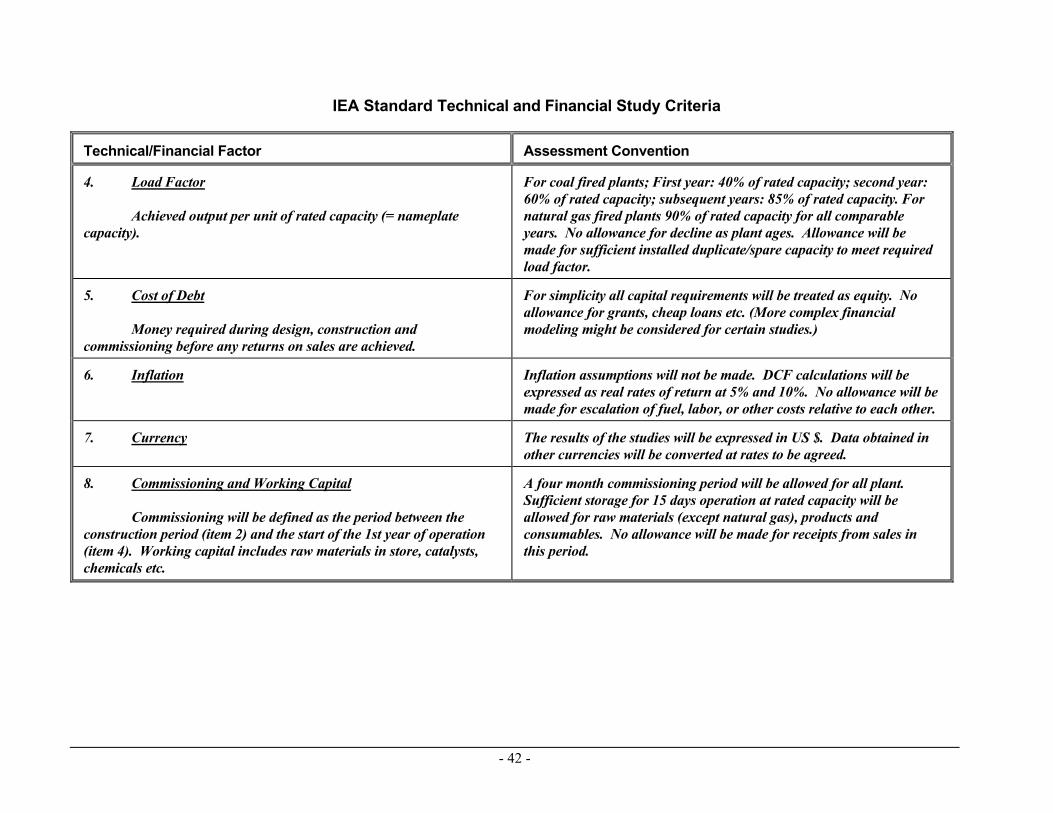
IEA Standard Technical and Financial Study Criteria
Technical/Financial Factor Assessment Convention
4. Load Factor Achieved output per unit of rated capacity (= nameplate capacity).
For coal fired plants; First year: 40% of rated capacity; second year: 60% of rated capacity; subsequent years: 85% of rated capacity. For natural gas fired plants 90% of rated capacity for all comparable years. No allowance for decline as plant ages. Allowance will be made for sufficient installed duplicate/spare capacity to meet required load factor.
5. Cost of Debt Money required during design, construction and commissioning before any returns on sales are achieved.
For simplicity all capital requirements will be treated as equity. No allowance for grants, cheap loans etc. (More complex financial modeling might be considered for certain studies.)
6. Inflation Inflation assumptions will not be made. DCF calculations will be expressed as real rates of return at 5% and 10%. No allowance will be made for escalation of fuel, labor, or other costs relative to each other.
7. Currency The results of the studies will be expressed in US $. Data obtained in other currencies will be converted at rates to be agreed.
8. Commissioning and Working Capital Commissioning will be defined as the period between the construction period (item 2) and the start of the 1st year of operation (item 4). Working capital includes raw materials in store, catalysts, chemicals etc.
A four month commissioning period will be allowed for all plant. Sufficient storage for 15 days operation at rated capacity will be allowed for raw materials (except natural gas), products and consumables. No allowance will be made for receipts from sales in this period.
- 42 -
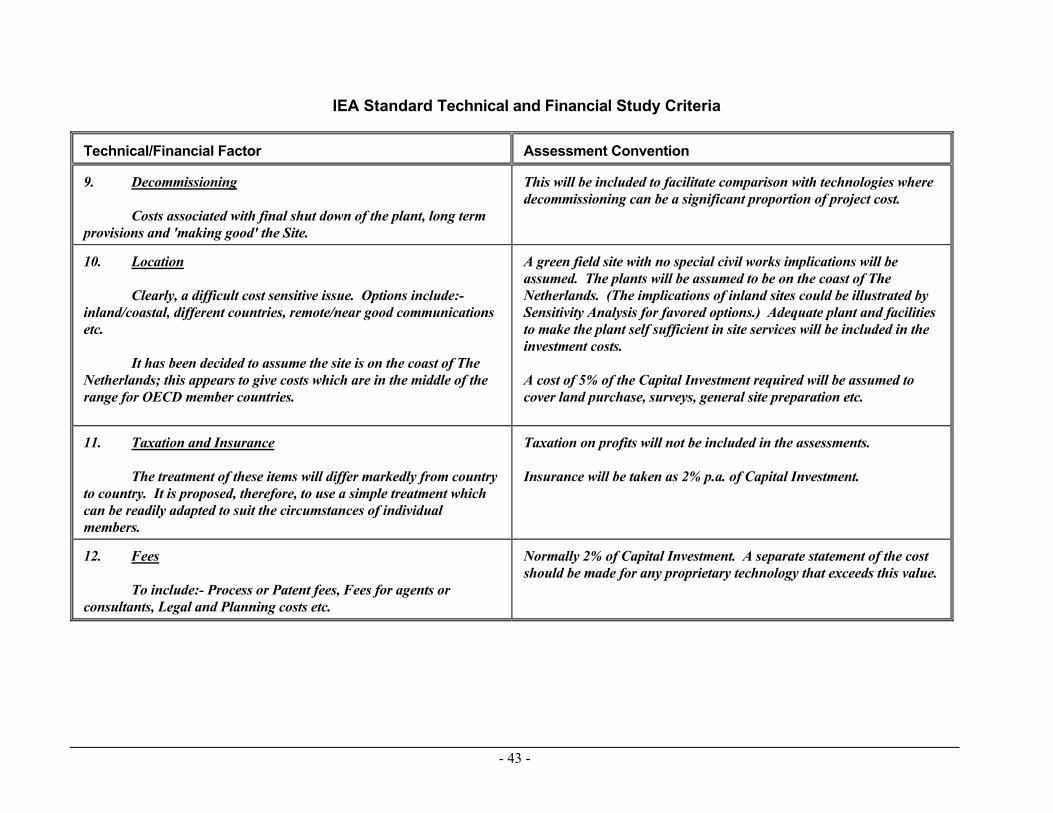
IEA Standard Technical and Financial Study Criteria
Technical/Financial Factor Assessment Convention
9. Decommissioning Costs associated with final shut down of the plant, long term provisions and 'making good' the Site.
This will be included to facilitate comparison with technologies where decommissioning can be a significant proportion of project cost.
10. Location Clearly, a difficult cost sensitive issue. Options include:- inland/coastal, different countries, remote/near good communications etc. It has been decided to assume the site is on the coast of The Netherlands; this appears to give costs which are in the middle of the range for OECD member countries.
A green field site with no special civil works implications will be assumed. The plants will be assumed to be on the coast of The Netherlands. (The implications of inland sites could be illustrated by Sensitivity Analysis for favored options.) Adequate plant and facilities to make the plant self sufficient in site services will be included in the investment costs. A cost of 5% of the Capital Investment required will be assumed to cover land purchase, surveys, general site preparation etc.
11. Taxation and Insurance The treatment of these items will differ markedly from country to country. It is proposed, therefore, to use a simple treatment which can be readily adapted to suit the circumstances of individual members.
Taxation on profits will not be included in the assessments. Insurance will be taken as 2% p.a. of Capital Investment.
12. Fees To include:- Process or Patent fees, Fees for agents or consultants, Legal and Planning costs etc.
Normally 2% of Capital Investment. A separate statement of the cost should be made for any proprietary technology that exceeds this value.
- 43 -
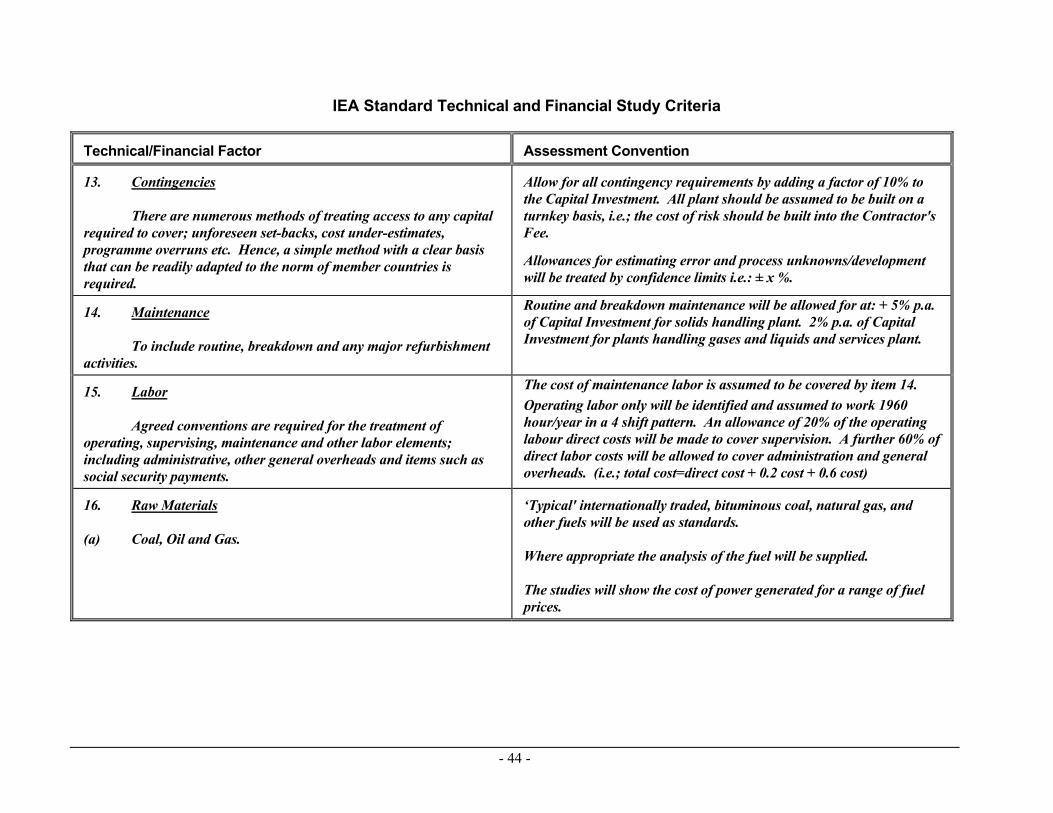
IEA Standard Technical and Financial Study Criteria
Technical/Financial Factor Assessment Convention
13. Contingencies There are numerous methods of treating access to any capital required to cover; unforeseen set-backs, cost under-estimates, programme overruns etc. Hence, a simple method with a clear basis that can be readily adapted to the norm of member countries is required.
Allow for all contingency requirements by adding a factor of 10% to the Capital Investment. All plant should be assumed to be built on a turnkey basis, i.e.; the cost of risk should be built into the Contractor's Fee.
Allowances for estimating error and process unknowns/development will be treated by confidence limits i.e.: ± x %.
14. Maintenance To include routine, breakdown and any major refurbishment activities.
Routine and breakdown maintenance will be allowed for at: + 5% p.a. of Capital Investment for solids handling plant. 2% p.a. of Capital Investment for plants handling gases and liquids and services plant.
15. Labor Agreed conventions are required for the treatment of operating, supervising, maintenance and other labor elements; including administrative, other general overheads and items such as social security payments.
The cost of maintenance labor is assumed to be covered by item 14. Operating labor only will be identified and assumed to work 1960 hour/year in a 4 shift pattern. An allowance of 20% of the operating labour direct costs will be made to cover supervision. A further 60% of direct labor costs will be allowed to cover administration and general overheads. (i.e.; total cost=direct cost + 0.2 cost + 0.6 cost)
16. Raw Materials (a) Coal, Oil and Gas.
‘Typical' internationally traded, bituminous coal, natural gas, and other fuels will be used as standards. Where appropriate the analysis of the fuel will be supplied. The studies will show the cost of power generated for a range of fuel prices.
- 44 -
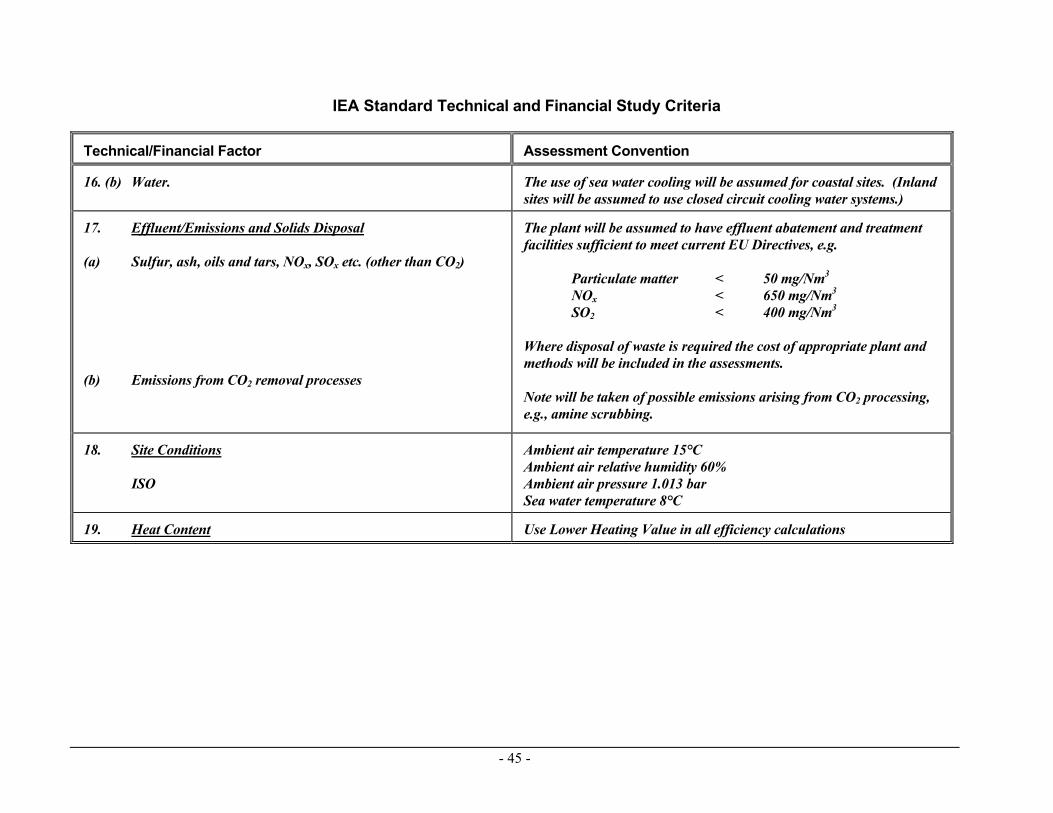
- 45 -
IEA Standard Technical and Financial Study Criteria
Technical/Financial Factor Assessment Convention
16. (b) Water. The use of sea water cooling will be assumed for coastal sites. (Inland sites will be assumed to use closed circuit cooling water systems.)
17. Effluent/Emissions and Solids Disposal (a) Sulfur, ash, oils and tars, NOx, SOx etc. (other than CO2) (b) Emissions from CO2 removal processes
The plant will be assumed to have effluent abatement and treatment facilities sufficient to meet current EU Directives, e.g. Particulate matter < 50 mg/Nm3 NOx < 650 mg/Nm3 SO2 < 400 mg/Nm3 Where disposal of waste is required the cost of appropriate plant and methods will be included in the assessments. Note will be taken of possible emissions arising from CO2 processing, e.g., amine scrubbing.
18. Site Conditions ISO
Ambient air temperature 15°C Ambient air relative humidity 60% Ambient air pressure 1.013 bar Sea water temperature 8°C
19. Heat Content Use Lower Heating Value in all efficiency calculations